Article

Identification of Flavonoid 3′-Hydroxylase Genes from Red Chinese Sand Pear (Pyrus pyrifolia Nakai) and Their Regulation of Anthocyanin Accumulation in Fruit Peel

1
College of Agriculture and Biotechnology, Zhejiang University, Hangzhou 310058, China
2
School of Breeding and Multiplication (Sanya Institute of Breeding and Multiplication), Hainan University, Sanya 572025, China
*
Authors to whom correspondence should be addressed.
Horticulturae 2024, 10(6), 535; https://doi.org/10.3390/horticulturae10060535
Submission received: 2 April 2024 / Revised: 11 May 2024 / Accepted: 20 May 2024 / Published: 21 May 2024
(This article belongs to the Section Genetics, Genomics, Breeding, and Biotechnology (G2B2))

Abstract

:
The red Chinese sand pear (Pyrus pyrifolia Nakai) is native to China and exhibits a unique fruit coloration pattern. Flavonoid 3′-hydroxylase (F3′H) catalyzes the hydroxylation of flavonoids, which subsequently determines the components of anthocyanins and the color of plant organs. Two genes encoding flavonoid 3′-hydroxylase (F3′H), PpF3′HI and PpF3′HII, have been identified in red Chinese sand pears. The coding regions for PpF3′HI and PpF3′HII were 1542 and 1536 bp in length, respectively. PpF3′HI shared 95% of its amino acid sequence identity with PpF3′HII, and a highly conserved P450 superfamily domain was found both in PpF3′HI and in PpF3′HII. Phylogenetic analysis showed that PpF3′HI and PpF3′HII clustered with MdF3′HI and MdF3′HII, respectively. PpF3′H genes were highly expressed in anthocyanin-enriched tissues such as young leaves, and transcription of PpF3′H genes corresponded to anthocyanin biosynthesis during the developmental stages, bagging treatment, and postharvest UV-B/visible irradiation treatment. A Y1H assay showed that PpMYB10 and PpHY5 could interact with the −419 bp to 0 bp and −746 bp to −396 bp fragments of the PpF3′HI promoter region, respectively. Understanding the mechanism of flavonoid hydroxylation patterns will, in turn, promote the development of new technologies for modifying flavonoid and anthocyanin composition in fruits.

1. Introduction

Pears are common, temperate fruits grown throughout the world. Fruit color is one of the most important commercial traits of pear fruit, and red-skinned fruits are generally preferred. The red color of pear fruit skin is known to be caused by the deposition of anthocyanins [1].
The accumulation of anthocyanins in pears differs notably from that observed in other prominent fruit species such as grapes and apples. In grapes, anthocyanin accumulation initiates post-veraison, leading to a transition in skin color from green to red [2]. Conversely, apples exhibit dual peaks in anthocyanin concentration during development; initially, the fruitlet displays a red hue followed by a loss of red coloration before anthocyanin levels rise again and reach a peak at maturity [3]. Divergent pigmentation patterns characterize the fruit of the following two primary commercial pear varieties: Chinese sand pears and European pears (Pyrus communis L.). Unlike red Chinese sand pears, where anthocyanin accumulation peaks in mature fruit, European pears reach their highest anthocyanin levels approximately midway between anthesis and harvest [3]. Furthermore, Chinese sand pears and European pears exhibit differential responses to light exposure. Chinese sand pears develop a red coloration (indicative of anthocyanin accumulation) upon removal from fruit bags or 10 days after postharvest irradiation commences, whereas European pears show a minimal anthocyanin presence [4]. This distinctive pigmentation pattern renders Chinese sand pears as well-suited for studies of the molecular mechanisms underlying anthocyanin accumulation in fruits.
The biosynthetic pathway of anthocyanins has been well-established in diverse plant species such as petunia, snapdragon, and maize [5,6,7]. The pathway starts with the condensation of malonyl-CoA and 4-coumaroyl-CoA, catalyzed by the enzyme chalcone synthase (CHS). The resulting naringenin chalcone is then isomerized by chalcone favanone isomerase (CHI) to naringenin, which is hydroxylated at the 3′ position of the central ring to dihydrokaempferol (DHK) in the presence of flavanone 3-hydroxylase (F3H). The further hydroxylation pattern of DHK is mainly responsible for skin color. The B-ring of DHK can be hydroxylated either at the 3′ position or at both the 3′ and 5′ positions to form dihydroquercetin (DHQ) and dihydromyricetin (DHM), which ultimately lead to the production of cyanidin-based and delphinidin-based pigments, respectively [5].
Flavonoid 3′-hydroxylase (F3′H) and flavonoid 3′,5′-hydroxylase (F3′5′H) represent the two enzymes accountable for determining the hydroxylation pattern. These microsomal cytochrome P450-dependent monooxygenases utilize NADPH as a co-factor [8]. F3′H and F3′5′H enable hydroxylation at the 3′ position or both the 3′ and 5′ positions of the B-ring of the flavonoid molecule. As a result, this process yields 3′,4′- and 3′,4′,5′-hydroxylated flavonoids, respectively. Certain plant species, like grapevine [9] and Asteraceae [10], possess both F3′H and F3′5′H enzymes, while others, such as Arabidopsis, apple, and rose [8], exclusively feature functional F3′H enzymes.
Genes responsible for encoding F3′H and/or F3′5′H have been discovered in various plant species, including Arabidopsis [11], petunia [12], grapevine [9], and apple [13]. In the grapevine species, the expression of VvF3′H and VvF3′5′H increased post-veraison, correlating with the accumulation of 3′- and 3′,5′-hydroxylated anthocyanins. Additionally, ectopic expression of VvF3′H and VvF3′5′H in petunia resulted in altered flower color and flavonoid composition [9]. The ectopic expression of apple F3’H genes in the Arabidopsis tt7 mutant contributed to anthocyanin accumulation in plants grown under nitrogen stress conditions [13]. Flavonoid hydroxylase determines the orientation of the flavonoid pathway and the anthocyanin component, as apple F3′H and grape F3′H and F3′5′H distinguish both the anthocyanin component and fruit coloration pattern in these two species [9,13]. However, the cloning and identification of pear F3′H and F3′5′H genes have not been reported despite the good understanding of the other structural and regulatory genes involved in anthocyanin biosynthesis [14]. It needs to be clarified whether both functional F3′H and F3′5′H exist in pears, and whether F3′H and/or F3′5′H are involved in the distinctive coloration pattern of the red Chinese sand pear.
The transcription of the structural genes involved in anthocyanin biosynthesis is regulated by several transcription factors, such as MYB10 and HY5. MYB10 is a key transcription factor in controlling anthocyanin biosynthesis in various fruit species, including apple [15,16], grape [17,18], pear [14,19], strawberry [20], lychee [21], and Chinese bayberry [22], mainly by regulating the expression of structural genes of anthocyanin biosynthesis, including CHS [23], DFR [22,24], and UFGT [19]. ELONGATED HYPOCOTYL 5 (HY5) is a light-responsive transcription factor that mediates light-induced photomorphogenesis, as well as light-induced anthocyanin accumulation, by binding to the G-box of the gene promoter region and regulating the expression of genes such as CHS [25,26], DFR [25], and MYB10 [27]. Little is known about whether MYB10 and HY5 can bind to the promoter region of F3′H or F3′5′H, and such a finding could be used as evidence that these two transcription factors also regulate anthocyanin biosynthesis through the hydroxylation step.
Two pear F3′H genes (no F3′5′H genes were found from the pear genome database) were isolated in the present study in order to understand the hydroxylation pattern of flavonoids in pears, as well as the regulatory roles of F3′H or F3′5′H genes during anthocyanin biosynthesis in fruit. More importantly, the relevance of these genes to the distinctive coloration pattern of pears was investigated. The expression patterns of these genes were also analyzed in different tissues, during different developmental stages, and during red peel coloration in response to light treatment. In addition, to study the transcriptional regulation of F3′H by transcription factors (TFs), the yeast one-hybrid (Y1H) assay and dual-luciferase assay were used to analyze the interaction between F3′H and PpMYB10 and PpHY5. For future endeavors aiming to engineer flavonoid composition in fruit and manipulate anthocyanin biosynthesis in pears, along with other plant species, could hold significant relevance.

2. Materials and Methods

2.1. Plant Materials and Experimental Treatments

The cultivar ‘Mantianhong’ of the red Chinese sand pear and the early-maturing cultivar ‘Zaobaimi’ of the white pear were both sourced from the Zhengzhou Fruit Research Institute, which is located in Zhengzhou City, Henan Province, China, and is affiliated with the Chinese Academy of Agricultural Sciences.
To evaluate the tissue-specific expression patterns of cloned genes, samples were collected from various tissues at different stages of plant growth. We chose three specimens of both the ‘Mantianhong’ and ‘Zaobaimi’ cultivars. Specifically, young leaves and young stems as well as older leaves were harvested at the time of anthesis. Three biological replicates were set up, and each biological replicate included one tree, with three young leaves, three old leaves, and three young stems taken at the four points on each tree. Each biological replicate contained twelve samples. Additionally, flesh was excised from fully mature fruits for further analysis. Three fully ripe fruits were taken at each of the four points of each tree. Three biological replicates were set up, and each biological replicate contained twelve fruits.
To investigate gene expression patterns across developmental stages, we chose three mature specimens of both the ‘Mantianhong’ and ‘Zaobaimi’ cultivars. These trees exhibited comparable sizes and fruit yields, and have consistent exposure to sunlight. Samples of fruit peel exposed to sunlight were collected from ‘Zaobaimi’ trees at 5, 10, 15, and 18 weeks after full bloom (WAFB). Similarly, samples from ‘Mantianhong’ trees were gathered at 5, 10, 15, 18, and 22 WAFB. In each period, three different large branches were selected for each tree, three fruits were selected on each large branch, and three biological replicates were set up, each including nine fruits. By comparing these samples, we aimed to gain insights into the temporal regulation of gene expression in these cultivars.
Three mature ‘Mantianhong’ trees were chosen for the fruit bagging experiment. Ninety fruitlets from each tree were enclosed in double layers of yellow–black paper bags sourced from Kobayashi (Qingdao) Co., Ltd., Qingdao, China, 20 days following full bloom. Subsequently, 20 days prior to harvest, the bags were removed, allowing the fruits to be re-exposed to sunlight. The remaining unbagged fruits served as the control group. Samples of fruit peel were collected at 0, 2, 7, 14, and 20 days after bag removal (DABR) for analysis. Six bagged and unbagged fruits were taken from each tree at each time point. Three biological replicates were set up for each group, and each biological replicate included six fruits.
Briefly, three comparable ‘Mantianhong’ trees were selected for the postharvest irradiation experiment. Each tree contributed ninety mature fruits to the bagging treatment discussed earlier, which were subsequently shielded from light. Following this, two hundred fruits, uniform in size and free from defects, were randomly assigned from each variety to two groups. The subsequent illumination treatment is consistent with the published method [4]. Briefly, one set is used for UV-B/visible light irradiation and the other set is kept in a dark environment as a control. Samples were gathered for analysis at intervals of 0, 2, 5, 8, and 10 days following the initiation of irradiation (DI). Three replicates were set up for each sampling group, and each replicate included fifteen fruits.
Immediately after sampling, all plant tissues were promptly frozen in liquid nitrogen and subsequently stored at −80 °C for the purposes of anthocyanin extraction, gene cloning, and gene expression analysis. The weight of each collected sample was approximately 10 g. This procedure ensures the preservation of tissue integrity and enables accurate scientific analysis.

2.2. Research Methodology

2.2.1. Extraction of RNA and Synthesis of Complementary DNA (cDNA)

The total RNA was isolated following a modified CTAB protocol [4]. After removing genomic DNA from the RNA sample through DNase I treatment, we assessed RNA purity and integrity. This assessment involved examining the A260/A280 absorbance ratio and visually inspecting a 1.0% agarose gel. Subsequently, we measured the purified RNA concentration using A260 absorbance. For first-strand cDNA synthesis, we utilized 4 µg of DNA-free RNA alongside the Revert AidTM First-Strand cDNA Synthesis Kit (Fermentas, Glen Burnie, MD, USA). The resulting cDNA was diluted 10-fold, with 2 μL aliquots serving as templates for both gene cloning and real-time quantitative PCR analysis.

2.2.2. Isolation and Analysis of Gene Sequences

Degenerate primers, aligned with plant sequences sourced from public databases (http://www.ncbi.nlm.nih.gov/Genbank/index.html, (accessed on 21 March 2024)), were employed to isolate concise and conserved fragments of F3′H genes via PCR from the peel of ‘Mantianhong’ pears. Following this, the 3′ untranslated regions (UTRs) of potential sequences were acquired using rapid amplification of cDNA ends (RACE) with the SMARTTM RACE cDNA amplification Kit (Takara, Dalian, China). Amplification of the 5′ ends of the genes was performed according to the 5′-RACE kit (Takara, Japan) protocol. After acquiring sequence data through RACE, new primer sets tailored to these data were utilized to amplify full-length cDNAs. Detailed information regarding all primers employed in this investigation is provided in Supplementary Table S1. Nucleotide and deduced amino acid sequence comparisons were performed utilizing online alignment search programs (BLAST), accessible at http://blast.ncbi.nlm.nih.gov/Blast.cgi (accessed on 21 March 2024). Alignment of sequences was executed using the DNAman software package (Version 5.2.2, Lynnon Biosoft, San Ramon, CA, USA). Conserved domain searches were conducted using the conserved domain database available at the National Center for Biotechnology Information (http://www.ncbi.nlm.nih.gov/Structure/cdd/wrpsb.cgi, (accessed on 21 March 2024)). The construction of phylogenetic trees was accomplished utilizing the neighbor-joining method implemented in the MEGA 11 program [28]. The bootstrap test was replicated 1000 times to ensure the robustness of the tree topology. Neighbor-joining trees were employed with the joining method. The replacement model was the Poisson model.

2.2.3. Extraction and Measurement of Total Anthocyanin

The experiments were conducted using previously published methods [23]. Briefly, one gram of fruit peel was mixed with methanol containing 0.01% HCl, followed by centrifugation at 12,000 revolutions per minute for 20 min at 4 °C. Spectrophotometric analysis was performed using a DU800 spectrophotometer (Beckman Coulter, Fullerton, CA, USA) to measure absorbance at 510 nm and 700 nm in buffers kept at pH 1.0 and 4.5, correspondingly.

2.2.4. Real-Time Quantitative PCR (Q-PCR)

The experiments were conducted using previously published methods [23]. The Q-PCR primers detailed in Supplementary Table S1 were designed utilizing the primer 3 software (http://bioinfo.ut.ee/primer3-0.4.0/, (accessed on 21 March 2024)). Normalization of all Q-PCR reactions was achieved using the Ct value corresponding to the actin gene (PpActin, JN684184). To ensure reproducibility and accuracy, three biological replicates were employed, and each replicate was subjected to three independent measurements.

2.2.5. Yeast One-Hybrid (Y1H) Assay

For the Y1H assays, we employed the Matchmaker Gold Yeast One-Hybrid System Kit from Clontech, following the manufacturer’s instructions meticulously. The promoter fragments of PpF3′HI and the entire coding sequences of PpMYB10 and PpHY5 were inserted into the pAbAi and pGADT7 vectors, respectively, resulting in the creation of the pAbAi-bait plasmid and the AD-PpMYB10 and AD-PpHY5 constructs. The primers employed for cloning the PpF3′HI promoter and the coding regions of PpMYB10 and PpHY5 are detailed in Supplementary Table S1.

2.2.6. Dual-Luciferase Assay

The pGreenII 0029 62-SK vector (gene-SK) housed the full-length CDSs of PpMYB10 and PpHY5, while the pGreenII 0800-LUC vector (promoter-LUC) hosted the promoter sequence of PpF3′HI. These constructs underwent transformation into A. tumefaciens strain GV3101 cells containing the pSoup vector. Analysis of firefly luciferase and Renilla luciferase activities occurred 60 hours post-infiltration, utilizing the Dual-Luciferase Reporter Assay System (Promega, Madison, WI, USA) and the GloMax96 Microplate Luminometer (Promega). Three independent experiments, each with six biological replicates, were conducted to assess relative luciferase activities.

2.2.7. Statistical Analysis

The mean separations were analyzed using the Data Processing System (DPS, version 3.01, Zhejiang University, Hangzhou, China), and the least significant differences (LSDs) were computed at a significance level of α = 0.05.

3. Results

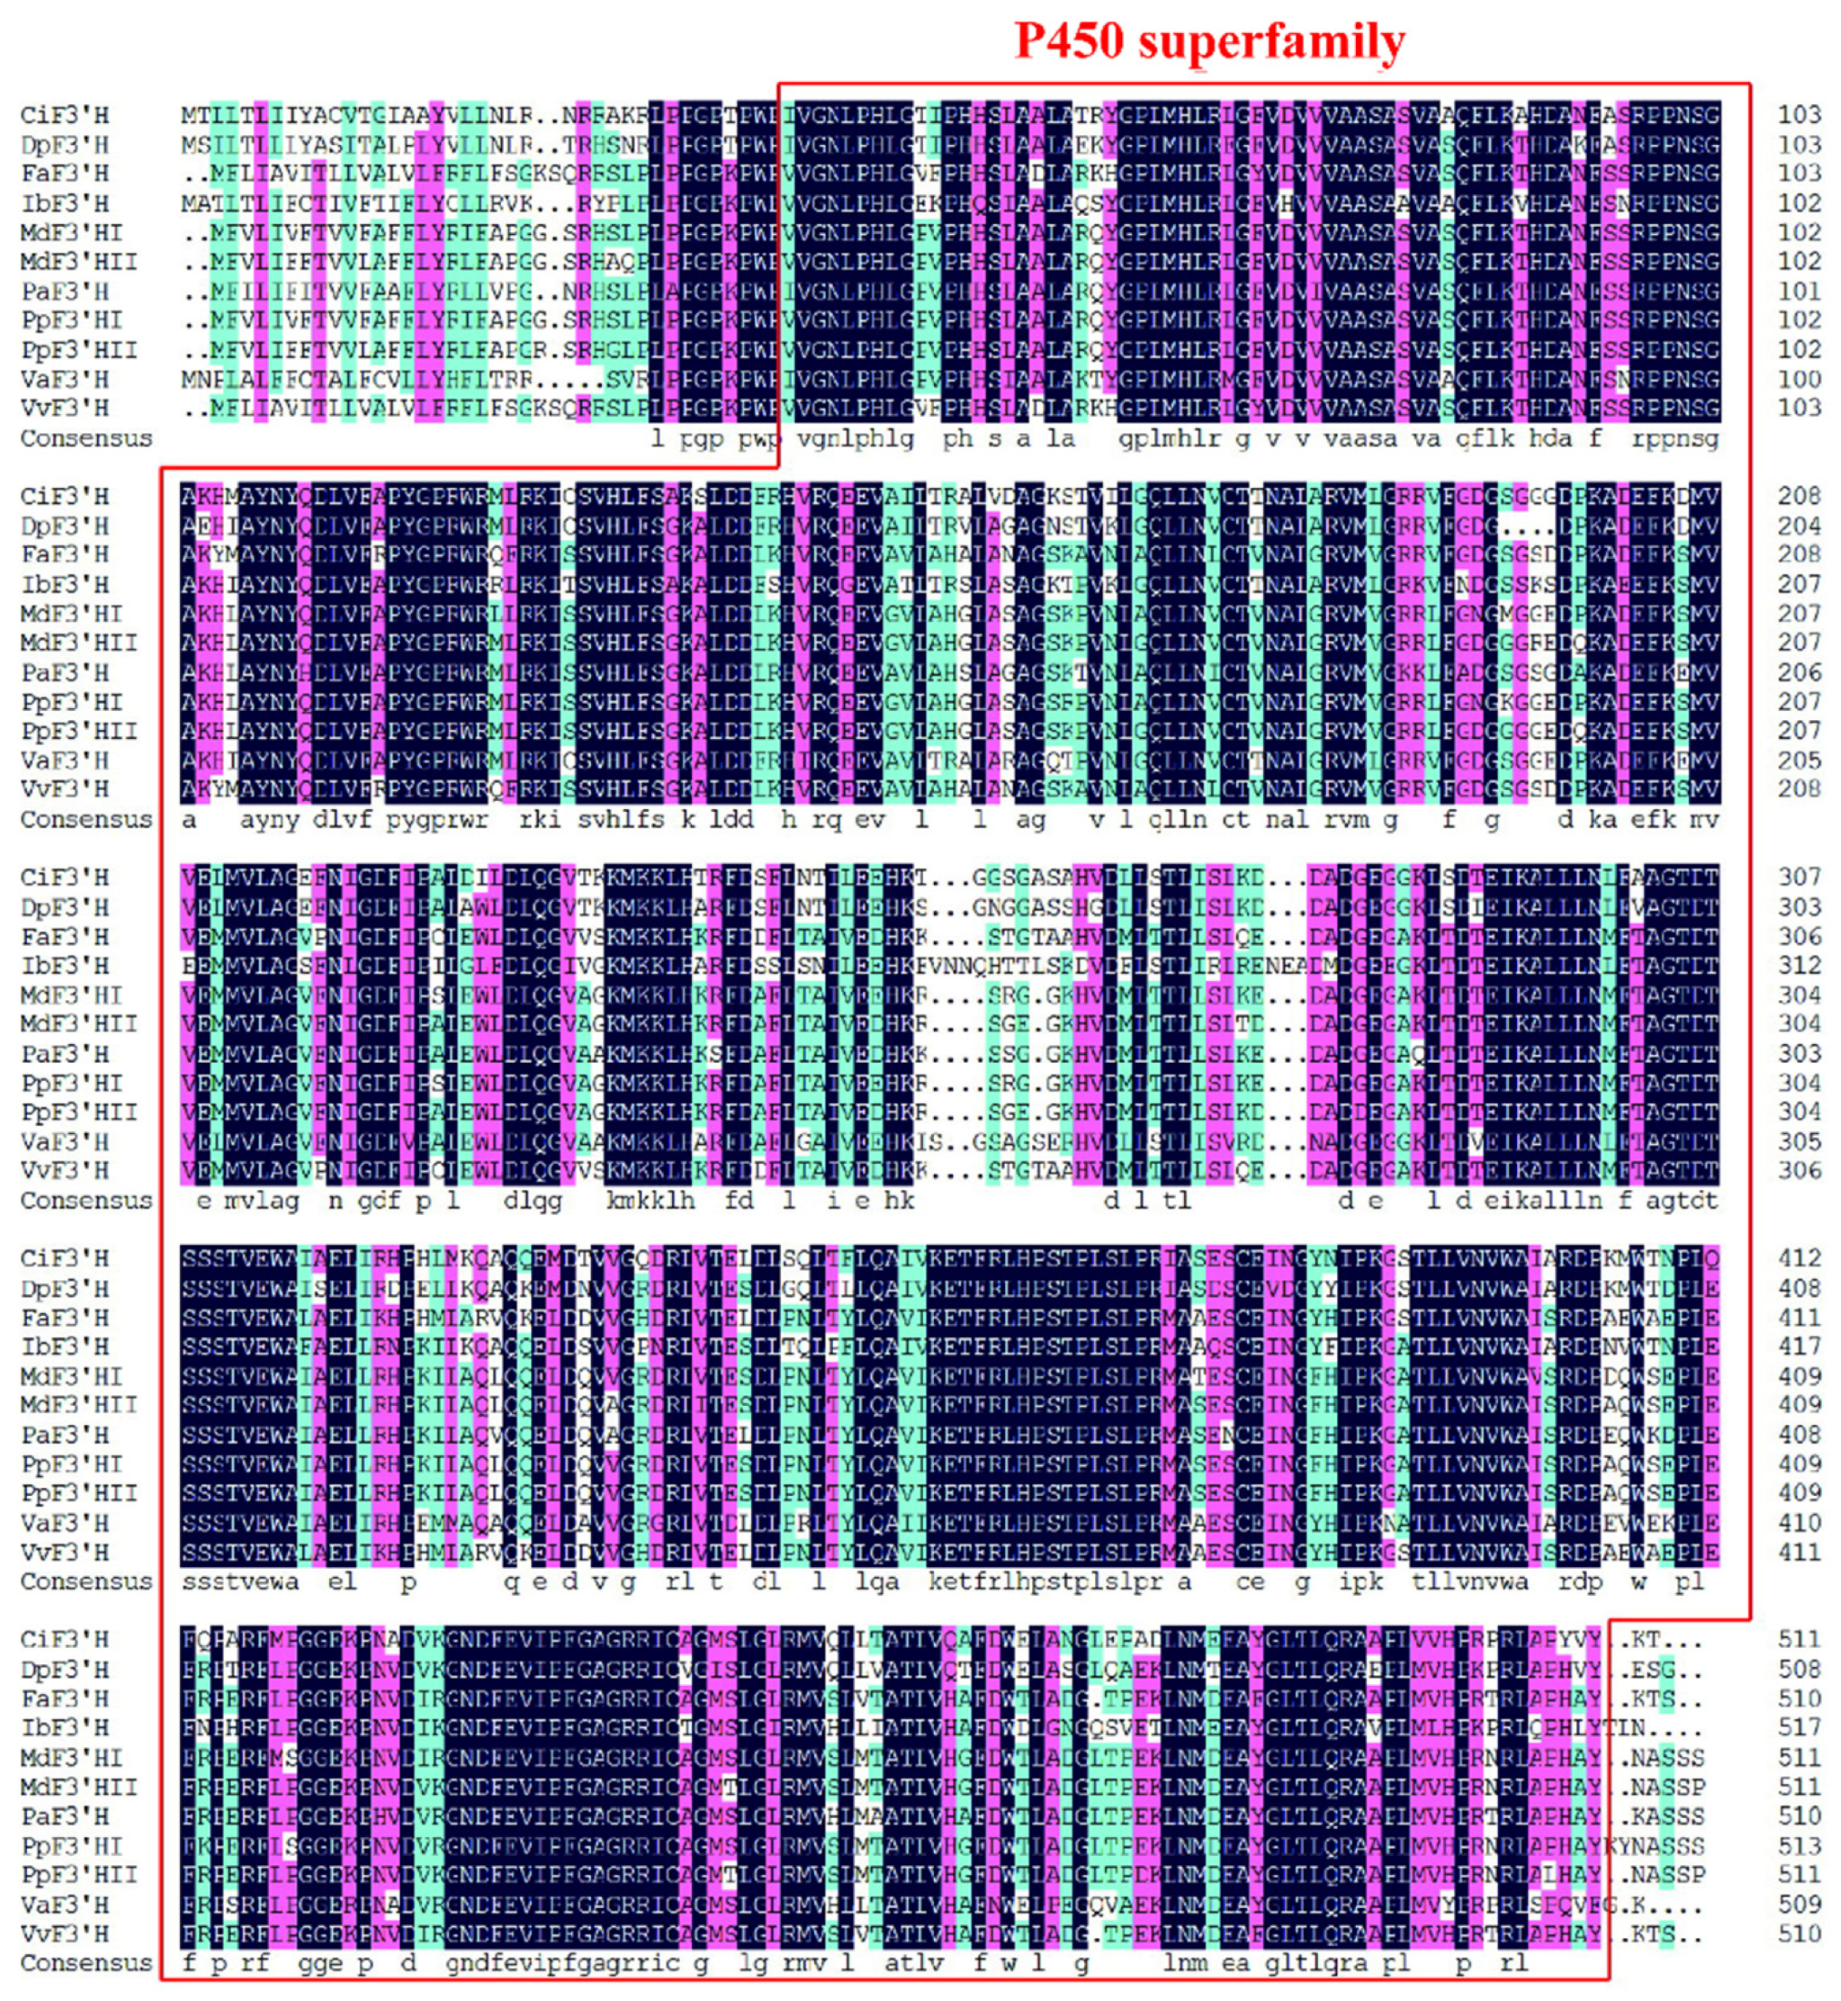
3.1. Isolation and Sequence Analysis of Pear PpF3′H Genes

Two cDNAs containing the complete coding region, PpF3′HI (GenBank accession no. MF614141) and PpF3′HII (GenBank accession no. MF614142), were isolated from the red Chinese sand pear cv. ‘Mantianhong’. The coding sequence of PpF3′HI spans 1542 bp, while PpF3′HII measures 1536 bp in length. These coding regions encode proteins comprising 514 amino acids for PpF3′HI, and 512 amino acids for PpF3′HII. PpF3′HI shares 95% of its amino acid sequence identity with PpF3′HII, and PpF3′HI and PpF3′HII share 98% of their amino acid sequence identity with MdF3′HI and MdF3′HII in apples, respectively. A highly conserved P450 superfamily domain (accession no. cl12078) was found both in PpF3′HI and in PpF3′HII (Figure 1). Phylogenetic analysis was conducted utilizing the amino acid sequences deduced from genes encoding flavonoid hydroxylase in pears and diverse plant species. This analysis yielded two distinct clades, labeled as the F3′H and F3′5′H clades. Notably, PpF3′HI and PpF3′HII were grouped together with their respective counterparts, MdF3′HI and MdF3′HII, within these clades (Figure 2).

3.2. Anthocyanin Concentration and Expression of PpF3′HI and PpF3′HII in Different Pear Tissues

Anthocyanin accumulation in different pear tissues showed a similar pattern in the white-skinned pear cultivar ‘Zaobaimi’ and the red pear cultivar ‘Mantianhong’ (Figure 3A). The highest anthocyanin content was detected in young leaves, with about 2 mg Cy-3-gal/100 g FW both in ‘Zaobaimi’ and in ‘Mantianhong’, followed by old leaves and young stems, where a low amount (<0.5 mg 100 g−1) of anthocyanin was detected (Figure 3A). However, no anthocyanin accumulation was found in mature pear fruit flesh (Figure 3A).
A higher expression level of PpF3′HI was detected in young tissues of two cultivars, including young leaves and stems, than in old tissues (Figure 3B). PpF3′HII was most expressed in old and young leaves of ‘Zaobaimi’, and in young leaves of ‘Mantianhong’ (Figure 3B). Additionally, both PpF3′HI and PpF3′HII showed a low expression level in mature flesh of two cultivars (Figure 3B).

3.3. Anthocyanin Concentration and Expression of PpF3′HI and PpF3′HII in Different Development Stages of Pear Fruit

Anthocyanin accumulation started at 15 WAFB in ‘Mantianhong’, and peaked until harvest (22 WAFB), with 4 mg 100 g−1, while no anthocyanin was detected in ‘Zaobaimi’ throughout the development stage (Figure 4A). Regarding gene expression, both PpF3′HI and PpF3′HII showed two peaks in ‘Mantianhong’; one was detected in fruitlets (5 WAFB), and the other one occurred in the middle of the period of red coloration (Figure 4B). In the white-skinned cultivar ‘Zaobaimi’, the expression of PpF3′HI and PpF3′HII peaked in fruitlets and subsequently decreased during development (Figure 4B).

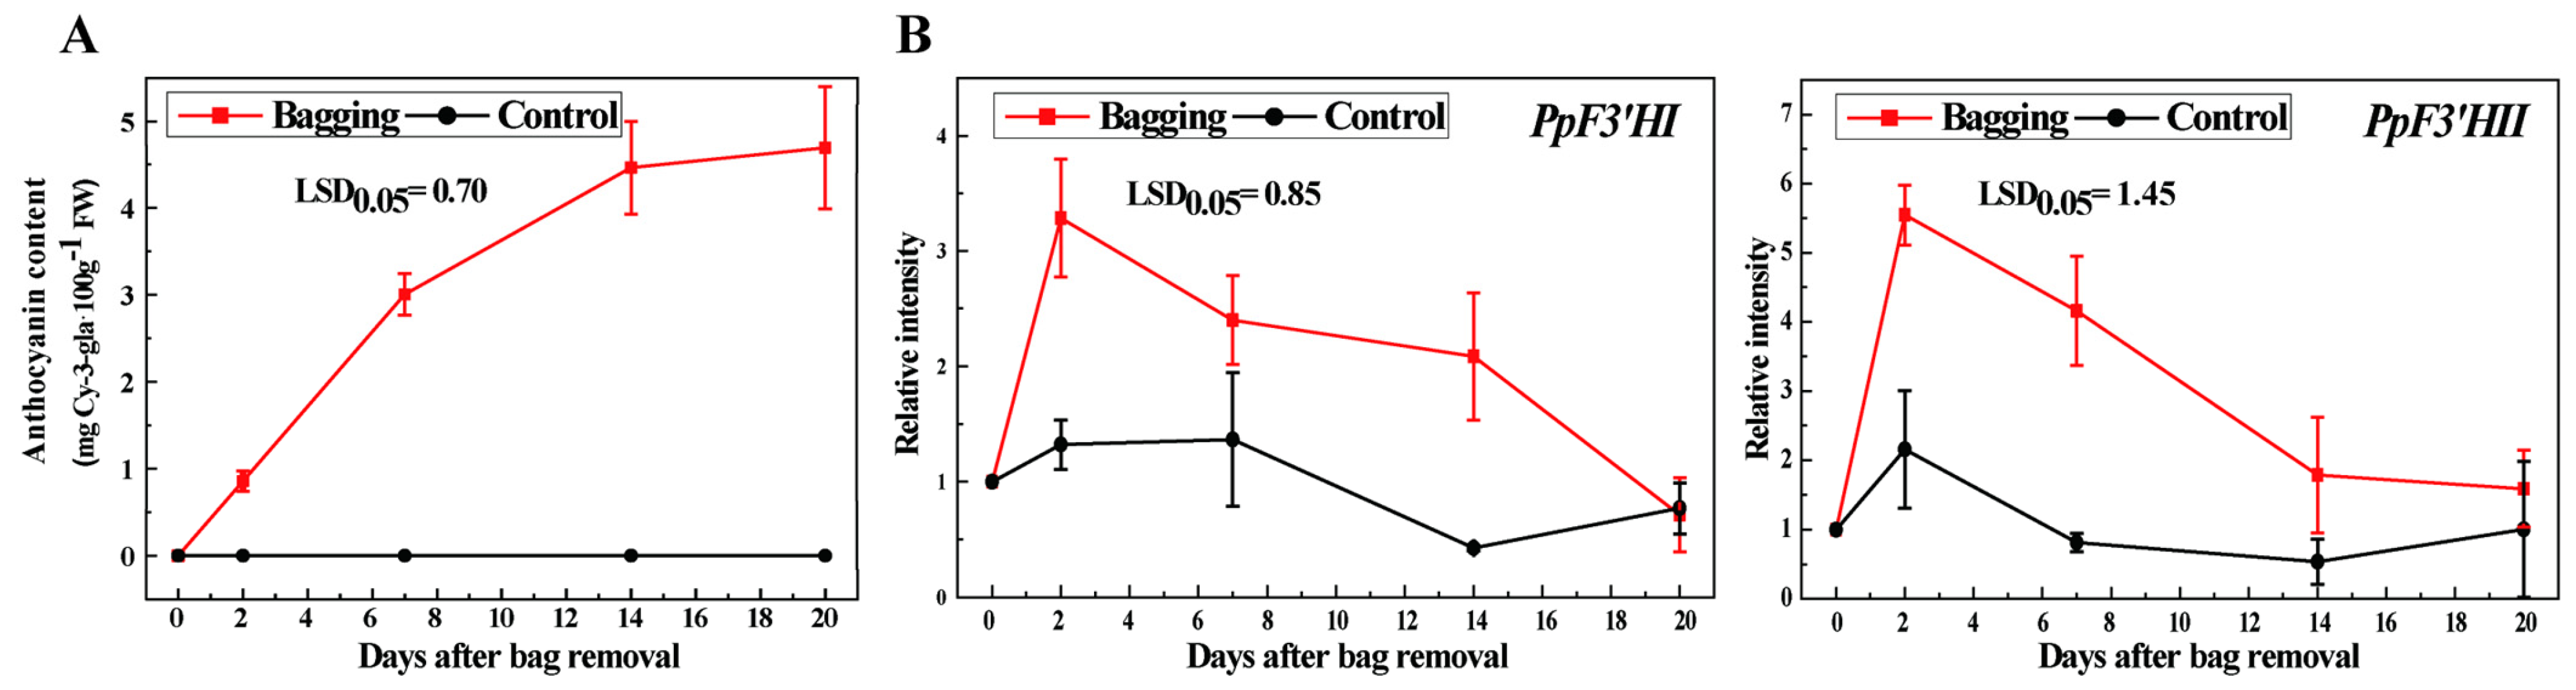
3.4. Anthocyanin Accumulation and Expression of PpF3′HI and PpF3′HII under Bagging Treatment Conditions in ‘Mantianhong’

After bag removal and re-exposure of the fruit to sunlight, anthocyanin started accumulating at 2 days after bag removal (DABR) and dramatically increased in quantity, reaching the amount of 5 mg 100 g−1 at 14 DABR. Anthocyanin content remained stable afterwards (Figure 5A). In contrast, no anthocyanin was detected in the control fruit, which remained bagged (Figure 5A).
The expression of PpF3′HI and PpF3′HII was induced by light and peaked at 2 DABR, with 4- and 6-fold up-regulation for PpF3′HI and PpF3′HII, respectively, and subsequently decreased gradually, still maintaining a higher transcription level than the control fruit (Figure 5B). The expression of these two genes in the bagged control fruit remained at a low level throughout the process of the bagging treatment (Figure 5B).

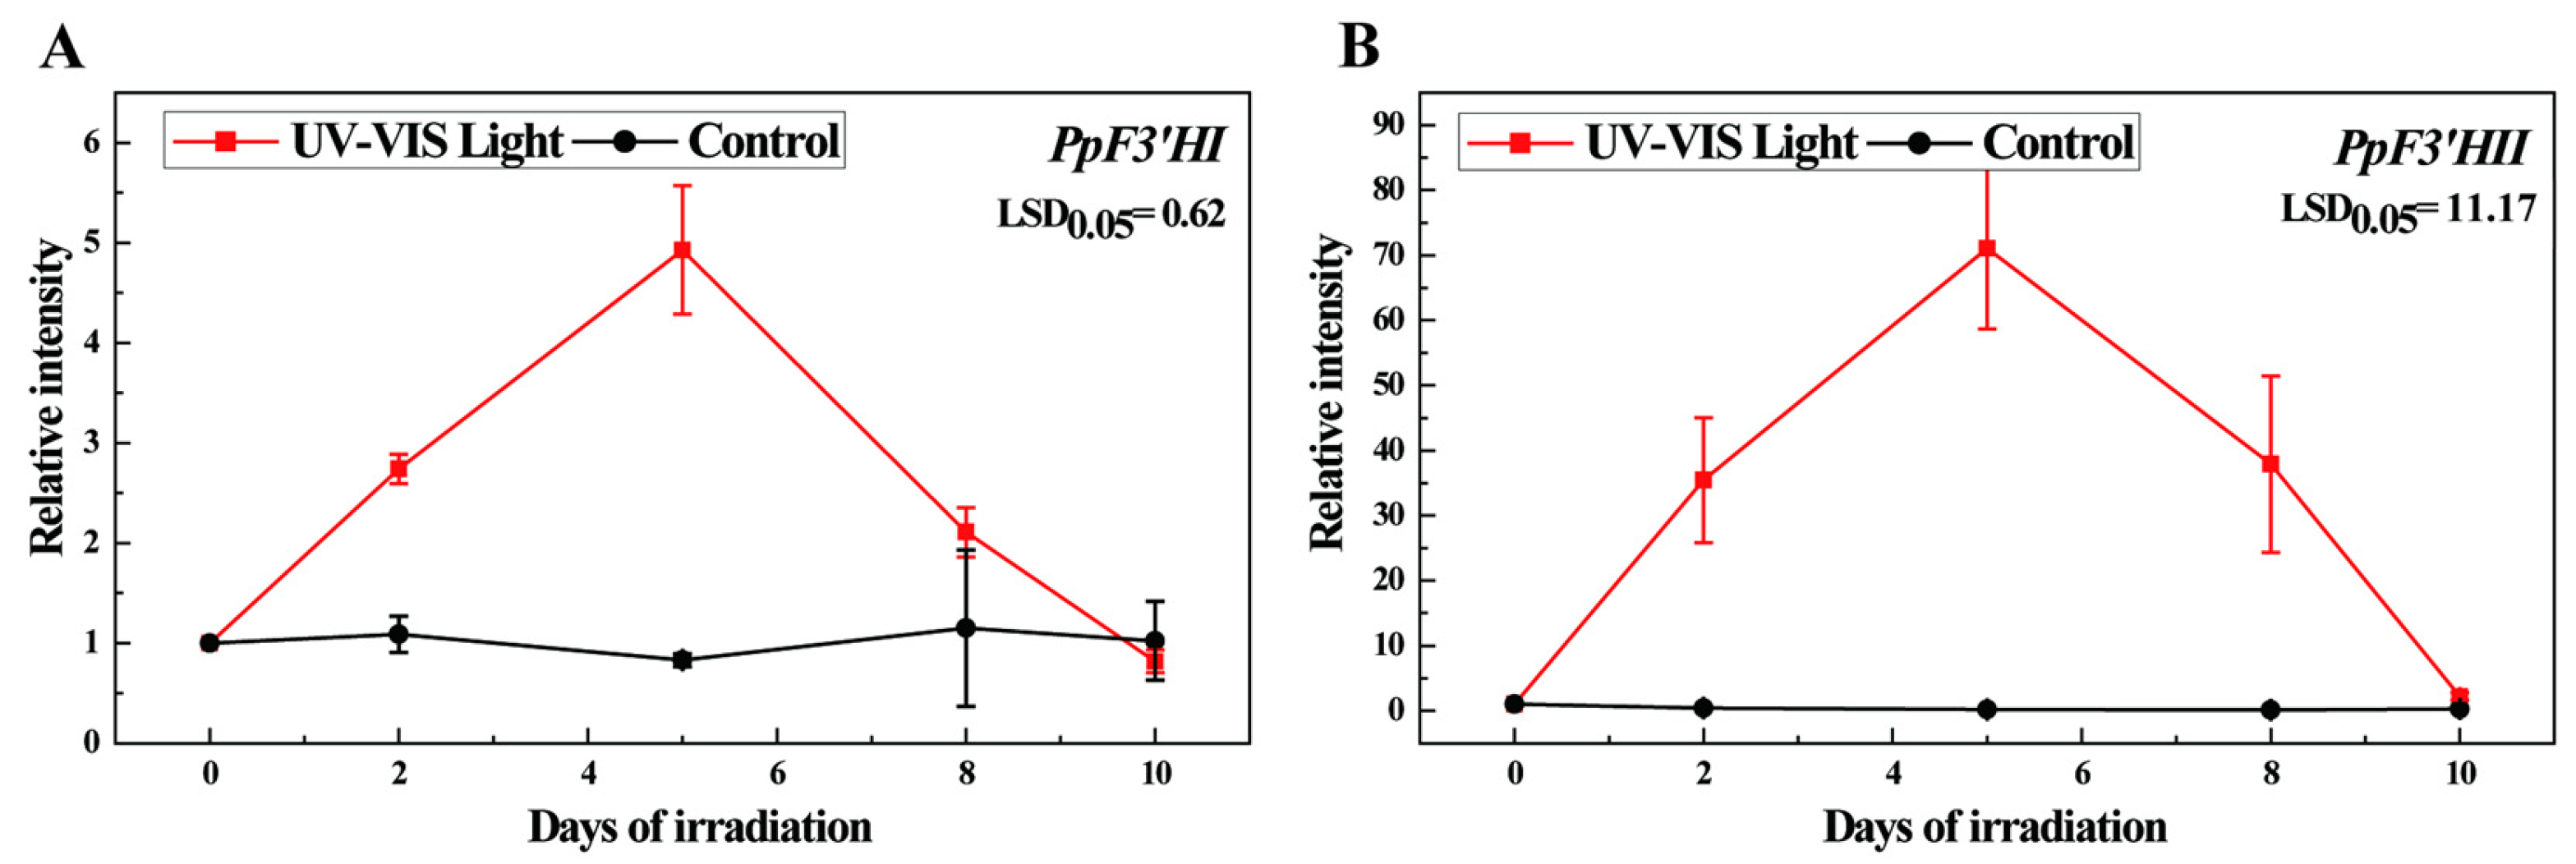
3.5. Anthocyanin Accumulation and Expression of PpF3′HI and PpF3′HII under Postharvest UV-B/Visible Irradiation Conditions in ‘Mantianhong’

Previous studies showed that postharvest UV-B/visible irradiation significantly induced anthocyanin accumulation in ‘Mantianhong’ pear fruit [4]. We therefore analyzed the expression of PpF3′HI and PpF3′HII in the ‘Mantianhong’ pear fruit. Expression of both PpF3′HI and PpF3′HII was raised under postharvest UV-B/visible irradiation conditions, which peaked at 5 DI, with about 5-fold and more than 60-fold up-regulation for PpF3′HI and PpF3′HII, respectively (Figure 6). The expression of these two genes decreased gradually after 5 DI, but a higher transcription level was still detected in the irradiated fruit than in the control fruit, which remained in the darkness (Figure 6).

3.6. PpMYB10 and PpHY5 Promote PpF3′HI Transcription

The region upstream of PpF3′HI spanning 1000 base pairs was identified as the promoter region. Subsequently, it was subjected to analysis utilizing the PlantCARE online tool, accessible at http://bioinformatics.psb.ugent.be/webtools/plantcare/html/ (accessed on 21 March 2024). One MYB binding site (MBS) and two G-boxes, which have been reported to be bound by HY5, were identified (Supplementary Table S2). In addition, light-responsive elements, including Box 4, Box I, GT1-motif, I-box, Sp1, and the TCT-motif; the ethylene-responsive element (ERE); and the auxin-responsive element, the TGA-element, were identified (Supplementary Table S2).
A Y1H assay was performed to test the interaction between the PpF3′HI promoter and PpMYB10 and PpHY5 proteins. The PpF3′HI promoter was divided into the following three fragments: −1000 bp to −699 bp; −746 bp to −396 bp (containing one G-box at −691 bp); and −419 bp to 0 bp (containing one MBS at −131 bp and one G-box at −106 bp) (Figure 7). PpMYB10 and PpHY5 were able to bind to the −419 bp to −0 bp and −746 bp to −396 bp fragments, respectively (Figure 7A). A dual-luciferase assay involving Nicotiana benthamiana leaves provided evidence that PpMYB10 and PpHY5 induce PpF3′HI promoter activity (Figure 7B). Thus, the Y1H assay and the dual-luciferase assay verified that PpMYB10 and PpHY5 directly bind to the promoter of PpF3′HI and activate its expression.

4. Discussion

The pear shows a very distinct coloration pattern. Due to the importance of anthocyanin hydroxylation in determining flower and fruit coloration, genes encoding F3′H and/or F3′5′H have been well-investigated in various plant species, including Arabidopsis [11], petunia [12], grapevine [9], apple [13], and Asteraceae [10]. In the present study, two PpF3′H genes were isolated from pears. Similar to the apple, a closely related species, the pear does not have functional F3′5′H, while the grapevine, another important fruit crop, has both F3′H and F3′5′H enzymes [9,13]. Thus, the results found in this study are helpful in understanding the F3′H genes and anthocyanin hydroxylation patterns in different fruit crops.
The PpF3′HI and PpF3′HII cloned in this study share a P450 superfamily domain (Figure 1) and belong to the cytochrome P450 protein (P450) superfamily, a huge class of heme-containing oxidases catalyzing NADPH- or NADH-dependent oxygenation reactions on a wide range of substrates [29,30,31]. The F3′H is grouped into the CYP75 family, which is part of the CYP71 clan of P450s that participates in the synthesis of phenylpropanoids, flavonoids, isoflavonoids, alkaloids, and other secondary compounds [32]. Phylogenetic analysis revealed distinct clustering of all F3′Hs and F3′5′Hs into two separate clades, as follows: the CYB75B gene subfamily, encoding F3′Hs, and the CYB75A subfamily, encoding F3′5′Hs (Figure 2). Catalyzing hydroxylation at different positions of the B-ring of the flavonoid molecule, F3′H and F3′5′H generate 3′,4′- and 3′,4′,5′-hydroxylated flavonoids, respectively. Compared to 3′,4′-hydroxylated flavonoids, 3′,4′,5′-hydroxylated flavonoids are not ubiquitous in either lower or higher plants, indicating that the F3′5′H gene was inactivated or lost several times during evolution [10]. According to the analysis of components and contents of anthocyanin in 37 cultivars of red-skinned pear fruit, derivatives of the 3′,4′-hydroxylated cyanidin are the major components of anthocyanin in red-skinned pear, while derivatives of 3′,4′,5′-hydroxylated delphinidin were not detected [33]. Therefore, the existence of F3′H and the loss of the F3′5′H gene in pears, found in this study, revealed in a genetic context that the B-ring of DHK in pears can only be hydroxylated at the 3′ position but not at both the 3′ and 5′ positions, finally leading to the production of only cyanidin-based, but not delphinidin-based, pigments in pears.
The highest anthocyanin concentration was detected in the young leaves of both the ‘Zaobaimi’ pear and the ‘Mantianhong’ pear (Figure 3A), in conjunction with the high expression of PpF3′HI and PpF3′HII in young leaves (Figure 3B). A high transcription level of F3′H could also be detected in other anthocyanin-enriched tissues, such as petunia petals [12] and Chinese bayberry fruits [22], indicating that F3′H activity is necessary for anthocyanin biosynthesis. The expression peaks of PpF3′HI and PpF3′HII were detected at the early developmental stage (5 weeks after full bloom) in two cultivars, with an additional peak in the red-skinned ‘Mantianhong’ pear cultivar when anthocyanin accumulation began (Figure 4). In grapes, F3′H was expressed highly in fruitlets; the expression was decreased until veraison and was increased again during anthocyanin accumulation [9]. In apples, a higher transcription level of F3′H was found in the red-colored apple cultivar, ‘Red Delicious’, than the yellow-colored cultivar, ‘Golden Delicious’, during all of the developmental stages [13]. In Chinese bayberries, anthocyanin accumulated gradually during the development of fruit, which was correlated with the expression of the structural and regulatory genes of anthocyanin biosynthesis, including F3′H [22]. These results suggested that anthocyanin accumulation in mature fruit is quite common among red Chinese sand pear cultivars, including ’Meirensu’ and ‘Yunhongli No. 1′ [34], as well as ‘Mantianhong’ in the present study, and that the F3′H gene family is one of the important determinant factors regulating the anthocyanin biosynthesis in pears.
Fruit bagging and postharvest UV-B/visible light irradiation are regarded as methods for inducing anthocyanin accumulation and improving fruit color. Fruit bagging has been used for apples [35,36] and Asian pears [4,23], while postharvest irradiation has been widely applied to apples [37], Asian pears [4,38], grapes [39], blackberries [40], and cherries [41]. Previous studies showed that most structural and regulatory genes of anthocyanin biosynthesis were up-regulated during the light-induced anthocyanin accumulation in pears [23]. Thus, together with the results obtained in the current study, we hypothesize that anthocyanin accumulation in pears is light-dependent, and that bag treatment and postharvest UV-B/visible light irradiation induce the expression of genes related to anthocyanin biosynthesis, subsequently promoting the anthocyanin accumulation and peel coloration in pears.
Since the up-regulation of F3′H was detected during the light-induced anthocyanin biosynthesis in pears, the Y1H assay was employed to determine whether the transcription of F3′H was regulated by MYB10 and HY5. The results showed that MYB10 and HY5 could bind to the −419 bp to 0 bp and −746 bp to −396 bp fragments of the PpF3′HI promoter regions (Figure 7A). This process probably occurred via binding to the MBS at −131 bp and G-box at −691 bp, respectively. A dual-luciferase assay further showed that PpMYB10 and PpHY5 induce PpF3′HI promoter activity (Figure 7B). MYB10 has been reported to interact with not only early anthocyanin biosynthetic genes, including CHS [23], which is also involved in the biosynthesis of other flavonoids, but also late anthocyanin biosynthetic genes, including DFR, ANS, and UFGT [19,23]. All of these results suggest that MYB10 is a key transcription factor regulating flavonoid and anthocyanin biosynthesis in plants. Light is a dominant environmental factor in anthocyanin biosynthesis, and HY5 has been shown to regulate the transcription of CHS [25,26], DFR [25], and MYB10 [27]. As demonstrated by the results in this study, HY5 acts as a bridge connecting the upstream light transduction pathway and the downstream flavonoid and anthocyanin biosynthetic pathways.
In conclusion, two pear PpF3′H genes, PpF3′HI and PpF3′HII, were isolated. These genes encode proteins of 514 and 512 amino acids, respectively, with a 95% amino acid sequence identity. The PpF3′H genes were highly expressed in anthocyanin-enriched tissues such as young leaves, and the transcription of the PpF3′H genes corresponded to anthocyanin biosynthesis during the developmental stages, bagging treatment, and postharvest UV-B/visible irradiation. MYB10 and HY5 could bind to the promoter region of PpF3′HI, probably via binding to the MBS and G-box, respectively, subsequently activating the expression of PpF3′HI. The findings in this study will be of use in fine-tuning the molecular mechanisms of the biosynthesis of anthocyanin in pears (Figure 8).

Supplementary Materials

The following supporting information can be downloaded at: https://www.mdpi.com/article/10.3390/horticulturae10060535/s1, Supplementary Table S1: Sequence information of PCR primers used in this study; Supplementary Table S2: Cis-acting elements potentially associated with the promoter region of PpF3′HI.

Author Contributions

Conceptualization, J.N., M.Q. and Y.T.; methodology, J.N., M.Q. and Y.T.; validation, R.T., J.N. and M.Q.; formal analysis, Y.Z., J.N. and M.Q.; investigation, R.T., J.N. and M.Q.; data curation, Y.Z., R.T., J.N. and M.Q.; writing—original draft preparation, Y.Z., J.N. and M.Q.; writing—review and editing, Y.Z., J.N., M.Q. and Y.T.; visualization, Y.Z., R.T., J.N., M.Q. and Y.T.; supervision, M.Q. and Y.T.; project administration, J.N., M.Q. and Y.T. All authors have read and agreed to the published version of the manuscript.

Funding

This research was supported by the Zhejiang Provincial Natural Science Foundation of China (LY22C150003), the Key Research and Developmental Program of Hainan Province (ZDYF2021XDNY272), the Young Elite Scientists Sponsorship Program by CAST (2023QNRC001), and the National Science Foundation of Hainan Province (322CXTD524).

Data Availability Statement

Data are available in the Supplementary Materials.

Conflicts of Interest

The authors declare that they have no competing interests.

References

  1. Dussi, M.C.; Sugar, D.; Wrolstad, R.E. Characterizing and Quantifying Anthocyanins in Red Pears and the Effect of Light Quality on Fruit Color. J. Am. Soc. Hortic. Sci. 1995, 120, 785–789. [Google Scholar] [CrossRef]
  2. Coombe, B.G. In the Regulation of Set and Development of the Grape Berry. Acta Hortic. 1973, 34, 261–274. [Google Scholar] [CrossRef]
  3. Steyn, W.J.; Wand, S.J.E.; Holcroft, D.M.; Jacobs, G. Red colour development and loss in pears. Int. Soc. Hortic. Sci. 2005, 1, 79–85. [Google Scholar] [CrossRef]
  4. Qian, M.J.; Zhang, D.; Yue, X.Y.; Wang, S.K.; Li, X.G.; Teng, Y.W. Analysis of different pigmentation patterns in ‘Mantianhong’ (Pyrus pyrifolia Nakai) and ‘Cascade’ (Pyrus communis L.) under bagging treatment and postharvest UV-B/visible irradiation conditions. Sci. Hortic. 2013, 151, 75–82. [Google Scholar] [CrossRef]
  5. Grotewold, E. The genetics and biochemistry of floral pigments. Annu. Rev. Plant Biol. 2006, 57, 761–780. [Google Scholar] [CrossRef] [PubMed]
  6. Winkel-Shirley, B. Flavonoid biosynthesis. A colorful model for genetics, biochemistry, cell biology, and biotechnology. Plant Physiol. 2001, 126, 485–493. [Google Scholar] [CrossRef]
  7. Holton, T.A.; Cornish, E.C. Genetics and Biochemistry of Anthocyanin Biosynthesis. Plant Cell 1995, 7, 1071–1083. [Google Scholar] [CrossRef] [PubMed]
  8. Forkmann, G. Flavonoids as Flower Pigments: The Formation of the Natural Spectrum and its Extension by Genetic Engineering. Plant Breed. 1991, 106, 1–26. [Google Scholar] [CrossRef]
  9. Bogs, J.; Ebadi, A.; McDavid, D.; Robinson, S.P. Identification of the flavonoid hydroxylases from grapevine and their regulation during fruit development. Plant Physiol. 2006, 140, 279–291. [Google Scholar] [CrossRef]
  10. Seitz, C.; Eder, C.; Deiml, B.; Kellner, S.; Martens, S.; Forkmann, G. Cloning, functional identification and sequence analysis of flavonoid 3′-hydroxylase and flavonoid 3′,5′-hydroxylase cDNAs reveals independent evolution of flavonoid 3′,5′-hydroxylase in the Asteraceae family. Plant Mol. Biol. 2006, 61, 365–381. [Google Scholar] [CrossRef]
  11. Schoenbohm, C.; Martens, S.; Eder, C.; Forkmann, G.; Weisshaar, B. Identification of the Arabidopsis thaliana flavonoid 3’-hydroxylase gene and functional expression of the encoded P450 enzyme. Biol. Chem. 2000, 381, 749–753. [Google Scholar] [CrossRef] [PubMed]
  12. Brugliera, F.; Barri-Rewell, G.; Holton, T.A.; Mason, J.G. Isolation and characterization of a flavonoid 3′-hydroxylase cDNA clone corresponding to the Ht1 locus of Petunia hybrida. Plant J. 1999, 19, 441–451. [Google Scholar] [CrossRef] [PubMed]
  13. Han, Y.P.; Vimolmangkang, S.; Soria-Guerra, R.E.; Rosales-Mendoza, S.; Zheng, D.M.; Lygin, A.V.; Korban, S.S. Ectopic Expression of Apple F3′H Genes Contributes to Anthocyanin Accumulation in the Arabidopsis tt7 Mutant Grown Under Nitrogen Stress. Plant Physiol. 2010, 153, 806–820. [Google Scholar] [CrossRef] [PubMed]
  14. Feng, S.; Wang, Y.; Yang, S.; Xu, Y.; Chen, X. Anthocyanin biosynthesis in pears is regulated by a R2R3-MYB transcription factor PyMYB10. Planta 2010, 232, 245–255. [Google Scholar] [CrossRef] [PubMed]
  15. Espley, R.V.; Brendolise, C.; Chagné, D.; Kutty-Amma, S.; Green, S.; Volz, R.; Putterill, J.; Schouten, H.J.; Gardiner, S.E.; Hellens, R.P. Multiple repeats of a promoter segment causes transcription factor autoregulation in red apples. Plant Cell Online 2009, 21, 168–183. [Google Scholar] [CrossRef]
  16. Espley, R.V.; Hellens, R.P.; Putterill, J.; Stevenson, D.E.; Kutty-Amma, S.; Allan, A.C. Red colouration in apple fruit is due to the activity of the MYB transcription factor, MdMYB10. Plant J. 2007, 49, 414–427. [Google Scholar] [CrossRef]
  17. Kobayashi, S.; Goto-Yamamoto, N.; Hirochika, H. Retrotransposon-Induced Mutations in Grape Skin Color. Science 2004, 304, 982. [Google Scholar] [CrossRef]
  18. Azuma, A.; Kobayashi, S.; Goto-Yamamoto, N.; Shiraishi, M.; Mitani, N.; Yakushiji, H.; Koshita, Y. Color recovery in berries of grape (Vitis vinifera L.) ‘Benitaka’, a bud sport of ‘Italia’, is caused by a novel allele at the VvmybA1 locus. Plant Sci. 2009, 176, 470–478. [Google Scholar] [CrossRef]
  19. Wang, Z.; Meng, D.; Wang, A.; Li, T.; Jiang, S.; Cong, P.; Li, T. The methylation of PcMYB10 promoter is associated with Green skinned sport in ‘Max Red Bartlett’ pear. Plant Physiol. 2013, 162, 885–896. [Google Scholar] [CrossRef]
  20. Kui, L.-W.; Bolitho, K.; Grafton, K.; Kortstee, A.; Karunairetnam, S.; McGhie, T.K.; Espley, R.V.; Hellens, R.P.; Allan, A.C. An R2R3 MYB transcription factor associated with regulation of the anthocyanin biosynthetic pathway in Rosaceae. BMC Plant Biol. 2010, 10, 50. [Google Scholar]
  21. Lai, B.; Li, X.-J.; Hu, B.; Qin, Y.-H.; Huang, X.-M.; Wang, H.-C.; Hu, G.-B. LcMYB1 Is a Key Determinant of Differential Anthocyanin Accumulation among Genotypes, Tissues, Developmental Phases and ABA and Light Stimuli in Litchi chinensis. PLoS ONE 2014, 9, e86293. [Google Scholar] [CrossRef]
  22. Niu, S.-S.; Xu, C.-J.; Zhang, W.-S.; Zhang, B.; Li, X.; Lin-Wang, K.; Ferguson, I.B.; Allan, A.C.; Chen, K.-S. Coordinated regulation of anthocyanin biosynthesis in Chinese bayberry (Myrica rubra) fruit by a R2R3 MYB transcription factor. Planta 2010, 231, 887–899. [Google Scholar] [CrossRef]
  23. Bai, S.; Sun, Y.; Qian, M.; Yang, F.; Ni, J.; Tao, R.; Li, L.; Shu, Q.; Zhang, D.; Teng, Y. Transcriptome analysis of bagging-treated red Chinese sand pear peels reveals light-responsive pathway functions in anthocyanin accumulation. Sci. Rep. 2017, 7, 63. [Google Scholar] [CrossRef]
  24. Ravaglia, D.; Espley, R.V.; Henry-Kirk, R.A.; Andreotti, C.; Ziosi, V.; Hellens, R.P.; Costa, G.; Allan, A.C. Transcriptional regulation of flavonoid biosynthesis in nectarine (Prunus persica) by a set of R2R3 MYB transcription factors. BMC Plant Biol. 2013, 13, 68. [Google Scholar] [CrossRef] [PubMed]
  25. Jiang, M.; Ren, L.; Lian, H.; Liu, Y.; Chen, H. Novel insight into the mechanism underlying light-controlled anthocyanin accumulation in eggplant (Solanum melongena L.). Plant Sci. 2016, 249, 46–58. [Google Scholar] [CrossRef]
  26. Binkert, M.; Kozma-Bognár, L.; Terecskei, K.; De Veylder, L.; Nagy, F.; Ulm, R. UV-B-Responsive Association of the Arabidopsis bZIP Transcription Factor ELONGATED HYPOCOTYL5 with Target Genes, Including Its Own Promoter. Plant Cell 2014, 26, 4200–4213. [Google Scholar] [CrossRef]
  27. Peng, T.; Saito, T.; Honda, C.; Ban, Y.; Kondo, S.; Liu, J.-H.; Hatsuyama, Y.; Moriguchi, T. Screening of UV-B-induced genes from apple peels by SSH: Possible involvement of MdCOP1-mediated signaling cascade genes in anthocyanin accumulation. Physiol. Plant. 2012, 148, 432–444. [Google Scholar] [CrossRef]
  28. Tamura, K.; Dudley, J.; Nei, M.; Kumar, S. MEGA4: Molecular Evolutionary Genetics Analysis (MEGA) Software Version 4.0. Mol. Biol. Evol. 2007, 24, 1596–1599. [Google Scholar] [CrossRef]
  29. Graham, S.E.; Peterson, J.A. How Similar Are P450s and What Can Their Differences Teach Us? Arch. Biochem. Biophys. 1999, 369, 24–29. [Google Scholar] [CrossRef]
  30. Schuler, M.A.; Werck-Reichhart, D. Functional Genomics of P450S. Annu. Rev. Plant Biol. 2003, 54, 629–667. [Google Scholar] [CrossRef]
  31. Werck-Reichhart, D.; Feyereisen, R. Cytochromes P450: A success story. Genome Biol. 2000, 1, 3003. [Google Scholar] [CrossRef]
  32. Nelson, D.R.; Schuler, M.A.; Paquette, S.M.; Werck-Reichhart, D.; Bak, S. Comparative Genomics of Rice and Arabidopsis. Analysis of 727 Cytochrome P450 Genes and Pseudogenes from a Monocot and a Dicot. Plant Physiol. 2004, 135, 756–772. [Google Scholar] [CrossRef]
  33. Xiao, C.C.; Li, J.M.; Yao, G.F.; Liu, J.; Hu, H.J.; Cao, Y.F.; Zhang, S.L.; Wu, J. Characteristics of components and contents of anthocyanin in peel of red-skinned pear fruits from different species. J. Nanjing Agric. Univ. 2014, 37, 60–66. [Google Scholar]
  34. Huang, C.H.; Yu, B.; Su, Q.; Shu, J.; Teng, Y.W. A study on coloration physiology of fruit in two red Chinese sand pear cultivars ‘Meirensu’ and ‘Yunhongli No.1’. Sci. Agric. Sin. 2010, 43, 1433–1440. [Google Scholar]
  35. Arakawa, O. Characteristics of color development in some apple cultivars: Changes in anthocyanin synthesis during maturation as affected by bagging and light quality. J. Jpn. Soc. Hortic. Sci. 1988, 57, 373–380. [Google Scholar] [CrossRef]
  36. Bai, S.; Tuan, P.A.; Saito, T.; Honda, C.; Hatsuyama, Y.; Ito, A.; Moriguchi, T. Epigenetic regulation of MdMYB1 is associated with paper bagging-induced red pigmentation of apples. Planta 2016, 244, 573–586. [Google Scholar] [CrossRef]
  37. Ubi, B.E.; Honda, C.; Bessho, H.; Kondo, S.; Wada, M.; Kobayashi, S.; Moriguchi, T. Expression analysis of anthocyanin biosynthetic genes in apple skin: Effect of UV-B and temperature. Plant Sci. 2006, 170, 571–578. [Google Scholar] [CrossRef]
  38. Sun, Y.; Qian, M.; Wu, R.; Niu, Q.; Teng, Y.; Zhang, D. Postharvest pigmentation in red Chinese sand pears (Pyrus pyrifolia Nakai) in response to optimum light and temperature. Postharvest Biol. Technol. 2014, 91, 64–71. [Google Scholar] [CrossRef]
  39. Li, X.D.; Wu, B.H.; Wang, L.J.; Zheng, X.B.; Yan, S.T.; Li, S.H. Changes in trans-resveratrol and other phenolic compounds in grape skin and seeds under low temperature storage after post-harvest UV-irradiation. J. Hortic. Sci. Biotechnol. 2009, 84, 113–118. [Google Scholar] [CrossRef]
  40. Basiouny, F.M. Effects of UV-B irradiance on storability and quality of blackberry. Proc. Fla. State Hortic. Soc. 1998, 35, 283–284. [Google Scholar]
  41. Kataoka, I.; Sugiyama, A.; Beppu, K. Involvement of UV rays in sweet cherry fruit coloration during maturation. Proc. IVth Int. Cherry Symp. 2005, 2, 461–466. [Google Scholar] [CrossRef]
Figure 1. Isolation and sequence analysis of pear PpF3′H genes.
Horticulturae 10 00535 g001
Figure 2. Phylogenetic analysis of amino acid sequences of flavonoid hydroxylase coding genes in pears and other plants. The protein sequences of flavonoid hydroxylase coding genes from pear (Pyrus pyrifolia), apple (Malus domestica), grape (Vitis vinifera), cacao (Theobroma cacao), Arabidopsis (Arabidopsis thaliana), strawberry (Fragaria x ananassa), sweet potato (Ipomoea batatas), soybean (Glycine max), lotus (Nelumbo nucifera), rubber tree (Hevea brasiliensis), and potato (Solanum tuberosum) were used to construct a maximum likelihood tree with 1000 bootstrap replicates. Neighbor-joining trees were employed with the joining method. The replacement model was the Poisson model.
Horticulturae 10 00535 g002
Figure 3. Anthocyanin concentration (A) and expression of PpF3′HI and PpF3′HII (B) in different pear tissues. Data are presented as the mean ± standard error of three biological replicates.
Horticulturae 10 00535 g003
Figure 4. Anthocyanin concentration (A) and expression of PpF3′HI and PpF3′HII (B) in different development stages of pear fruit. Data are presented as the mean ± standard error of three biological replicates.
Horticulturae 10 00535 g004
Figure 5. Anthocyanin accumulation (A) and expression of PpF3′HI and PpF3′HII (B) under bagging treatment conditions in ‘Mantianhong’. Data are presented as the mean ± standard error of three biological replicates.
Horticulturae 10 00535 g005
Figure 6. Expression of PpF3′HI (A) and PpF3′HII (B) under postharvest UV-B/visible irradiation conditions for ‘Mantianhong’. Data are presented as the mean ± standard error of three biological replicates.
Horticulturae 10 00535 g006
Figure 7. PpMYB10 and PpHY5 promote PpF3′HI transcription. (A) Y1H analysis showing that PpMYB10 and PpHY5 bind to the PpF3′HI promoter fragment (ProPpF3′HI) containing the MBS at −131 bp and G-box at −691 bp. The promoter of PpF3′HI was divided into three fragments. The empty vector was used as a negative control. (B) A dual-luciferase assay indicated that PpMYB10 and PpHY5 activates the PpF3′HI promoter in vivo. The promoter of PpF3′HI was cloned into the pGreenII 0800-LUC (firefly luciferase) vector, and the full-length CDSs of PpMYB10 and PpHY5 were cloned into the pGreenII 0029 62-SK vector. The empty vector of pGreenII 0029 62-SK was used as a control. The relative luciferase activity was analyzed. Error bars represent the standard deviation of three biological replicates. Asterisks indicate significantly different values (** p < 0.01).
Horticulturae 10 00535 g007
Figure 8. The proposed model for PpHY5/PpMYB10-induced PpF3′H involved in anthocyanin accumulation.
Horticulturae 10 00535 g008
Disclaimer/Publisher’s Note: The statements, opinions and data contained in all publications are solely those of the individual author(s) and contributor(s) and not of MDPI and/or the editor(s). MDPI and/or the editor(s) disclaim responsibility for any injury to people or property resulting from any ideas, methods, instructions or products referred to in the content.

