Article

Calafate (Berberis microphylla G. Forst) Populations from Chilean Patagonia Exhibit Similar Structuring at the Genetic and Metabolic Levels

1
Departamento de Análisis Instrumental, Facultad de Farmacia, Universidad de Concepción, Concepción P.O. Box 160-C, Chile
2
Departamento de Ciencias Químicas y Recursos Naturales, Universidad de La Frontera, P.O. Box 54-D, Temuco 4811230, Chile
3
Instituto de Investigaciones Agropecuarias, INIA La Platina, Santa Rosa 11610, Santiago 8831314, Chile
*
Authors to whom correspondence should be addressed.
Horticulturae 2024, 10(5), 458; https://doi.org/10.3390/horticulturae10050458
Submission received: 2 March 2024 / Revised: 10 April 2024 / Accepted: 16 April 2024 / Published: 30 April 2024

Abstract

:
Berberis microphylla, commonly known as calafate, is one of the most promising species of Chilean Patagonia to be domesticated, due to its anthocyanin-rich berries. The main aim of this study was to understand the genetic structure of the wild populations of B. microphylla in the main regions where it grows and its relationship with phenolic secondary metabolite profiles. Ripe berry samples and leaves were collected from the Aysén and Magallanes regions. Genetic analyses were carried out using 18 microsatellite markers. Phenolic compounds were extracted from the ripe fruits and were quantified using high-performance liquid chromatography (HPLC). Their antioxidant capacity was determined according to the Trolox equivalent antioxidant capacity (TEAC) assay. Total phenols were measured as their absorbance at a wavelength of 280 nm. Both the genetic and chemometric data were explored using unsupervised and supervised methods. The genetic markers suggest the existence of three groups, two of them corresponding to the Aysén and Magallanes samples, and the third corresponding to Chile Chico (a district in Aysén), which was the most divergent of the three. Similar results were observed in the phenolic profile obtained with chemometric analysis, with the same samples forming a separate third group. The differentiation achieved using the genetic and chemical data may be the result of intrinsic genetic differences, environmental effects on fruit maturity, or the sum of both factors. These are all points to consider in the domestication of this valuable species by selecting individuals with desirable traits and contrasting phenotypes.

1. Introduction

More than 60 species are described for the genus Berberis in South America, of which around 20 species are distributed throughout Chilean and Argentinean Patagonia [1]. The taxonomical organization and definitive classification of Patagonian Berberis species is still a matter of controversy. For example, Orsi stated that 17 Berberis species exist in this region [2], but Landrum reclassified some of them into single species, such as B. heterophylla and B. buxifolia, which were then classified as B. microphylla [1]. One of the possible reasons behind these taxonomical difficulties is their inter-specific hybridization, a phenomenon that could be more frequent in this genus than commonly found in others, giving rise to “intermediate forms between the different species” [3].
In Chilean Patagonia, the number of Berberis species could be between 18 [1] and 50 [4]. These are distributed from the coastal range to the Andean slopes, as well as from the Atacama Desert to the north (B. litoralis) to the southern tip of Tierra del Fuego Island, including the Juan Fernandez archipelago (B. selkirkii) in the Pacific Ocean. B. microphylla is one of the most prominent species, due to their anthocyanin-rich edible berries. Its presence has been documented from the southernmost Magallanes islands, where it is quite frequently found, to the Andean slopes in the central-south part of the country [5]. Other species of interest, due to their berries that are rich in anthocyanic pigments, are B. darwinii and B. ilicifolia (indistinctly named “michay”). The former spread more in the northern area of the distribution of Berberis in central Chile, while the latter are sympatric with the southern populations of B. microphylla [5]. Their abundance, however, is lower than that of calafate. Therefore, the main target of this work was B. microphylla.
Berberis microphylla G. Forst., commonly known as calafate, is an evergreen and semi-evergreen shrub or small tree, the fruits of which are very rich in anthocyanins, hydroxycinnamic acids, and other phenolics, making it a very promising fruit from a nutraceutical perspective, as summarized in several reviews in recent years [6,7,8,9]. The species spans over a distance of almost 2000 km throughout the southern half of Chile. Within this area, there is high climatic variability. The north has a Mediterranean climate, characterized by dry summers and rainy winters. The southern region presents an oceanic climate, along with a higher humidity level and lower temperatures, due to its proximity to the Andean mountains. Finally, in the extreme south, there is a lower isotherm related to the tundra and steppe climates, with snowfall in wintertime.
There are antecedents that correlate with the biosynthesis of phenolic compounds, especially flavonoid and non-flavonoid groups, as a response to stress signals such as nutrient deficiency or pathogenic aggression, which affects the synthesis and accumulation of these compounds [10,11]. It is also known that plants can adapt to changes in environmental conditions [12], which could also affect the expression of secondary metabolites. These antecedents allow for hypothesizing that there are differences in the phenolic compound profiles and composition of calafate fruits, according to their geographical origin. Additionally, the genetic diversity among the accessions of this species is also expected to correlate with their geographical distribution. Regarding this matter, in a genetic and morphological analysis of B. microphylla accessions in the south of Tierra del Fuego Island, no association between the genetic and morphologic distances of the accessions was observed [13]. However, significant correlations among some morphological characters and environmental factors (wind, elevation, light, and slope) indicate that calafate plants could exhibit remarkable phenotypic plasticity [13].
The study of the genetic diversity of Patagonian Berberis species has been focused on the genus level [3,14] and intraspecific evaluations are rather scarce and are based on samples from a limited area [13]. Dominant-type markers, such as RAPD [13] and AFLP [14], in addition to ITS ribosomal sequences, were initially prioritized [3]. Interestingly, the genetic distances estimated, based on the RAPD and AFLP polymorphisms, did not show a good correlation with the distances, based on morphological descriptors. More recently, 18 microsatellite markers (also known as simple sequence repeats, or SSRs) were developed for B. microphyla [15]; this SSR set proved to be transferable to other Berberis species of Patagonia. SSRs are one of the most powerful tools to evaluate the genetic diversity of a species and to determine the genetic structure of their populations. SSRs are widely dispersed in the genome, highly polymorphic, codominant, and reproducible [16]. Based on these data sets, unsupervised clustering methods can be applied to estimate the degree of similarity among samples and the formation of groups, combining complex data sets such as secondary metabolite compounds expressed in fruits and genetic data. This type of strategy is used as a first approximation in classification processes [17] and can identify potential groups, detect abnormal samples or “outliers”, and/or identify trends among samples or variables [18].
Considering this background, the main aim of this research was to estimate the level of genetic diversity of the collected accessions and to understand the genetic structure of the B. microphylla populations located in Chilean Patagonia and its relationship with their phenolic secondary metabolite profiles. Chilean Patagonia is split into two main areas (Aysén and Magallanes), separated by two of the largest icefields on Earth, i.e., the Northern and Southern Patagonian Icefields (NPI and SPI, respectively); at the same time, they are connected by the Argentine Pampa. A third question to be answered is if these two main populations of calafate, separated by icefields hundreds of km in length, are different and to what extent, or if they are a continuous metapopulation, sharing the same or similar allele types and frequencies. In parallel, by using chemometric tools to uncover the polyphenol profiles and antioxidant activity of the extracts from the same calafate accessions, we aim to evaluate the existence of chemical differences among populations and if these differences have some correlation with the geographical origin of the fruit samples. Finally, we explore the association between the chemical diversity and the genetic structure of calafate populations, linked to the geographical origin of the samples.

2. Materials and Methods

2.1. Sampling

Calafate fruits and young leaves were collected in 2011 between January and March, at sampling places throughout Chilean Patagonia in the Aysén (n = 12) and Magallanes regions (n = 13). The sampling areas for all samples are shown in Figure 1. The fruits selected for each sample were fully colored. A larger set of calafate samples (B. microphylla, n = 73), as well as a few samples corresponding to the other Berberis species included in the preliminary genetic study, were collected from different regions throughout the country. These samples included B. darwinii (n = 6), B. empetrifolia (n = 3), B. ilicifolia (n = 3), B. vulgaris (n = 4), and individual samples of B. chilensis, B. litoralis, and B. thunbergii, as well as two Berberis sp. samples, totaling 94 samples. The samples were refrigerated after collection and transported, in this way, to the laboratories, where genetic and chemical analyses began a few weeks later. Analyses were completed within the timeframe of the project.

2.2. DNA Extraction

DNA extraction was carried out as described by Lodhi et al. [19]. Briefly, 0.1 g of plant tissue (fresh leaves and shoots) was homogenized and mixed with 700 μL of buffer (20 mM EDTA, 100 mM Tris–HCl, 1.4 M NaCl, 2% p/v cetyl trimethyl ammonium bromide (CTAB), 0.2% β-mercaptoethanol; pH 8) and 10 mg/mL of polyvinylpyrrolidone (PVP), with a molecular weight of 40,000 (to decrease the DNA oxidation caused by polyphenol action). All chemicals were from Merck KGaA (Darmstadt, Germany), except the ones indicated. The mix was incubated at 60 °C for 25 min, cooled at ambient temperature, and mixed with 0.6 mL of chloroform–isoamyl alcohol at a ratio of 24:1. A centrifugation step at 5000× g for 15 min was necessary to separate 0.45 mL of the supernatant, which was mixed with 225 μL of 5 M NaCl and 900 μL of ethanol at −20 °C. After 30 min, two centrifugation steps (700× g for 3 min and 3000× g for 3 min) were carried out, discarding the supernatant. The sediment was cleaned up with 0.5 mL of ethanol (75% v/v) at 4 °C, then centrifuged and dried at room temperature. Finally, it was diluted with 50 μL of water and treated with RNAse A (1 μg/mL), using incubation at 37 °C for 15 min. The extracts were stored at 4 °C until their analysis (or at −20 °C for long-term preservation). The quality and integrity of the extracted DNA were evaluated using gel electrophoresis on agarose (0.8% p/v), with 100 V and TAE 1 X (0.9 M Tris base, 0.02 M sodic EDTA, and 0.9 M boric acid; pH 8.0) as a buffer separation. An additional purification step was carried out using Purelink TM (Invitrogen, Thermo Scientific, Waltham, MA, USA) under the conditions described by the manufacturer, to avoid a high content of phenolic compounds in the samples. The concentration of DNA was determined with a Nanodrop (Thermo Scientific), using 1.0 μL of the extracted sample. The absorbance ratio of 280 nm/260 nm was additionally determined as a purity criterion.

2.3. SSR Analysis

The PCR reactions (performed as described in [15]) contained 20 ng DNA and 1 X PCR standard buffer; 1.5 mM MgCl2, 0.5 mM dNTPs, 5 pmol of each primer, and 1 U Taq DNA polymerase were used. The list of SSR markers and amplification conditions used is available in [15]. The cycles of PCR were initial denaturation at 94 °C for 3 min, followed by 35 cycles of 30 s at 94 °C; 30 s at 56 °C; and 1 min at 72 °C, with a final extension at 72 °C for 4 min 30 s. Electrophoresis of the PCR fragments was carried out on a 6% denaturing polyacrylamide gel (19:1 acrylamide/bis-acrylamide, 0.5 X TBE, 7.5 M urea) at 80 W for 2 h, using 0.5 X TBE as a running buffer, followed by silver-staining, as detailed in [15]. The alleles were scored as a binary matrix.

2.4. Genetic Data Analyses

The genetic diversity of the populations was estimated using several indicators, such as the number of different alleles by population (A), number of effective alleles (Ae), observed heterozygosity (Ho), and expected heterozygosity (He), which were extracted from the allele frequencies calculated with the library polysat [20] in the R environment. The fixation index (Fst) was also calculated for the Magallanes and Aysén populations to evaluate population differentiation based on the Hardy–Weinberg equilibrium. Regarding the markers’ performance, their polymorphic information content (PIC) and confusion probability (Cj) were also estimated. Unsupervised procedures, such as hierarchical clustering, following the unweighted pair group method with the arithmetic mean (UPGMA) using genetic distances (Euclidean) were performed to evaluate the population structure and visualize it using dendrograms [21]. Discriminant analysis of principal components was also performed using the library adegenet [22], to discriminate the existence of discrete groups among the samples based on their molecular data.

2.5. Phenolic Compounds and Antioxidant Activity Determinations

Quantitative analysis of the phenolic compounds, such as anthocyanins, flavonols, and hydroxycinnamic acid derivatives, was carried out after an extraction procedure. Extract preparation and chromatographic analysis of the phenolic compounds in calafate berries were performed as described previously [23], with minor modifications. Briefly, 5 g of the whole fruit (skin, pulp, and seeds) were ground and stirred for 16 h at room temperature with 10 mL of extraction solvent (methanol/formic acid ratio of 97:3% v/v), prior to homogenization with an ultrasonic bar for 45 s. After this, the extract was centrifuged at 3000 rpm for 10 min. The number of extractions was previously optimized with the construction of an extraction curve, where, in all steps, 5 mL of the extraction solvent and a stirring time of 15 min were used. After each step, the supernatants were pooled and stored for anthocyanin analysis. A further purification step to obtain an anthocyanin-free fraction was performed using solid phase extraction with cation exchange columns (MCX). Chromatographic analysis, identification, and quantification were carried out on a Shimadzu Nexera UHPLC/HPLC System equipped with a DGU-20 degasser unit, an LC-30 AD pump, an SIL-30 AC autosampler, an CTO-20 AC oven, a Prominence diode array UV–vis detector, and a LabSolutions software version 5.81 SP1, all from Shimadzu Corp. (Kyoto, Japan), coupled in a series with an ESI-mass spectrometer (AB Applied Biosystems MDS SCIEX QTRAP 3200 LC/MS/MS System, Framingham, MA, USA). The antioxidant activity was determined with the Trolox equivalent antioxidant capacity (TEAC) method [24] and the total phenols were measured using absorbance at 280 nm.

2.6. Chemometric Analysis

PCA was performed using the software Pirouette version 4.5 (Infometrix, Inc., Bothell, WA, USA). Twenty-five samples from three different sampling areas and thirty-two chemical variables (hydroxycinnamic acids, anthocyanins, and flavonols) were used for the analysis. The data were preprocessed using an autoscale before the analysis, to give each variable the same importance.

3. Results and Discussion

3.1. Genetic Diversity and Population Structure Based on SSR Marker Analysis

Ten SSR markers (marked with an asterisk in Table 1) developed for a study on the Patagonian group of Berberis species [15] were initially used to study the genetic diversity of calafate (Berberis microphylla) and related species collected throughout Chile. Before having access to these species-specific SSRs, we tested a few SSRs developed for B. thunbergii [25] and Mahonia aquifolium [26]; however, they were less informative or did not produce readable amplification products at all (results not shown). The results revealed a clear separation of the B. microphylla accessions, mostly collected from Southern Patagonia (Aysén and Magallanes regions), from other Berberis species, such as B. darwinii, which formed a separate clade (six accessions); B. ilicifolia (two accessions) and B. litoralis (from the Atacama Desert in the north of Chile), which were grouped together; and B. vulgaris (n = 4), from the Northern Hemisphere, which were even more distant in the tree (Figure S1). A few samples (n = 4), including two accessions of B. empetrifolia, one of B. ilicifolia, and one plant of the exotic B. thunbergii, were interspersed throughout the most divergent branches of the large B. microphylla group (Figure S1), which could be explained considering the morphological plasticity exhibited by the genus [13]. Finally, there was one accession cataloged phenotypically as B. microphylla (accession #79), which was excluded from the main clade of this species (lower branches in the dendrogram, Figure S1). As this sample was collected from Chiloé Island, it cannot be excluded that this accession corresponded to another species of the genus phenotypically similar to B. microphylla.
Considering these results, we expanded this study with a focus on Patagonian calafate (B. microphylla), due to its abundance in this region, its well-known antioxidant properties, and its potential domestication. Specifically, our interest was in evaluating if there is some structuring of calafate populations and if there are any correlations between the genetic groups and their chemical composition and differentiation. For this purpose, we considered 25 samples collected in the Aysén (n = 12) and Magallanes (n = 13) regions, from which we obtained young leaves (to isolate the DNA) and fruits (to study their chemical composition). Note that different botanical and/or morphological criteria were applied to identify and collect the B. microphylla specimens, which is an issue in species that can exhibit phenotypic plasticity associated with changing environmental conditions [13], as well as sympatric species from the same genus, associated with inter-specific hybridizations [3]. A summary of the statistical parameters for the 18 SSR markers used to characterize the 25 samples is presented in Table 1, based on 103 informative (polymorphic) alleles detected among these accessions. This number of markers (n = 18), combined with their collective informativeness, is consistent with the number of markers used in similar studies on other species, such as the characterization of a collection of old olives from the northwestern Iberian Peninsula, based on 15 SSRs [27], or a meta-analysis of 92 case studies to determine the possible effect of habitat fragmentation/degradation on the plants’ genetic diversity, each based on at least 6 SSRs [28]. Also, the compilation of fingerprinting protocols for 44 fruit crop species revealed that 12 or fewer SSR markers were sufficient to differentiate each genotype [29].
In this case, the average allele number per marker was 6.0, ranging from 2 (BmLP53) to 12 (BmLP65), and the average effective alleles per marker was 3.2. The average values of Ho and He (parameters commonly used to estimate genetic diversity) were 0.75 and 0.65, respectively [30]. This suggests that the size of the sampled population was appropriate, as it approaches the Hardy–Weinberg equilibrium. Interestingly, most of these loci were in heterozygosis (16 out of 18), with the only exception being markers BmLP39 and BmLP53, which is expected in a wild unhampered population in HW equilibrium. The high values of Ho and He are coincident with the large number of alleles observed, as well as with the high heterozygosity index. These results are consistent with what has been observed in other Berberis species. For instance, Allen et al. [25] estimated an average of 4.4 alleles per marker in a population of 24 B. thunbergii, accessions, with a Ho value of 0.46. Conversely, Rezaei et al. [31], using SSRs developed in the related species of M. aquifolium [26], observed an average of 14.3 alleles per marker on 45 Berberis accessions from Iran, including different species of the genus.
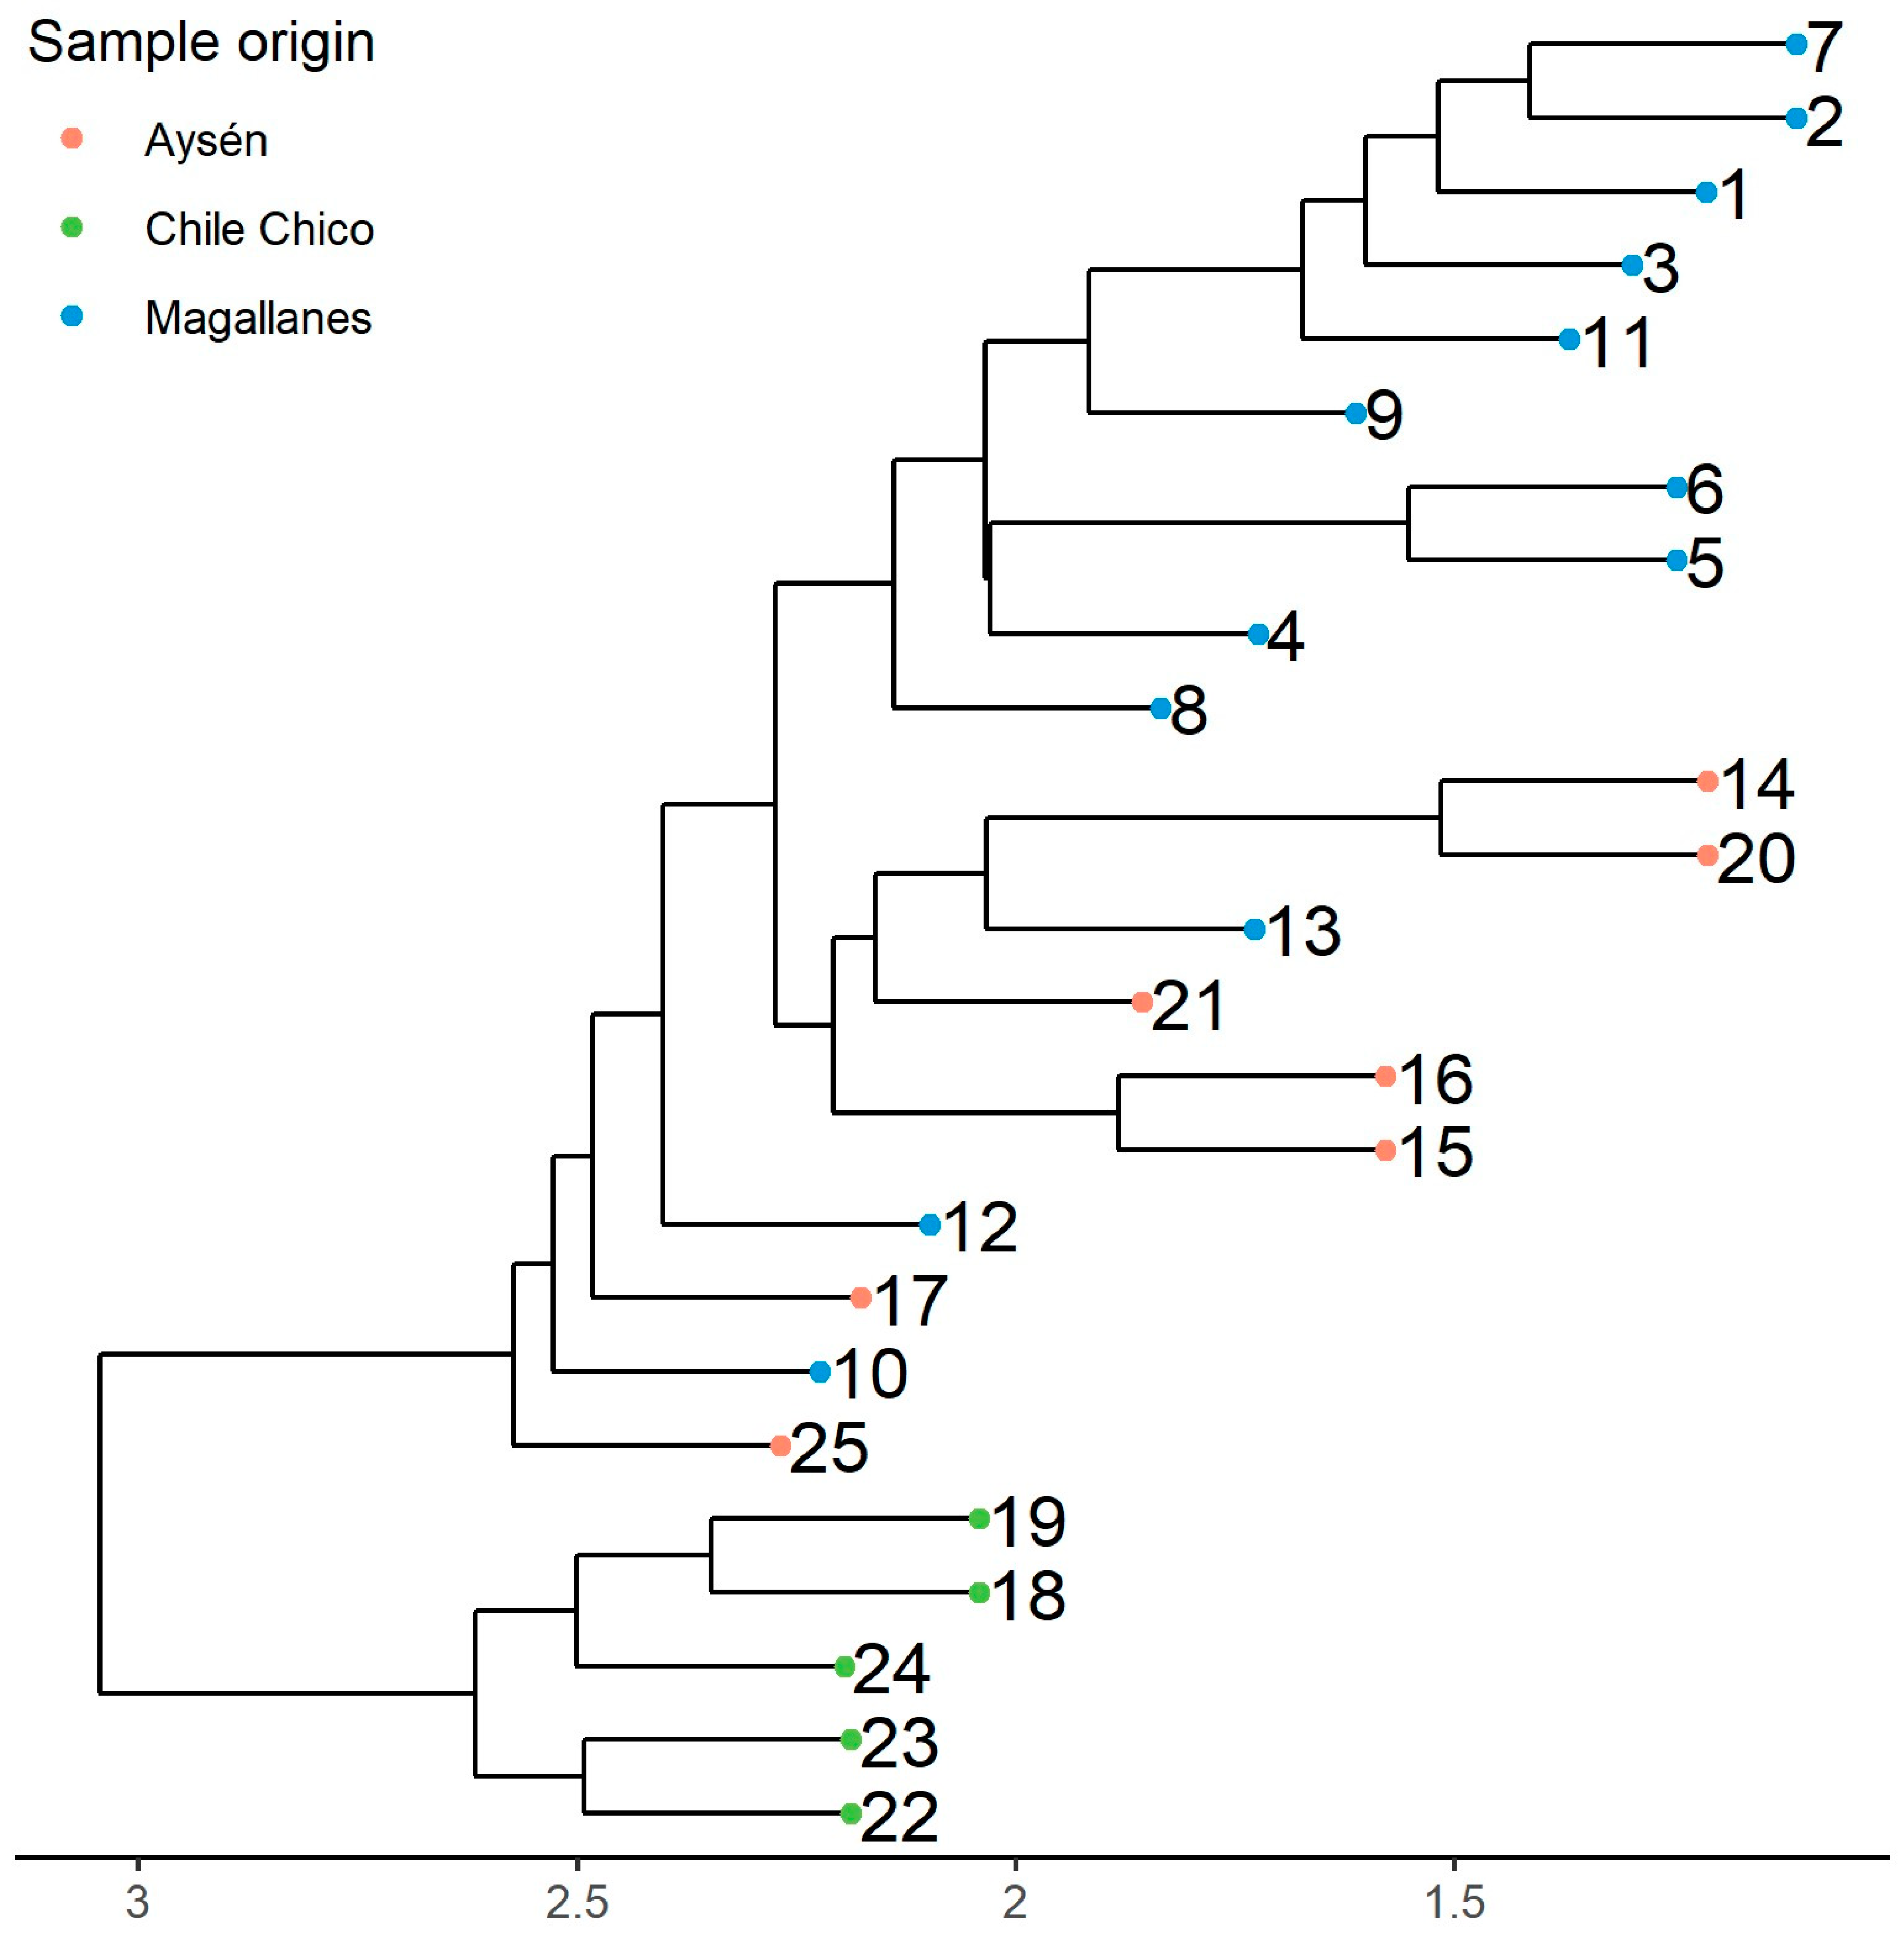
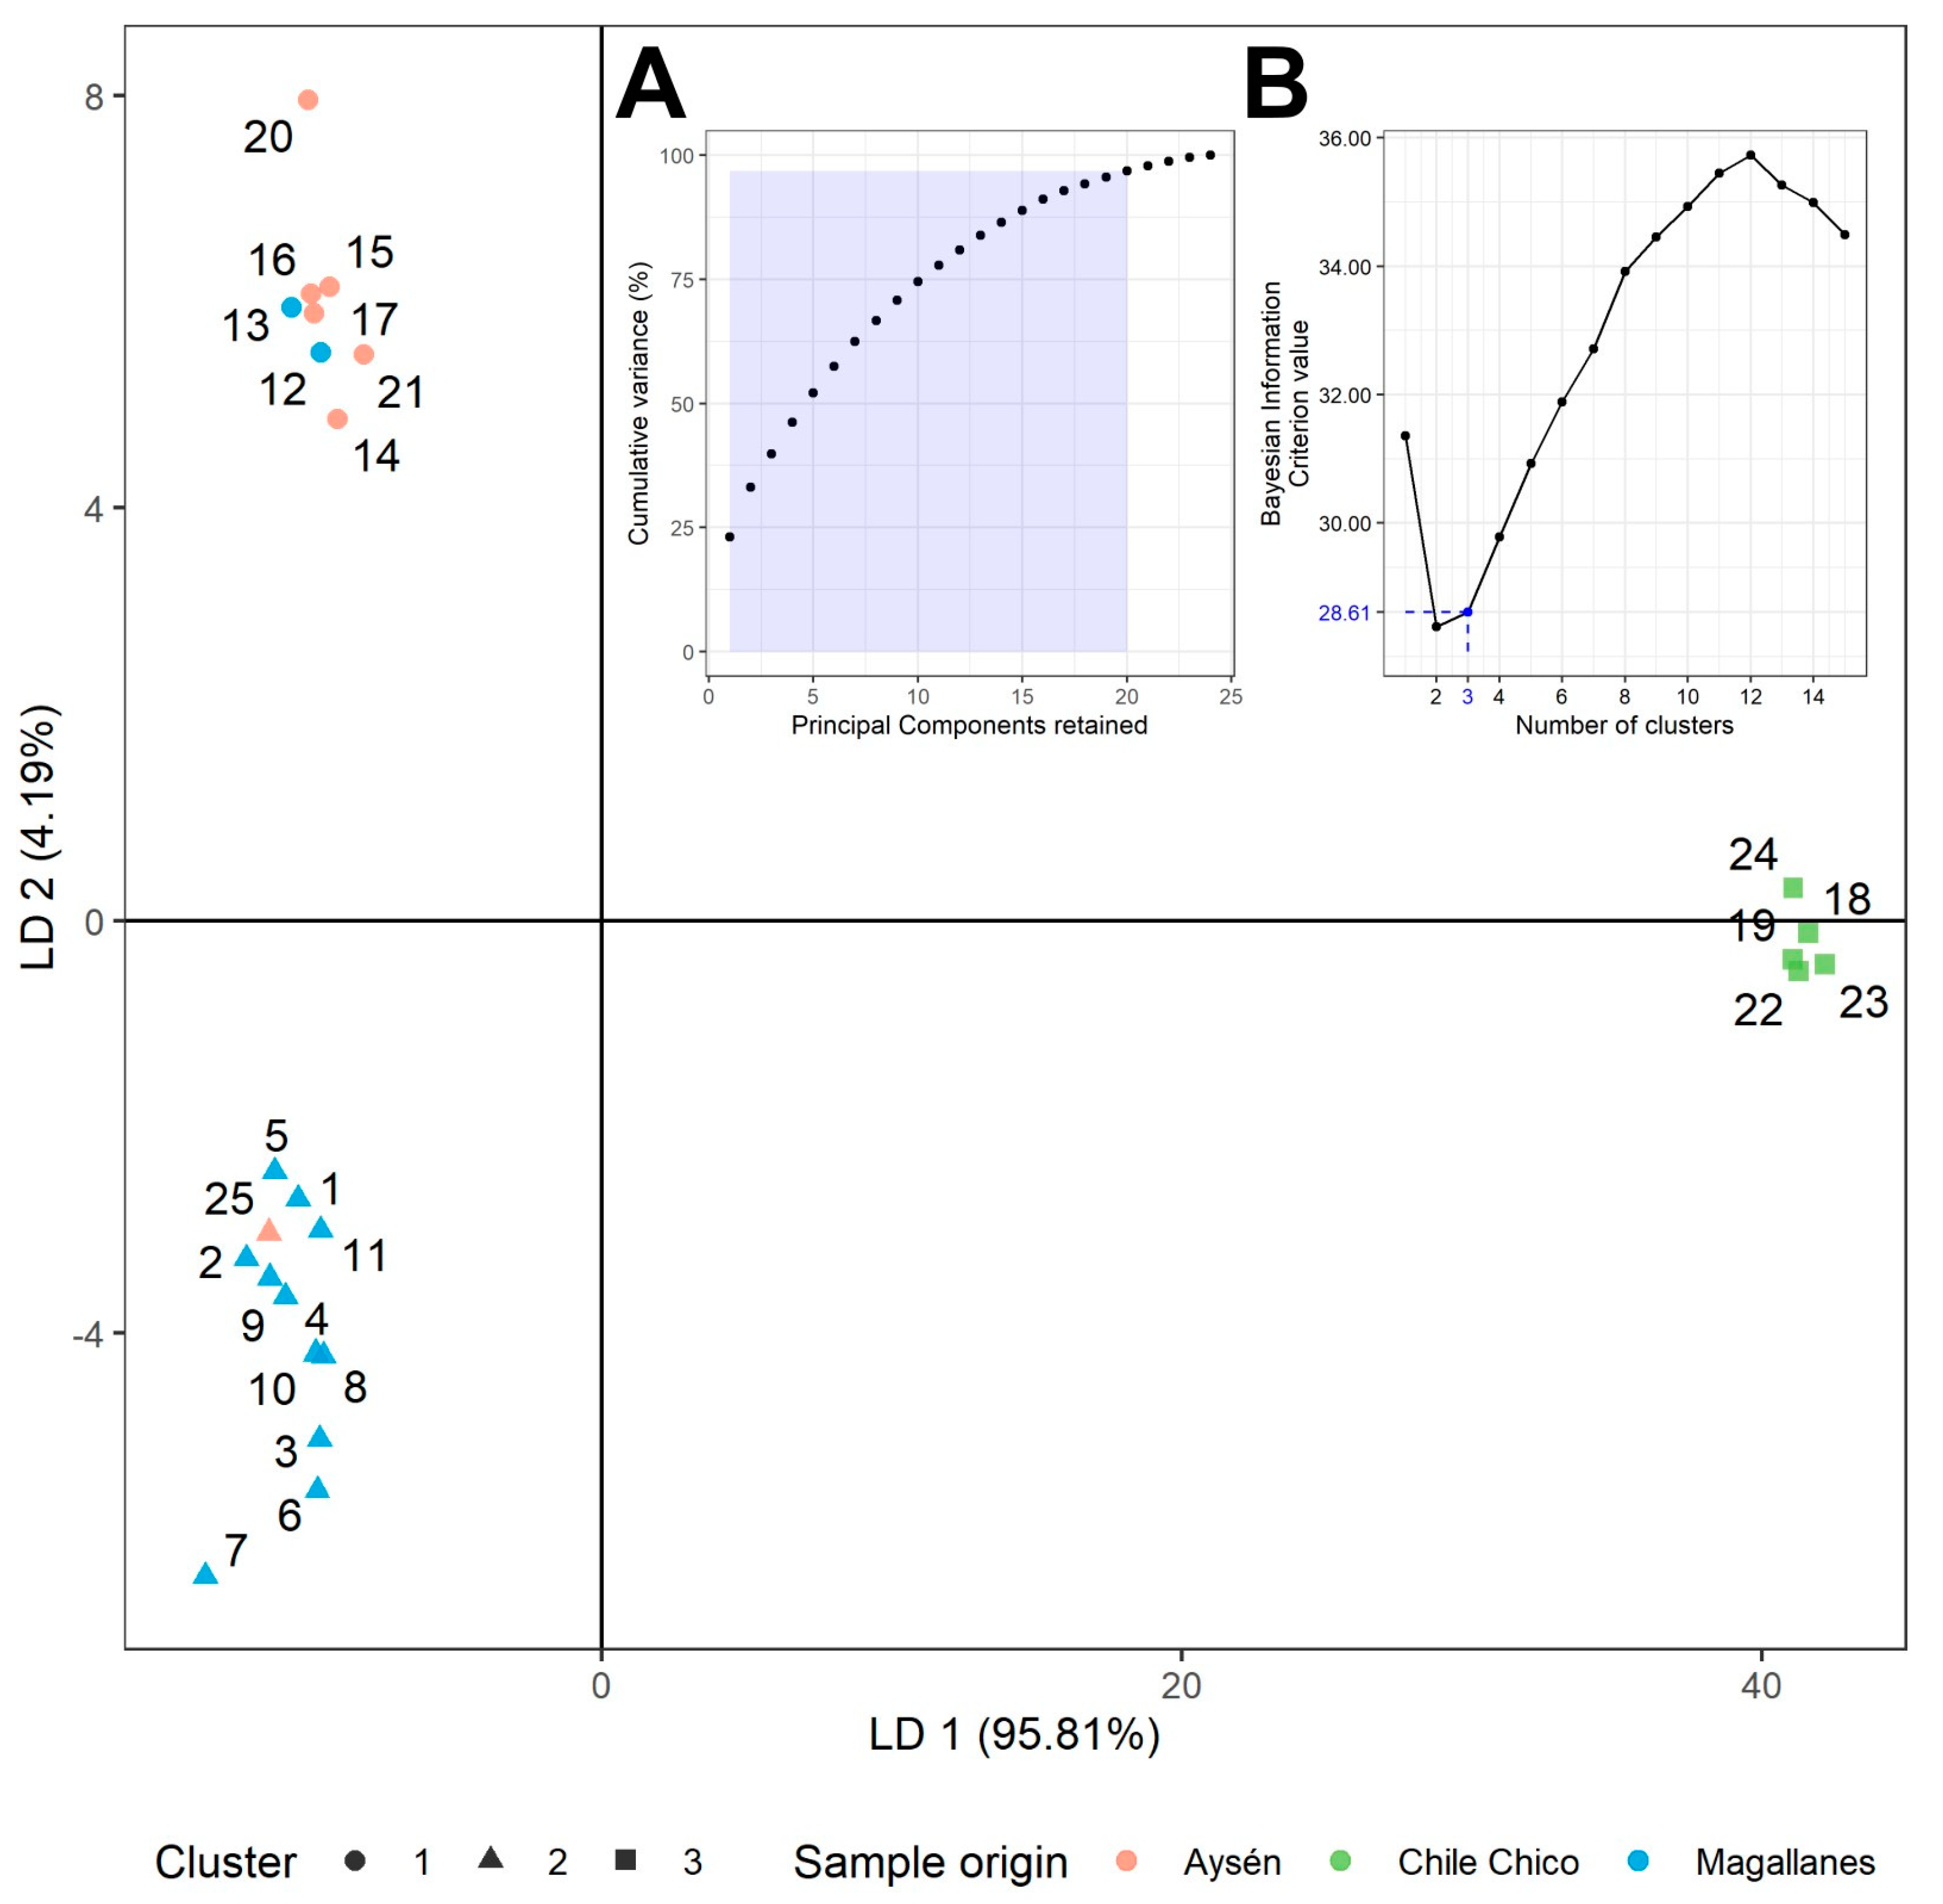
To estimate the existence of genetically differentiable discrete groups, two complementary unsupervised clustering methods based on the molecular data were performed. In this sense, hierarchical clustering (UPGMA) allowed us to obtain a dendrogram that revealed the existence of two differentiable genetic groups (Figure 2); the smaller one consisted of five accessions from Chile Chico. This is an isolated area of the Aysén region that is well known for its microclimate, which is warmer than other valleys at similar latitudes. Indeed, this is a fruit-producing zone [32], where sweet cherry and apple orchards are not uncommon and vineyards have recently been established [33]. The other larger group included samples collected from other localities in Aysén, as well as from the Magallanes region, about 1000 km south, separated by the NPI and SPI (see map in Figure 1). Despite not having a clear separation between the subgroups, this cladogram suggests the existence of other less evident groups. To complement the previous approach, a discriminant analysis of principal components was performed. The resulting Bayesian information criterion suggests the existence of three clearly separated groups, considering the 25 calafate accessions (Figure 3). The smaller and most clearly separated group (n = 5 accessions, from Chile Chico), already identified in the dendrogram, was separated from the remaining accessions based on the first linear discriminant, which explains most of the observed variance (95.81%). The other two groups (11 and 8 accessions) were separated according to the second linear discriminant (4.19% of the variance explained). The larger group corresponded to the accessions from Magallanes (n = 12), and the other was integrated into the remaining accessions from Aysén (n = 8). The exceptions to this separation of regionally assigned accessions were one sample collected in Puerto Tranquilo, in the Aysén region, which clustered into the Magellanic group, and, on the contrary, two samples of Magallanes that were grouped with the larger Aysén clade. Currently, there is no explanation for this, but gene flow cannot be discarded at this point. Interestingly, as shown later in this manuscript, according to chemical analyses, a single sample from Aysén also co-clustered into the Magallanes group, but the opposite was not observed (samples from Magallanes associated with the Aysén clade).
Genetic variations can be the result of a selection of genotypes that have been adapted to changing environmental conditions. Therefore, allelic differences at a given locus could be related to adaptations to those changes, which could be different from one region to the next, generating diversity among specimens of the same plant species collected from far enough regions [34]. Considering that calafate grows in extreme environmental conditions (water stress, low temperature, or wind conditions), we expected to find high allelic richness, which was confirmed with the present set of SSR markers and different statistical approaches, showing similar results. In this framework, we also expected to find two genetic groups related to their collection regions, i.e., Aysén and Magallanes, since they are separated by 1000 Km, which includes the Northern and Southern Patagonian Icefields, covering about 600 Km, representing a huge biological barrier. However, three genetic groups were found, the most clearly differentiable one corresponding to accessions from Chile Chico. This is an area in Aysén known for its warmer summer weather, anomalous to its latitude, making it prone to fruit production. Thus, this could be a case in which the environmental conditions benefit the selection of a subtype of calafate, not strictly correlated to the geographic origin of the samples. Interestingly, a high genetic flow was observed between the main collection areas in Aysén and Magallanes, represented by a low differentiation index, as revealed in the UPGMA-based cladogram and the PCA. Probably, genetic flow occurs through areas adjacent to the Patagonian Icefields, such as the Argentinian Pampa, since, in southern Chile, the Andes Mountains have a lower height, not representing a biological barrier. It would be interesting to study other wild species of Chilean Patagonia to understand the genetic dynamics of the plant genetic resources in this part of the world, as has been recently carried out for maqui berry (Aristotelia chilensis) [35], a species that grows from central Chile to Aysén, or others that better resemble the geographical distribution and physiology of calafate. Also of future interest would be the study of the gene expression levels for specific biochemical pathways related to the synthesis and accumulation of polyphenolic compounds associated with the antioxidant capabilities of these fruits, as has been recently carried out for 13 wild and cultivated berry-producing fruit crops rich in phenolics, including single samples of ripe berries for three Patagonian species—calafate (B. microphylla, called B. buxifolia), strawberry myrtle (Ugni molinae), and maqui berry (Aristotelia chilensis) [36]. If such a study were to be performed, the target would be samples of ripe berries of the three differentiable calafate groups identified in this study. Combining the gene expression and metabolite level results could orientate the selection of plants to be used in the domestication of this spiny species.

3.2. Phenolic Compound Profiles of Calafate Fruits

The anthocyanin, flavonoid, and hydroxycinnamic acid profiles of calafate fruits were studied using HPLC-DAD-ESI-MS/MS. For the anthocyanins, the obtained profiles are similar to those previously described elsewhere [6,37]. In the analyzed samples, 18 anthocyanins were detected; however, it was only possible to quantify 10 of them, corresponding to the 3-glucoside and 3-rutinoside derivatives of delphinidin, cyanidin, petunidin, peonidin, and malvidin. In all cases, the most abundant metabolites corresponded to 3-glucoside derivatives, with delphinidin-3-glucoside being the predominant anthocyanin, reaching up to 12.81 µmol g−1. The concentrations of the detected compounds ranged between 3.79 and 31.69 µmol g−1. As observed previously, anthocyanins were the most abundant phenolic compounds in the calafate berries (Table 2).
Twenty hydroxycinnamic acid derivatives were detected in the samples; however, only ten of them were quantified, corresponding to caffeoylglucaric and caffeoylquinic acid isomers. The predominant compound was 5-caffeoylquinic acid, reaching total levels between 0.32 and 7.21 µmol g−1 of these acids, respectively.
Regarding flavonols, only 11 compounds were considered for quantitative analysis, corresponding to the glycosylated derivatives of quercetin and isorhamnetin. The most abundant flavonol was quercetin-3-rutinoside, followed by quercetin-3-galactoside. The total flavonol concentrations ranged between 0.47 and 2.63 µmol g−1 in the fresh fruit.
A broad range of concentrations can be observed for each compound (Table 2). No qualitative differences among the previously reported profiles of calafate fruits from different geographic origins or different harvest years were detected. Chemometric analysis of the quantified compounds (Table 2) was performed to evaluate possible clusters among the samples from different geographical origins. The detailed data are available in the Supplementary Materials (Tables S1–S3).

3.3. Principal Component Analysis of Phenolic Compounds in Calafate Berries

Principal component analysis (PCA) was carried out, considering the individual concentrations of phenolic compounds (anthocyanins, flavonols, and hydroxycinnamic acids). The total phenols were measured as the DO at 280 nm and the antioxidant capacity was measured to determine the occurrence of spontaneous clustering among samples of the same/different geographical areas. An analysis considering only the levels of hydroxycinnamic acid derivatives was performed, but this analysis did not reveal any kind of grouping.
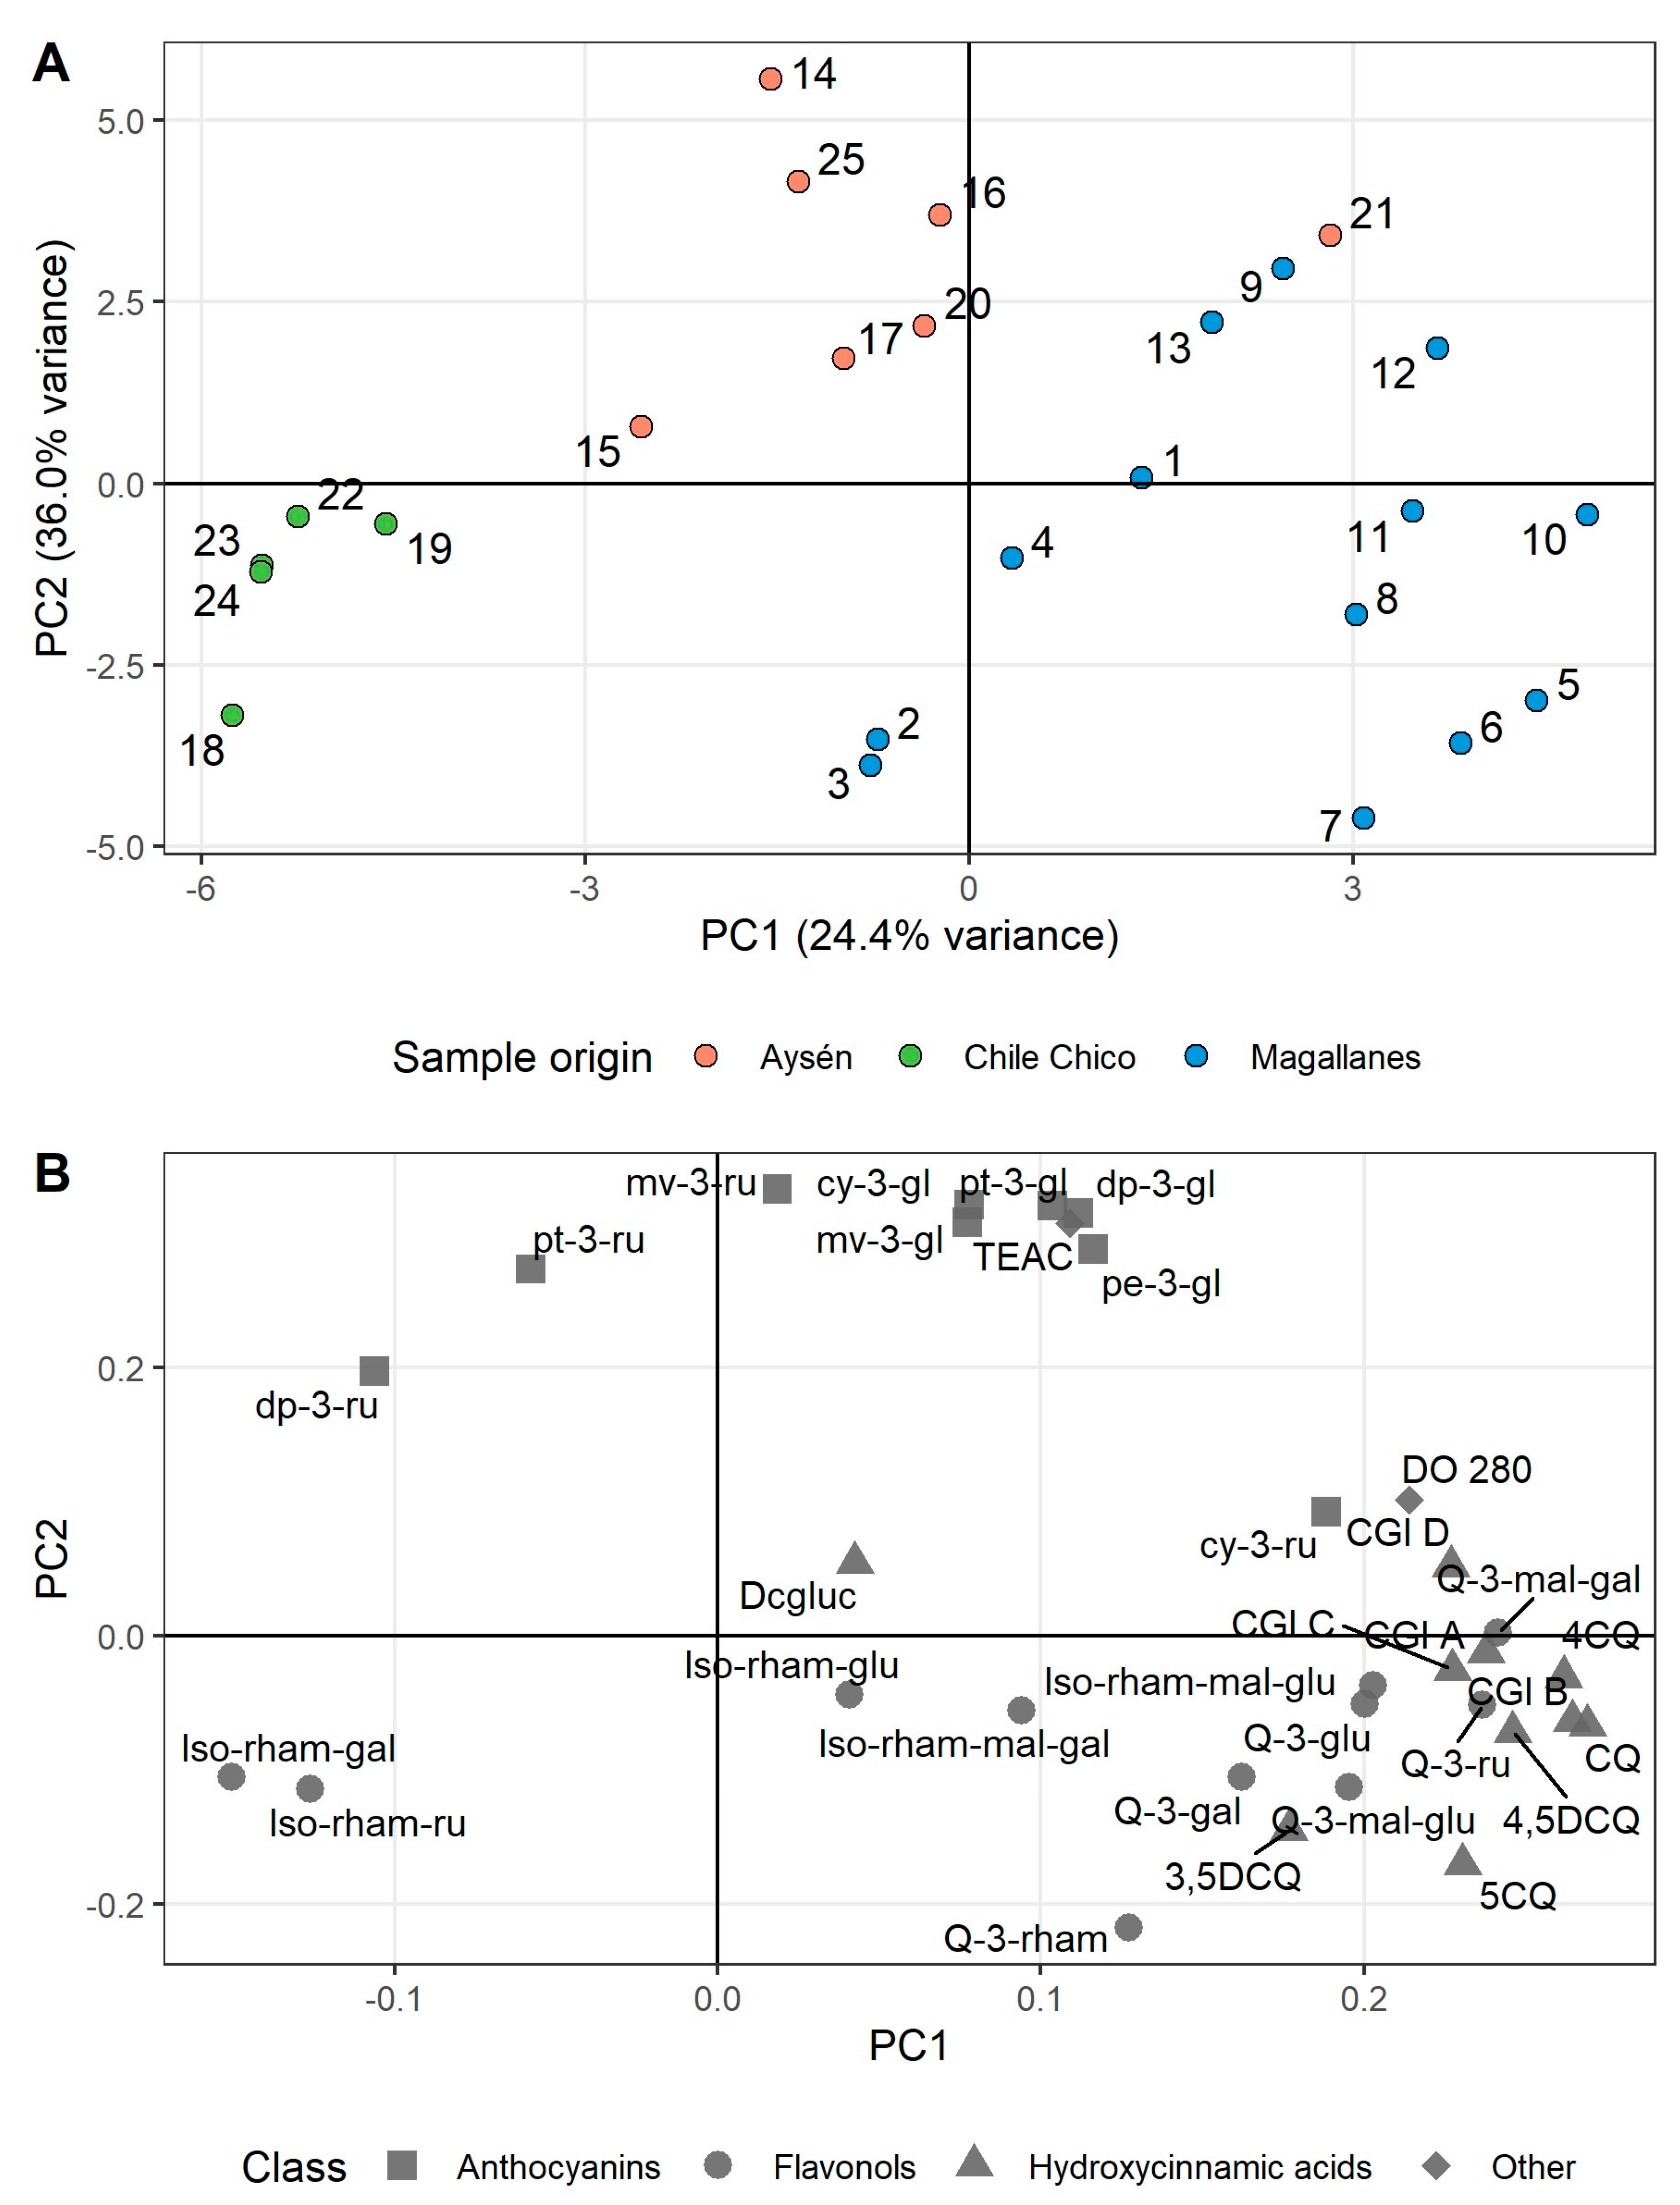
Detailed data of the origins and individual concentrations of phenolic compounds in the berry samples are included in Table S1. This classification of origin was used also for chemometric analysis of the chemical data of the berries using PCA (Figure 4), where Aysén, Chile Chico, and Magallanes showed interesting trends, with three separated clusters.
The first principal component (PC1) shows a clear separation of the samples from Magallanes (in blue) toward the right side of the component in the scores plot (see Figure 4A), diverging from the samples from the other geographical areas, except for one sample from Aysén (N° 21), which is classified together with those of Magallanes. This behavior is mainly explained by the variables coming from the hydroxycinnamic acids in the loadings plot (see Figure 4B), which also shift toward the right side of PC1. The Magallanes samples are displaced to the left side of PC1, but to a lesser extent compared to the Chile Chico samples. These samples are correlated with the variables located at the left of PC1 in the loadings plot, such as isorhamnetin–galactoside and isorhamnetin–rutinoside. Therefore, a relationship between the Magallanes samples and these flavonols exists, but is not as strong compared to the Chile Chico samples. Thus, PC1 shows a clear separation between the samples from Aysén (in red) and those from Magallanes (in blue) and Chile Chico (in green), of which the Magallanes samples are mainly influenced by HCADs and flavonols, such as quercetin and some isorhamnetin derivatives.
PC2 separates the samples from Aysén (in red) from those from Chile Chico (in green). In the samples from Chile Chico, specifically from the Ceballo, Chacra, and Aeródromo sectors (Tables S1–S3), their position is explained by a strong correlation with the flavonols isorhamnetin–galactoside and isorhamnetin–rutinoside, both flavonols with a lower concentration in the fruits (Figure 4). When looking at the loading, we clearly see that the Aysén samples are mainly characterized by their anthocyanin profiles (delphinidin-3-rutinoside and petinidin-3-rutinoside), while those from Chile Chico are characterized by their flavonols, such as some isorhamnetin glycoside derivatives.
In analyzing the loadings, the main contributors to this spontaneous clustering separation are some HCADs and flavonols (glucaric acid isomer, 5-cafeoilquinic acid, quercetin-3-galactoside, and quercetin-rhamnoside) and anthocyanins (petunidin-3-rutinoside, delfinidin-3-rutinoside, and malvidin-3-rutinoside). These results are interesting since they could be related to the maturity index of fruits, which can be affected in different modes, due to the environmental conditions of both regions (e.g., UV radiation, temperature, and wind). The maturation process affects the relationship between the concentration of HCADs/flavonols and that of anthocyanins [23]. In a complementary experiment, the levels of HCADs, flavonols, and anthocyanins were contrasted with the phenological development of calafate fruit. It was observed that there was a decrease in the total HCADs and flavonols versus an increase in anthocyanins. This maturation process could be different in both zones, which can explain what was observed in the PCA analysis. It is important to bear in mind that calafate is a wild, non-cultivated plant; therefore, its maturity is not possible to control. On the other hand, 3-glucoside derivatives of anthocyanins are highly associated with antioxidant capacity, according to the TEAC method [23,38]. Arena et al. observed a significant variability in the anthocyanin content within three populations in Tierra del Fuego Island, in Argentina [39]. At a phenological level, high climatic plasticity was observed in B. microphylla, when cultivated in Tierra del Fuego or in the Province of Buenos Aires [40]. The presented data might be useful in the domestication programs of calafate, which started in recent years [41].

4. Conclusions

The analysis of calafate accessions using 18 highly informative SSR markers evidenced an appreciable level of genetic diversity in this group of samples from Chilean Patagonia. This data set allows us to conclude that there are at least three differentiable, structured genetic groups corresponding to samples from the Aysén and Magallanes regions, plus a third group collected from Chile Chico, an area of Aysén which was, interestingly, even more divergent.
From a chemical point of view, in general, a great range of variation was observed in the studied phenolic compounds (anthocyanins, hydroxycinnamic acids, and flavonols), as they were the most abundant and contributed more to the high antioxidant capacity and great potential of calafate berries. In addition, through a PCA analysis of the individual phenolic compounds from the berries collected from Aysén, Chile Chico, and Magallanes, they showed an interesting trend with three separate groups, in a similar way, as observed with genetic analysis.
To summarize, the differentiation of calafate samples from Chilean Patagonia based on the chemical composition of the berries could be the result of intrinsic genetic differences, the influence of the climate of different regions on fruit maturity, or a combined and complex effect of both factors. Whatever the origin of these differences, all these findings should be considered when approaching the domestication of this species, by selecting individuals with desirable agronomic traits and contrasting phenotypes.

Supplementary Materials

The following supporting information can be downloaded at: https://www.mdpi.com/article/10.3390/horticulturae10050458/s1, Figure S1: Dendrogram of calafate and related Berberis species from Chile analyzed with 10 SSR markers; Table S1: Individual hydroxycinnamic acid concentrations (umol g−1) in calafate fruits, where CGI: caffeoylglucaric acid isomer, CQ: caffeoylquinic acid, Dcgluc: dicaffeoylglucaric acid isomer, DCQ: dicaffeoylquinic acid isomer, nd: not detected; Table S2: Individual anthocyanin concentrations (umol g−1) in calafate fruits, where dp: delphinidin, cy: cyanidin, pt: petunidin, pe: peonidin, mv: malvidin, gl: glucoside, ru: rutinoside, nd: not detected; Table S3: Individual flavonol concentrations (umol g−1) in calafate fruits, where Q: quercetin, Iso-rham: isorhamnetin, ru: rutinoside, mal: malonyl, gal: galactoside, glu: glucoside, nd: not detected.

Author Contributions

Conceptualization, C.M., P.H., A.R. and D.v.B.; methodology, A.R., B.V. and C.V.; data analysis, M.M. and J.A.; writing—original draft preparation, A.R. and C.M.; writing—review and editing, P.H., A.R. and D.v.B.; project administration, C.M.; funding acquisition, C.M. All authors have read and agreed to the published version of the manuscript.

Funding

This research was funded by ANID/FONDECYT Chile Regular Grants N° 1100944, N° 1230625, and a doctoral fellowship from ANID (formerly CONICYT) for A.R.

Data Availability Statement

The data presented in this study are available in the article.

Acknowledgments

Acknowledgments and thanks go to Roberto Rodríquez (RIP), Department of Botany, Faculty of Natural Resources and Oceanography of the Universidad de Concepción for his valuable collaboration in verifying the botanic identity of the collected Berberis samples.

Conflicts of Interest

The authors declare no conflicts of interest.

References

  1. Landrum, L.R. Revision of Berberis (Berberidaceae) in Chile and adjacent southern Argentina. Ann. Missouri Bot. Gard. 1999, 86, 793–834. [Google Scholar] [CrossRef]
  2. Orsi, M.C. Berbiradeceae. In Flora Patagónica; Correa, M.N., Ed.; INTA: Buenos Aires, Argentina, 1984; Section 4; pp. 325–348. [Google Scholar]
  3. Bottini, M.C.J.; De Bustos, A.; Sanso, A.M.; Jouve, N.; Poggio, J. Relationships in Patagonian species of Berberis (Berberidaceae) based on the characterization of rDNA internal transcribed spacer sequences. Bot. J. Linn. Soc. 2007, 153, 321–328. [Google Scholar] [CrossRef]
  4. Ahrendt, L.W.A. Berberis and Mahonia: A taxonomic revision. Bot. J. Linn. 1961, 57, 1–410. [Google Scholar] [CrossRef]
  5. Marticorena, C.; Rodríguez, R. Flora de Chile, 2(2) Berberidaceae-Betulaceae; Universidad de Concepción: Concepción, Chile, 2003; pp. 1–23. [Google Scholar]
  6. Schmeda-Hirschmann, G.; Jiménez-Aspee, F.; Theoduloz, C.; Ladio, A. Patagonian berries as native food and medicine. J. Ethnopharmacol. 2019, 241, 111979. [Google Scholar] [CrossRef] [PubMed]
  7. Fredes, C.; Parada, A.; Salinas, J.; Robert, P. Phytochemical and traditional use of two southernmost Chilean berry fruits: Murta(Ugni molinae Turcz) and calafate (Berberis buxifolia Lam ASS). Foods 2020, 9, 54. [Google Scholar] [CrossRef] [PubMed]
  8. Vega-Galvez, A.; Rodriguez, A.; Stucken, K. Antioxidant, functional prpoerties and health-promoting potential of native South American berries: A review. J. Sci. Food Agric. 2021, 101, 364–378. [Google Scholar] [CrossRef]
  9. García-Diaz, D.F.; Jimenez, P.; Reyes-Farias, M.; Soto-Covasich, J.; Costa, A.G.V. A Review of the potential of Chilean native berries in the treatment of obesity and its related features. Plant Foods Hum. Nutr. 2019, 74, 277–286. [Google Scholar] [CrossRef] [PubMed]
  10. Shahidi, F.; Vamadevan, V.; Young Oh, W.; Peng, H.J. Phenolic compounds in agri-food by-products. Food Bioact. 2019, 5, 57–119. [Google Scholar]
  11. Dini, I.; Grumetto, L. Recent advances in polyphenol research. Molecules 2022, 27, 8777. [Google Scholar] [CrossRef]
  12. Medda, S.; Fadda, A.; Mulas, M. Climate variables of the sites of origin and genotype influence on phenolic compounds accumulation in cultivars of Myrtus communis L. Horticulturae 2022, 8, 928. [Google Scholar] [CrossRef]
  13. Giordani, E.; Müller, M.; Gambineri, F.; Paffetti, D.; Arena, M.; Radice, S. Genetic and morphological analysis of Berberis microphylla G. Forst. accessions in southern Tierra del Fuego. Plant Biosyst. 2017, 151, 715–728. [Google Scholar] [CrossRef]
  14. Bottini, M.C.J.; De Bustos, A.; Jouve, N.; Poggio, L. AFLP characterization of natural populations of Berberis (Berberidaceae) in Patagonia, Argentina. Plant Syst. Evol. 2002, 231, 133–142. [Google Scholar] [CrossRef]
  15. Varas, B.; Castro, M.; Rodriguez, R.; von Baer, D.; Mardones, C.; Hinrichsen, P. Identification and characterization of microsatellites from calafate (Berberis microphylla, Berberidaceae). Appl. Plant Sci. 2013, 1, 1200003. [Google Scholar] [CrossRef] [PubMed]
  16. Kalia, R.; Rai, M.; Kalia, S.; Singh, R.; Dhawan, A. Microsatellite markers: An overview of the recent progress in plants. Euphytica 2011, 177, 309–334. [Google Scholar] [CrossRef]
  17. Brereton, R. Chemometrics: Data Analysis for the Laboratory and Chemical Plant; Applied Chemometrics for Scientists; John Wiley & Sons: Chichester, UK, 2007. [Google Scholar]
  18. Bosque-Sendra, J.; Cuadros-Rodriguez, L.; Ruiz-Samblas, C.; de la Mata, P. Combining chromatography and chemometrics for the characterization and authentication of fats and oils from triacylglycerol compositional data—A review. Anal. Chim. Acta 2012, 724, 1–11. [Google Scholar] [CrossRef] [PubMed]
  19. Lodhi, M.; Ye, G.N.; Weeden, N.; Reisch, B. A simple and efficient method for DNA extraction from grapevine cultivars and Vitis species. Plant Mol. Biol. Rep. 1994, 12, 6–1320. [Google Scholar] [CrossRef]
  20. Jasieniuk, M. polysat: An R Package for Polyploid Microsatellite Analysis. Mol. Ecol. Res. 2011, 11, 562–566. [Google Scholar]
  21. Yu, G. Using Ggtree to Visualize Data on Tree-Like Structures. Curr. Prot. Bioinform. 2020, 69, e9622. [Google Scholar] [CrossRef]
  22. Jombart, T.; Adegenet , A.R. Package for the Multivariate Analysis of Genetic Markers. Bioinformatics 2008, 24, 1403–1405. [Google Scholar] [CrossRef]
  23. Bustamante, L.; Pastene, E.; Duran-Sandoval, D.; Vergara, C.; von Baer, D.; Mardones, C. Pharmacokinetics of low molecular weight phenolic compounds in gerbil plasma after the consumption of calafate berry (Berberis microphylla) extract. Food Chem. 2018, 268, 347–354. [Google Scholar] [CrossRef]
  24. Ruiz, A.; Zapata, M.; Sabando, C.; Bustamante, L.; von Baer, D.; Vergara, C.; Mardones, C. Flavonols, alkaloids and antioxidant capacity of edible wild Berberis species from Patagonia. J. Agric. Food Chem. 2014, 62, 12407–12417. [Google Scholar] [CrossRef] [PubMed]
  25. Allen, J.M.; Obae, S.G.; Brand, M.H.; Silander, J.A.; Jones, K.L.; Nunziata, S.O.; Lance, S.L. Development and characterization of microsatellite markers for Berberis thunbergii (Berberidaceae). Am. J. Bot. 2012, 99, 220–222. [Google Scholar] [CrossRef] [PubMed]
  26. Ross, C.; Durka, W. Isolation and characterization of microsatellite markers in the invasive shrub Mahonia aquifolium (Berberidaceae) and their applicability in related species. Mol. Ecol. Notes 2006, 6, 948–950. [Google Scholar] [CrossRef]
  27. Gago, P.; Boso, S.; Santiago, J.-L.; Martínez, M.-C. Identification and characterization of relict olive varieties (Olea europaea L.) in the Northwest of the Iberian Peninsula. Horticulturae 2024, 10, 175. [Google Scholar] [CrossRef]
  28. González, A.V.; Gómez-Silva, V.; Ramírez, M.J.; Fontúrbel, F.E. Meta-analysis of the differential effects of habitat fragmentation and degradation on plant genetic diversity. Conserv. Biol. 2020, 34, 711–720. [Google Scholar] [CrossRef] [PubMed]
  29. Testolin, R.; Messina, R.; Cipriani, G.; De Mori, G. SSR-based DNA fingerprinting of fruit crops. Crop Sci. 2023, 63, 390–459. [Google Scholar] [CrossRef]
  30. Hartl, D.L.; Clark, A.G. Principles of Population Genetics, 2nd ed.; Sinauer Associates: Sunderland, MA, USA, 1989; p. 677. [Google Scholar]
  31. Rezaei, M.; Ebadi, A.; Reim, S.; Fatahi, R.; Balandary, A.; Farrokhi, N.; Hanke, M.V. Molecular analysis of Iranian seedless barberries via SSR. Sci. Hortic. 2011, 129, 702–709. [Google Scholar] [CrossRef]
  32. San Martino, L.; Manavella, F.A.; García, D.A.; Salato, G. Phenology and fruit quality of nine sweet cherry cultivars in South Patagonia. Acta Hortic. 2008, 795, 841–848. [Google Scholar] [CrossRef]
  33. Martínez, M. Viñateros más Australes del Mundo ya Tienen sus Primeros Vinos. WIP 2023. Available online: https://wip.cl/vinateros-mas-australes-del-mundo-ya-tienen-sus-primeros-vinos (accessed on 27 February 2024).
  34. Fitzgerald, T.L.; Shapter, F.M.; McDonald, S.; Waters, D.L.E.; Chivers, I.H.; Drenth, A.; Nevo, E.; Henry, R.J. Genome diversity in wild grasses under environmental stress. Proc. Natl. Acad. Sci. USA 2011, 108, 21140–21145. [Google Scholar] [CrossRef]
  35. Cona, M.; Chávez, A.; León-Lobos, P.; Marín, J.C.; Hinrichsen, P. Genetic structure and north-south decrease of genetic diversity in the Patagonian maqui berry (Aristotelia chilensis [Molina] Stuntz): Implications for its conservation and use. Conserv. Genet. 2023, 24, 693–705. [Google Scholar] [CrossRef]
  36. Thole, V.; Bassard, J.E.; Ramírez-González, R.; Trick, M.; Afshar, B.G.; Breitel, D.; Hill, L.; Foito, A.; Shepherd, L.; Freitag, S.; et al. RNA-seq, de novo transcriptome assembly and flavonoid gene analysis in 13 wild and cultivated berry fruit species with high content of phenolics. BMC Genom. 2019, 20, 995. [Google Scholar] [CrossRef] [PubMed]
  37. Chamorro, M.; Reiner, G.; Theduloz, C.; Ladio, A.; Schmeda-Hirschmann, G.; Gómez-Alonso, S.; Jimenez-Aspee, F. Polyphenol composition and (bio)activity of Berberis species and wild strawberry from the Argentinean Patagonia. Molecules 2019, 24, 3331. [Google Scholar] [CrossRef] [PubMed]
  38. Rodarte-Castrejon, A.D.; Eichholz, I.; Rohn, S.; Kroh, L.W.; Huyskens-Keil, S. Phenolic profile and antioxidant activity of highbush blueberry Vaccinium corymbosum L. during fruit maturation and ripening. Food Chem. 2008, 109, 564–572. [Google Scholar] [CrossRef]
  39. Arena, M.E.; Giordani, E.; Bustamante, G.; Radice, S. Variability in fruit traits and anthocyanin content among populations of underutilized Patagonian species Berberis microphylla G. Forst. J. Berry Res. 2021, 11, 33–50. [Google Scholar] [CrossRef]
  40. Radice, S.; Alonso, M.; Arena, M.E. Berberis microphylla: A Species with Phenotypic Plasticity in Different Climatic Conditions. Int. J. Agric. Biol. 2018, 20, 2221–2229. [Google Scholar]
  41. Pinto-Morales, F.; Retamal-Salgado, J.; López, M.D.; Zapata, N.; Vergara-Retamales, R.; Palma, D. Variation in Physical-Chemical Parameters and Phenolic Compounds in Fruits of Four Calafate Clones. Agronomy 2022, 12, 2146. [Google Scholar] [CrossRef]
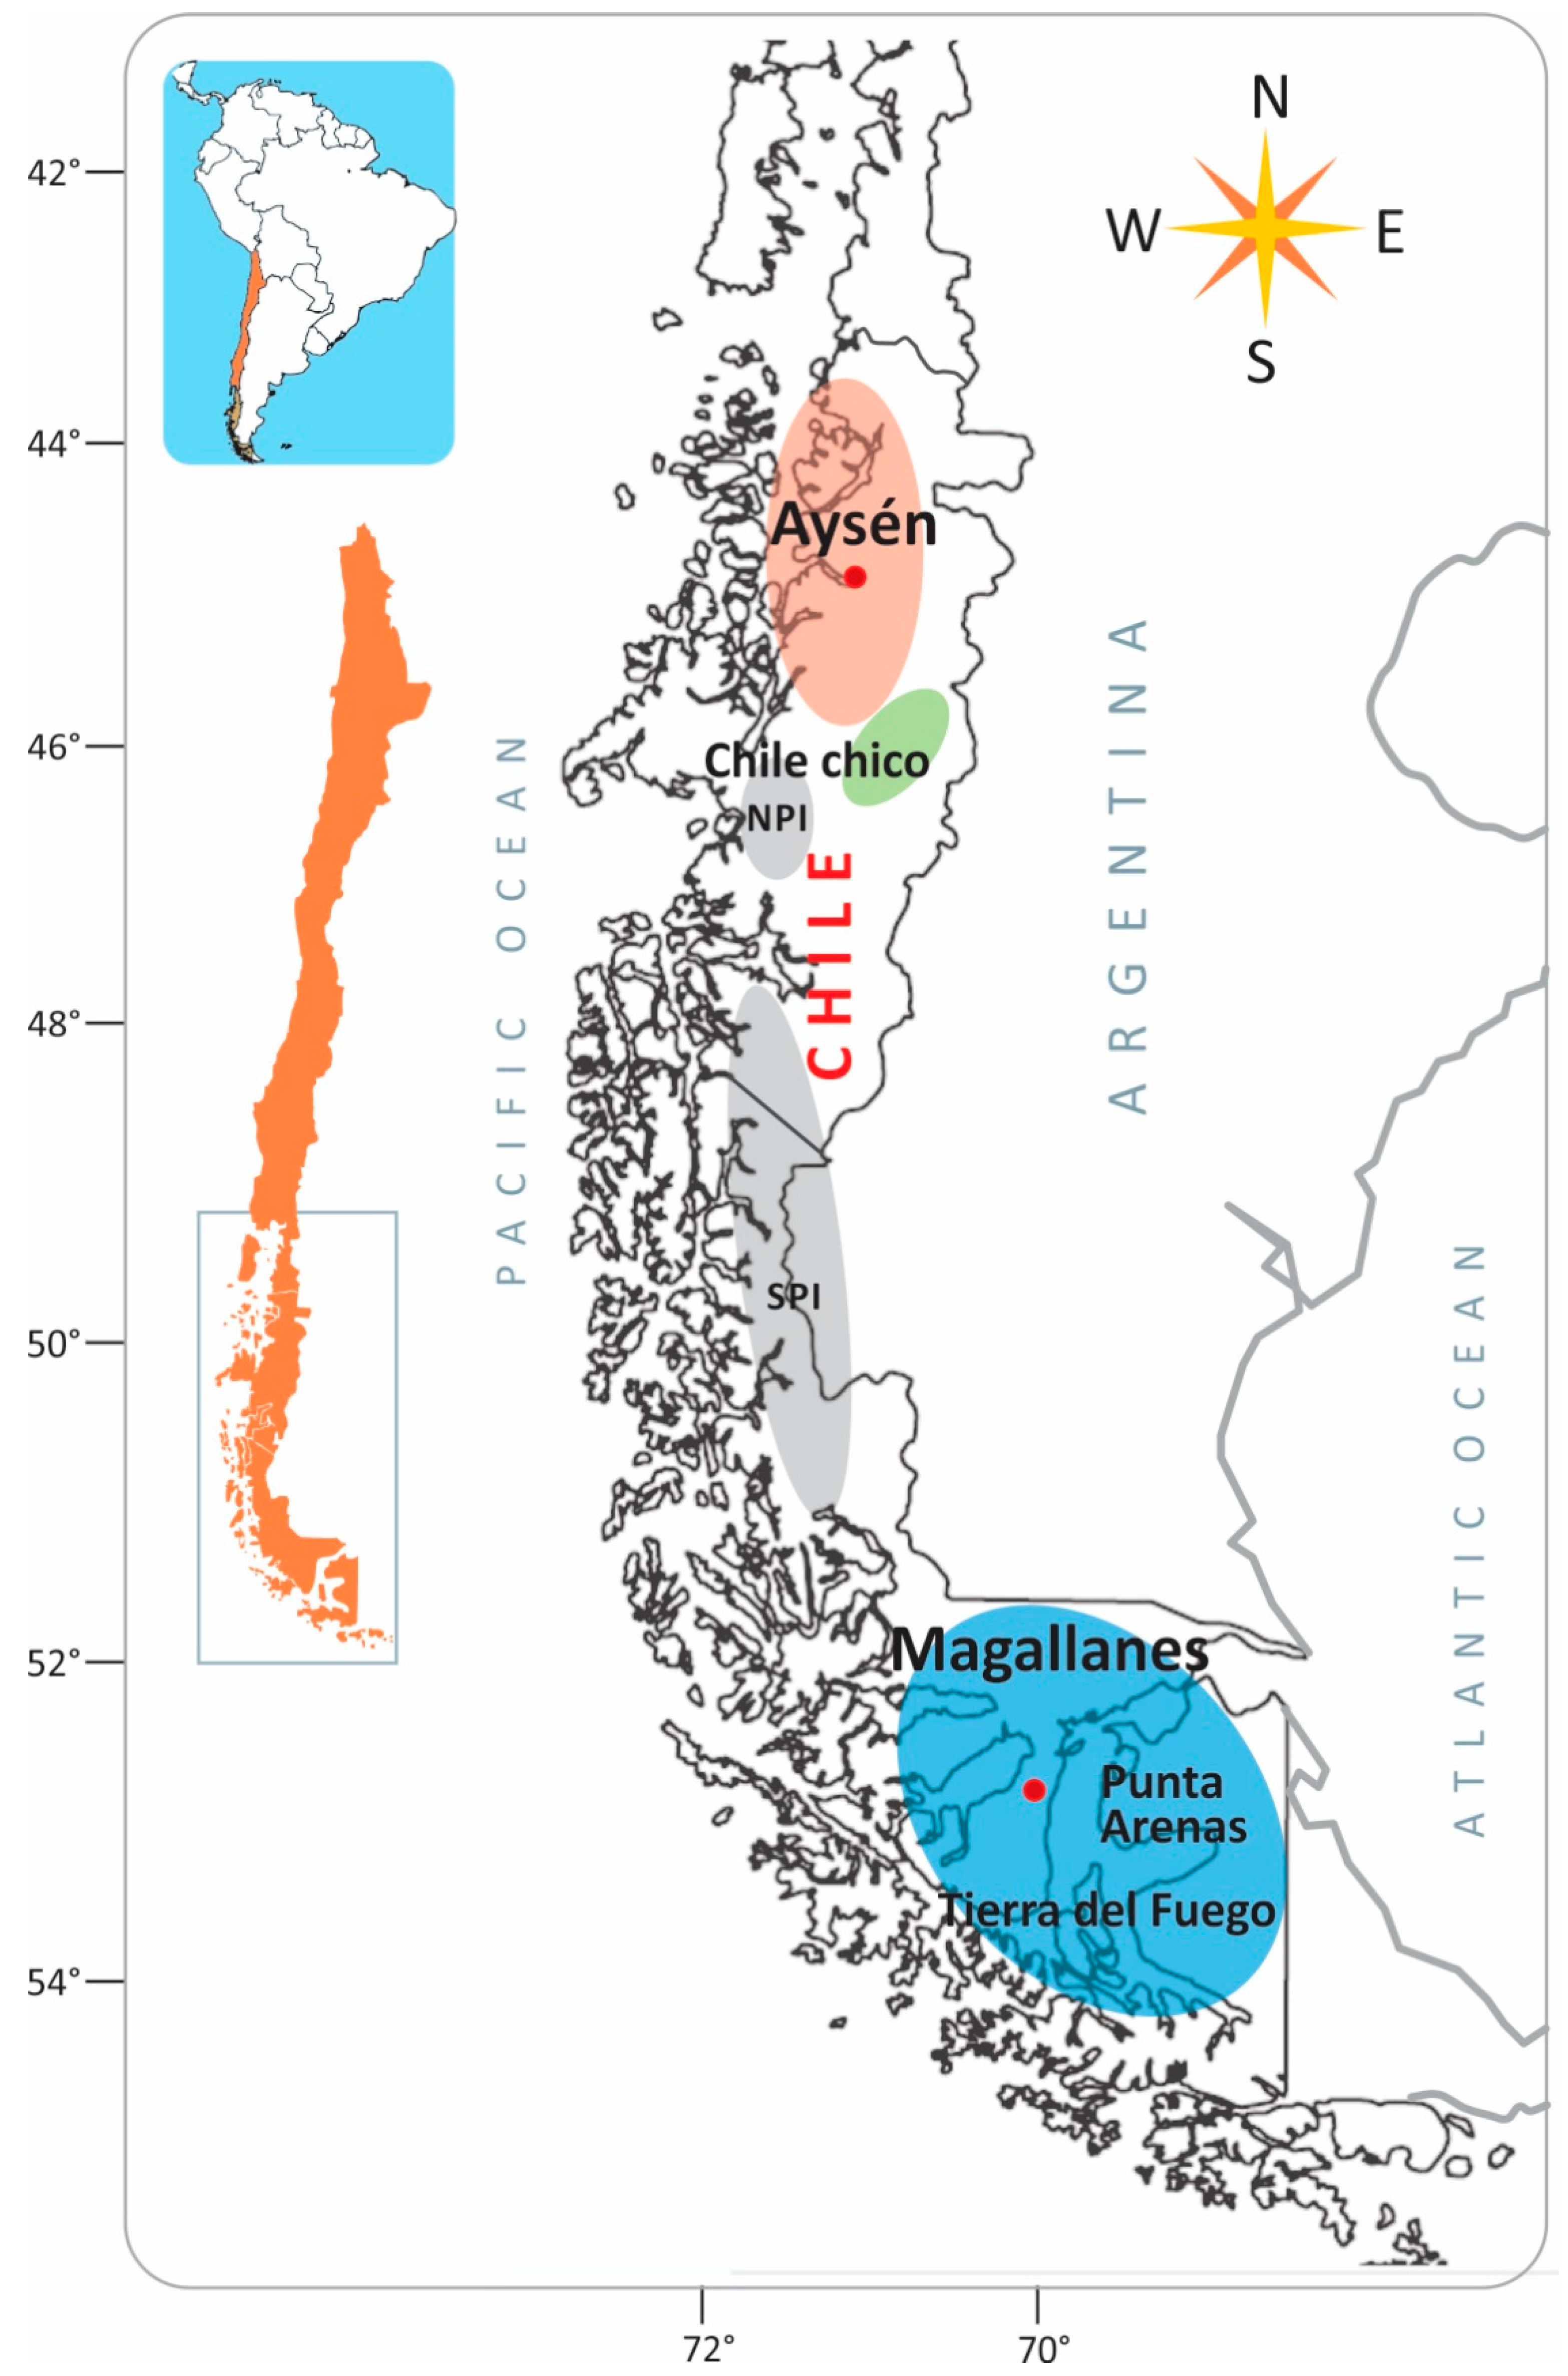
Figure 1. Calafate sample collection areas in Chilean Patagonia. Approximate Aysén (red) and Magallanes (blue) sampling regions are shown. Chile chico is part of the Aysén region; however, it exhibits a different climatic condition (green oval). NPI and SPI (grey) are the approximate areas covered by the Northern and Southern Patagonian Icefields.
Horticulturae 10 00458 g001
Figure 2. Dendrogram of calafate samples from the Aysén (red dots) and Magallanes (blue dots) regions in Chilean Patagonia. The samples labeled with green dots are from Chile Chico (southern area of Aysén). The dendrogram was constructed using the unweighted pair group method with arithmetic mean (UPGMA) with the Euclidean genetic distances calculated from 18 SSR markers. The samples’ origins are indicated in the legend at the top left side of the dendrogram.
Horticulturae 10 00458 g002
Figure 3. Linear discriminant analysis (LDA) based on the SSR data showing the genetic differentiation of the calafate samples collected from the Aysén (red), Chile Chico (green), and Magallanes (blue) regions, Chilean Patagonia. The top right inserts are (A) the cumulative variance explained by principal components (a total of 25 were retained to perform the DAPC) and (B) the value of the Bayesian information criterion (BIC) versus the number of clusters, with the lowest value corresponding to the most probable scenario. In our case, we assumed three groups, although two groups were also probable.
Horticulturae 10 00458 g003
Figure 4. Principal component analysis of calafate fruit, where (A) scores: Aysén (red), Chile Chico (green), and Magallanes (blue); (B) loadings. Abbreviations of compounds are specified in Table 2. Families of compounds (anthocyanins, flavonols, and hydroxycinnamic acids) are indicated using different symbols.
Horticulturae 10 00458 g004
Table 1. Statistical parameters of the 18 SSRs applied to the calafate samples collected in the Aysén and Magallanes regions, Chilean Patagonia.
SSR Marker 1A 2AeHeHoCjGenBank Accession No.
BmLP05 *53.3080.6980.920.273JX481194
BmLP0753.1860.6860.960.285JX481196
BmLP09 *63.3770.7041.000.267JX481198
BmLP11 *52.8080.6440.560.329JX481200
BmLP19.2 *62.6160.6180.680.356JX481207
BmLP26 *43.6840.7290.800.241JX481214
BmLP3062.6540.6230.800.351JX481218
BmLP3683.7690.7350.920.235JX481224
BmLP3873.3660.7030.840.268JX481226
BmLP39 *41.3370.2520.240.738JX481227
BmLP4662.4200.5870.520.389JX481234
BmLP49 *53.5910.7220.560.248JX481238
BmLP5321.7130.4160.240.566JX481241
BmLP5474.9310.7971.000.170JX481243
BmLP58.2 *31.7640.4330.600.549JX481248
BmLP59 *63.6310.7250.840.245JX481249
BmLP65 *124.7780.7910.960.176JX481255
BmLP71114.7020.7871.000.180JX481261
Mean6 ± 2.473.202 ± 1.0250.647 ± 0.1450.747 ± 0.2460.326 ± 0.151
1 *: SSRs used for the preliminary study of the larger set of Chilean Berberis spp.; 2 A: the no. of alleles per marker; Ae: the effective number of alleles; He: the expected heterozygosity, Ho: the observed heterozygosity, Cj: the theoretical probability of the confusion of genotypes.
Table 2. Concentrations of phenolic compounds in calafate berries (µmol/g fresh weight).
Phenolic Compound ClassCompoundAbbreviationConcentration Range * (µmol/g)
AnthocyaninsDelphinidin-3-glucosideDp-3-glu1.50–12.21
Delphinidin-3-rutinosideDp-3-ru0.25–1.57
Cyanidin-3-glucosideCy-3-glu0.35–1.88
Cyanidin-3-rutinosideCy-3-run.d.–0.37
Petunidin-3-glucosidePt-3-glu0.68–7.64
Petunidin-3-rutinosidePt-3-ru0.04–1.92
Peonidin-3-glucosidePe-3-glun.d.–0.88
Peonidin-3-rutinosidePe-3-run.d.–0.10
Malvidin-3-glucosideMv-3-glu0.31–7.29
Malvidin-3-rutinosideMv-3-ru0.12–1.06
FlavonolsQuercetin-3-rutinosideQ-3-ru0.07–0.74
Quercetin-3-galactosideQ-3-gal0.04–0.71
Quercetin.3-glucosideQ-3-glu0.03–0.22
Quercetin-3-malonylgalactosideQ-3-mal-galn.d.–0.11
Quercetin-3-malonylglucosideQ-3-mal-glun.d.–0.49
Isorhamnetin-3-rutinosideIsorham-3-run.d.–0.43
Isorhamnetin-3-galactosideIsorham-3-galn.d.–0.17
Quercetin-3-rhamnosideQuer-3-rhamn.d.–0.58
Isorhamnetin-3-glucosideIsorham-3-glun.d.–0.06
Isorhamnetin-3-malonylgalactosideIsorham-3-mal-galn.d.–0.13
Isorhamnetin-3-malonylglucosideIsorham3-mal-glun.d–0.12
Hydroxycinnamic acidsCaffoeoyl glucaric acid isomer A CGI A0.02–1.07
Caffoeoyl glucaric acid isomer BCGI B0.06–1.88
Caffoeoyl glucaric acid isomer CCGI C0.06–1.25
Caffoeoyl glucaric acid isomer DCGI D0.02–0.29
Caffeoyquinic acidCQ0.02–0.51
5-Caffeoylquinic acid5-CQ0.04–2.33
4-Caffeoylquinic acid4-CQ0.03–0.38
Dicaffeoylglucaric acidDCglucn.d.–0.67
3,5-dicaffeoylglucaric acid3,5-DCQ0.02–0.64
4,5-dicaffeoylglucaric acid4,5-DCQn.d–0.81
* n.d. = not detected.
Disclaimer/Publisher’s Note: The statements, opinions and data contained in all publications are solely those of the individual author(s) and contributor(s) and not of MDPI and/or the editor(s). MDPI and/or the editor(s) disclaim responsibility for any injury to people or property resulting from any ideas, methods, instructions or products referred to in the content.