Abstract
Mangosteens can develop a postharvest physiological disorder, called “hardening”, which affects their marketability and is not detectable using visual inspection. The hardening disorder of mangosteens was determined by firmness value using the texture analyzer. Near-infrared hyperspectral imaging (NIR-HSI) in the region of 935–1720 nm was tested as a possible rapid and non-destructive method to detect this disorder. The spectra from a region of interest of mangosteens were acquired and used for analysis. Calibration models for firmness of a similarly sized group and a mixed-size group were established using partial least squares regression (PLSR) and support vector machine regression (SVMR). Chemometric algorithms were investigated in order to determine the optimal conditions for establishing the models for firmness. The optimum model was obtained when the fruit were graded into similarly sized groups. Using partial least squares regression (PLSR), the correlation coefficient of prediction (Rp) was 0.87 and the root mean square error of prediction (RMSEP) was 6.25 N. The predictive images for firmness of the fruit were created by interpreting predicted firmness visualized as colors in every pixel. From the data, it was concluded that NIR-HSI can potentially be used to visualize hardening of individual mangosteens based on their predictive images.
1. Introduction
Mangosteen (Garcinia mangostana L.) is a popular tropical climacteric fruit and has been called the “Queen of the tropical fruit” because of its attractive taste [1]. It is grown commercially in many tropical areas, including in Thailand, Indonesia, Vietnam, Malaysia and Philippines, with global exports of about 2.3 million tonnes in 2023 [2]. The export price can fluctuate considerably, but it is among the most expensive fruits on export markets (in 2023 it peaked at $1870 per tonne) [2]; therefore, a real-time sorting system for monitoring quality would be a major contributor to the export industry.
Harvest maturity is judged on its pericarp color and the following color stages have been identified and are used commercially: stage I (green color), stage II (occurrence of red lines color: the so-called “blood-lines”), stage III (pink color), stage IV (reddish-brown color), stage V (dark red/red purple color) and stage VI (deep purple color) [3]. For optimum quality, mangosteens are harvested at stage III and usually eaten when they have ripened to stage IV. Three major disorders of mangosteen fruits, “hardening”, “translucent flesh” and “gamboge”, cannot be detected by visual inspection and can result in fruit being rejected on export markets or by consumers.
Hardening can be a result of dropping the fruit or other mechanical forces during harvest and handling, resulting in the induction of lignin biosynthesis [4], which can increase during storage [5]. Lignification is a normal process of plant defense when physical injury occurs to tissue [6], which can make plant tissue harden at the point of impact, resulting in greater rigidity of the pericarp [7,8]. Also, moisture loss of the impacted pericarp can increase [9], increasing the strength of pericarp tissue [10]. The severity of fruit hardening increases during storage [11], and the fruit can eventually become very hard and may create a risk of serious injury by accident to consumers when the fruit are being prepared for eating by cutting them open with a knife. There is no visual way of detecting whether an individual fruit has hardened. Hardened fruit are commonly discarded. Therefore, a nondestructive method, which could be used to detect individual mangosteens with the physiological disorder of “hardening” in real-time in an online grading system would be a major asset to the export industry.
A simple method of quickly and reliably detecting whether fruit has hardened would be a major help to the mangosteen industry, especially for fruit destined for export. A possible method to achieve this is by using hyperspectral imaging (HSI). HSI is a technique that is rapid, non-destructive and combines conventional spectroscopy and imaging techniques in order to acquire both spectral and spatial information in order to predict certain qualities of products [12]. HSI has been successfully used in the detection of characteristics of a range of fresh produce, including: detecting fecal contamination of apples [13], predicting ripeness of tomatoes [14], assessing bruises of apples [15], predicting soluble solids content of apples [16], assessing chilling damage in cucumbers [17,18], detecting bloating damage in pickles [19], detecting bitter pit in apples [20], predicting soluble solids content of apples and blueberries [21], predicting the maturity of bananas [22], assessing the stage of maturity of blueberries [23], detecting damage to the pericarp of ‘Manila’ mangoes at different stages of ripeness [24], detecting crack defect in jujube [25], detecting fungal infection in citrus fruit [26], assessing quality of dried figs [27], predicting quality maturity index of limes [28], predicting internal constituents of fennel heads [29], assessing freshness of hens’ eggs [30], detecting the shelf life of cakes [31], assessing moisture content in okra [32], detecting adulteration in tapioca starch [33], detecting nutshells in cumin powder [34], measuring the quality in longans [35], determining of the TVB-N and TVC in chicken [36], identifying adulterated chickpea flour [37], assessing nitrite content in Vienna sausages [38] and detecting the maturity of pineapples [39]. Near-infrared hyperspectral imaging (NIR-HSI) has previously been used for non-destructive measurement of textural characteristics of apples [40], bananas [41], persimmons [42] and grapes [43]. The objective of this research was, therefore, to test the feasibility by using NIR-HSI as a rapid and non-destructive technique for detecting the degree of hardening of individual mangosteens, for which no previous reports could be found on the subject.
2. Materials and Methods
2.1. Sample Preparation
Commercial grade mangosteens, with no visible defects, were purchased from an orchard in Thailand. Based on their external skin color, all the fruit were judged to be of the reddish-brown maturity stage. They were cleaned and carefully packed and transported to the laboratory at King Mongkut’s Institute of Technology Ladkrabang (KMITL) in Bangkok. The fruit were manually graded by weight into groups: more than 125 g, 101–125 g, 76–100 g, 55–75 g and 30–55 g, and each group was allocated a size number of 1, 2, 3, 4 and 5, respectively, as described by codex standard for mangosteens (Codex Stan 204-1997) [44].
2.2. NIR-HSI Acquisition
A push-broom reflectance NIR-HSI imaging system (FX17e, Spectral Imaging Ltd., Oulu, Finland) with a line scan camera (Specim, Spectral Imaging Ltd., Oulu, Finland) at a scanning speed of 15 mm/s in the wavelength range of 935–1720 nm with a size of 640 × 846 pixels, 224 spectral bands at spectral interval of 3.5 nm, the integration time of 5 ms and an illumination unit consisting of six tungsten halogen lamps was used in this study. During each scan, the sample was moved on a scanner tray (Figure 1). Black and white references were used for NIR-HSI acquisition. The black reference was taken when the lid of the camera was covered and the shutter was closed. The white reference was taken by scanning a spectral on bar for every measurement. The acquired image in every pixel can be represented by the two-dimensional spatial information and the one-dimensional spectral information. Each sample was scanned at a horizontal position parallel to the stem-calyx axis.
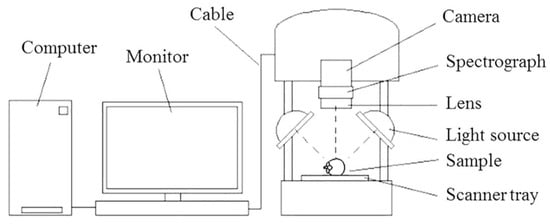
Figure 1.
Near-infrared hyperspectral imaging system.
2.3. Firmness Measurement
The relationship between the size of each sound mangosteen and its firmness was studied. The firmness of sound mangosteens of different sizes of the same maturity stage was investigated. The mangosteens that were judged to be at the maturity stage IV (reddish-brown) were arranged into their five different size groups (numbered from 1 to 5) based on the standard provided by the codex standard for mangosteens (Codex Stan 204-1997) [44]. The firmness of each fruit was determined using a texture analyzer (TA xt plus), and the number of sound mangosteens was 50 samples, which were used for consideration of the different sizes of mangosteen. The TA xt plus was fitted with a 2 mm diameter cylindrical plunger and applied at a speed of 10 mm/s to a depth of 5 mm into the skin of each fruit.
Since hardness of mangosteens can be initiated by impact, the degree of hardening of mangosteens can be measured by dropping individual fruit onto a hard surface from different heights, as described by Ketsa and Koolpluksee [4]. Dropping was performed from different heights in order to determine the variation in severity of the hardening disorder on the pericarp of the mangosteens. For this, the texture value of impacted samples could be related to the height of drop based on the severity of the hardening disorder. The distribution of texture values from low to high levels of hardening was required in order to establish the model. The number of samples used for the dropping experiment was 560, of which 280 were from the group of size 3, as well as 280 from the mixed-size group of size 3 and 4. The height of the drop varied from 50 to 100 cm onto a cement floor. Each fruit was dropped in such a way that its calyx was horizontally orientated so that the area of impact was consistent. The floor was covered with talcum powder and, after impact, talc residue marked the place of impact on the surface of the fruit (Figure 2). The fruit from the group of sound fruit were not dropped to act as a control. All samples were stored for 24 h at 25 °C and the talc on each fruit was removed before spectral acquisition and firmness measurements. For the mangosteens that had been dropped, the position of the impact point was placed at the top-center in the NIR-HSI system. Directly after scanning, the firmness of each fruit was measured at the impacted area using the texture analyzer.
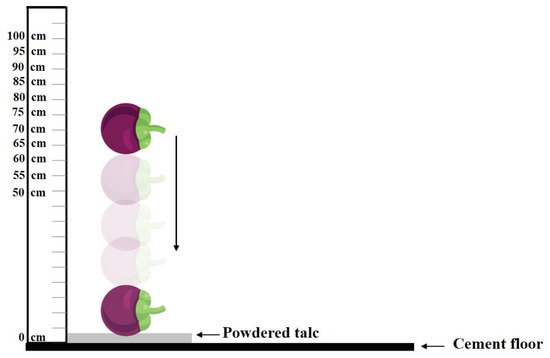
Figure 2.
Schematic drawing of the sample presentation for creating hardening mangosteen.
3. Data Analysis
In order to determine the relationship between firmness of sound mangosteens and their size, the data from the firmness of different sizes (1 to 5) of the same maturity stage (reddish-brown) were statistically analyzed using the Duncan’s Multiple Range Test. The flow diagram of the process for establishing the model for firmness of mangosteen by near-infrared hyperspectral imaging is shown in Figure 3.
The spectral data from NIR-HSI of each mangosteen in the region of interest (ROI), a window of 100 × 100 pixels, at the same point of the firmness measurement were used for quantitative analysis in order to predict its firmness. The spectral data from the ROI of sound fruit and fruit with the different heights of drop were carried out. To achieve this, the ROI at random sides of sound mangosteen and the ROI at the position of impact area of dropped fruit were used. Each pixel in the ROI of the hyperspectral image contained the spectral information of the sample. The average of the spectral data in the wavelength over the range of 935–1720 nm inside the ROI of each sample were calculated, thus giving the average spectral information related to firmness in each ROI of each fruit. The firmness values from the texture measurements could influence the characteristics of the acquired spectra; therefore, the firmness value and the spectral data of each sample from the ROI were used as the representative data for establishing the model. Samples were divided at random into a calibration set and a prediction set, where the distribution of firmness in both sets was similar. Using the calibration set in order to obtain the optimum conditions for quantitative analyses, spectral pretreatments, based on a chemometric algorithms Savitzky–Golay smoothing, Savitzky–Golay derivative, multiplicative scatter correction (MSC) and standard normal variate transformation (SNV), were determined using the method described by Feng and Sun [45].
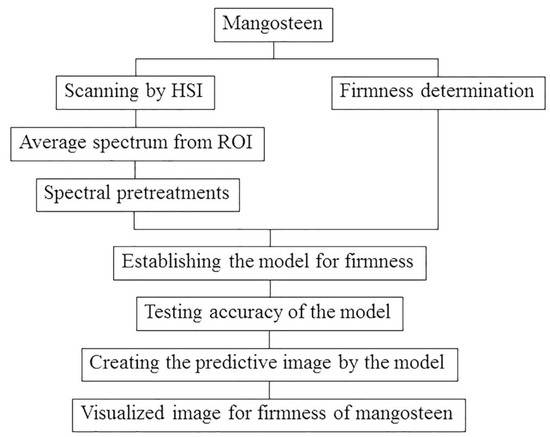
Figure 3.
Research methodology flow chart for detecting firmness of mangosteen by near-infrared hyperspectral imaging.
PLSR and SVMR were used for establishing the calibration models for firmness, which were then cross-validated. The samples in the calibration set were used in this analytical process. Statistical data, based on the low root mean square error of cross-validation (RMSECV) and high Rcv were used in order to select each optimum calibration model, as previously described [46,47]. The accuracy of the calibration models was tested using the samples in the prediction set. The results of accuracy were evaluated by using Rp and RMSEP. To create the image of firmness, spectral data at each pixel from the hyperspectral imaging were used. The calibration model was applied to each pixel of hyperspectral imaging in order to establish the predictive image to predict the firmness of each sample [48]. The predictive image for firmness was interpreted and displayed in different colors, which related to a linear color scale that was developed to describe different levels of firmness in each point on the surface of mangosteen. This enabled the predictive image to show the distribution of firmness, as well as the different levels of firmness, which were visualized in different colors from point to point of the predictive image. Predictive images of samples of both sound and hardened mangosteens were used for comparison based on firmness.
For statistical analysis, the UmBio Evince hyperspectral image analysis software (Prediktera Evince, version 2.7.9, Umea, Sweden) and the Unscrambler X (CAMO, version 10.4, Oslo, Norway) were used.
4. Results and Discussion
The relationship between firmness and size (1, 2, 3, 4 and 5) of sound mangosteens indicates that the bigger fruit were less firm (Table 1), which has been previously described for other fruit, including apples [49,50,51]. This effect was explained by the fact that larger fruit have larger cells, lower cell packing and more intercellular airspaces, which can affect their physical and chemical attributes [52,53]. However, this relationship has been shown to vary between cultivar of the same species, as well as environmental and soil conditions [54,55].
In order to test the possibility that fruit size might affect the accuracy of the models for firmness, a comparison of the models from the different groups of mangosteen samples that were the models from similarly sized samples and differently sized samples was evaluated. For demonstrating the efficacy and practicality of this method, the number of samples in both groups with the same size (N = 280) was used for establishing the models for comparison. For this, two groups of samples were used—a similarly sized group of size 3 (group A) and a mixed-size group of size 3 and 4 (group B). The number of samples in the calibration set for both group A and group B was 196, and for the prediction set for both group A and group B, the number was 84. The firmness of the samples from group A varied between 4.51 and 48.55 N and for group B between 3.82 and 49.87 N. The standard deviations of firmness in the calibration set and the prediction set were considered to ensure the results of the model’s performance. The uniform distribution firmness of the samples in the calibration set and the prediction set were quite similar in group A (11.99 and 12.28 N) and in group B (11.84 and 11.56 N), respectively (Table 2).

Table 1.
The firmness of sound mangosteens of different sizes but of the same maturity.
Table 1.
The firmness of sound mangosteens of different sizes but of the same maturity.
| Size | Weight per Fruit (g) | Number of Samples | Firmness (N) |
|---|---|---|---|
| 1 | >125 | 10 | 8.61 ± 1.61 b |
| 2 | 101–125 | 10 | 9.49 ± 0.86 ab |
| 3 | 76–100 | 10 | 10.04 ± 1.32 ab |
| 4 | 55–75 | 10 | 10.50 ± 1.31 ab |
| 5 | 30–55 | 10 | 13.44 ± 9.46 a |
Firmness values are given as means ± standard deviation. Where values are followed by the same letter, they were not significantly different (p ≤ 0.05) using the Duncan’s Multiple Range Test.

Table 2.
Firmness of samples of group A and group B in the calibration set and the prediction set in the wavelength range of 935–1720 nm.
Table 2.
Firmness of samples of group A and group B in the calibration set and the prediction set in the wavelength range of 935–1720 nm.
| Group | Number of Samples | Data Set | Range (N) | Mean (N) | SD (N) |
|---|---|---|---|---|---|
| A | 196 | calibration set | 4.51–48.55 | 16.42 | 11.99 |
| 84 | prediction set | 4.91–47.29 | 16.71 | 12.28 | |
| B | 196 | calibration set | 3.82–49.87 | 14.91 | 11.84 |
| 84 | prediction set | 4.53–44.79 | 14.97 | 11.56 |
SD = standard deviation, group A = a group of size 3, group B = a mixed-size group of size 3 and 4.
The average spectral data in the region of 935–1720 nm from the ROI of samples from both groups were obtained in order to consider the spectrum of the mangosteens (Figure 4). The results showed that spectra of both groups contained the main absorbance peaks at around 970, 1200 and 1450 nm. Since these are the absorption peaks of water [56], it indicates that the peaks of water have more influences on the spectrum than other components. This is clearly because water is the main component in mangosteens.
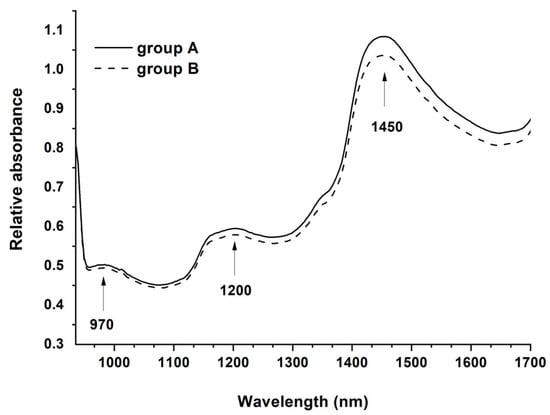
Figure 4.
Average absorbance spectra of mangosteens from groups A and B.
In order to achieve the optimum calibration model, spectral pretreatments for firmness using PLSR (Table 3) and the optimum calibration model for firmness by SVMR (Table 4) were investigated. The smallest values of RMSECV (6.74 and 7.07 N) and the highest values of Rcv (0.83 and 0.80) obtained using the PLSR models were considered the optimal conditions for group A and group B, respectively. In order to avoid underfitting or overfitting of the model, the graph of RMSECV versus the latent variables was tested. For this, the latent variables at the point of lowest RMSECV were selected. The original spectra and the SNV spectral pretreatment were obtained, giving the best results with the latent variables of 11 for group A and 7 for group B, respectively. They were, therefore, selected for establishing the calibration models using PLSR. The PLSR models for both group A and group B were then used for testing the samples in the prediction set. The accuracies of the prediction sets, obtained by considering the root mean square error of prediction (RMSEP), were 6.25 for group A and 6.50 N for group B (Table 5).

Table 3.
Results of spectral pretreatments for the partial least squares regression calibration model for firmness in the calibration set.

Table 4.
Results of spectral pretreatments for the support vector machine regression calibration model for firmness in the calibration set.

Table 5.
Accuracy of the partial least squares regression calibration model for predicting firmness in the wavelength range of 935–1720 nm.
The lowest values of RMSECV (7.57 and 7.98 N) and the highest values of Rcv (0.78 and 0.75) by SVMR models were considered the optimal conditions for group A and group B, respectively. The best results for both group A and group B were from the Savitzky–Golay first derivative differentiation spectral pretreatment. They were, therefore, selected for establishing the calibration models by SVMR. The SVMR models for group A and group B were performed and used for testing the samples in the prediction set. The root mean square error of prediction (RMSEP) levels were 7.83 and 7.92 N for group A and group B, respectively (Table 6).

Table 6.
Accuracy of the support vector machine regression model for predicting firmness in the wavelength range of 935–1720 nm.
The scattered plots of actual firmness versus the predicted firmness using the PLSR models for group A (Figure 5a) and group B (Figure 5b) showed that the accuracy of firmness predictions using the PLSR model for group A and group B were different. Also, the scattered plots of actual firmness versus the predicted firmness using the SVMR model for group A and group B for firmness were also different (Figure 6a,b).
The results showed that the accuracies of both PLSR and SVMR models for group B were lower when compared with group A. This indicated that the model was more accurate when it was created from samples of similar sizes and the model would be lower when using mixed sizes of fruit. These results support those of Ozaki et al. [57], who showed that different sizes of samples that were scanned using NIR spectroscopy can influence on the spectra.
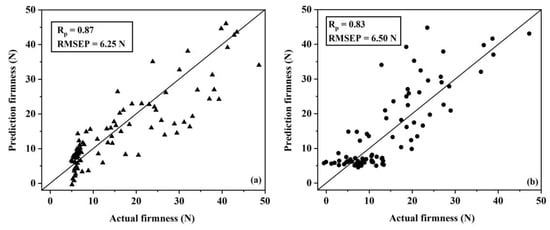
Figure 5.
Scattered plots of the actual firmness versus the predicted firmness in the prediction set of group A (a) and group B (b) partial least squares regression calibration models.
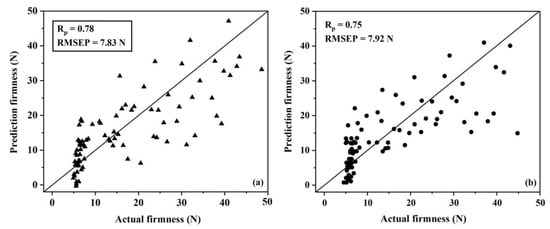
Figure 6.
Scattered plots of the actual firmness versus the predicted firmness in the prediction set of group A (a) and group B (b) using support vector machine regression models.
The PLSR model from group A was used to create the predictive images since it was shown to provide the best model. The accuracy of the acquired model for firmness in this study was accepted when compared with previous reports for the models on apples and pears [58,59,60,61]. The side of the sound fruit and also the side of the impacted area of damaged fruit were used for creating predictive images. The predictive images with different colors of samples (Figure 7) showed that the colors based on firmness were different for the damaged areas compared to the undamaged areas, indicating that the predicted degree of hardening of individual mangosteens was related to the spectral data in each pixel. The averaged firmness value that was calculated from each pixel from each predictive image was presented above each mangosteen image. The samples that had been impacted to create the hardening showed yellow and red at the impacted areas, while the non-impacted samples showed light blue and blue all over the fruit. The colors of the images based on firmness generally changed from blue to red as the degree of hardening increased. The predictive images clearly showed different colors within the image, indicating that the degree of the hardening of the mangosteens could be classified by their yellow to red colors based on the linear color scale, while those that had not been damaged could be classified by their blue color. Therefore, the degree of hardening could be accurately classified by colors that can be visualized and used to detect defected mangosteens. This accuracy showed that this system, using near-infrared hyperspectral imaging, has the potential for non-destructive grading of hardening mangosteens.
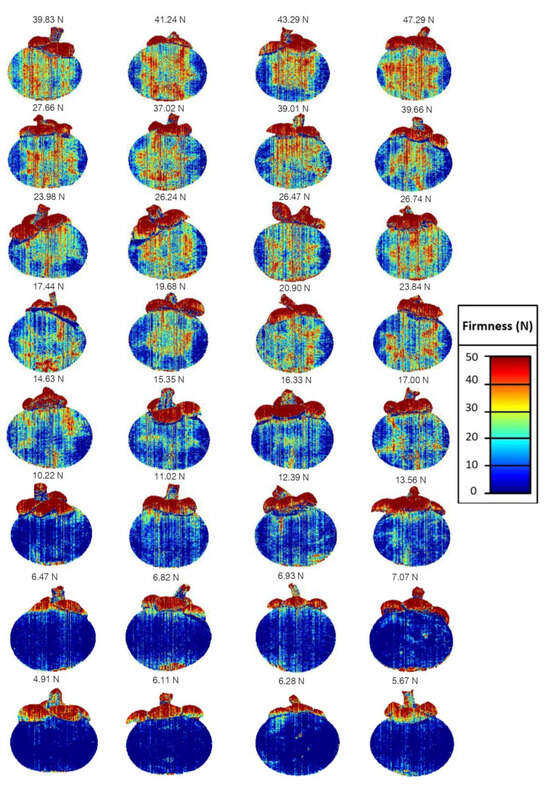
Figure 7.
The predictive images with the number of average firmness of mangosteens presented in different colors related to their firmness based on a color scale, where red indicates greater firmness and blue indicates lower firmness.
5. Conclusions
The results indicated that a partial least squares regression model for non-destructive grading could accurately be used to predict firmness of individual mangosteens and gave more accurate results compared to a support vector machine regression. Also, the accuracy of the PLSR model, developed from similarly sized samples, was more accurate than that developed from mixed-sized samples. The PLSR model was employed for prediction of the firmness loads in each pixel of the predictive image and was interpreted on a color-based linear scale, where the differences in colors of predictive images were successfully used to differentiate between the hardened and non-hardened mangosteens. The degree of hardening of individual mangosteens was visualized from the predictive image, indicating that hyperspectral imaging is a technique that could become a powerful tool for measuring the hardness disorder in mangosteens. It has the potential for incorporation within a commercial non-destructive grading system for detecting the degree of hardening of mangosteens, which is important for modern automated fruit-grading systems. Also, the results from this study can be utilized for improving the grading system as well as perhaps being applied for other fruit that can be graded using real-time online inspection for screening fruit during grading and distribution.
Author Contributions
Conceptualization, S.T.; methodology, S.W.; validation, S.T.; formal analysis, S.W.; data curation, S.W., T.K. and N.M.; writing—original draft preparation, S.W.; writing—review and editing, A.K.T.; visualization, S.W.; supervision, S.T. All authors have read and agreed to the published version of the manuscript.
Funding
This research was funded by King Mongkut’s Institute of Technology Ladkrabang.
Data Availability Statement
The data presented in this study are available on request from the corresponding author. The data are not publicly available due to large data in many sections in this study.
Acknowledgments
This work is supported by the School of Food-Industry, Department of Food Science, King Mongkut’s Institute of Technology of Ladkrabang. The researchers appreciate Panmanas Sirisomboon for technical help.
Conflicts of Interest
The authors declare no conflicts of interest.
References
- Kalick, L.S.; Khan, H.A.; Maung, E.; Baez, Y.; Atkinson, A.N.; Wallace, C.E.; Watanapokasin, R. Mangosteen for malignancy prevention and intervention: Current evidence, molecular mechanisms, and future perspectives. Pharmacol. Res. 2023, 188, 106630. [Google Scholar] [CrossRef] [PubMed]
- FAO. Major Tropical Fruits. Available online: https://www.fao.org/3/cc9308en/cc9308en.pdf (accessed on 26 February 2024).
- Kanchanapoom, K.; Kanchanapoom, M. Mangosteen. In Tropical and Subtropical Fruit; Shaw, P.E., Chan, H.T., Jr., Nagy, S., Eds.; AgScience Inc.: Auburndale, FL, USA, 1998; pp. 191–216. [Google Scholar]
- Ketsa, S.; Koolpluksee, M. Some physical and biochemical characteristics of damaged pericarp of mangosteen fruit after impact. Postharvest Biol. Technol. 1993, 2, 209–215. [Google Scholar] [CrossRef]
- Bunsiri, A.; Ketsa, S.; Paull, R.E. Phenolic metabolism and lignin synthesis in damaged pericarp of mangosteen fruit after impact. Postharvest Biol. Technol. 2003, 29, 61–71. [Google Scholar] [CrossRef]
- Vance, C.P.; Kirk, T.K.; Sherwood, R.T. Lignification as a mechanism of disease resistance. Ann. Rev. Phytopathol. 1980, 18, 259–288. [Google Scholar] [CrossRef]
- Christiernin, M. Lignin composition in cambial tissues of poplar. Plant Physiol. Biochem. 2006, 44, 700–706. [Google Scholar] [CrossRef] [PubMed]
- Radin, J.W.; Ackerson, R.C. Water relations of cotton plants under nitrogen deficiency. II. Stomatal conductance, photosynthesis and abscisic acid accumulation during drought. Plant Physiol. 1982, 87, 115–119. [Google Scholar] [CrossRef]
- Morgan, J.A. The effects of N nutrition on the water relations and gas exchange characteristics of wheat (Triticum aestivum L.). Plant Physiol. 1986, 80, 52–58. [Google Scholar] [CrossRef] [PubMed]
- Oey, M.L.; Vanstreels, E.; De Baerdemaeker, J.; Tijskens, E.; Ramon, H.; Hertog, M.L.A.T.M.; Nicolaï, B. Effect of turgor on micromechanical and structural properties of apple tissue: A quantitative analysis. Postharvest Biol. Technol. 2007, 44, 240–247. [Google Scholar] [CrossRef]
- Ketsa, S.; Atantee, S. Phenolics, lignin, peroxidase activity and increased firmness of damaged pericarp of mangosteen fruit after impact. Postharvest Biol. Technol. 1998, 14, 117–124. [Google Scholar] [CrossRef]
- ElMasry, G.; Sun, D.W. Principles of hyperspectral imaging technology. In Hyperspectral Imaging for Food Quality Analysis and Control; Sun, D.W., Ed.; Academic Press: San Diego, CA, USA, 2010; pp. 3–43. [Google Scholar]
- Kim, M.S.; Lefcourt, A.M.; Chao, K.; Chen, Y.R.; Kim, I.; Chan, D.E. Multispectral detection of fecal contamination on apples based on hyperspectral imagery: Part I. Application of visible and near-infrared reflectance imaging. Trans. ASAE 2002, 45, 2027–2037. [Google Scholar] [CrossRef]
- Polder, G.; Van der Heijden, G.W.A.M.; Young, I.T. Spectral image analysis for measuring ripeness of tomatoes. Trans. ASAE 2002, 45, 1155–1161. [Google Scholar] [CrossRef]
- Lu, R. Detection of bruises on apples using near-infrared hyperspectral imaging. Trans. ASAE 2003, 46, 523–530. [Google Scholar] [CrossRef]
- Lu, R. Multispectral imaging for predicting firmness and soluble solids content of apple fruit. Postharvest Biol. Technol. 2004, 31, 147–157. [Google Scholar] [CrossRef]
- Cheng, X.; Chen, R.; Tao, Y.; Wang, C.Y.; Kim, M.S.; Lefcourt, A.M. A novel integrated PCA and FLD method on hyperspectral image feature extraction for cucumber chilling damage inspection. Trans. ASAE 2004, 47, 1313–1320. [Google Scholar] [CrossRef]
- Liu, Y.; Chen, Y.R.; Wang, C.Y.; Chan, D.E.; Kim, M.S. Development of hyperspectral imaging technique for the detection of chilling injury in cucumbers; spectral and image analysis. Appl. Eng. Agric. 2006, 22, 101–111. [Google Scholar] [CrossRef]
- Ariana, D.P.; Lu, R. Evaluation of internal defect and surface color of whole pickles using hyperspectral imaging. J. Food Eng. 2010, 96, 583–590. [Google Scholar] [CrossRef]
- Mendoza, F.; Lu, R.; Ariana, D.; Cen, H.; Bailey, B. Integrated spectral and image analysis of hyperspectral scattering data for prediction of apple fruit firmness and soluble solids content. Postharvest Biol. Technol. 2011, 62, 149–160. [Google Scholar] [CrossRef]
- Leiva-Valenzuela, G.A.; Lu, R.; Aguilera, J.M. Prediction of firmness and soluble solids content of blueberries using hyperspectral reflectance imaging. J. Food Eng. 2013, 115, 91–98. [Google Scholar] [CrossRef]
- Rajkumar, P.; Wang, N.; Elmasry, G.; Raghavan, G.S.V.; Gariepy, Y. Studies on banana fruit quality and maturity stages using hyperspectral imaging. J. Food Eng. 2012, 108, 194–200. [Google Scholar] [CrossRef]
- Yang, C.; Lee, W.S.; Gader, P. Hyperspectral band selection for detecting different blueberry fruit maturity stage. Comput. Electron. Agric. 2014, 109, 23–31. [Google Scholar] [CrossRef]
- Vélez-Rivera, N.; Gómez-Sanchis, J.; Chanona-Pérez, J.; Carrasco, J.J.; Millán-Giraldo, M.; Lorente, D.; Cubero, S.; Blasco, J. Early detection of mechanical damage in mango using NIR hyperspectral images and machine learning. Biosyst. Eng. 2014, 122, 91–98. [Google Scholar] [CrossRef]
- Yu, K.; Zhao, Y.; Li, X.; Shao, Y.; Zhu, F.; He, Y. Identification of crack features in fresh jujube using Vis/NIR hyperspectral imaging combined with image processing. Comput. Electron. Agric. 2014, 103, 1–10. [Google Scholar] [CrossRef]
- Li, J.; Huang, W.; Tian, X.; Wang, C.; Fan, S.; Zhao, C. Fast detection and visualization of early decay in citrus using Vis-NIR hyperspectral imaging. Comput. Electron. Agric. 2016, 127, 582–592. [Google Scholar] [CrossRef]
- Ortac, G.; Bilgi, A.S.; Tasdemir, K.; Kalkan, H. A hyperspectral imaging-based control system for quality assessment of dried figs. Comput. Electron. Agric. 2016, 130, 38–47. [Google Scholar] [CrossRef]
- Teerachaichayut, S.; Ho, H.T. Non-destructive prediction of total soluble solids, titratable acidity and maturity index of limes by near infrared hyperspectral imaging. Postharvest Biol. Technol. 2017, 133, 20–25. [Google Scholar] [CrossRef]
- Amodio, M.L.; Capotorto, I.; Chaudhry, M.M.A.; Colelli, G. The use of hyperspectral imaging to predict the distribution of internal constituents and to classify edible fennel heads based on the harvest time. Comput. Electron. Agric. 2017, 134, 1–10. [Google Scholar] [CrossRef]
- Suktanarak, S.; Teerachaichayut, S. Non-destructive quality assessment of hens’ eggs using hyperspectral images. J. Food Eng. 2017, 215, 97–103. [Google Scholar] [CrossRef]
- Sricharoonratana, M.; Thompson, A.K.; Teerachaichayut, S. Use of near infrared hyperspectral imaging as a nondestructive method of determining and classifying shelf life of cakes. LWT-Food Sci. Technol. 2021, 136, 110369. [Google Scholar] [CrossRef]
- Xuan, G.; Gao, C.; Shao, Y.; Wang, X.; Wang, Y.; Wang, K. Maturity determination at harvest and spatial assessment of moisture content in okra using Vis-NIR hyperspectral imaging. Postharvest Biol. Technol. 2021, 180, 111597. [Google Scholar] [CrossRef]
- Khamsopha, D.; Woranitta, S.; Teerachaichayut, S. Utilizing near infrared hyperspectral imaging for quantitatively predicting adulteration in tapioca starch. Food Control 2021, 123, 107781. [Google Scholar] [CrossRef]
- Florián-Huamán, J.; Cruz-Tirado, J.P.; Fernandes Barbin, D.; Siche, R. Detection of nutshells in cumin powder using NIR hyperspectral imaging and chemometrics tools. J. Food Compos. Anal. 2022, 108, 104407. [Google Scholar] [CrossRef]
- Sahachairungueng, W.; Teerachaichayut, S. Nondestructive quality assessment of longans using near infrared hyperspectral imaging. Agric. Eng. Int. CIGR J. 2022, 24, 217–227. [Google Scholar] [CrossRef]
- Li, X.; Cai, M.; Li, M.; Wei, X.; Liu, Z.; Wang, J.; Jia, K.; Han, Y. Combining Vis-NIR and NIR hyperspectral imaging techniques with a data fusion strategy for the rapid qualitative evaluation of multiple qualities in chicken. Food Control 2023, 145, 109416. [Google Scholar] [CrossRef]
- Saha, D.; Senthilkumar, T.; Singh, C.B.; Manickavasagan, A. Quantitative detection of metanil yellow adulteration in chickpea flour using line-scan near-infrared hyperspectral imaging with partial least square regression and one-dimensional convolutional neural network. J. Food Compos. Anal. 2023, 120, 105290. [Google Scholar] [CrossRef]
- Tantinantrakun, A.; Thompson, A.K.; Terdwongworakul, A.; Teerachaichayut, S. Assessment of Nitrite Content in Vienna Chicken Sausages Using Near-Infrared Hyperspectral Imaging. Foods 2003, 12, 2793. [Google Scholar] [CrossRef] [PubMed]
- Tantinantrakun, A.; Sukwanit, S.; Thompson, A.K.; Teerachaichayut, S. Nondestructive evaluation of SW-NIRS and NIR-HSI for predicting the maturity index of intact pineapples. Postharvest Biol. Technol. 2023, 195, 112141. [Google Scholar] [CrossRef]
- Lu, R. Nondestructive measurement of firmness and soluble solids content for apple fruit using hyperspectral scattering images. Sens. Instrum. Food Qual Saf. 2007, 1, 19–27. [Google Scholar] [CrossRef]
- Xie, C.; Chu, B.; He, Y. Prediction of banana color and firmness using a novel wavelengths selection method of hyperspectral imaging. Food Chem. 2018, 245, 132–140. [Google Scholar] [CrossRef] [PubMed]
- Wei, X.; He, J.; Zheng, S.; Ye, D. Modeling for SSC and firmness detection of persimmon based on NIR hyperspectral imaging by sample partitioning and variables selection. Infrared Phys. Technol. 2020, 105, 103099. [Google Scholar] [CrossRef]
- Xu, M.; Sun, j.; Yao, K.; Cai, Q.; Shen, J.; Tian, Y.; Zhou, X. Developing deep learning based regression approaches for prediction of firmness and pH in Kyoho grape using Vis/NIR hyperspectral imaging. Infrared Phys. Technol. 2022, 120, 104003. [Google Scholar] [CrossRef]
- Codex Stan 204-1997; Standard for Mangosteen. FAO: Rome, Italy, 2005; p. 2.
- Feng, Y.Z.; Sun, D.W. Near-infrared hyperspectral imaging in tandem with partial least squares regression and genetic algorithm for non-destructive determination and visualization of Pseudomonas loads in chicken fillets. Talanta 2013, 109, 74–83. [Google Scholar] [CrossRef]
- ElMasry, G.; Wang, N.; ElSayed, A.; Ngadi, M. Hyperspectral imaging for nondestructive determination of some quality attributes for strawberry. J. Food Eng. 2007, 8, 98–107. [Google Scholar] [CrossRef]
- Esquerre, C.; Gowen, A.A.; O’Donnell, C.P.; Downey, G. Initial studies on the quantitation of bruise damage and freshness in mushrooms using visible-near infrared spectroscopy. J. Agric. Food Chem. 2009, 57, 903–1907. [Google Scholar] [CrossRef]
- Barbin, D.; ElMasry, G.; Sun, D.W.; Allen, P. Near-infrared hyperspectral imaging for grading and classification of pork. Meat Sci. 2012, 90, 259–268. [Google Scholar] [CrossRef] [PubMed]
- Marmo, C.A.; Bramlage, W.J.; Weis, S.A. Effect of fruit maturity, size, and mineral concentrations on predicting the storage life of ‘McIntosh’ apples. J. Am. Soc. Hortic. Sci. 1985, 110, 499–502. [Google Scholar] [CrossRef]
- Siddiqui, S.; Bangerth, F. Effect of pre-harvest application of calcium on flesh firmness and cell-wall composition of apples-influence of fruit size. J. Hortic. Sci. 1995, 70, 263–269. [Google Scholar] [CrossRef]
- Harker, F.R.; Redgwell, R.J.; Hallett, I.C.; Murray, S.H.; Carter, G. Texture of fresh fruit. Hortic. Rev. 1997, 20, 121–224. [Google Scholar] [CrossRef]
- Goffinet, M.C.; Robinson, T.L.; Lakso, A.N. A comparison of ‘Empire’ apple fruit size and anatomy in unthinned and hand-thinned trees. J. Hortic. Sci. 1995, 70, 375–387. [Google Scholar] [CrossRef]
- Volz, R.K.; Harker, F.R.; Hallett, I.C.; Lang, A. Development of texture in apple fruit-a biophysical perspective. Acta Hortic. 2004, 636, 473–479. [Google Scholar] [CrossRef]
- Ge´nard, M.; Bertin, N.; Borel, C.; Bussie`res, P.; Gautier, H.; Habib, R.; Le´chaudel, M.; Lecomte, A.; Lescourret, F.; Lobit, P.; et al. Towards a virtual fruit focusing on quality: Modelling features and potential uses. J. Exp. Bot. 2007, 58, 917–928. [Google Scholar] [CrossRef] [PubMed]
- Saei, A.; Tustin, D.S.; Zamani, Z.; Talaie, A.; Hall, A.J. Cropping effects on the loss of apple fruit firmness during storage: The relationship between texture retention and fruit dry matter concentration. Sci. Hortic. 2011, 130, 256–265. [Google Scholar] [CrossRef]
- Williams, P. Implementation of near-infrared technology. In Near-Infrared Technology in the Agricultural and Food Industries; Williams, P., Norris, K., Eds.; American Association of Cereal Chemists: St. Paul, MN, USA, 2001; pp. 145–169. [Google Scholar]
- Ozaki, Y.; Huck, C.; Tsuchikawa, S.; Engelsen, S.B. Near-Infrared Spectroscopy: Theory, Spectral Analysis, Instrumentation, and Applications; Springer: Singapore, 2021. [Google Scholar]
- Lu, R.; Guyer, D.E.; Beaudry, R.M. Determination of firmness and sugar content of apples using near-infrared diffuse reflectance. J. Texture Stud. 2000, 31, 615–630. [Google Scholar] [CrossRef]
- Wang, J.; Wang, J.; Chen, Z.; Han, D. Development of multi-cultivar models for predicting the soluble solid content and firmness of European pear (Pyrus communis L.) using portable vis–NIR spectroscopy. Postharvest Biol. Technol. 2017, 129, 143–151. [Google Scholar] [CrossRef]
- Ma, T.; Xia, Y.; Inagaki, T.; Tsuchikawa, S. Rapid and nondestructive evaluation of soluble solids content (SSC) and firmness in apple using Vis–NIR spatially resolved spectroscopy. Postharvest Biol. Technol. 2021, 173, 111417. [Google Scholar] [CrossRef]
- Yu, Y.; Yao, M. A portable NIR system for nondestructive assessment of SSC and firmness of Nanguo pears. LWT-Food Sci. Technol. 2022, 167, 113809. [Google Scholar] [CrossRef]
Disclaimer/Publisher’s Note: The statements, opinions and data contained in all publications are solely those of the individual author(s) and contributor(s) and not of MDPI and/or the editor(s). MDPI and/or the editor(s) disclaim responsibility for any injury to people or property resulting from any ideas, methods, instructions or products referred to in the content. |
© 2024 by the authors. Licensee MDPI, Basel, Switzerland. This article is an open access article distributed under the terms and conditions of the Creative Commons Attribution (CC BY) license (https://creativecommons.org/licenses/by/4.0/).