Article

Physiological and Biochemical Responses of Melilotus albus to Saline and Alkaline Stresses

1
Key Laboratory of Molecular and Cytogenetics, College of Life Science and Technology, Harbin Normal University, Harbin 150025, China
2
Institute of Forage and Grassland Sciences, Heilongjiang Academy of Agricultural Sciences, Harbin 150086, China
*
Authors to whom correspondence should be addressed.
These authors contributed equally to this work.
Horticulturae 2024, 10(3), 297; https://doi.org/10.3390/horticulturae10030297
Submission received: 28 December 2023 / Revised: 14 March 2024 / Accepted: 15 March 2024 / Published: 19 March 2024

Abstract

:
Sweet clover (Melilotus albus) is a high-quality leguminous forage grass with salinity tolerance, drought tolerance, and cold hardiness. We selected four varieties of sweet clover with different sensitivities (061898, 061930, No. 55 white flower, and Ningxia white flower) and analyzed the effects of different concentrations of three sodium salts (Na2CO3, NaHCO3, and NaCl) on their physiology and biochemistry responses. Growth and development indexes (such as germination rate, root length, shoot length), chlorophyll content, osmotic regulators (proline, soluble sugar), malondialdehyde (MDA), superoxide dismutase (SOD), peroxidase (POD), and catalase (CAT) were determined under saline–alkali stress. Seed germination and seedling growth of all four clover species were significantly inhibited under saline–alkali stress. During germination, seed germination rate, root length, and shoot length decreased with increasing saline and alkaline concentration. Under saline–alkali stress, chlorophyll content tended to increase and then decrease, cell damage and death increased, and malondialdehyde, soluble sugar, and proline content tended to increase and then decrease. Moreover, the activities of SOD, POD, and CAT all increased and then decreased. Under Na2CO3 stress, the decrease in chlorophyll content of the resistant variety 061898 was less than in the sensitive Ningxia white flower variety. As the concentrations of Na2CO3, NaHCO3, and NaCl increased, the maximum photochemical efficiency of PSII was significantly affected. The resistant 061898 is capable of maintaining higher photosynthetic efficiency. Furthermore, under treatments with the three kinds of saline–alkali solutions, cell damage and death for Ningxia white flower were greater than in 061898. For 061898, the increases in soluble sugar and proline content were greater and the increase in malondialdehyde content was less, while the antioxidant enzyme activities were higher than those in Ningxia white flower. All four sweet clover varieties had higher stress resistance with neutral than with alkaline salts. When stressed by medium to high saline–alkali concentrations, sweet clover seedlings had increased osmotic substance content, enhanced antioxidant enzyme activity, and regulated physiological metabolism. Additionally, sweet clovers regulated the expression of WRKY33, GH3, CYCD3, OXI1, MKK2, MYC2, JAZ, COI1, PYL, PP2C, TGA, and MPK3 to adapt to the saline–alkali environment and improve saline–alkali tolerance. Our analysis of the sweet clover salinity tolerance mechanism contributes to its further use and is of significant importance for addressing land salinization and promoting sustainable agricultural and pastoral practices in China.

1. Introduction

Soil salinization seriously affects agricultural production and restricts sustainable economic development. Now, it has become a topic of global concern, with a worldwide saline–alkali area of about 8.0 × 10⁹ hm2 [1], of which about 9.9 × 10⁷ hm2 is in China [2]. Saline–alkali soil is typically identifiable by salt content and pH level (above pH 8). Under natural conditions, salt stress is mainly caused by neutral salt (e.g., NaCl, Na2SO4), whereas saline–alkali stress is usually induced by basic salts (e.g., NaHCO3, Na2CO3 [3,4]). Saline–alkali soil changes soil physicochemical properties and impedes plant nutrient uptake. Saline–alkali stress damage plants mainly through osmotic stress, ionic toxicity, nutrient imbalance, and oxidative stress [5]. For example, severely alkali-stressed plants will significantly accumulate MDA and ROS contents [6]. Under saline–alkali stress conditions, plants are impact by hindrance to seed germination, growth, and development, as well as flowering and fruiting [7,8]. Therefore, saline–alkali soil has become a major limiting factor for crop production in global agriculture [9].
Considering the severity of plant damage caused by soil salinization and alkalization, it is crucial to study the response mechanisms of plants under saline–alkali stress. To mitigate the damage and toxicity, plant have to develop various strategies to adapt to saline–alkali environments. These strategies include synthesis of osmoregulatory substances (such as proline, soluble sugar), enhancing the activities of antioxidant enzymes (such as SOD, POD, CAT), and upregulating saline–alkaline-responsive genes [10].
Sweet clover (Melilotus albus) is an annual or biennial herbaceous legume [11] and is cultivated worldwide [12]. Sweet clover has demonstrated remarkable environmental resilience that can be planted in saline–alkali pastures, where crops struggle to grow, because it possesses strong resistance to adversity, salt, and cold tolerance [13]. Widely used as fodder, green manure, and soil conservation crops [14], sweet clover has a higher yield and nitrogen-fixation ability relative to alfalfa [15]. As an excellent leguminous forage grass, sweet clover is rich in nutritional value, crude protein, and crude fat contents; it is also a valuable research subject for studying the salinity tolerance mechanism of high-quality forage grasses [16]. When planted in mildly saline–alkali soils, it can reduce soil salinity and enhance soil fertility, achieving soil improvement [17]. As one of the candidate plants for ecological restoration and reconstruction of salinized abandoned land, with a well-developed root system and tall stature, sweet clover can be used for wind and sand stabilization as well as soil and water conservation. Sweet clover produces infinite inflorescences over a long flowering period, making it a good nectar plant [18].
Studies on sweet clover’s saline–alkali tolerance have been conducted by researchers. These results reveal that multiple gene families are involved in the response of sweet clover to salt stress [19,20]. However, research on the physiological and molecular mechanisms underlying sweet clover’s adaptation to saline–alkali environments remains incomplete and superficial. We selected four sweet clover varieties with varying levels of saline–alkali tolerance to study their physiological characteristics under saline–alkali stress. We conducted experimental tests to measure MDA and proline concentrations, photosynthesis, reactive oxygen species accumulation, antioxidant enzymes activity, and stress-responsive gene expression in sweet clover subjected to saline–alkali conditions. The objectives of this research were to analyze the response mechanisms of sweet clover to saline–alkali stress and compare the differences in adaptation mechanisms to saline–alkali stress. The results of this study can provide theoretical support for the breeding of sweet clover and guide its cultivation in saline–alkali soils.

2. Materials and Methods

2.1. Plant Materials and Treatment

Seeds of four varieties of sweet clover, 061898, 061930, No. 55 white-flowered (55WF), and Ningxia white flowered (NXWF), were provided by the Pasture Breeding Research Laboratory, Grass Research Institute, Heilongjiang Provincial Academy of Agricultural Sciences.
Full, healthy, uniformly sized sweet clover seeds were selected. First, they were polished with sandpaper to break up the seed hardness, then treated with 75% ethanol for 30 s. Then the seeds were soaked in 5% NaClO for 5 min, rinsed with sterile water 3–5 times, and placed in square petri dishes with a diameter of 10 cm lined with 2 layers of filter paper. Twenty seeds were placed in each dish and Na2CO3 solutions (0, 10, 20, 30, 40, and 50 mmol/L), NaHCO3 solutions (0, 30, 50, 70, and 90 mmol/L), and NaCl solutions (0, 50, 100, 150, 200, 250, and 300 mmol/L) were added to the dishes as stress treatments. Three replicates were performed for each treatment. Germination was carried out in an incubator (Ningbo Jiangnan Instrument Factory, Ningbo, China) at a constant temperature of 25 °C with a light period of 18 h/6 h (light/dark). This was appropriately supplemented with sterile water based on the rate of evaporation to maintain relatively stable concentrations. Sweet clover seed germination time is 7 d.
Sweet clover seeds were planted in pots with a diameter of 11 cm and depth of 11 cm filled with sterilized vermiculite, irrigated weekly with Hoagland nutrient solution, and placed in a light incubator (Ningbo Jiangnan Instrument Factory, Ningbo, China) with 16 h light/8 h dark and at 25/22 °C temperature. After 1 month of growth, they were stressed with one of 3 treatments: 0, 10, 20, 30, 40, and 50 mmol/L Na2CO3 solution; 0, 30, 50, 70, and 90 mmol/L NaHCO3 solution; or 0, 50, 100, 150, 200, 250, and 300 mmol/L NaCl solution, respectively. Aboveground parts were collected after 10 d to determine physiological indices and gene expression level.

2.2. Methods

2.2.1. Seed Germination

Seed germination indexes were determined using the International Seed Inspection Protocol [21], including germination percentage, root length, and shoot length. Germination rate (%) = No. of germinated seeds on the seventh day/No. of seeds for testing × 100%; relative germination rate (%) = germination rate at each salt concentration/control germination rate × 100 percent; sweet clover root length and shoot length were determined on day 7 and repeated five times.

2.2.2. Physiological Analysis

For chlorophyll, 0.1 g fresh leaf was extracted in 95% ethanol till leaf discoloration and was tested spectrophotometrically at absorbances of 665 nm and 649 nm [22]. Three replicates were designed for each condition. Chlorophyll fluorescence imaging of the whole plant was determined using the Multi-functional Photosynthetic Phenotypic Measurement System for Plants (PlantExplorer Pro+, Pheno Vation, Wageningen, The Netherlands).
Leaves after 10 days of saline–alkali stress induced WT were incubated in di-amino-benzine (DAB, 1 mg/mL) or nitroblue tetrazolium (NBT, 0.1 mg/mL) solution overnight at room temperature in the dark to detect the accumulation of H2O2 and O2, respectively. For Evan’s blue staining, excised leaves were incubated in 0.1% Evan’s blue solution overnight. The stained leaves were soaked in 90% ethanol to remove the chlorophyll and subsequently photographed. All the experiments were performed before and after stress treatments mentioned in respective figures [23,24].
The proline content was measured using acid ninhydrin colorimetry using pure proline as a standard. The soluble sugar was determined by anthrone colorimetry using glucose as a standard. For their measurements, about 0.5 g of fresh seedling was used with three replicates. The absorbance was recorded at wavelengths of 520 nm and 625 nm for proline and soluble sugar, respectively, on a UV spectrophotometer [25,26].
MDA level was evaluated by the thiobarbituric acid (TBA) method. About 0.5 g of fresh seedling was homogenized in 5 mL of 10% trichloroacetic acid (TCA) solution for further experiments with three replicates. The absorbance of the last supernatant was recorded at wavelengths of 450, 532, and 600 nm, respectively [27].
In order to assess the activities of SOD, POD, and CAT in the seedling, about 0.5 g of the fresh sample was weighed with three replicates. These enzymatic antioxidant compounds (SOD, POD, and CAT) were extracted and tested with UV spectrophotometer at absorbances of 560 nm, 470 nm, and 240 nm, respectively [28,29].

2.2.3. Physiological Analysis

The tissues of seedlings were harvested at 10th day after salt and alkali treatment and under normal growth conditions with three independent biological replicates per treatment. TRIzol reagent (Invitrogen, Carlsbad, CA, USA) was used to extract RNA according to the manufacturer’s instructions. RNA samples were reverse-transcribed using the TransScript One-Step gDNA Removal and cDNA Synthesis SuperMix Kit (Transgen, Beijing, China). Primers were designed by Primer 5.0.
qRT-PCR reaction was performed with Roche Lightcycler 96 using ChamQ Universal SYBR qPCR Master Mix (Vazyme, Nanjing, China) following the manufacturer’s instructions. The cycle conditions for qRT-PCR were as follows: 95 °C for 30 s, followed by 40 cycles of 95 °C for 10 s and 60 °C for 30 s. Actin was used as an internal control, and the relative transcript levels were analyzed based on the 2−(∆∆Ct) method.

2.2.4. Statistical Analysis

Experimental results are expressed as mean ± standard error (SE). SPSS 22.0 statistical software was used for data analysis and Origin2022 for graphing. Data were tested for significance by one-way analysis of variance (One-Way ANOVA) at the 95% level. The Duncan post hoc test was used to test for significant differences in multiple comparisons between treatments (p < 0.05).

3. Results

3.1. Effect of Saline–Alkali Stress on Sweet Clover Germination

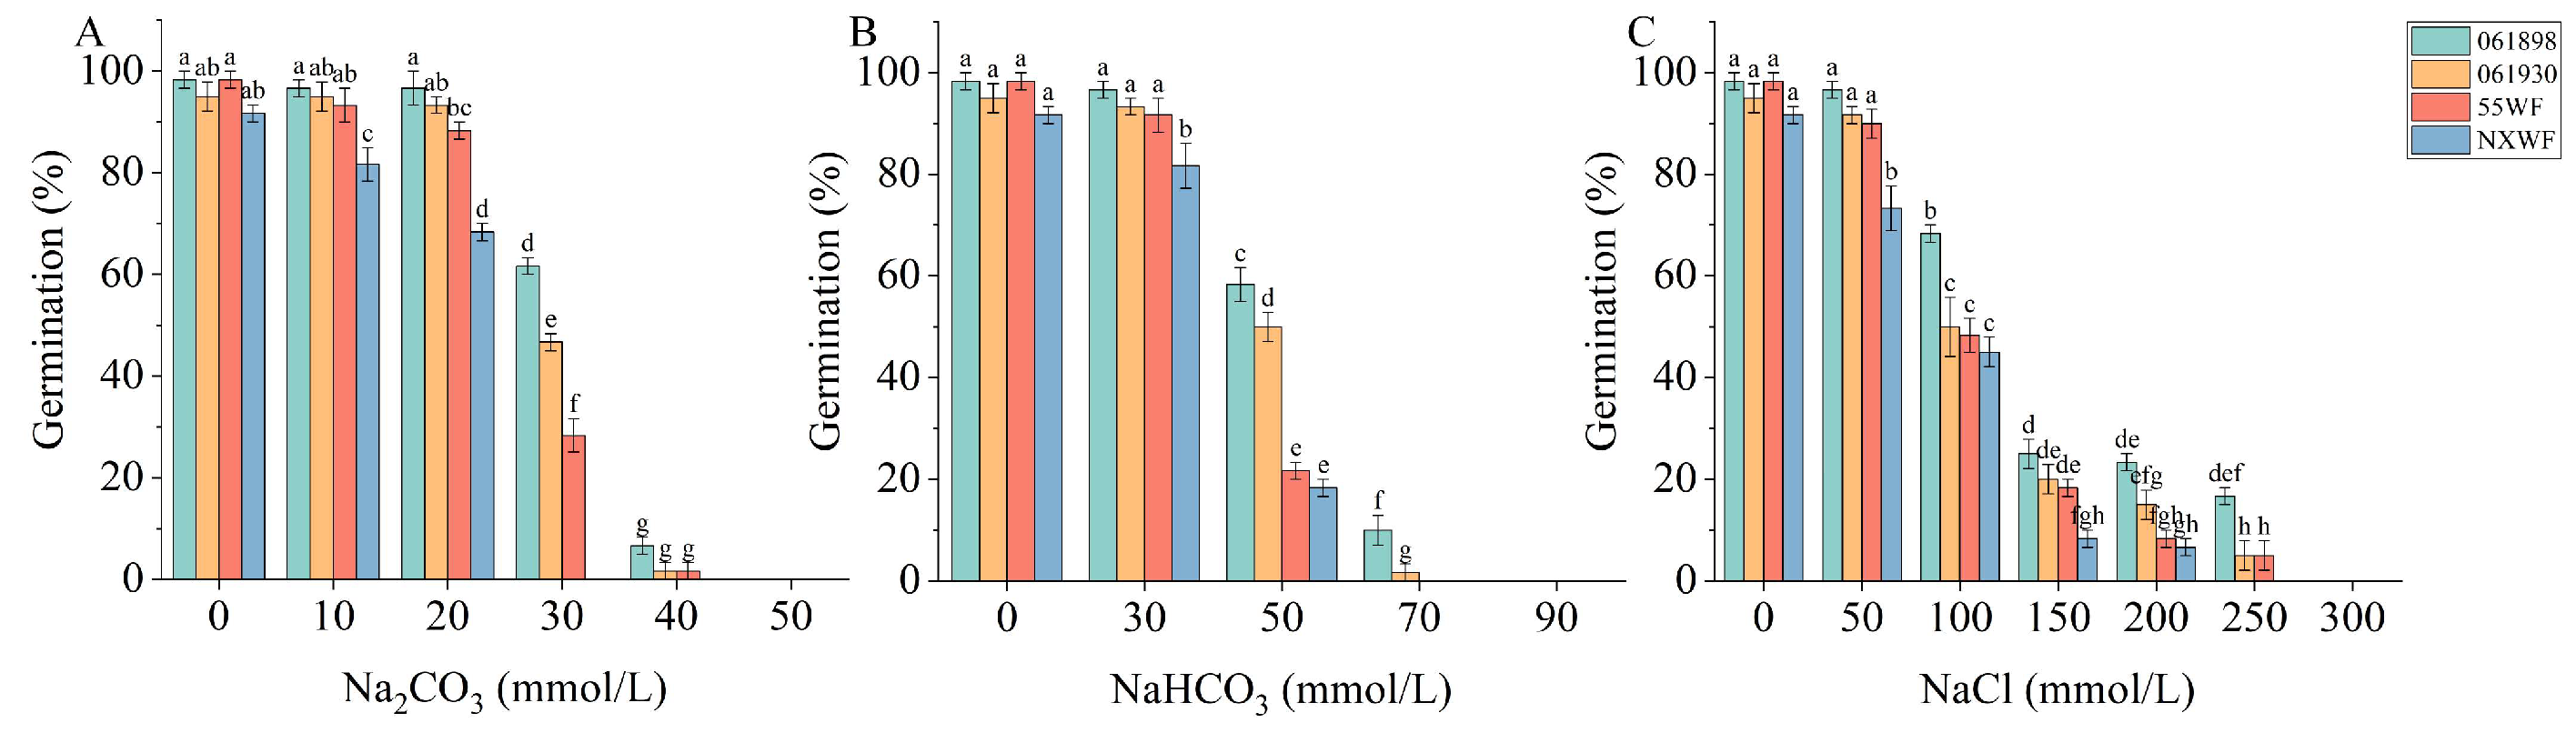
3.1.1. Effect of Saline–Alkali Stress on Sweet Clover Germination Rate

The germination rates of all four sweet clover varieties gradually decreased with increasing saline–alkali stress concentration, but the degree of germination inhibition between varieties differed (Figure 1). The germination rate of 061898 at 20 mmol/L Na2CO3 treatment was not significantly different (p > 0.05) from that of the control (CK), and at 30 mmol/L Na2CO3 treatment, it still reached 62%, which was significantly higher than the other three varieties. The germination rate of NXWF at 20 mmol/L Na2CO3 treatment was significantly different from that of the control (CK), and it did not germinate under 30 mmol/L Na2CO3 treatment (Figure 1A). At 50 mmol/L NaHCO3 treatment, 061898 and 061930 germination rates were 58% and 50%, respectively, showing good tolerance, while those of 55WF and NXWF decreased sharply and significantly compared to the control (CK) with weaker tolerance (Figure 1B). At an NaCl solution concentration of 250 mmol/L, 061898 germination rate still reached 17%, which was significantly higher than those of the other three sweet clover germplasm seeds (Figure 1C).
The effects of Na2CO3, NaHCO3, and NaCl solutions on 061898 germination rate were not significantly different from that of the control (CK) at low stress concentrations, but the inhibitory effect on germination rate gradually increased with increasing saline–alkali concentration. When the concentration of all three saline–alkali solutions reached 50 mmol/L, 061898 germination rate under NaCl treatment was the highest and under Na2CO3 treatment was zero.
When the Na2CO3 and NaHCO3 solution concentration reached 50 mmol/L, 061930 germination rate was significantly different from that of the control (CK) treatment, but there was no significant difference between the germination rate of 061930 and the control at a 50 mmol/L NaCl solution.
The tolerance trend to the Na2CO3, NaHCO3, and NaCl saline–alkali solution stresses of 55WF and NXWF was the same in the first two sweet clover varieties, but the germination rate was 0 when the Na2CO3 and NaHCO3 solution was 50 mmol/L.

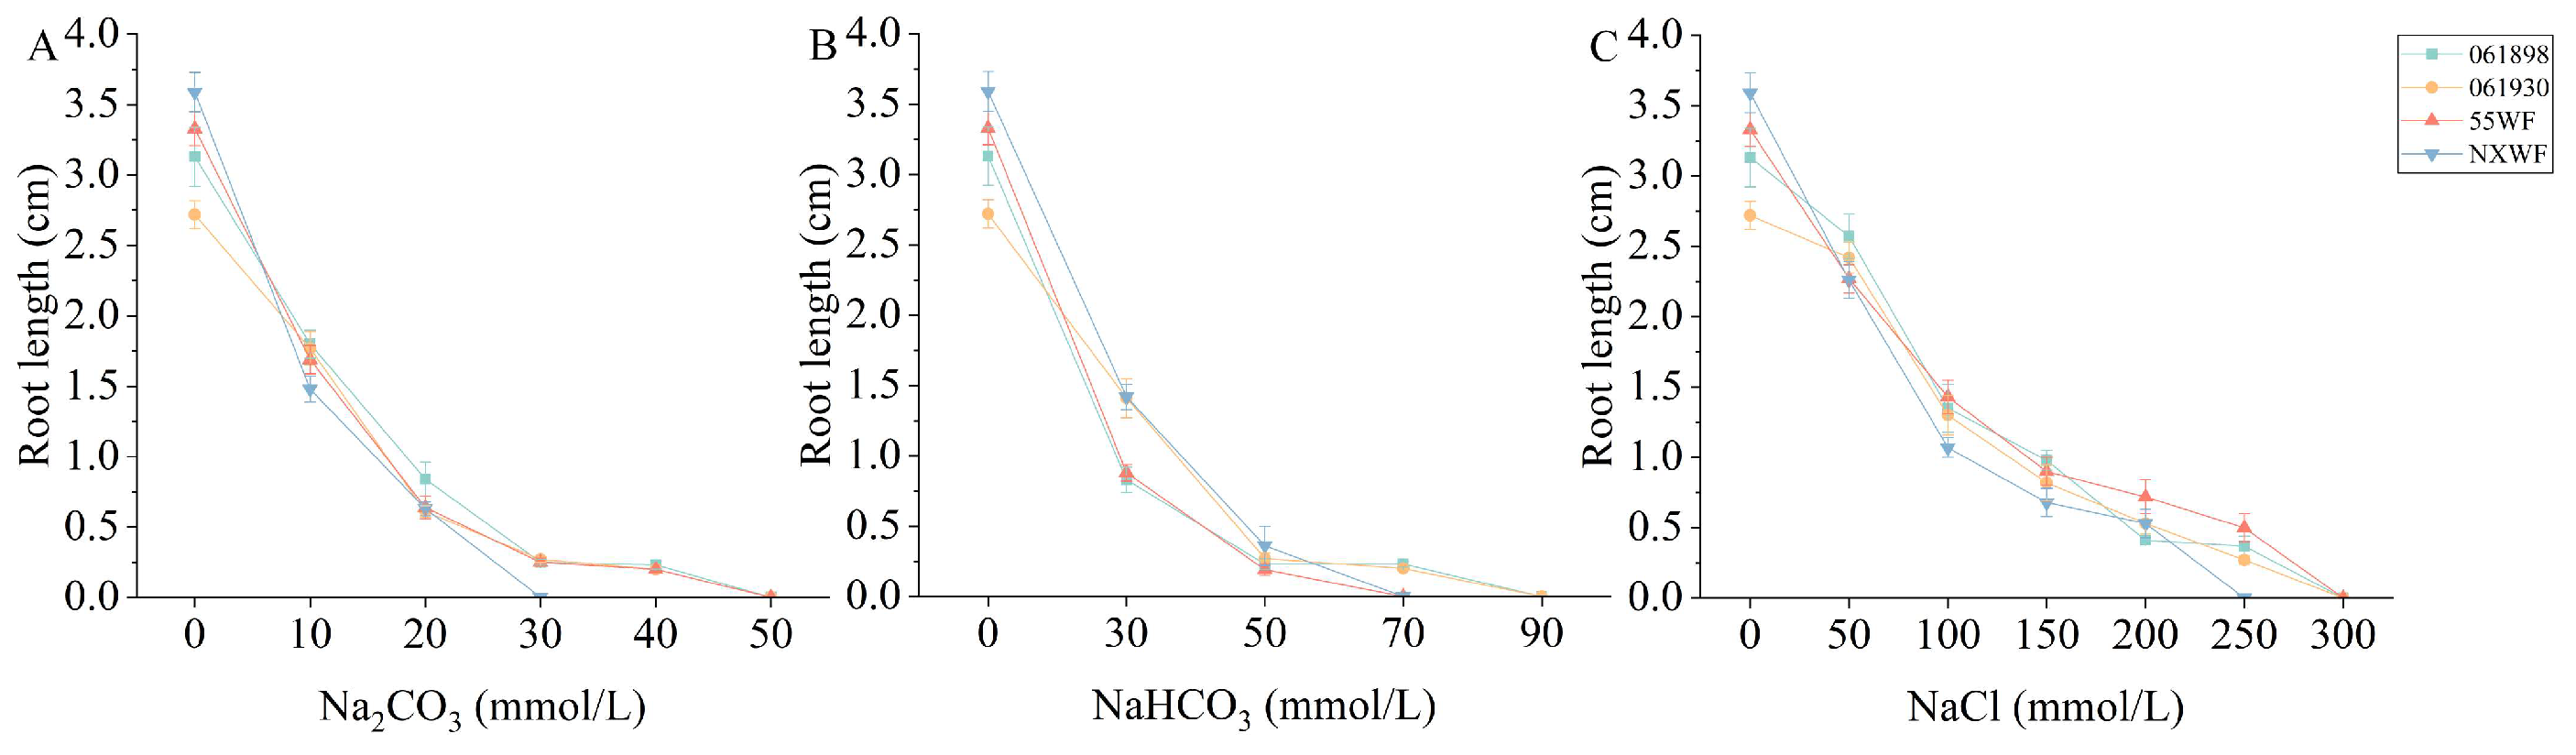
3.1.2. Effect of Saline–Alkali Stress on Sweet Clover Root Length

Under different saline–alkali stresses, root length of all four sweet clover species shortened with increasing saline–alkali concentration, but there were differences in the salt concentration at which the root length was completely inhibited (Figure 2). When the Na2CO3 solution reached 30 mmol/L, the root length of 061898 was shorter than that of 061930, which was equal to 55WF, while NXWF was completely suppressed (Figure 2A). The NaHCO3 solution stress effect on the root length of 061930 and NXWF was low and lower than 061898 and 55WF when at 30 mmol/L (Figure 2B). Although the effect of NaCl solution stress on white flower No. 55 root length growth was lower than the other three varieties, it was greater when the solution concentration was 200 mmol/L (Figure 2C).
Na2CO3 and NaHCO3 solutions had a strong effect on root length, and when the concentration reached 30 mmol/L, the root length was shortened to <1 cm, which differed significantly from that of the control (CK). The root length of 061898 was also shortened to <1 cm but only when the concentration of NaCl solution reached 150 mmol/L. All four varieties exhibited the same trend under Na2CO3, NaHCO3, and NaCl solution stresses, respectively, showing more tolerance to NaCl stress.

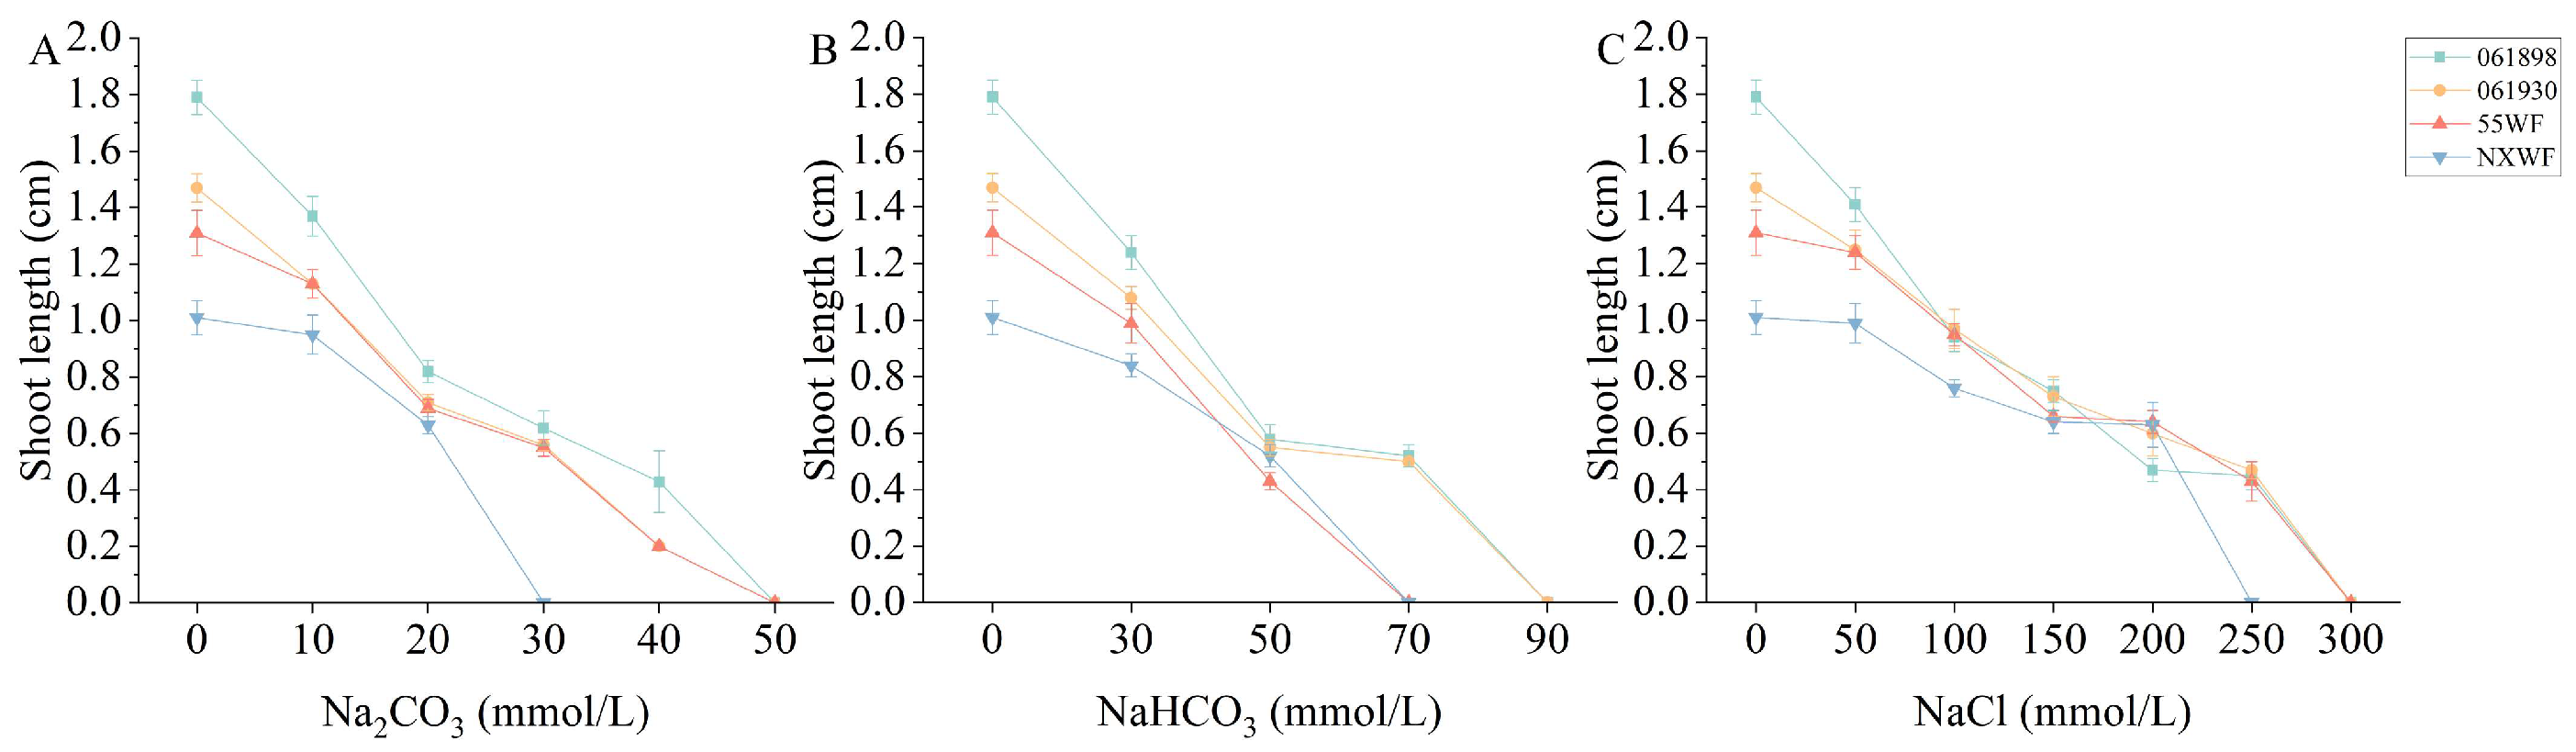
3.1.3. Effect of Saline–Alkali Stress on Sweet Clover Shoot Length

The shoot length declined with increasing Na2CO3, NaHCO3, and NaCl solution concentrations, but for different sweet clover varieties, it varied slightly (Figure 3). Under Na2CO3 stress, 061898 shoot length was consistently greater than those of the other three varieties, and when it reached 40 mmol/L, it remained at 0.43 cm (Figure 3A). When the NaHCO3 solution was 50 mmol/L, the bud length was reduced to 0.43 cm in 55WF, while in the other three varieties, it was above 0.5 cm (Figure 3B). When the NaCl solution was 200 mmol/L, shoot lengths of the four varieties were ranked in the following order: 55WF > NXWF > 061930 > 061898 (Figure 3C).
The effects of Na2CO3 and NaHCO3 on 061898 shoot length were greater than NaCl. When Na2CO3 and NaHCO3 solutions reached 20 and 50 mmol/L, respectively, 061898 shoot length had been shortened to <1.0 cm, which was significantly lower than the control (CK), and at 100 mmol/L, the shoot length was 0.94 cm. The same trend was observed in the shoot lengths of 061930, 55WF, and NXWF, under the stress of Na2CO3, NaHCO3, and NaCl solutions, respectively.

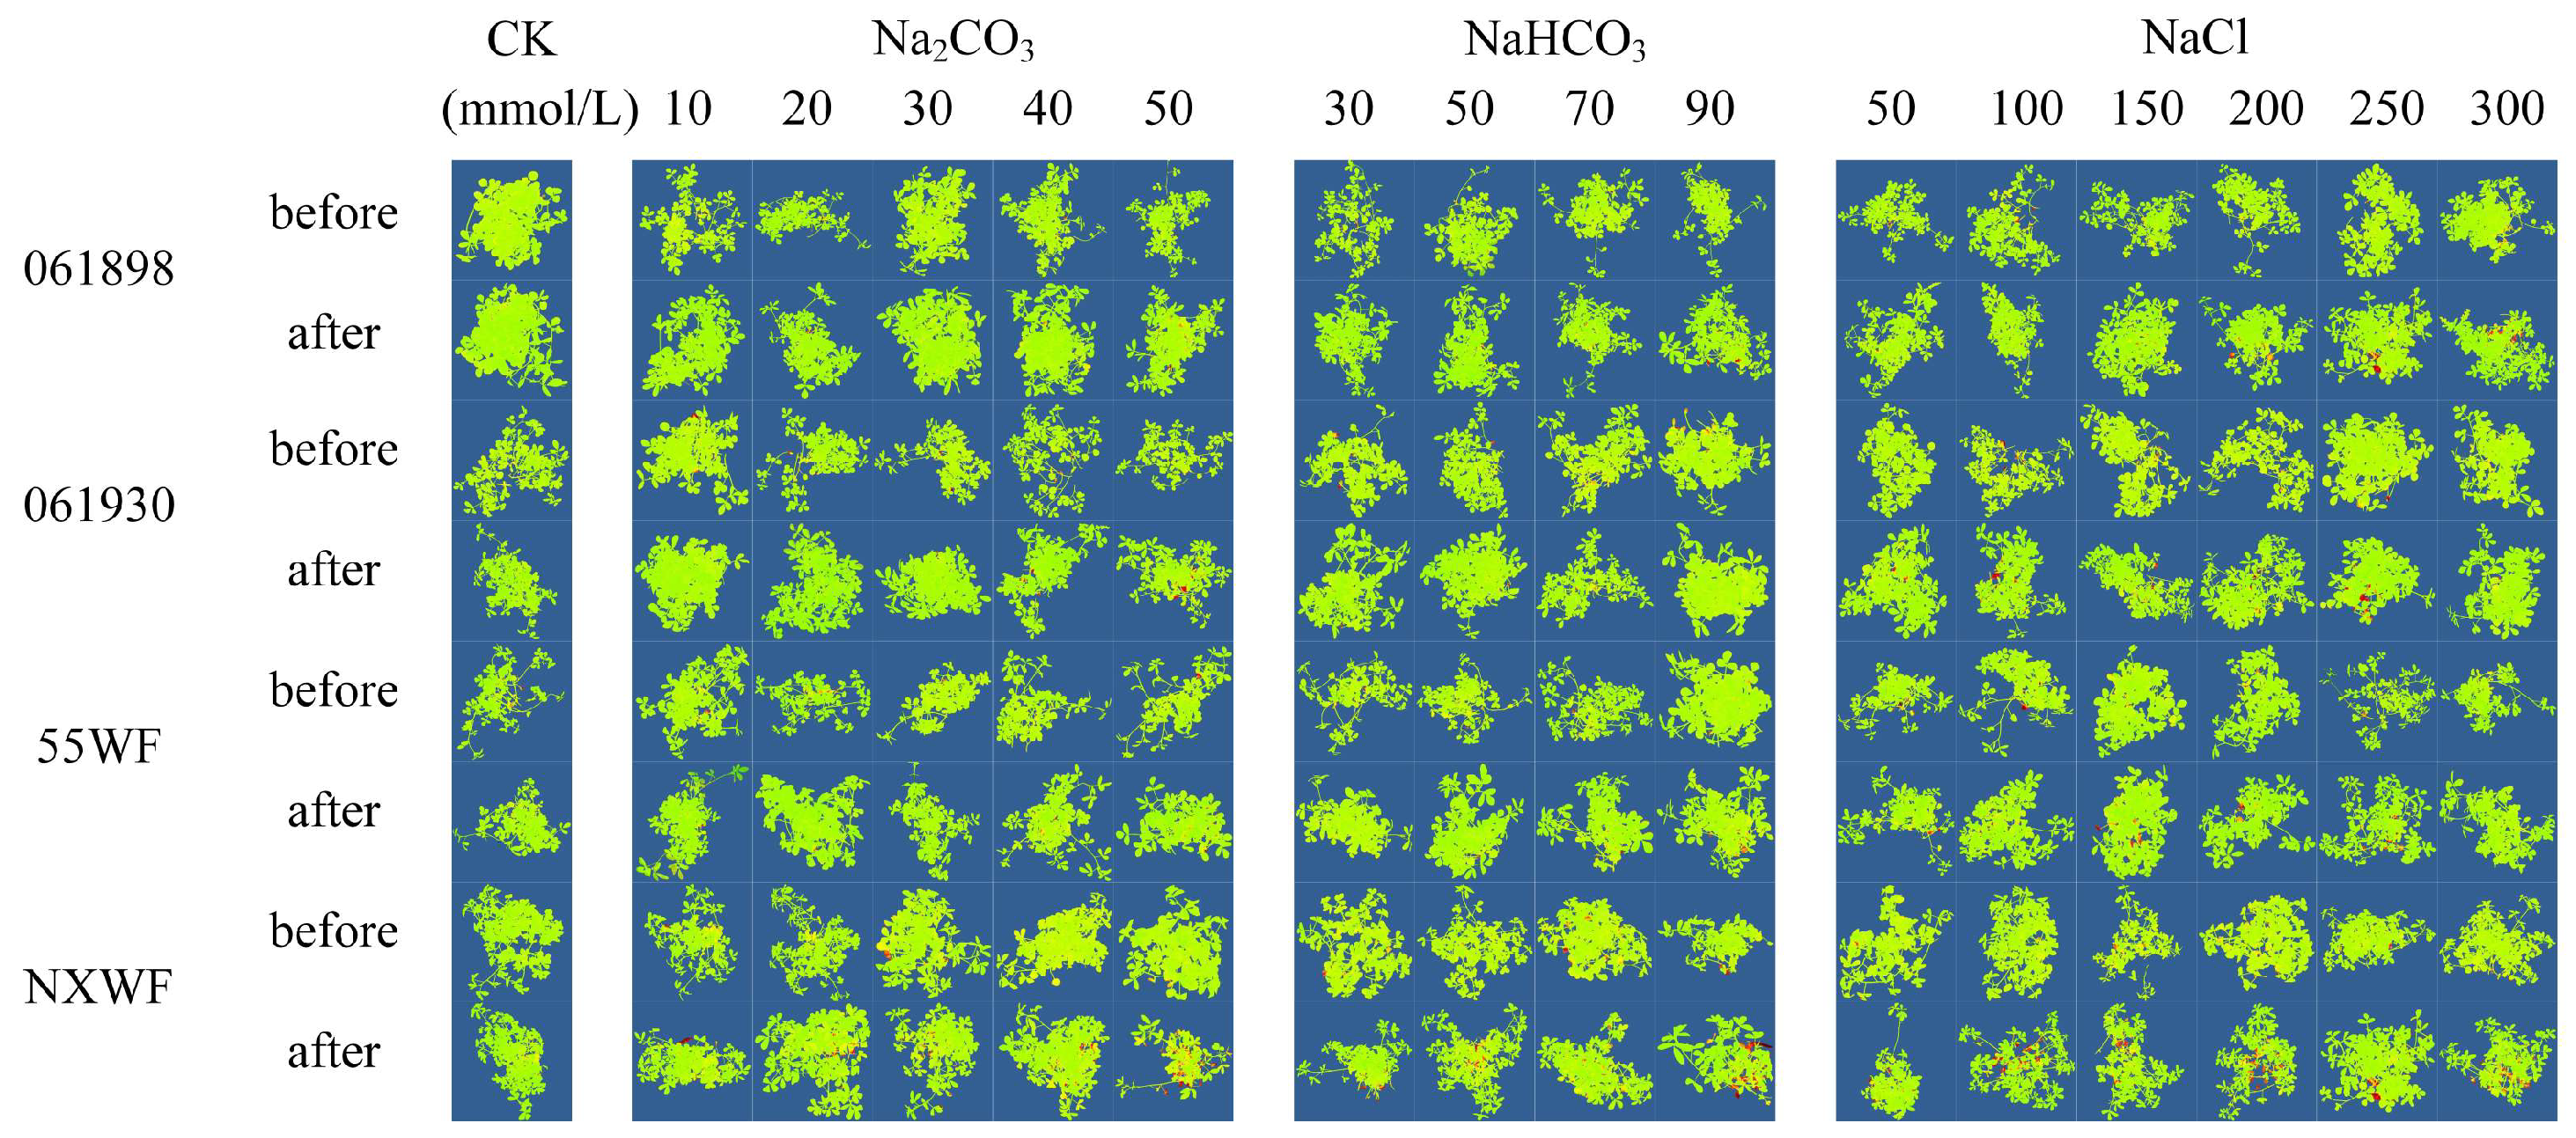
3.2. Effect of Saline–Alkali Stress on Sweet Clover Seedlings

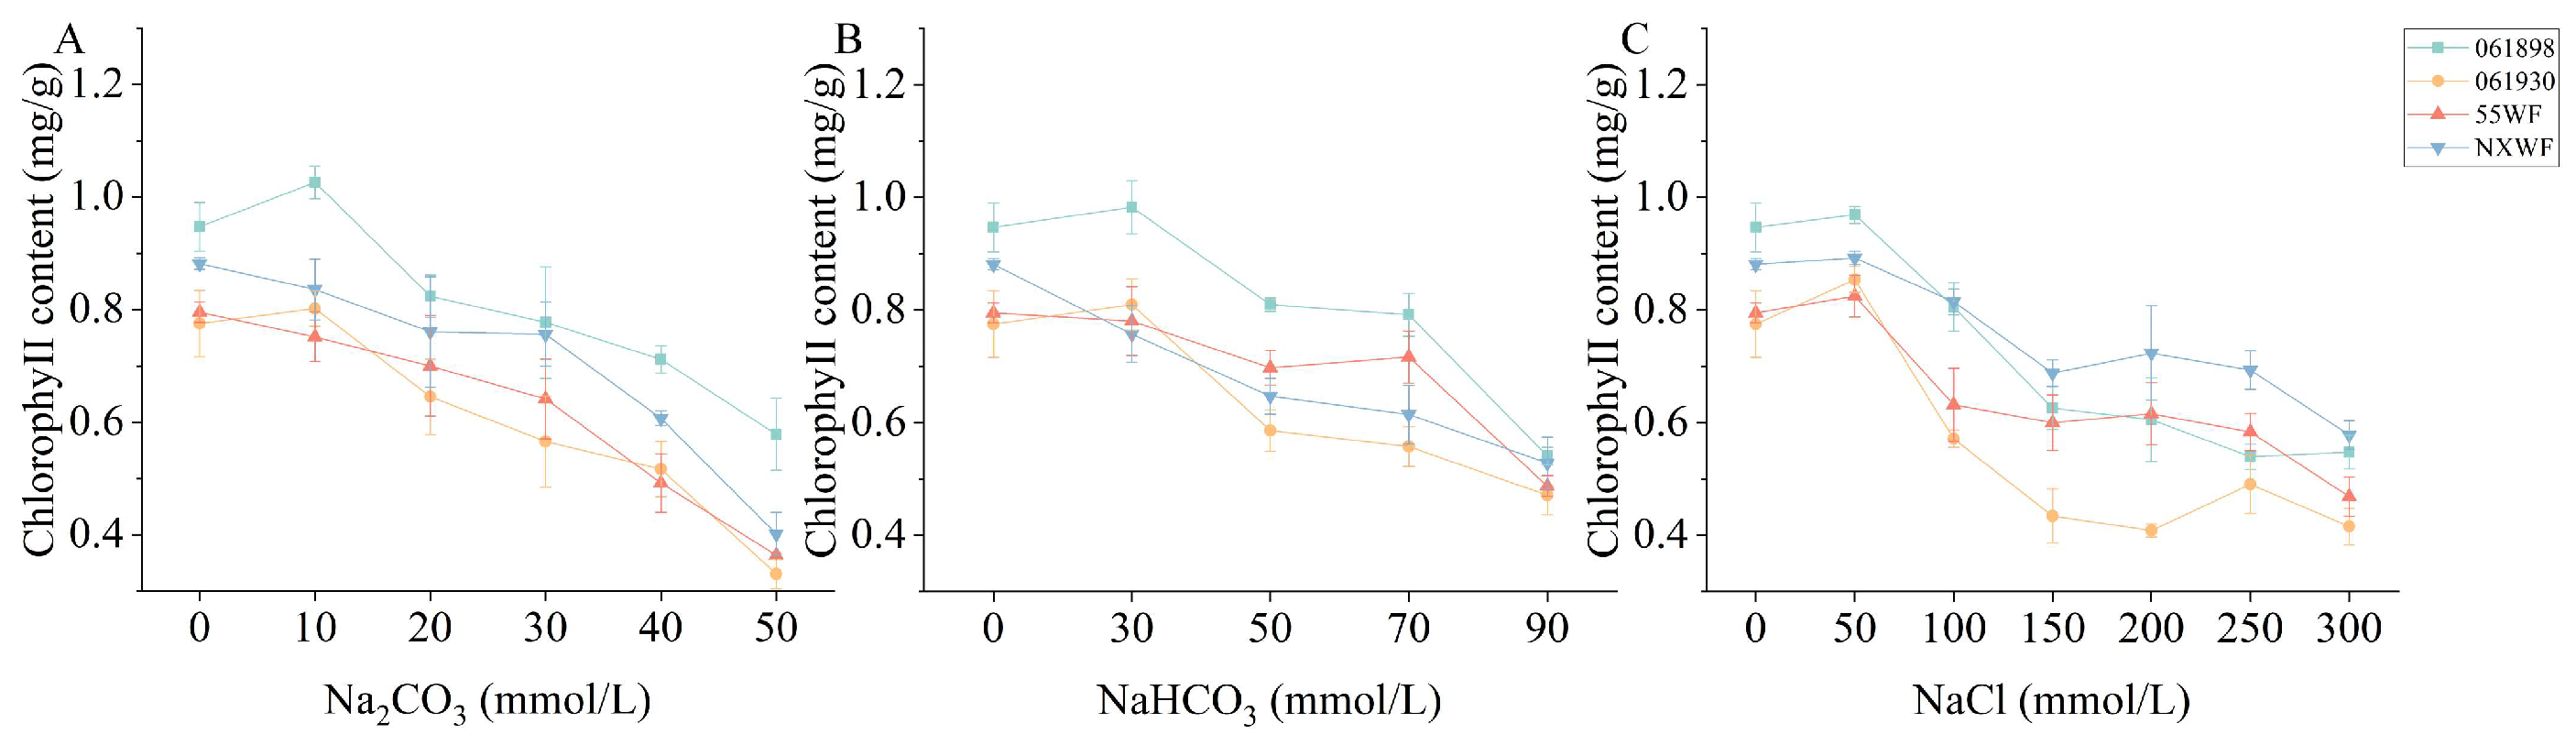
3.2.1. Effect of Saline–Alkali Stress on Sweet Clover Chlorophyll Content

As the concentration of saline–alkali solutions increased, the chlorophyll content in the four varieties of sweet clover initially increased and then decreased (Figure 4). Under Na2CO3 solution stress, 061898 chlorophyll content increased significantly at 10 mmol/L, while the chlorophyll content of all four varieties decreased significantly when the solution concentration reached 50 mmol/L. Under Na2CO3 solution stress, the chlorophyll contents of 061898, 061930, 55WF, and NXWF decreased by 39%, 58%, 55% and 55%, respectively, compared with that of the control (Figure 4A). With NaHCO3 solution stress, both 061898 and 061930 chlorophyll content increased slightly compared to that of the control treatment, but significantly dropped (43%, 40%, 39%, and 40%) at 90 mmol/L compared to the control (Figure 4B). Under low NaCl solution stress, the chlorophyll content of all four varieties was low and did not significantly differ from the control; however, when the solution concentration reached 300 mmol/L, the chlorophyll content declined by 42%, 46%, 41%, and 34%, respectively, compared with the control (Figure 4C).
The chlorophyll content of sweet clover 061898 reached a maximum at Na2CO3 of 10 mmol/L, but under NaHCO3 and NaCl solution stress, it increased at 30 mmol/L and 50 mmol/L, respectively, followed by a continuous decrease. The chlorophyll content of 061930 generally increased and then decreased under the three saline–alkali stresses, but decreased more in Na2CO3 than in NaHCO3 and NaCl. For 55WF, the chlorophyll content decreased as the solution concentration increased, reaching its minimum at concentrations of 50 mmol/L for Na2CO3, 90 mmol/L for NaHCO3, and 300 mmol/L for NaCl, with each being significantly different from the control.

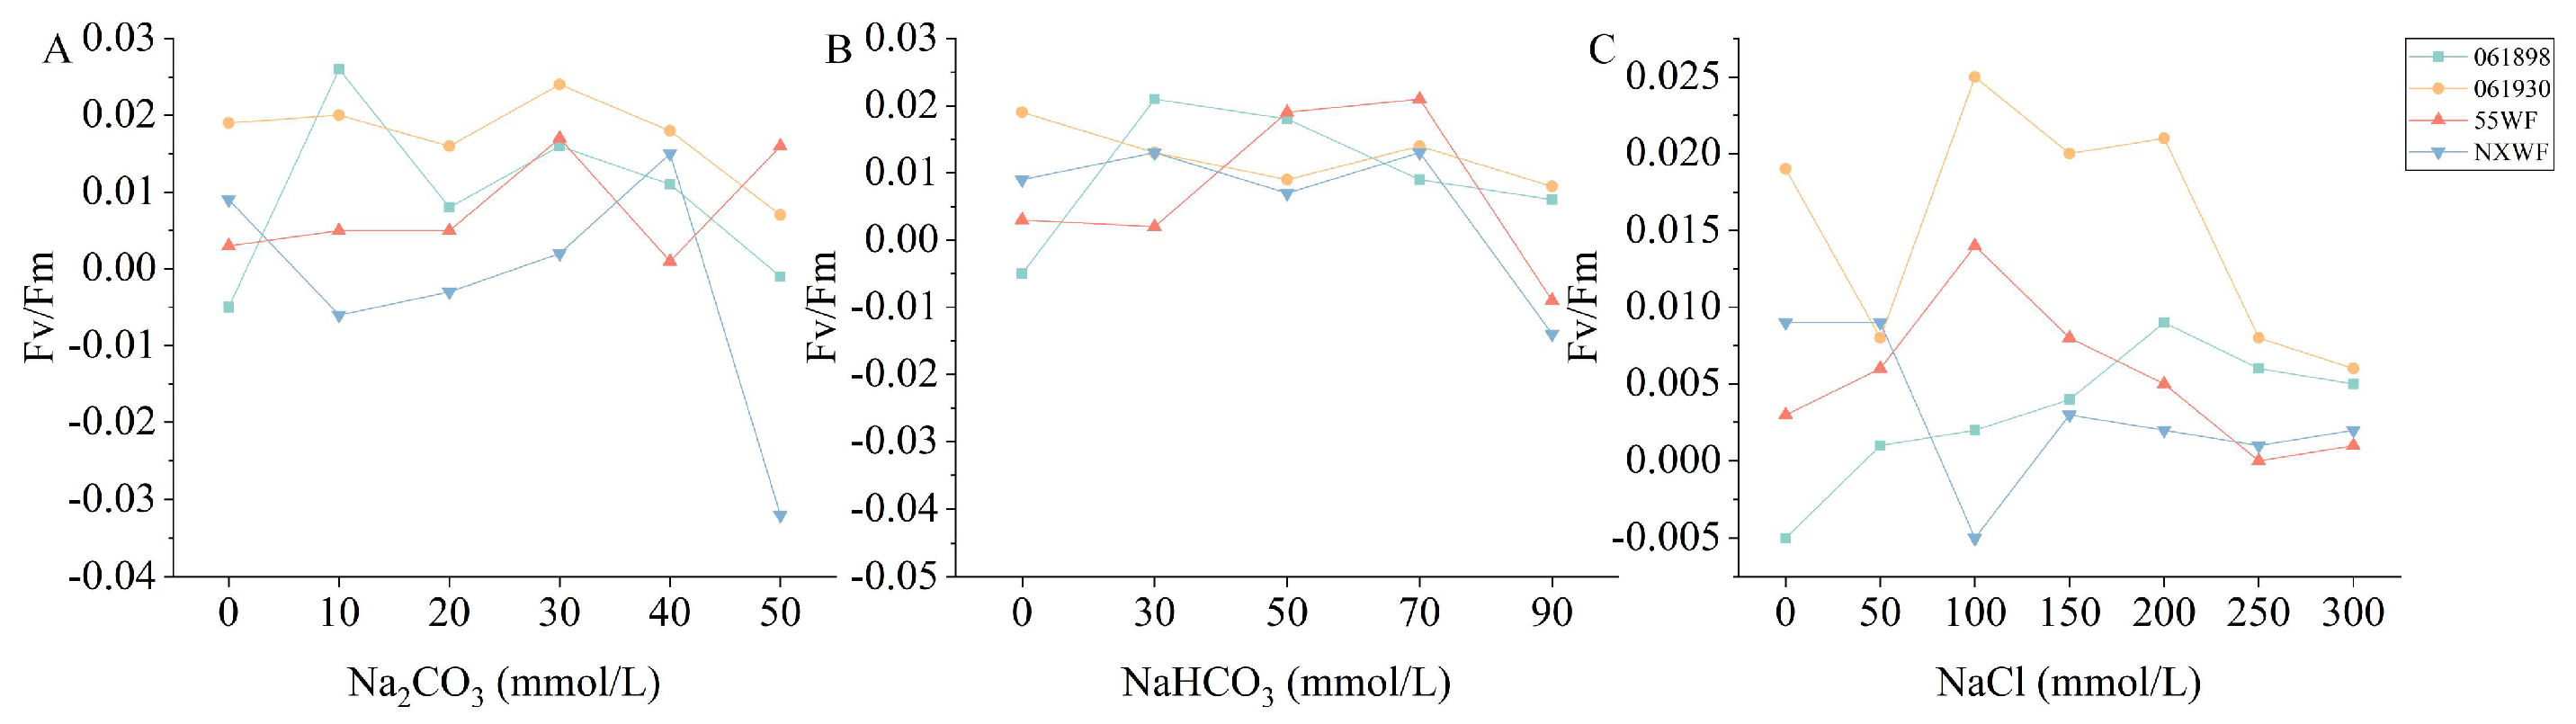
3.2.2. Effect of Saline–Alkali Stress on Sweet Clover Maximum Photochemical Quantum Yield of PSII

The maximum photochemical quantum yield (Fv/Fm) of photosystem II (PSII) reflects the efficiency of endowment light energy conversion in the PSII reaction center. A decreasing trend in this parameter was observed under stress conditions. Under Na2CO3 solution stress, the Fv/Fm difference was >0 after stress compared with beforehand in 061898, 061930, and 55WF, while the difference was negative in NXWF (Figure 5A). When the NaHCO3 solution concentration reached 90 mmol/L, the difference in Fv/Fm was >0 after stress compared with beforehand in 061898 and 061930, whereas the difference was negative in 55WF and NXWF (Figure 5B). At NaCl solution concentrations up to 300 mmol/L, the Fv/Fm difference was >0 for all four varieties after stress compared with beforehand (Figure 5C).
At Na2CO3, NaHCO3, and NaCl solution concentrations of 50, 90, and 300 mmol/L, respectively, the difference between post-stress and pre-stress Fv/Fm values were negative, positive, and positive, respectively, and the recovery ability of leaves under NaHCO3 and NaCl solution stresses was higher than that of 061898 Na2CO3 stress-treated leaves. The same trend was observed in the other three varieties, all of which exhibited better recovery ability at the NaCl stress-treated seedling stage.
Under low concentration stress of the three saline–alkali solutions, 061898 did not show significant damage and was mostly green, but when the concentration of the three saline–alkali solutions reached its maximum, slight reddish-yellow damage was observed. Similar trends were observed in the white flowers of 061930 and 55WF, and the damage was greatest in the former. NXWF was more seriously damaged when the concentration of the three saline–alkali solutions was at maximum, with more leaves reddish-yellow and with Na2CO3 causing more serious damage to the photosynthetic system (Figure 6).

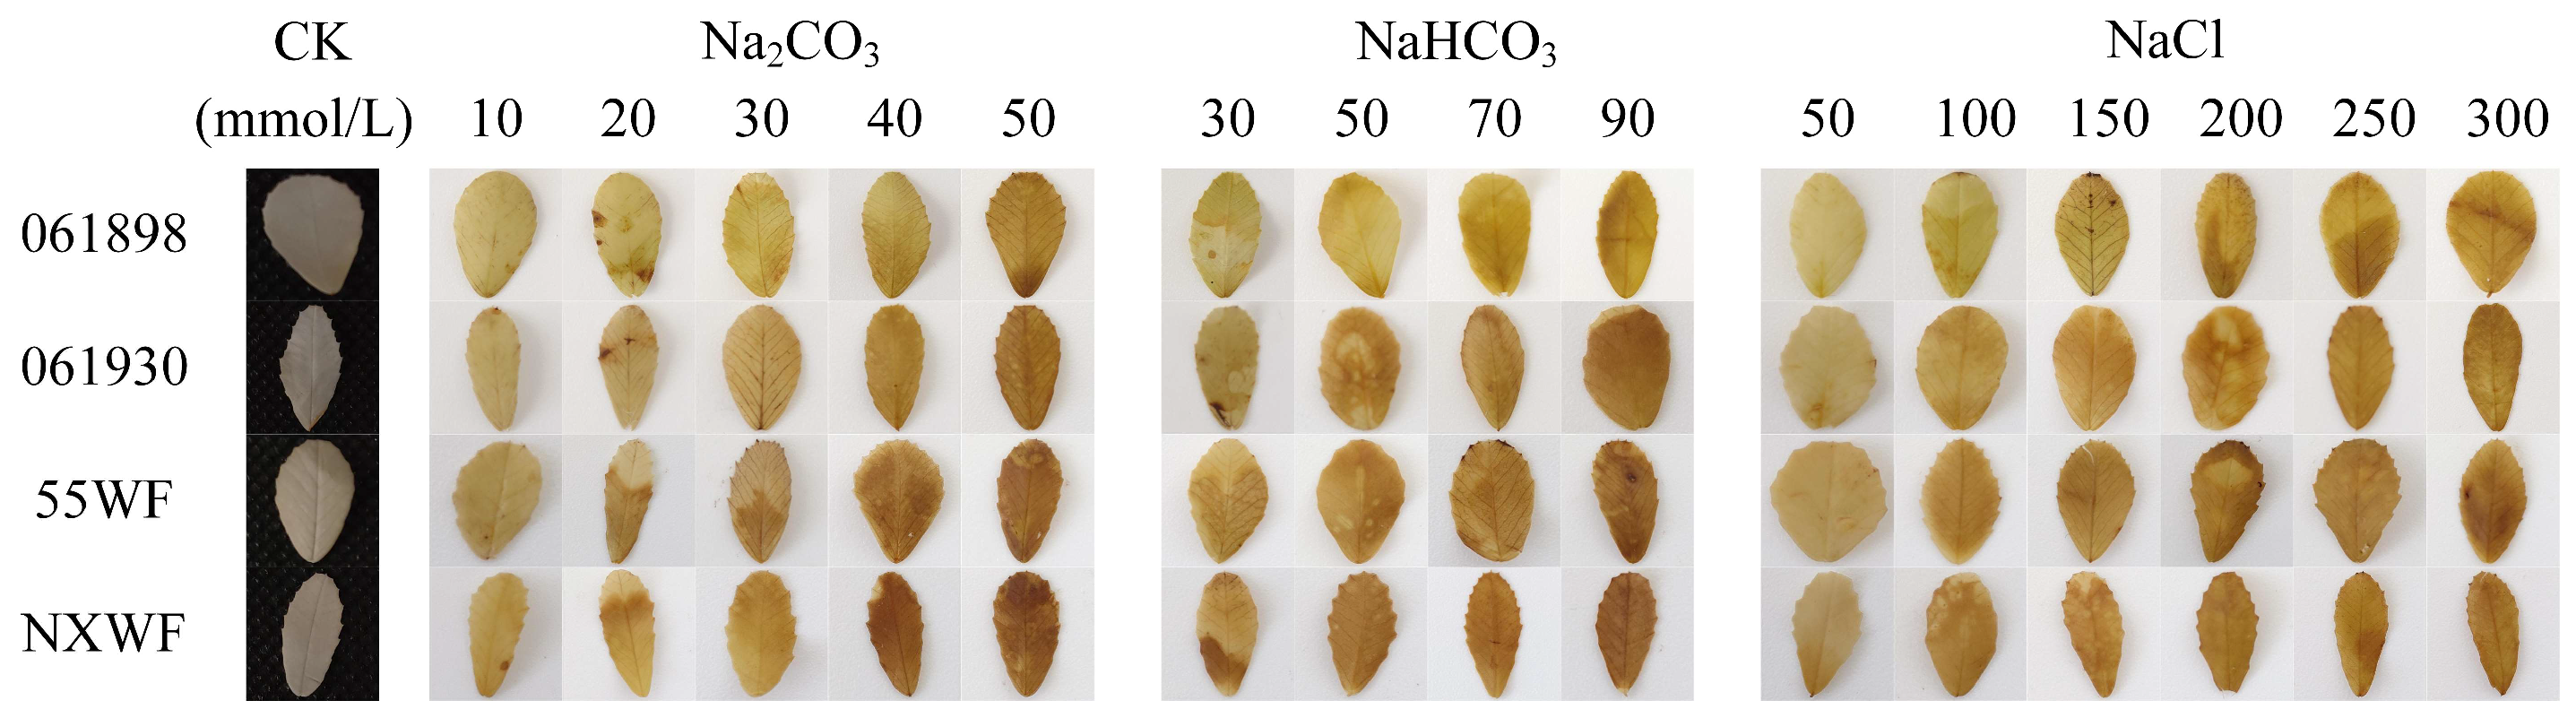
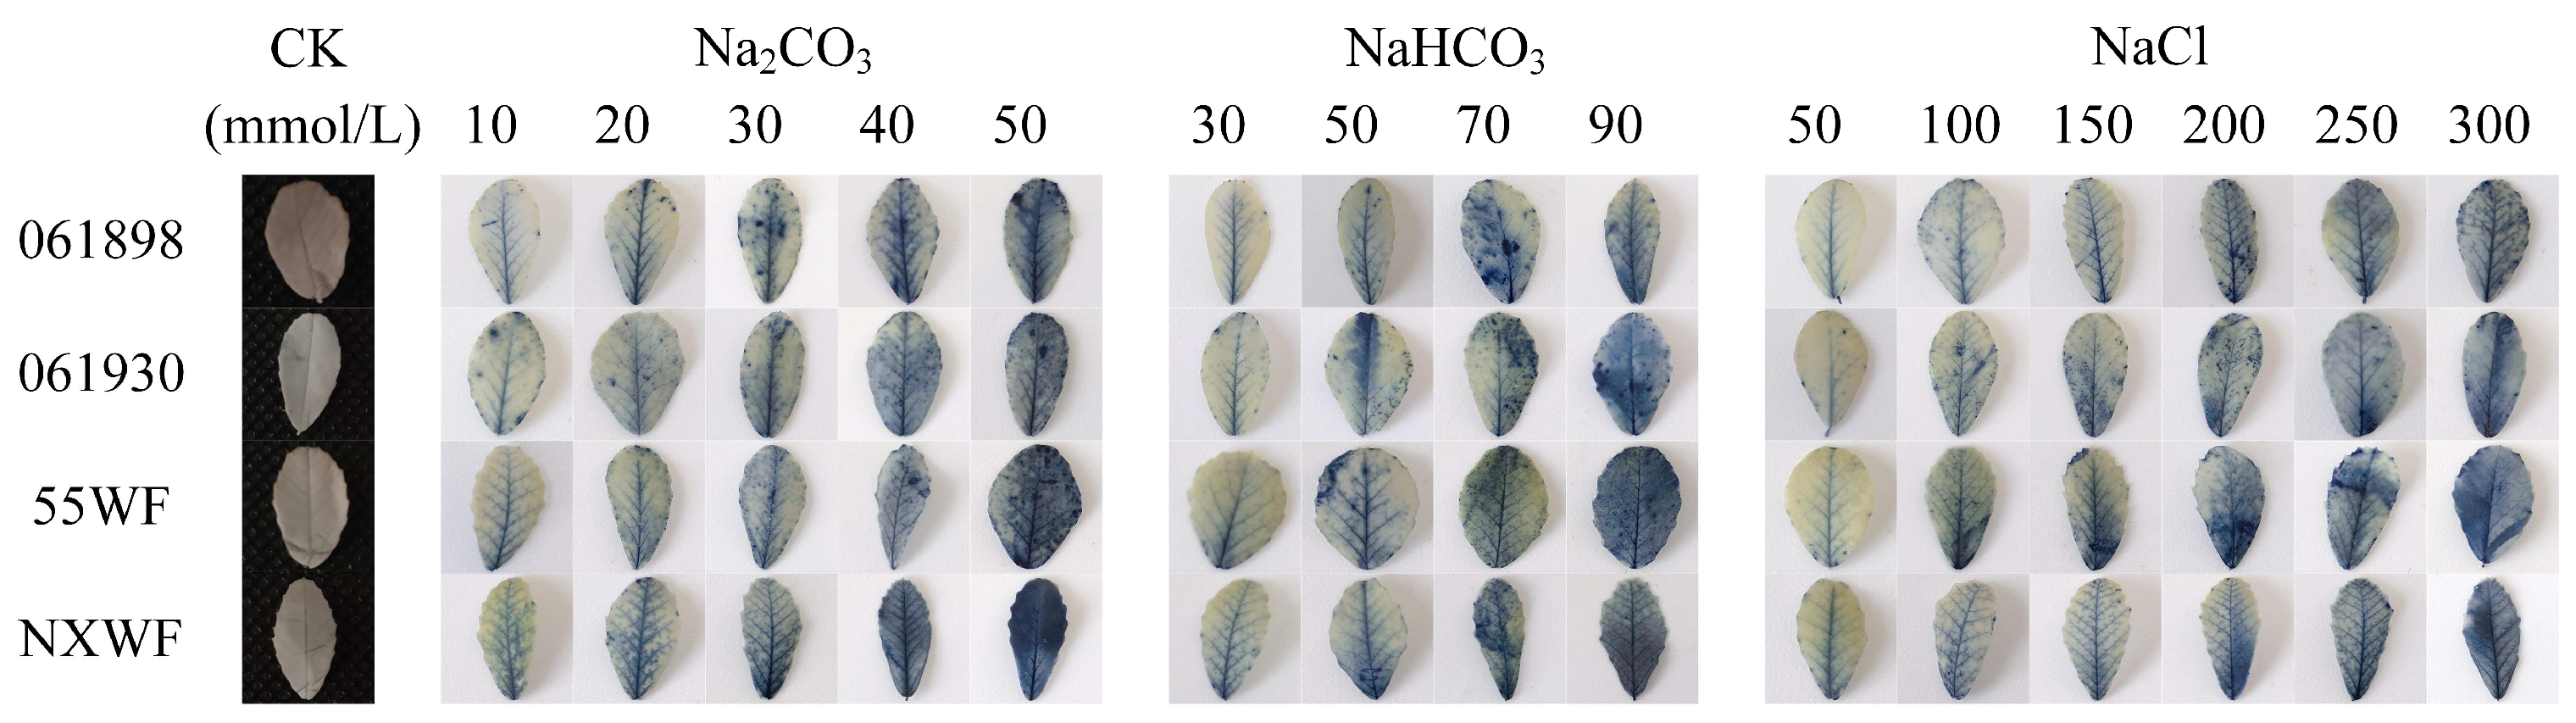
3.2.3. Effects of Saline–Alkali Stress on Sweet Clover ROS Accumulation and Cellular Damage in Leaves

To gauge the extent of sweet clover cellular damage under saline–alkali stress conditions, the accumulation of two important ROS elements (H2O2 and O2) was measured in leaf cells of the four varieties of sweet clover by using DAB and NBT staining, respectively. In the control, there was little leaf accumulation of H2O2 and O2 in the four varieties of sweet clover (Figure 7 and Figure 8), while H2O2 and O2 gradually accumulated with increasing concentrations of the three salts. Under the three saline–alkali stress conditions, 061898 accumulated the lowest levels of H2O2 and O2, while NXWF had higher leaf levels after the stress treatments, and dark brown (DAB) and dark blue (NBT) staining was detected.

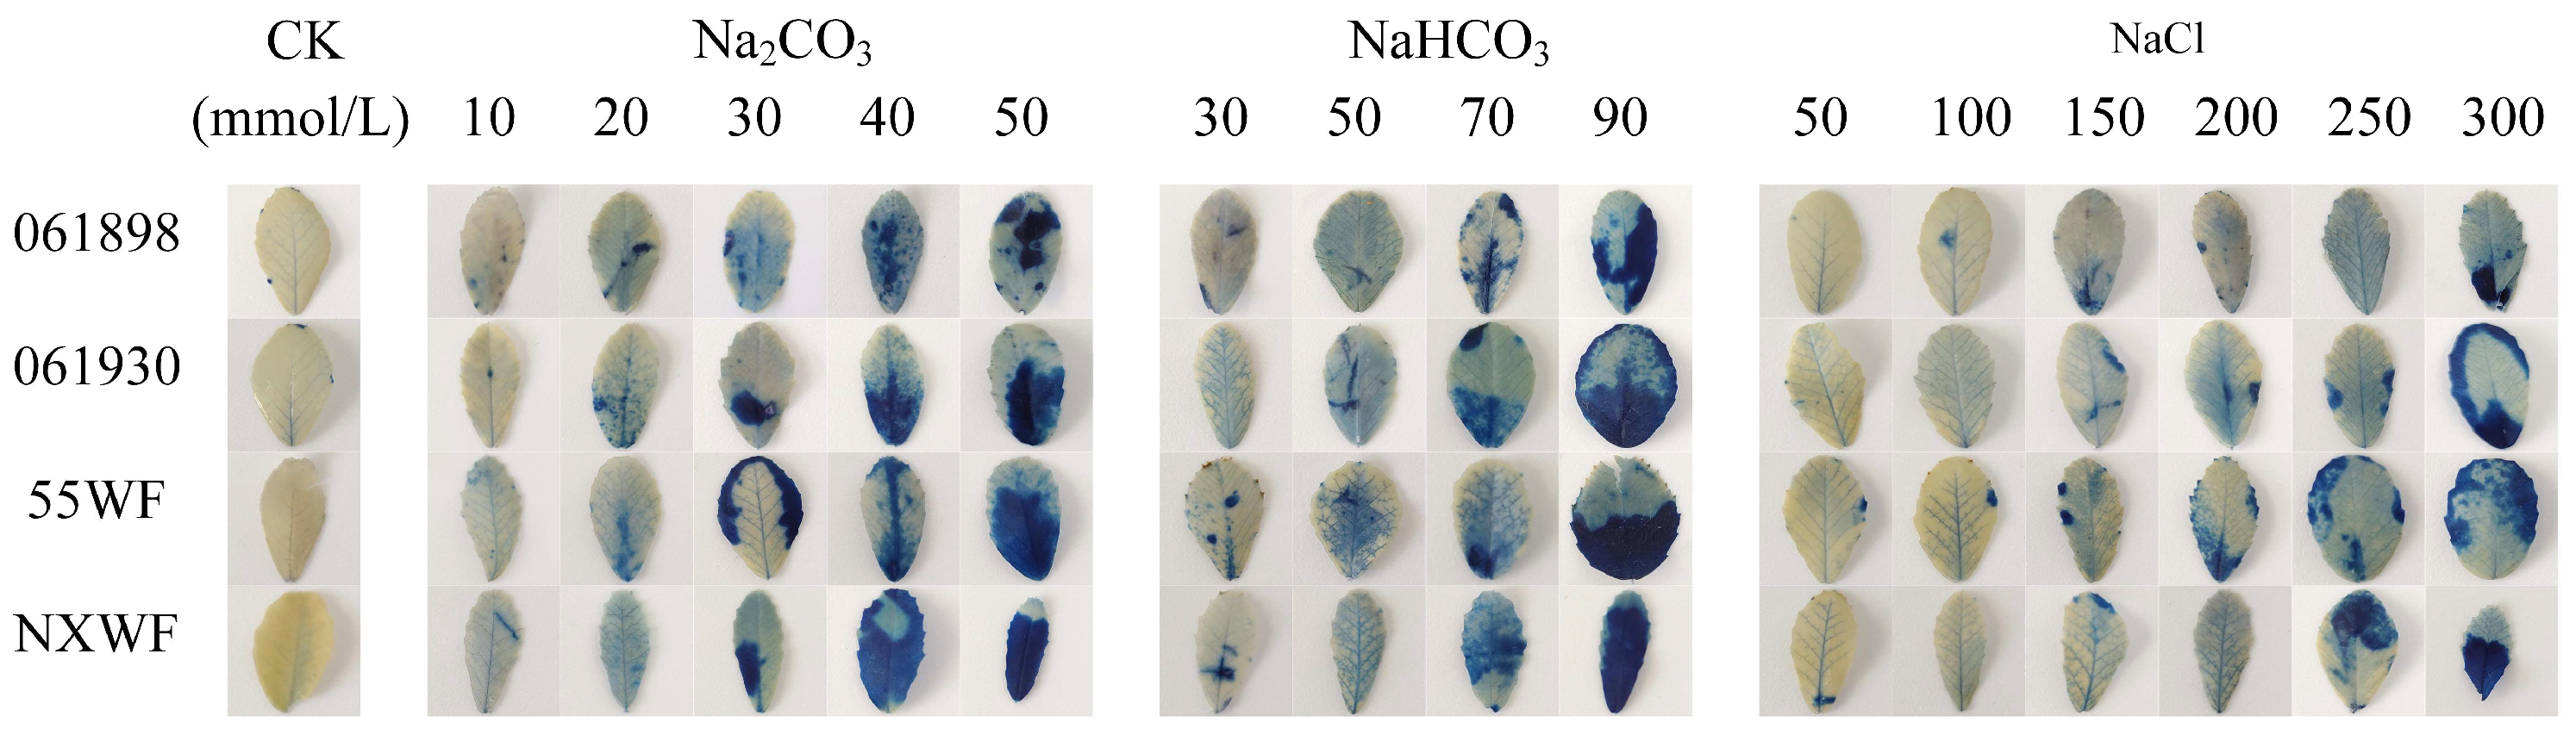
3.2.4. Effect of Saline–Alkali Stress on Sweet Clover Leaf Cell Death

The detection of plant cell activity is a direct and effective method to determine the degree of plant injury. In this experiment, Evans blue staining was used to detect cell death in sweet clover leaves after different salt treatments. Leaves of the four varieties were barely stained blue in the controls, but as the saline–alkali solution concentration increased, the blue-stained area gradually enlarged, the degree of staining deepened, and the number of dead cells increased. When the Na2CO3, NaHCO3, and NaCl solutions reached 50, 90, and 300 mmol/L, respectively, the stained area was the smallest in 061898 and the largest in NXWF, and cell death in 061898 was significantly lower than in NXWF (Figure 9).

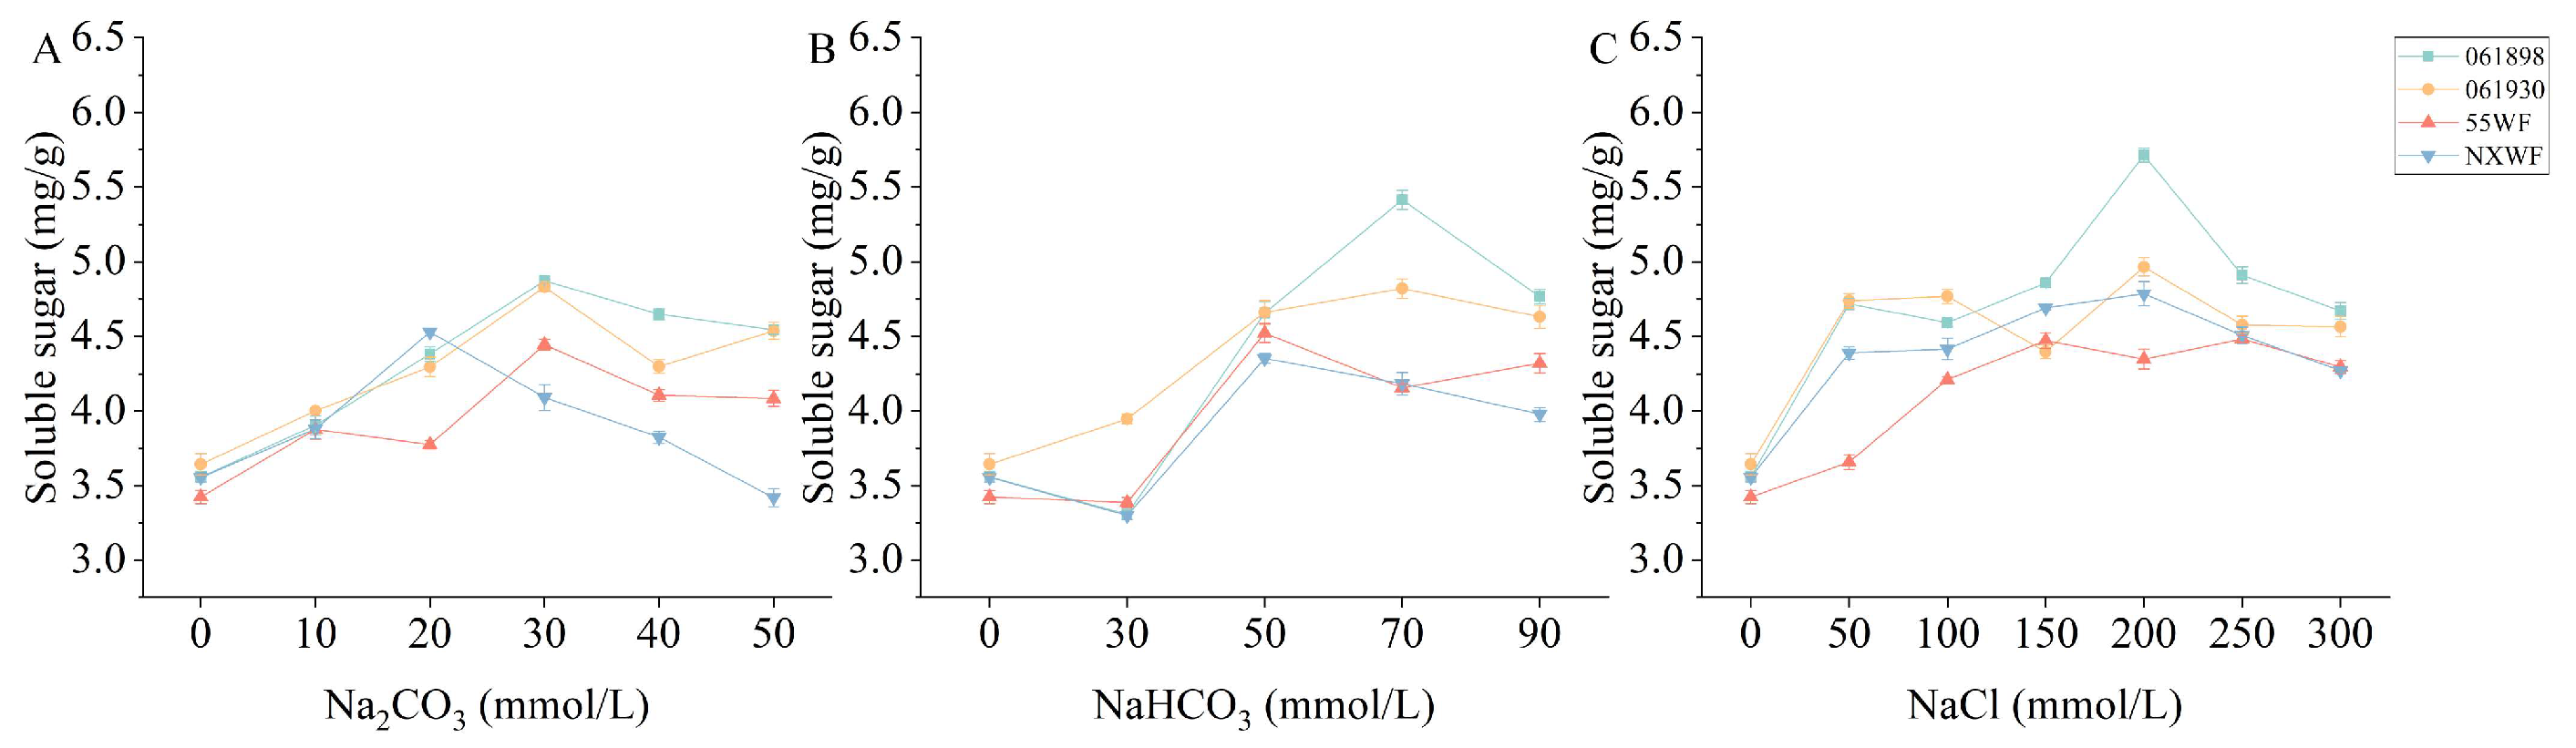
3.2.5. Effect of Saline–Alkali Stress on Sweet Clover Soluble Sugar Content

The types 061898, 061930 and 55WF had peak soluble sugar contents at an Na2CO3 solution of 30 mmol/L, which were 37%, 32%, and 30%, respectively, higher than that of the control (Figure 10). The peak content of NXWF occurred at a concentration of 20 mmol/L, which was 27% greater than that of the control. When the Na2CO3 solution was 50 mmol/L, NXWF soluble sugar content decreased by 4% compared with that of the control, but in the remaining three varieties, it increased slightly (Figure 10A). At the maximum NaHCO3 solution concentration, the soluble sugar content of the four varieties increased by 34%, 27%, 26%, and 12%, respectively, compared to that of the control (Figure 10B). At an NaCl solution of 200 mmol/L, the soluble sugar content of all four varieties increased significantly compared to that of the control, and at 300 mmol/L, the soluble sugar content increased by 31%, 25%, 25%, and 20%, respectively (Figure 10C). Overall, the four sweet clover varieties showed better tolerance to neutral salts than to alkaline salts when the same concentration of three different saline–alkali solutions were reached, with a greater tolerance to NaHCO3 than to Na2CO3.

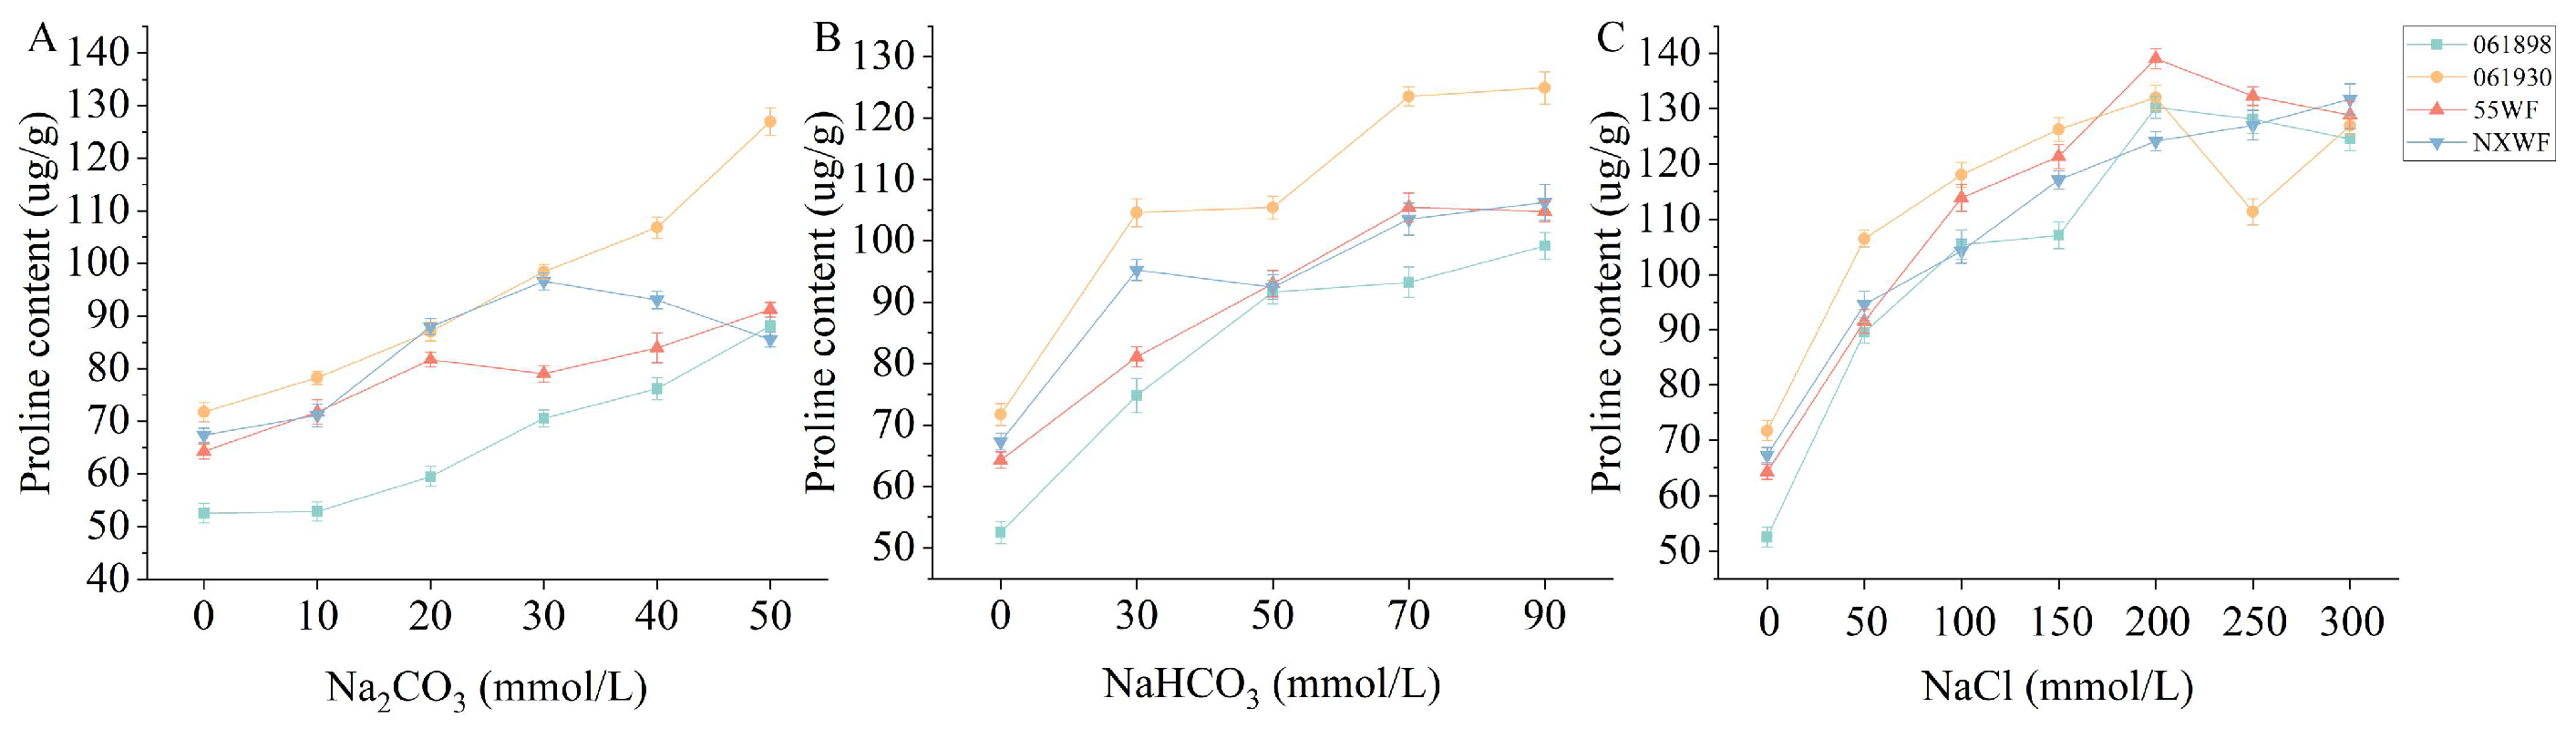
3.2.6. Effect of Saline–Alkali Stress on Sweet Clover Proline Content

Generally, the proline content of the four varieties tended to increase with increasing saline–alkali solution concentrations (Figure 11). At an Na2CO3 solution of 50 mmol/L, the proline content in all four varieties showed increases of 67%, 46%, 42%, and 26%, respectively, compared to the control (Figure 11A). A same trend was observed at an NaHCO3 solution of 90 mmol/L, which increased by 89%, 74%, 63%, and 58%, respectively, compared to the control, with 061898 increasing significantly more than NXWF (Figure 11B). Under NaCl stress conditions, the proline content initially increased and then decreased, with varying decreases at solution concentrations from 250 to 300 mmol/L. However, the proline content was always higher than in the control, increasing by 137%, 77%, 100%, and 96%, respectively, greater than the control at 300 mmol/L (Figure 11C). The four varieties were less tolerant to Na2CO3 at the same saline–alkali solution concentrations.

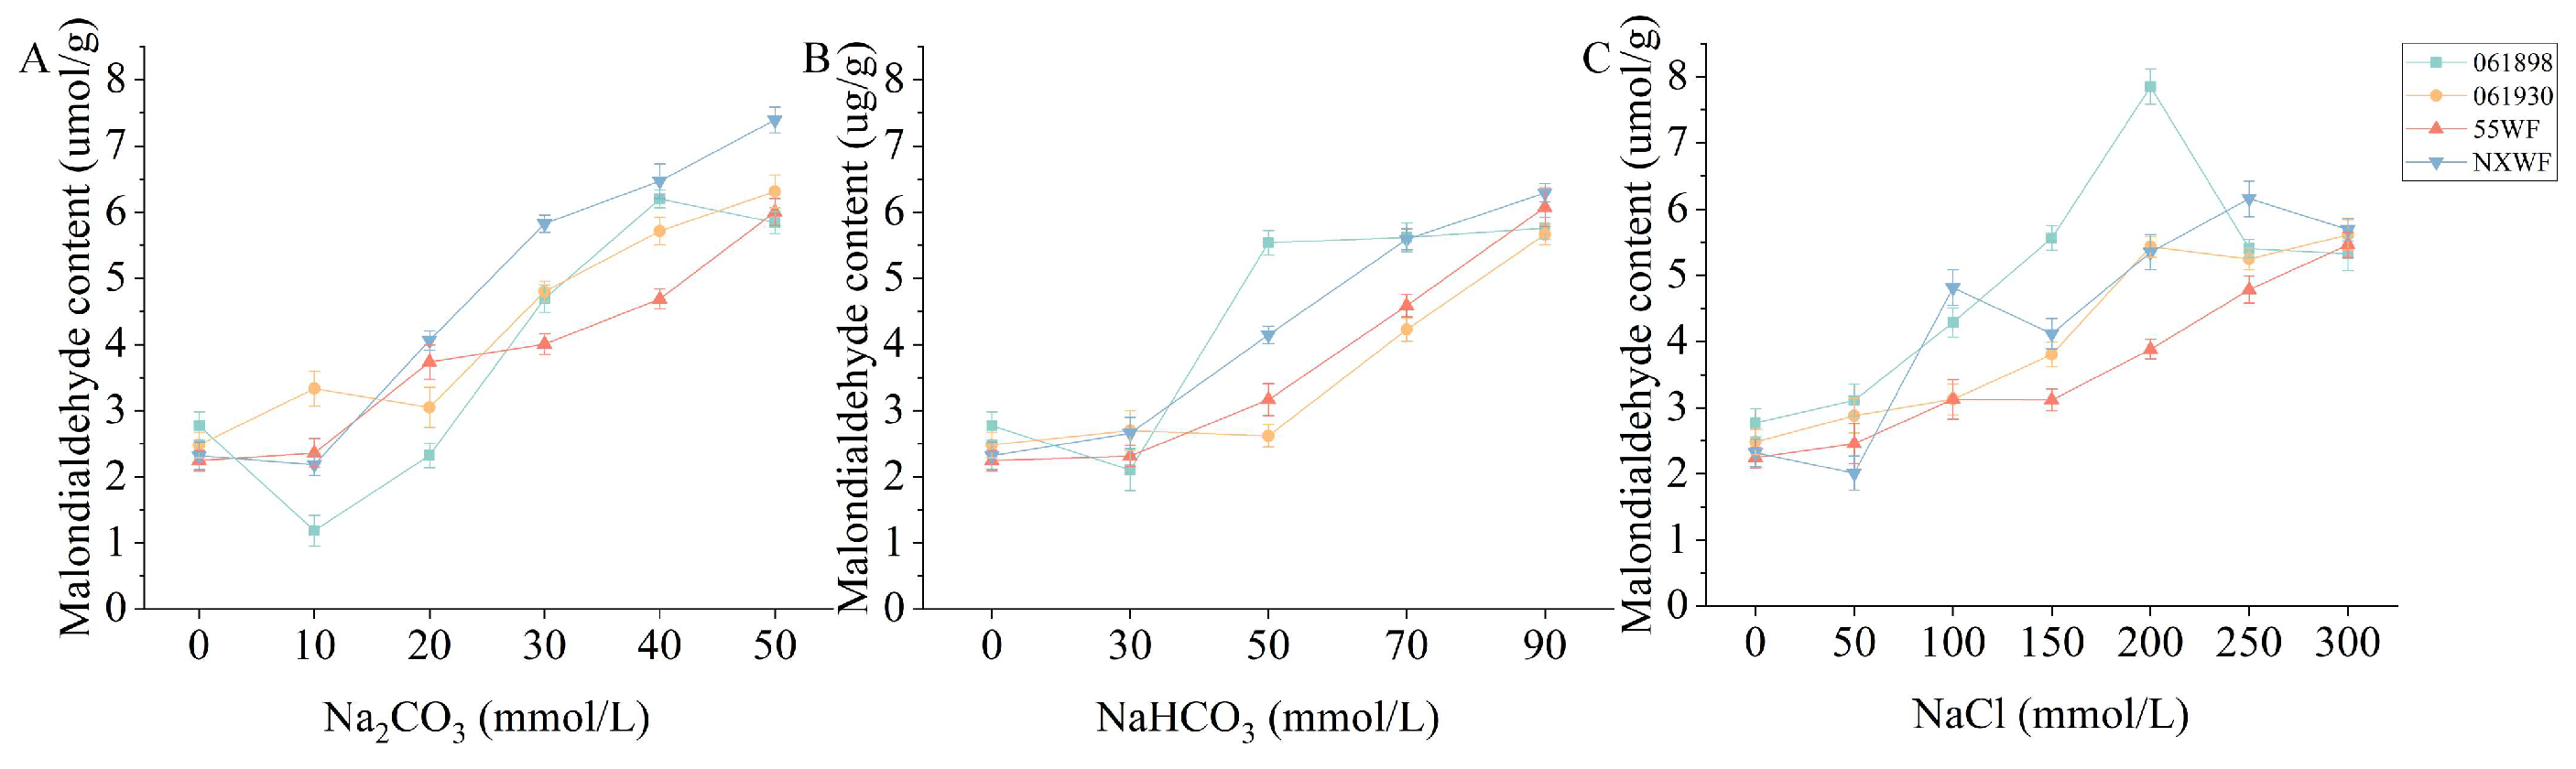
3.2.7. Effect of Saline–Alkali Stress on Sweet Clover Malondialdehyde Content

Under saline–alkali stress conditions, intracellular oxidative damage and membrane structure damage occur, and MDA content rises, which reduces cell membrane stability and exacerbates membrane system damage and cellular senescence. Generally, the leaf MDA content decreased and then increased in the four sweet clover varieties as saline–alkali solution concentrations increased (Figure 12). When the Na2CO3 solution reached 50 mmol/L, MDA contents of the four varieties were all significantly higher than that of the control, by 111, 154, 167, and 219%, respectively, with the rise in NXWF significantly higher than in 061898 (Figure 12A). At an NaHCO3 solution of 90 mmol/L, the MDA content of the four varieties reached the maximum for each treatment concentration, with increases of 108, 128, 170, and 171%, respectively, compared to that of the control (Figure 12B). Under NaCl solution stress, the MDA contents of the four varieties were 92%, 126%, 143%, and 145%, respectively, higher than the control at a concentration of 300 mmol/L (Figure 12C).
The MDA content of 061898 decreased and was lower than that of the control when Na2CO3 and NaHCO3 solutions were 10 and 30 mmol/L, respectively. It then began to increase and reached a maximum when Na2CO3, NaHCO3, and NaCl solutions reached 40, 90, and 200 mmol/L, respectively. Varieties 061930, 55WF, and NXWF exhibited a similar trend in MDA content changes. The four varieties experienced increasing stress in the following order: Na2CO3 > NaHCO3 > NaCl.

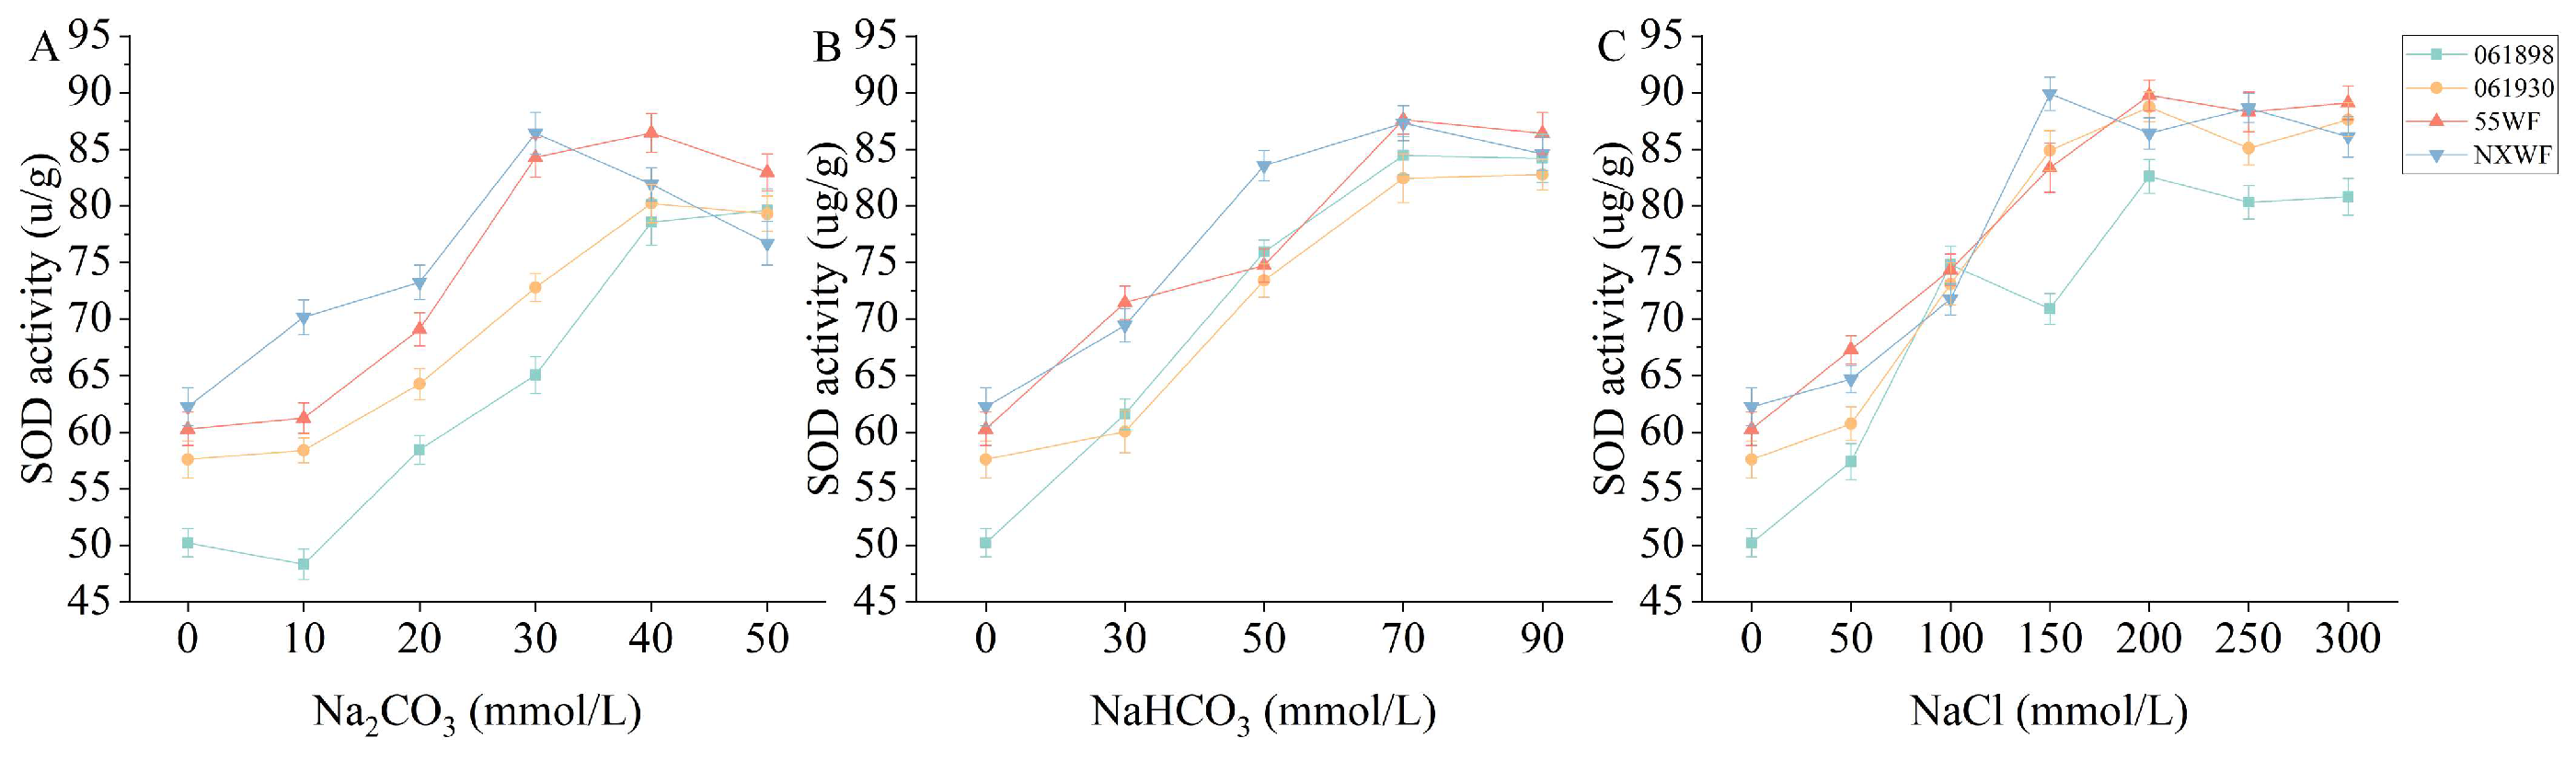
3.2.8. Effect of Saline–Alkali Stress on Sweet Clover SOD Activity

Generally, among the four sweet clover varieties, the SOD activity increased and then decreased with increasing saline–alkali solution concentrations (Figure 13). At an Na2CO3 solution concentration of 10 mmol/L, the varieties exhibited minimal change except for NXWF, which demonstrated a decrease in SOD activity compared to that in the control. At the maximum concentration, all four varieties showed increases in SOD activity compared to that of the control, with the respective increases being 59%, 38%, 38%, and 23% (Figure 13A). The order of increase in SOD activity of the four varieties under NaHCO3 solution stress was 061898 > 061930 > 55WF > NXWF (Figure 13B). Under NaCl stress conditions, NXWF’s SOD activity peaked at 150 mmol/L, which was 44% higher than that of the control, and the four varieties increased in the same order as NaHCO3 at 300 mmol/L (Figure 13C). All four varieties showed a smaller increase in SOD under stress with Na2CO3 solution than with NaHCO3 and NaCl when stressed with high saline–alkali solution concentrations.

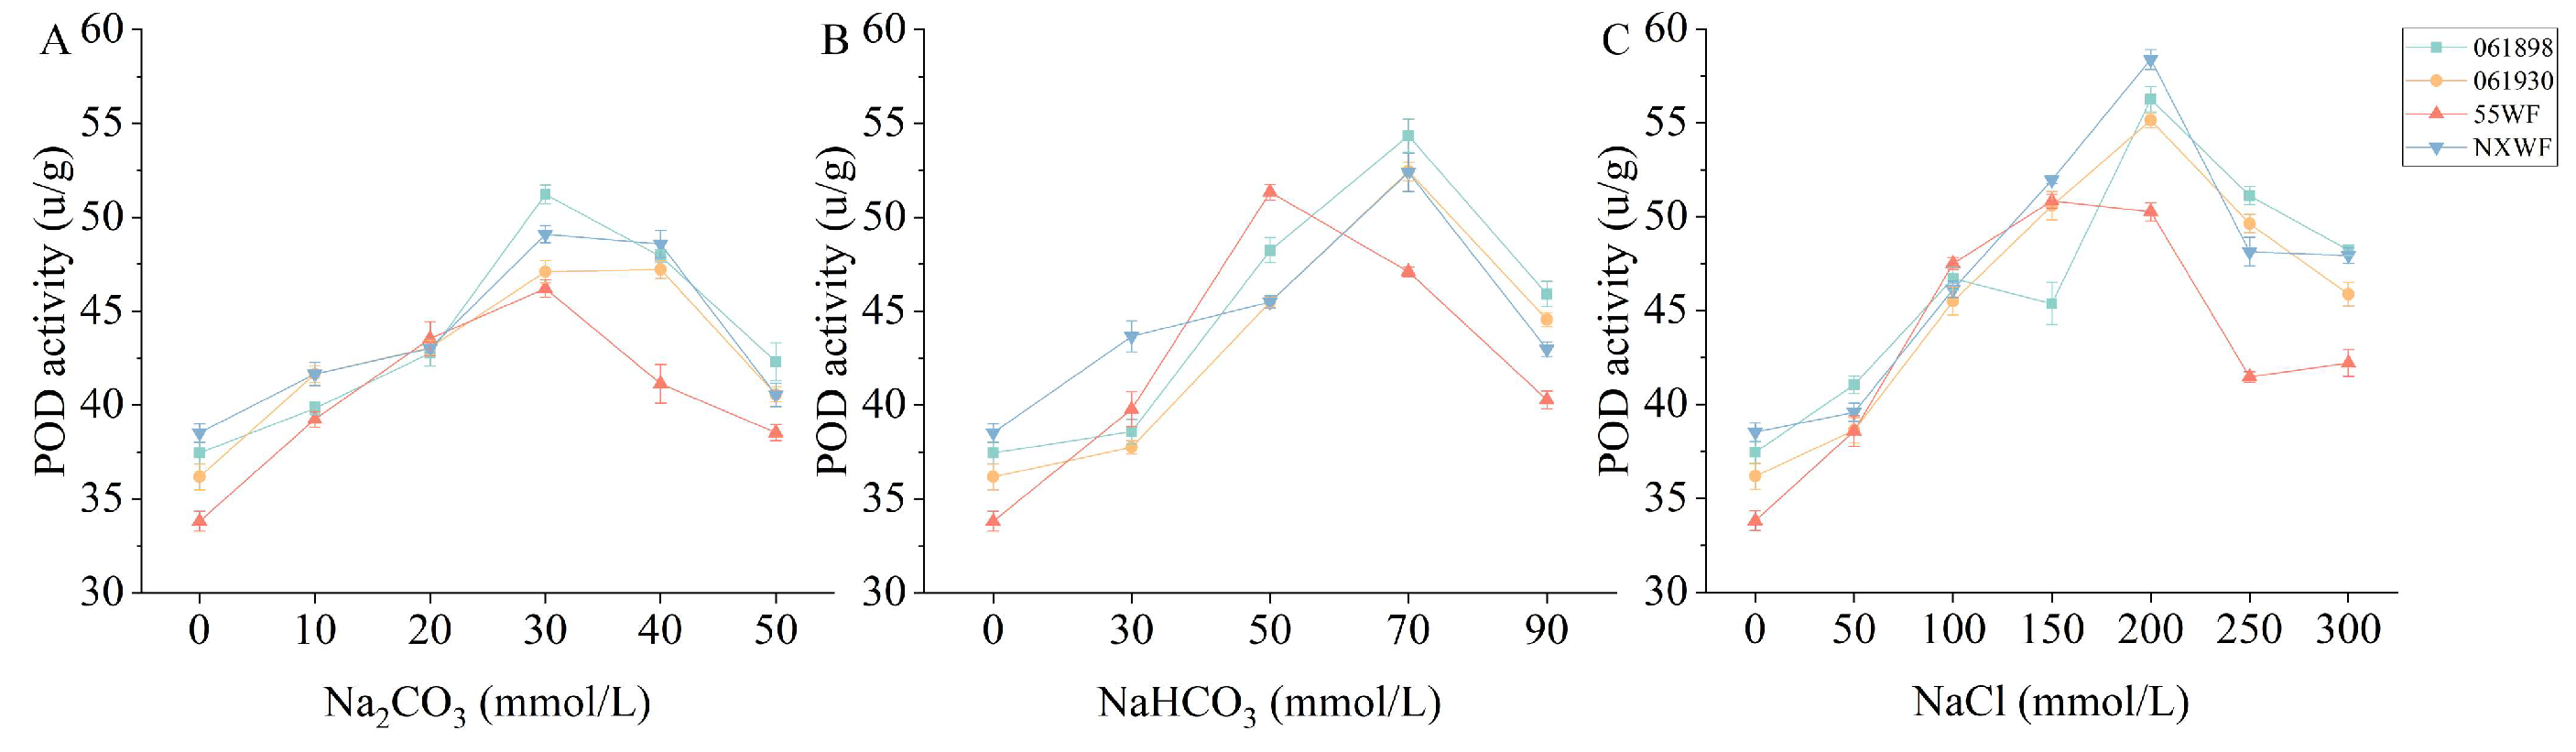
3.2.9. Effect of Saline–Alkali Stress on Sweet Clover POD Activity

At lower saline–alkali stress concentrations, the leaf POD activity of the four sweet clover varieties increased gradually with increasing solution concentrations, but when the saline–alkali solution concentration increased to a certain value, it began to decline (Figure 14). The Na2CO3 concentration at 30–40 mmol/L increased the leaf POD activity of the four varieties to a maximum, which differed significantly from that of the control. At 50 mmol/L, the POD activity was 13%, 12%, 14%, and 5% higher for the four varieties than the control (Figure 14A). At an NaHCO3 solution of 50 mmol/L, 55WF had the highest POD activity, and the remaining three varieties showed a peak at 70 mmol/L and then began to decline. By 90 mmol/L, the POD activity increased by 23%, 23%, 19%, and 12%, respectively, compared with that of the control (Figure 14B). The same trend was observed under NaCl stress conditions, with a decrease in POD activity appearing after the concentration was increased to 150–200 mmol/L (Figure 14C). For the three saline–alkali solutions at high concentrations, all four sweet clover varieties showed a greater POD activity increase in neutral, rather than in alkaline salts, with NaHCO3 being greater than Na2CO3.

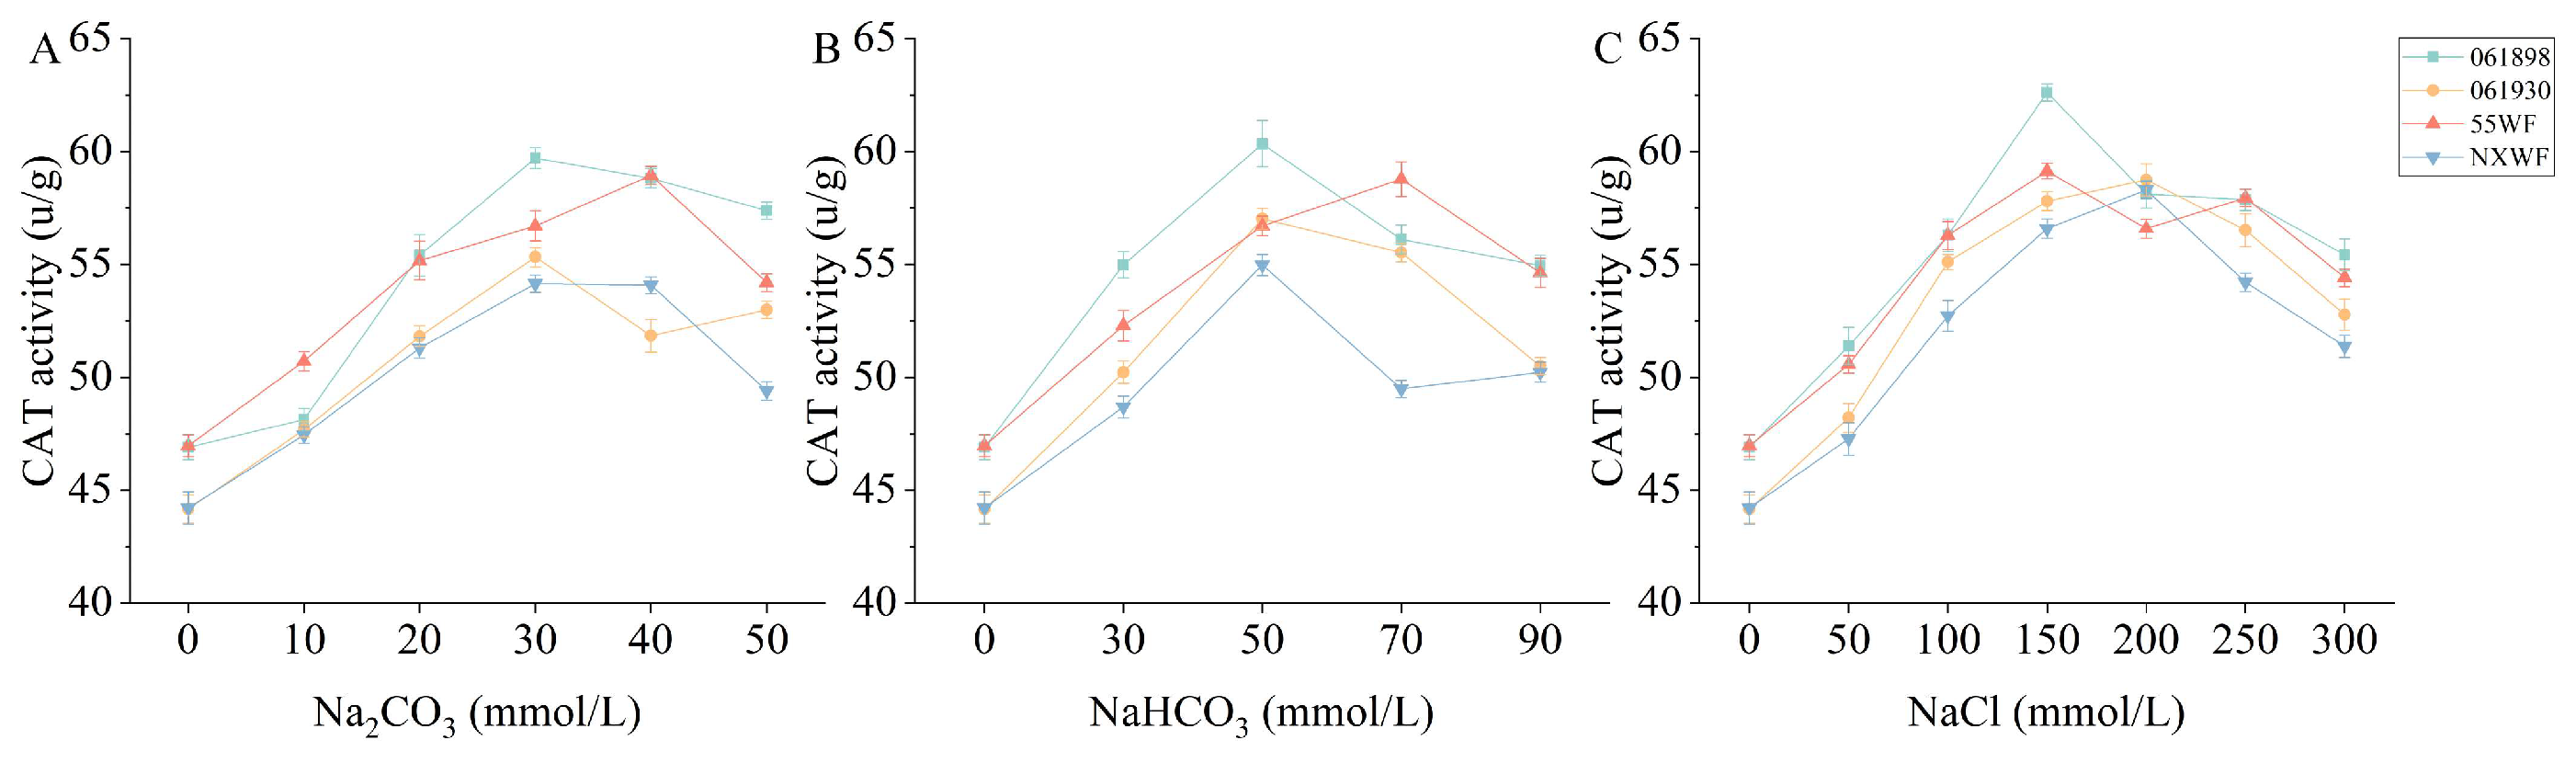
3.2.10. Effect of Saline–Alkali Stress on Sweet Clover CAT Activity

As the three saline–alkali solution concentrations increased, the CAT activity increased. After reaching a certain concentration, the CAT activity began to decrease, but was always higher than that in the control treatment (Figure 15). The Na2CO3 solution concentration at 40 mmol/L had the maximum CAT activity for 55WF, while the remaining three varieties peaked at 30 mmol/L and then began to decline. At a 50 mml/L solution, the CAT activity increased by 22%, 20%, 15% and 12%, respectively, compared to that of the control (Figure 15A). With a 90 mmol/L NaHCO3 solution, the CAT activity of the four varieties was 17%, 14%, 16%, and 14% higher, respectively, than those of the control (Figure 15B). The NaCl solution of 300 mmol/L showed an increase in all four varieties compared to the control, but the difference was not significant (Figure 15C). The CAT activity under alkaline salt stress conditions was greater than that under neutral salt.

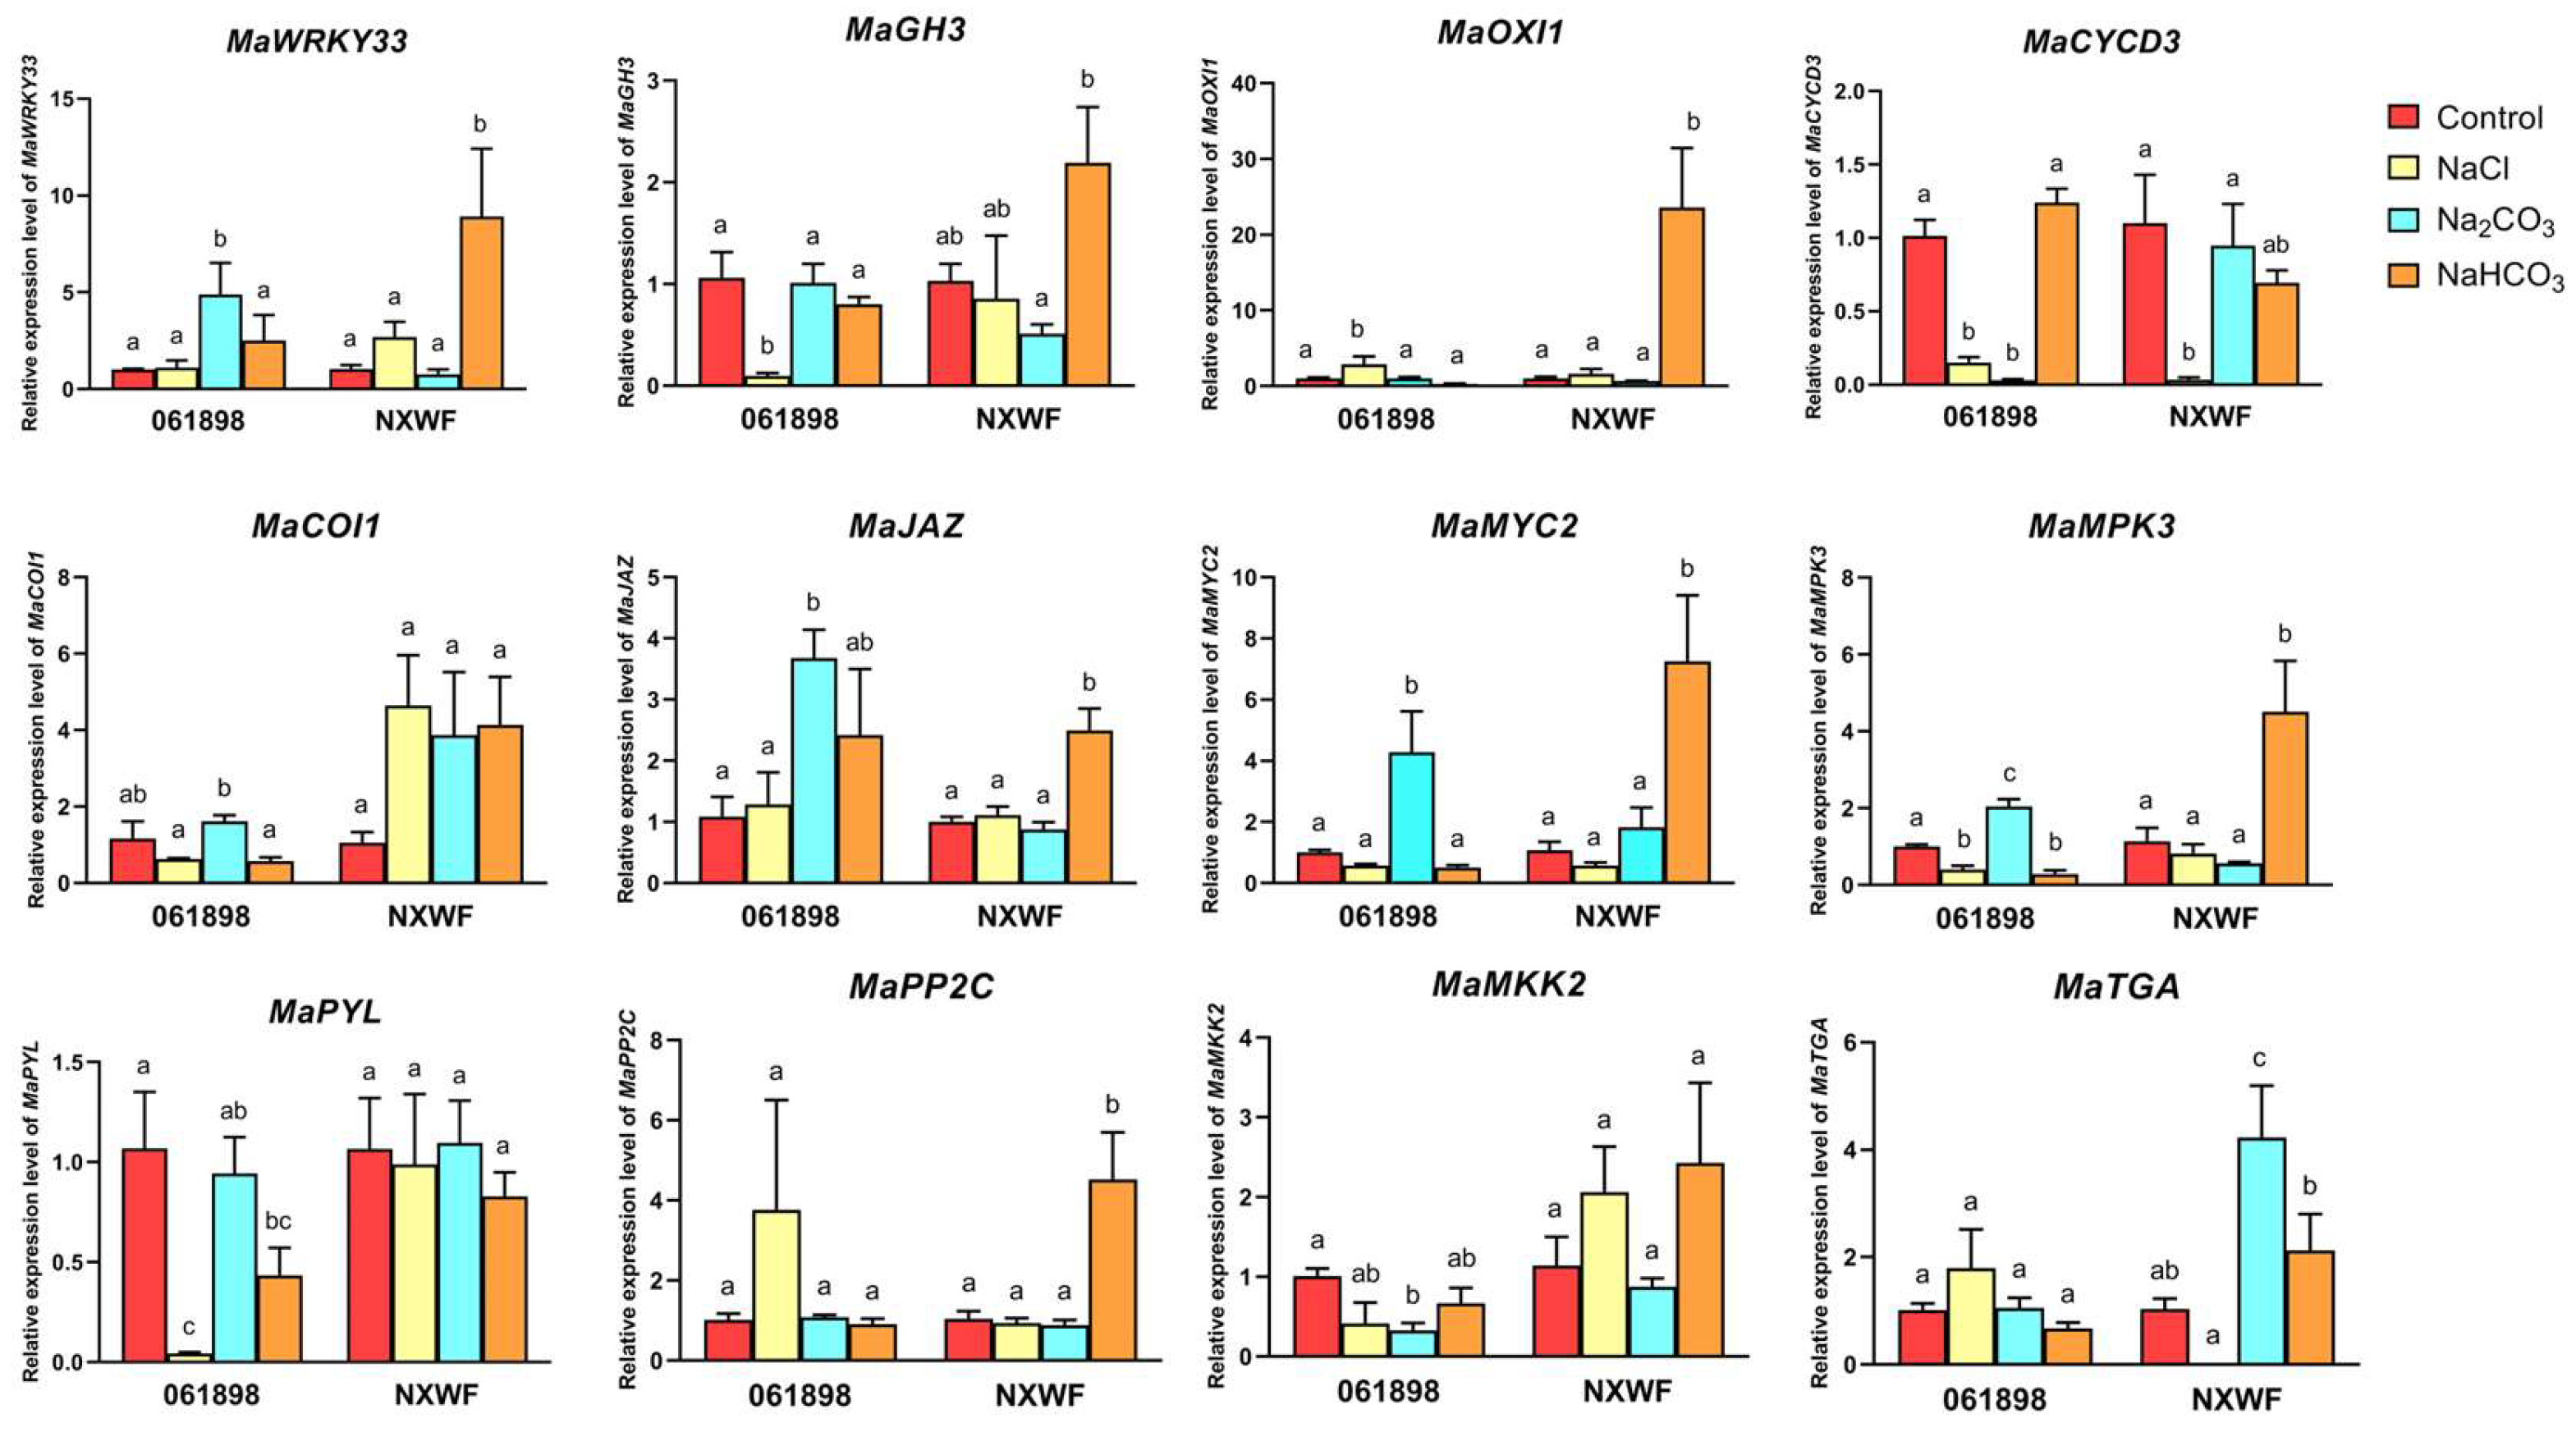
3.2.11. Gene Expression Level Analysis

Plants respond to saline–alkali stress by regulating the expression of various genes. We conducted an experiment to assess gene expression changes related to hormone signaling pathways and the MAPK pathway in salt-tolerant cultivar 061898 and salt-sensitive cultivar NXWF following treatment with 300 mmol/L NaCl, 50 mmol/L Na2CO3, and 90 mmol/L NaHCO3 (Figure 16). After the neutral salt (NaCl) treatment, there were no changes in the expression levels of WRKY33, MYC2, JAZ, COI1, and PP2C in both 061898 and NXWF. CYCD3 was downregulated, while GH3, MKK2, PYL, and MPK3 were downregulated in 061898, except for OXI1, which was upregulated. In NXWF, GH3 was upregulated and TGA was downregulated following NaCl treatment, though these changes were not statistically different from those in the control.
Under Na2CO3 and NaHCO3 alkaline stress, the deviations in gene expression patterns were greater than with NaCl stress. With mild alkaline stress, 061898 showed downregulation of PYL, MPK3, MKK2, and COI1; however, the changes in MKK2 and COI1 were not significant, and JAZ was upregulated but not significantly (Figure 16). In NXWF, the gene changes were more pronounced relative to 061898 (Figure 16), with significant upregulation of WRKY33, GH3, OXI1, MYC2, JAZ, PP2C, and MPK3. TGA was upregulated compared to the control, though not significantly, and CYCD3 was downregulated but not significantly. For severe alkaline stress, the changes in gene expression in 061898 were more apparent than NXWF, with significant upregulation of WRKY33, MYC2, JAZ, and MPK3 as well as significant downregulation of CYCD3 and MKK2. COI1 and PYL were upregulated and downregulated, respectively, but not significantly. For the sensitive material NXWF, following severe alkaline stress, only TGA showed a significant upregulation, while GH3 expression was downregulated but not significantly.
The findings indicate that sweet clover possesses a certain degree of saline–alkali tolerance, with more pronounced effects on gene expression from alkaline salts than neutral salts. Resistant and sensitive varieties may activate different genes in response to identical stress treatment, and the same variety may enact different molecular regulatory mechanisms for different saline–alkali treatments.

4. Discussion

4.1. Effect of Saline–Alkali Stress on Sweet Clover Germination

Tolerance to saline–alkali stresses varies among growth stages, with the germination stage being more sensitive to external stresses than other stages [30,31]. In this study, we observed that the germination rate was unaffected when seeds were subjected to low concentrations of saline–alkali treatment. However, high saline–alkali stress more strongly inhibited seed germination, which may be due to the reduction of seed osmoregulatory capacity by saline–alkali stress, thereby affecting their germination [32]. Additionally, saline–alkali stress disrupts seed cell membrane structure, which leads to metabolic disorders and reduced seed germination [33]. Studies have shown that the germination rate of salinity-tolerant materials are generally higher than those of the sensitive varieties [34]. In this experiment, the germination rate of 061898 was still above 50% at an Na2CO3 concentration of 30 mmol/L, whereas NXWF seeds did not germinate. In our study, seeds of the four sweet clover varieties were most tolerant of NaCl, followed by NaHCO3 and finally Na2CO3. Yanmin Lu et al. [35] also found that alkaline salts inhibit seed germination in Trifolium repens more than neutral salts.
A salt stress environment destroys the cell structure and inhibits normal shoot and root growth [36], in which the root system is the first part to be exposed to the saline–alkali environment and subjected to saline–alkali stress, which is mainly manifested in the osmotic potential of the water uptake being blocked [37], and the ionic toxicity and membrane permeability increased. We found that with increasing concentration, the three salts had a significant inhibitory effect on the embryonic root and germ of the four sweet clover varieties. Meanwhile, the inhibitory effect on the radicle was stronger than on the germ, which is consistent with the results of Liu Binshuo et al. [38] on the effect of seed germination of Leymus chinensis under saline–alkali stress.

4.2. Effect of Saline–Alkali Stress on Sweet Clover Seedlings

4.2.1. Effect of Saline–Alkali Stress on Chlorophyll Content and Chlorophyll Fluorescence

Conducting photosynthesis is an essential physiological process for plant life activities, and chlorophyll is the basis for photosynthesis [39]. Under normal growth conditions, plant chlorophyll content exhibits dynamic equilibrium, but saline–alkali stress disrupts this balance, causing changes in the chlorophyll content [40]. The chlorophyll content changes can reflect stress factors on the plant and measure the strength of the plant’s saline–alkali tolerance [41]. In our experiment, the chlorophyll content of the four sweet clover varieties initially increased and then decreased. Under low saline–alkali concentration stress, the leaf chlorophyll content was elevated higher than that in the control treatment, indicating that sweet clover seedlings increased chlorophyll pigments to synthesize photosynthetic products and thus improved saline–alkali tolerance [42]. When the saline–alkali solution concentration reached the maximum, in the salt-sensitive variety NXWF, the chlorophyll content decreased more than in 061898, these different amplitude changes reflecting the differential tolerance among sweet clover varieties.
Chlorophyll fluorescence can reflect plant photosynthetic physiology under saline–alkali stress [43], which leads to osmotic stress that can damage chloroplast membranes [44]. Lowered chlorophyll fluorescence parameter values indicated that PSII was damaged by saline–alkali stress. The higher the alkaline concentration and the lower the saline–alkali tolerance, the more severe damage to PSII. Salt stress reduces the Fv/Fm ratio, affecting the efficiency of photosystem II [45], which can indicate the degree of salinity stress suffered by plants [46]. Our observed decreases in chlorophyll fluorescence parameter values indicated that PSII was damaged by salt stress and that the plants were more affected by saline–alkali stress. In this study, the change in the Fv/Fm ratio before and after stress was greater than zero in 061898, 061930, and 55WF under Na2CO3 and NaHCO3 stresses, as well as for all four sweet clover varieties under NaCl stress. However, the difference between the values before and after stress was smaller, indicating that sweet clover was able to effectively maintain PSII activity and potential maximum light energy conversion efficiency. Under saline–alkali stress, so, the plant light and reaction tend to stabilize, to prevent the net photosynthetic rate from decreasing too much [47]. This is a protective mechanism for sweet clover’s adaptation to saline–alkali stress environments [23,48].

4.2.2. Effects of Saline–Alkali Stress on H2O2 and O2 Accumulation and Cell Death

The accumulation of two important ROS elements (H2O2 and O2) in leaves under saline–alkali stress conditions was observed by using DAB and NBT staining, reflecting the degree of plant leaf damage [23]. In this experiment, the levels of H2O2 and O2 accumulation in the leaves of the four sweet clover varieties increased with the concentration of the saline–alkali solution, and at the maximum saline–alkali solution stress, 061898 accumulated the lowest H2O2 and O2. Higher accumulations of H2O2 and O2 were observed in the severely damaged NXWF, which is in agreement with Senjuti Sen et al. [23] and An YM et al. [49]. In this case, the effect of alkaline salt was greater than that of neutral salt.
Salt and alkali stress lead to plant cell death, so plant cell activity detection is used as a direct and effective method to determine the extent of plant damage and to test salinity tolerance [24]. Consistent with the trend of ROS accumulation, the cell death area of saline–alkaline resistant variety 061898 was significantly smaller than that of NXWF at the highest concentration. These results are in accordance with Senjuti Sen et al.’s [23] findings on the salt stress of chickpea cell death, as well as Liu Nan et al.’s [24] research on how salt stress affects the cells in Arabidopsis thaliana leaves.

4.2.3. Effects of Saline–Alkali Stress on Osmoregulation MDA Content

Osmoregulation is one of the most basic features of plant salinity tolerance, and its enhancement is a crucial mechanism to increase plant salinity resistance [32]. The most common osmoregulators are free proline and soluble sugars [50,51]. Numerous studies have shown that the higher the content of soluble sugars accumulated by the plant in a certain period under adverse conditions, the higher the plant’s resilience [52]. In this study, the leaf soluble sugar content of the four sweet clovers initially increased and then decreased with increasing saline–alkali solution concentrations. The saline–alkaline-resistant 061898 accumulated more soluble sugar. Same as soluble sugar, the proline content in the four sweet clover varieties exhibited an increase, and the increase in 061898 was greater than in NXWF. However, it has been observed that, beyond a certain concentration of saline–alkali, the intracellular concentration of proline starts to decrease. This could be due to increased saline–alkali causing lipid peroxidation, which could affect the permeability of the cell membrane, leading to an inability to accumulate proline.
MDA is an important end product of membrane lipid peroxidation, and its enrichment further reduces cell membrane stability [53], exacerbating membrane system damage and cellular senescence. High and low MDA levels directly reflect the degree of damage to the cellular membranes and resistance to adversity and stress conditions [54]. The study confirmed that salinity and alkalinity stress induced an increase in the MDA content in various plants [55,56,57]. A low saline–alkali concentration is less injurious to plants, and their defense system can efficiently fight against the cell damage caused by saline–alkali stress [57]. Under saline–alkali stress conditions, the MDA content in the more resistant sweet clover varieties increased significantly less than in the sensitive varieties, which is consistent with the findings of Li Ruiqiang et al. [48]. Among the three saline–alkali solutions, the degree of damage to membrane lipids inside plant cells was significantly greater with alkaline salt than with neutral salt.

4.2.4. Effect of Saline–Alkali Stress on Antioxidant Enzyme Activities (SOD, POD, CAT)

A membrane protective enzyme system capable of scavenging ROS exists in plants and mainly includes superoxide dismutase (SOD), peroxidase (POD), and catalase (CAT) [58]. These convert excessive intracellular ROS into harmless substances, such as H2O, and maintain the balance of the reactive oxygen species metabolism in the plant body, to avoid damage by reactive oxygen species [59,60]. Changes in antioxidant enzyme activities show the degree of plant antioxidant damage, which is an important indicator of plant abiotic stresses [10]. In this study, SOD, POD, and CAT activities of sweet clover seedlings under the stress of the three saline–alkali solutions increased and then decreased with saline–alkali solution concentrations. When the concentration of the three saline–alkali solutions increased to a certain value, all four sweet clover enzyme activities decreased, indicating that the protective enzyme system balance was disrupted by increased saline stress, which exacerbated membrane lipid peroxidation and caused membrane damage [61]. Salt-tolerant varieties possessed higher antioxidant enzyme activity [11]. The resistant variety 061898 maintained relatively high enzyme activity than NXWF under saline–alkali stress, thus mitigating membrane damage caused by membrane lipid peroxidation. Meanwhile, SOD, POD, and CAT activities in sweet clover under neutral salt stress were higher than under alkaline salt stress, and Yuan Lin et al. [5] similarly found that alkaline salt had a greater effect than neutral salt on the Pistachio protective enzyme system.

4.3. Sweet Clover Gene Expression under Saline–Alkali Treatment

Excessive ROS production can cause serious oxidative damage, while appropriate ROS production acts as a defense signal to improve stress tolerance [62]. ROS-activated mitogen-activated protein kinases (MAPKs), in combination with activated signal molecules, initiate several transcription factors like WRKYs, resulting in the transcription of multiple stress responsive genes [63,64,65]. Recent studies suggest that AtWRKY33 may act as a direct or indirect regulator, coordinate or control downstream salt stress-related genes, and affect plant salt tolerance [66]. Our results indicate that in resistant sweet clover 061898, an upregulation in the expression level of WRKY33 occurred when treated with Na2CO3, whereas an increase in WRKY33 expression was also detected in the salt-sensitive variety under mild saline–alkali stress. This may be associated with the accumulation of higher levels of ROS under alkali stress.
In Arabidopsis, an oxidative signal-inducible gene (OXI1) has been shown to function upstream of MAPK cascades [67]. An OXI1-MPK3/MPK6 cascade was activated by ROS [68] and OXI1-NDPK2-MPK3/MPK6 was suggested to enhance tolerance against freezing and salinity [69]. Additionally, the mitogen-activated protein kinase (MAPK2) kinase 2 (MKK2) and the downstream MPK4 and MPK6 were shown to be key regulators of ROS stress signaling [70,71]. In Arabidopsis, over-expression of wild-type or constitutively active MKK2 resulted in elevated MAPK kinase activity of MKK2 and enhanced salt tolerance [71]. We found that in 061898, MKK2 expression level downregulated, especially in Na2CO3 treatment, and OXI1 and MPK3 were significantly upregulated in response to NaCl and Na2CO3 treatments. For NXWF, OXI1 and MPK3 expression levels notably increased after NaHCO3 stress. There was a corresponding increase in leaf ROS accumulation. The activation of ROS triggered OXI1 and MPK3, enabling sweet clover to adapt to high saline–alkali environments. Yet, we noted variations in the expression profiles between resistant and susceptible genotypes, as well as differences in response to various types of saline–alkali conditions.
Hormones are major players in the establishment and interconnection of plant signaling networks and have traditionally been divided into two groups: growth-related hormones (such as auxin, gibberellic acid (GA), cytokinins, brassino steroids, and strigolactones) and stress-related hormones (such as abscisic acid (ABA), salicylic acid (SA), ethylene (ET), and JA) [72,73,74]. We quantified the expression levels of genes associated with signaling pathways for ABA (PYL, PP2C), JA (COI1, JAZ, MYC2), SA (GH3, TGA), and BR (CYCD3). The gene exhibited distinct expression patterns, suggesting that both resistant and susceptible sweet clover genotypes possess a certain level of tolerance to NaCl, with the JA signaling pathway likely serving as a primary modulator regulating sweet clover saline–alkali tolerance. In susceptible genotypes, in addition to the JA pathway, the SA pathway may also play a role in the response to mild alkaline conditions.

5. Conclusions

In conclusion, to alleviate the damage caused by saline–alkali stresses, sweet clover seedlings enhanced their stress resistance by elevating the content of osmoregulatory substances, enhancing the activity of antioxidant enzymes, and modulating gene expression levels to adapt to the stressful environment. Sweet clover’s tolerance to three types of salts is ranked as follows: NaCl > NaHCO3 > Na2CO3. Salt-alkali resistant sweet clovers exhibit the capacity to sustain normal growth under high saline–alkali stress, positioning them as promising candidates for the reclamation of saline–alkaline soil. Furthermore, this study uncovers differential gene regulatory patterns and signaling pathways under neutral and alkaline salt stresses. A deeper exploration of these molecular responses to individual salt stresses could facilitate a more comprehensive understanding of the complex control mechanisms operative under combined salt stress conditions. Our study offers valuable guidance for the exploitation and utilization of sweet clover, as well as for the breeding of new cultivars.

Author Contributions

Conceptualization, Z.W., J.Y., Z.S. and C.G.; methodology, Z.W. and J.Y.; software, Z.W., J.Y. and X.Z.; validation, Z.W., J.Y., X.X., Y.Y., J.W., D.Z. and L.M.; resources, J.W. and D.Z.; writing—original draft preparation, Z.W. and J.Y.; funding acquisition, Z.S. and C.G. All authors have read and agreed to the published version of the manuscript.

Funding

This research was funded by “Agricultural Technology Innovation Project of Heilongjiang Province, CX23GG06”, “Scientific Research Foundation of Heilongjiang Province, CZKYF2022-1-B012”, “Research Foundation of Heilongjiang Academy of Agricultural Sciences (2020YYYF009)”, and “National Natural Science Foundation of China (NSFC) (U21A20182)”.

Data Availability Statement

Data are contained within the article.

Conflicts of Interest

The authors declare no conflicts of interest.

References

  1. Munns, R. Genes and salt tolerance: Bringing them together. New Phytol. 2005, 167, 645–663. [Google Scholar] [CrossRef] [PubMed]
  2. Lian, P.; Zhou, G. Germination and Seeding Growth of Atriplex verrucif era Bieb·under NaCl Stress. Acta Bot. Boreali-Occident. Sin. 2008, 28, 2461–2466. [Google Scholar]
  3. Fang, S.; Hou, X.; Liang, X. Response Mechanisms of Plants under Saline-Alkali Stress. Front. Plant Sci. 2021, 12, 667458. [Google Scholar] [CrossRef] [PubMed]
  4. Guo, R.; Shi, L.X.; Yan, C.; Zhong, X.; Gu, F.X.; Liu, Q.; Xia, X.; Li, H. Ionomic and metabolic responses to neutral salt or alkaline salt stresses in maize (Zea mays L.) seedlings. BMC Plant Biol. 2017, 17, 41. [Google Scholar] [CrossRef] [PubMed]
  5. Yuan, L. Studies on Physiological and Biochemical Characteristics Related to Salt Stress in Pistacia vera L.; Xinjiang Agricultural University: Xinjiang, China, 2004. [Google Scholar]
  6. Ye, T.; Wang, Y.; Feng, Y.Q.; Chan, Z. Physiological and metabolomic responses of bermudagrass (Cynodon dactylon) to alkali stress. Physiol. Plant. 2020, 171, 22–33. [Google Scholar] [CrossRef]
  7. Quan, R.; Lin, H.; Mendoza, I.; Zhang, Y.; Cao, W.; Yang, Y.; Shang, M.; Chen, S.; Pardo, J.M.; Guo, Y. SCABP8/CBL10, a putative calcium sensor, interacts with the protein kinase SOS2 to protect Arabidopsis shoots from salt stress. Plant Cell 2007, 19, 1415–1431. [Google Scholar] [CrossRef]
  8. Park, H.J.; Kim, W.Y.; Yun, D.J. A role for GIGANTEA. Plant Signal. Behav. 2013, 8, e24820. [Google Scholar] [CrossRef]
  9. Wang, H.; Takano, T.; Liu, S. Screening and Evaluation of Saline–Alkaline Tolerant Germplasm of Rice (Oryza sativa L.) in Soda Saline–Alkali Soil. Agronomy 2018, 8, 205. [Google Scholar] [CrossRef]
  10. Deinlein, U.; Stephan, A.B.; Horie, T.; Luo, W.; Schroeder, J.I. Plant salt-tolerance mechanisms. Trends Plant Sci. 2014, 19, 371–379. [Google Scholar] [CrossRef]
  11. Ma, L. Study on Effects and Assessments of NaCl Stress on Seed Germination and Physiological and Biochemical of Seedling of Herbages; Shandong Agricultural University: Taian, China, 2011. [Google Scholar]
  12. Wu, F.; Duan, Z.; Xu, P.; Yan, Q.; Meng, M.; Cao, M.; Jones, C.S.; Zong, X.; Zhou, P.; Wang, Y.; et al. Genome and systems biology of Melilotus albus provides insights into coumarins biosynthesis. Plant Biotechnol. J. 2022, 20, 592–609. [Google Scholar] [CrossRef]
  13. Jing, C. A comparison of Salt-Tolerance, Productivity and Nutritional Quality between Six Melilotus; Tarim University: Xinjiang, China, 2015. [Google Scholar]
  14. Zhang, J.; Di, H.; Luo, K.; Jahufer, Z.; Wu, F.; Duan, Z.; Stewart, A.; Yan, Z.; Wang, Y. Coumarin Content, Morphological Variation, and Molecular Phylogenetics of Melilotus. Molecules 2018, 23, 810. [Google Scholar] [CrossRef]
  15. McEwen, J.; Johnston, A.E. Yield and nitrogen-fixation of Melilotus alba. Field Crops Res. 1985, 12, 187–188. [Google Scholar] [CrossRef]
  16. Ge, G.; Liu, Y.; Jia, Y. Nutritional Value and Effect of Melilotus suaveolens Hay on Feeding Cashmere Goat. Acta Agrestia Sin. 2013, 21, 401–405. [Google Scholar] [CrossRef]
  17. Zhao, T.; Ma, C.; Wang, D.; Jing, Y.; Xi, L. Correlation between rhizobia distribution and the physical/chenical properties in soilof winter wheat intercropped with sweet clover. Acta Prataculturae Sin. 2018, 27, 45–55. [Google Scholar]
  18. Wu, F.; Luo, K.; Yan, Z.; Zhang, D.; Yan, Q.; Zhang, Y.; Yi, X.; Zhang, J. Analysis of miRNAs and their target genes in five Melilotus albus NILs with different coumarin content. Sci. Rep. 2018, 8, 14138. [Google Scholar] [CrossRef] [PubMed]
  19. Ma, B.; Nian, L.; Ain, N.U.; Liu, X.; Yang, Y.; Zhu, X.; Haider, F.U.; Lv, Y.; Bai, P.; Zhang, X.; et al. Genome-Wide Identification and Expression Profiling of the SRS Gene Family in Melilotus albus Reveals Functions in Various Stress Conditions. Plants 2022, 11, 3101. [Google Scholar] [CrossRef] [PubMed]
  20. Zhang, C.; Wu, F.; Yan, Q.; Duan, Z.; Wang, S.; Ao, B.; Han, Y.; Zhang, J. Genome-Wide Analysis of the Rab Gene Family in Melilotus albus Reveals Their Role in Salt Tolerance. Int. J. Mol. Sci. 2022, 24, 126. [Google Scholar] [CrossRef]
  21. Liu, L.; Meng, S. Notification of the revision of the 2012 edition of the International Seed Testing Regulations. J. Nucl. Agric. Sci. 2012, 26, 762–763. [Google Scholar]
  22. Wang, A.; Zhang, C.; Wu, C.; Gao, M. Study on a Fast Method of Testing Chlorophyll Content in Maize. J. Maize Sci. 2008, 16, 97–100. [Google Scholar] [CrossRef]
  23. Sen, S.; Chakraborty, J.; Ghosh, P.; Basu, D.; Das, S. Chickpea WRKY70 Regulates the Expression of a Homeodomain-Leucine Zipper (HD-Zip) I Transcription Factor CaHDZ12, which Confers Abiotic Stress Tolerance in Transgenic Tobacco and Chickpea. Plant Cell Physiol. 2017, 58, 1934–1952. [Google Scholar] [CrossRef]
  24. Liu, N.; Lin, Z. Use of Evans Blue for Testing Cell Viability of Intact Leaves of Plant. Plant Physiol. J. 2011, 47, 570–574. [Google Scholar]
  25. Wang, S.; Wan, C.; Wang, Y.; Chen, H.; Zhou, Z.; Fu, H.; Sosebee, R.E. The characteristics of Na+, K+ and free proline distribution in several drought-resistant plants of the Alxa Desert, China. J. Arid Environ. 2004, 56, 525–539. [Google Scholar] [CrossRef]
  26. Liu, H.; Wang, H.; Cui, C.; Wang, M.; Guo, J.; Wen, Z.; Li, A. Experiment improvement of the soluble sugar content determination by enthrone colorimetric method. Lab. Sci. 2013, 16, 19–20. [Google Scholar]
  27. Li, Z.; Wu, X. Experimental Design Scheme for the Effect of Drought Stress on Content of Malondialdehyde of Indoor Ornamental Plants. Tianjin Agric. Sci. 2016, 22, 49–51. [Google Scholar]
  28. Guo, F.X.; Zhang, M.X.; Chen, Y.; Zhang, W.H.; Xu, S.J.; Wang, J.H.; An, L.Z. Relation of several antioxidant enzymes to rapid freezing resistance in suspension cultured cells from alpine Chorispora bungeana. Cryobiology 2006, 52, 241–250. [Google Scholar] [CrossRef] [PubMed]
  29. Shi, J.; Fu, X.Z.; Peng, T.; Huang, X.S.; Fan, Q.J.; Liu, J.H. Spermine pretreatment confers dehydration tolerance of citrus in vitro plants via modulation of antioxidative capacity and stomatal response. Tree Physiol. 2010, 30, 914–922. [Google Scholar] [CrossRef] [PubMed]
  30. Gutterman, Y. Seed Germination in Desert Plants. Endeavour 2014, 19, 47. [Google Scholar]
  31. Xu, X.Y.; Fan, R.; Zheng, R.; Li, C.M.; Yu, D.Y. Proteomic analysis of seed germination under salt stress in soybeans. J. Zhejiang Univ. Sci. B 2011, 12, 507–517. [Google Scholar] [CrossRef]
  32. Wei, J.; Cai, Q.; Li, Y.; Shang, L.; Bu, X.; Yu, Z.; Ma, R. Research Progress on Response Mechanism of the Plant to Saline-Alkali Stress. Shandong Agric. Sci. 2022, 54, 156–164. [Google Scholar]
  33. Dai, M.; Wang, P.; Sun, J.; Zhou, T. Research Progress of Saline-alkali Stress Effect on Seeds’ Germination and Its Physiological and Biochemical Mechanism. North. Hortic. 2015, 10, 176–179. [Google Scholar]
  34. Shen, Z.; Pan, D.; Wang, J.; Zhang, R.; Li, D.; Gao, C.; Di, G.; Zhong, P. Effects of Saline-Alkaloid Stress on Seed Germination and Seedling Growth of Grasses. Acta Agrestia Sin. 2012, 20, 914–920. [Google Scholar]
  35. Lu, Y.; Su, C.; Li, H. Effects of different salts on seed germination and seedling growth of Trifolium repens. Acta Prataculturae Sin. 2013, 22, 123–129. [Google Scholar]
  36. Zheng, Z. Physiological Mechanisms of Hydrogen Sulfide in Regulating Seed Germination and Seedlings Growth of Processing Tomato under NaCl Stress; Shihezi University: Xinjiang, China, 2017. [Google Scholar]
  37. Liu, Y.; Qi, J.; Liu, Q.; Zhang, X. Study on salt tolerance of three Elymus nutans seeds in germination period. Grassl. Turf 2014, 34, 61–65. [Google Scholar]
  38. Liu, B.; Zhong, C. The Changes of Morphologic Characteristics and Antioxidant Enzyme Activity of Leymus chinensis under Different Levels of Salt-alkali Stress. Sci. Technol. Eng. 2016, 16, 158–161. [Google Scholar]
  39. Wang, Y.; Quan, B.; Piao, J.; Piao, M. Comparison about drought resistance of 4 forages at seedling stage unde rwater stress. Agric. Sci. J. Yanbian 2007, 2, 101–106. [Google Scholar]
  40. Zhang, J.; Miu, N.; Bai, Y.; Wan, X.; Lv, W. Changes of Chlorophyll Content and Antioxidant Enzyme Activity of Diploid Potato under Salt Stress. Crops 2014, 5, 59–63. [Google Scholar]
  41. Guo, H.; Hu, T.; Fu, J. Effects of saline sodic stress on growth and physiological responses of Lolium perenne. Acta Prataculturae Sin. 2012, 21, 118–125. [Google Scholar]
  42. Lu, A.; Zhang, F.; Xu, X.; Wang, X.; Yao, S. Effects of salt stress on growth and physiological characteristics of Echinochloa frumentacea seedlings. Acta Prataculturae Sin. 2021, 30, 84–93. [Google Scholar]
  43. Fang, Y.; Xue, L. Application of Chlorophyll Fluorescence Dynamics to Plant Physiology in Adverse Circumstance. Ecol. Sci. 2019, 38, 225–234. [Google Scholar]
  44. Rao, L.; Li, S.; Cui, X. Leaf morphology and chlorophyll fluorescence characteristics of mulberry seedlings under waterlogging stress. Sci. Rep. 2021, 11, 13379. [Google Scholar] [CrossRef]
  45. Xng, Q.; Yu, S.; Niu, Y.; Yu, K.; Song, M. Effects of salt stress on photosynthetic physiology and chlorophyll fluorescence characteristics of grape (Red Globe) seedlings. Agric. Res. Arid Areas 2011, 29, 96–100. [Google Scholar]
  46. Li, Q.; Ma, C.; Shang, Q. Effects of silicon on photosynthesis and antioxidative enzymes of maize under drought stress. Chin. J. Appl. Ecol. 2007, 18, 531–536. [Google Scholar]
  47. Su, L.; Bai, T.; Yu, H.; Wu, G.; Tan, L. Effects of Salt Stress on Seedlings Growth, Photosynthesis and Chlorophyll Fluorescence of Two Species of Artocarpus. Sci. Agric. Sin. 2019, 52, 2140–2150. [Google Scholar]
  48. Li, R.; Wang, Y.; Sun, Y.; Zhang, L.; Chen, A. Effects of salt stress on the growth, physiology, and biochemistry of five Bromus inermis varieties. Acta Prataculturae Sin. 2023, 32, 99–111. [Google Scholar] [CrossRef]
  49. An, Y.M.; Song, L.L.; Liu, Y.R.; Shu, Y.J.; Guo, C.H. De Novo Transcriptional Analysis of Alfalfa in Response to Saline-Alkaline Stress. Front. Plant Sci. 2016, 7, 931. [Google Scholar] [CrossRef] [PubMed]
  50. Khan, M.N.; Zhang, J.; Luo, T.; Liu, J.; Rizwan, M.; Fahad, S.; Xu, Z.; Hu, L. Seed priming with melatonin coping drought stress in rapeseed by regulating reactive oxygen species detoxification: Antioxidant defense system, osmotic adjustment, stomatal traits and chloroplast ultrastructure perseveration. Ind. Crops Prod. 2019, 140, 111597. [Google Scholar] [CrossRef]
  51. Guo, J.; Chen, Y.; Lu, P.; Liu, M.; Sun, P.; Zhang, Z. Roles of endophytic bacteria in Suaeda salsa grown in coastal wetlands: Plant growth characteristics and salt tolerance mechanisms. Environ. Pollut. 2021, 287, 117641. [Google Scholar] [CrossRef]
  52. Wang, F.; Liu, Y.; Wang, T.; Wang, P. Mitigation Effect and Mechanism of Exogenous Melatonin on Maize Seedling under Salt Stress. Chin. J. Grassl. 2020, 42, 14–21. [Google Scholar]
  53. Tang, X.; Mu, X.; Shao, H.; Wang, H.; Brestic, M. Global plant-responding mechanisms to salt stress: Physiological and molecular levels and implications in biotechnology. Crit. Rev. Biotechnol. 2015, 35, 425–434. [Google Scholar] [CrossRef]
  54. Luo, D.; Liu, J.; Wu, Y.; Zhang, X.; Zhou, Q.; Fang, L.; Liu, Z. NUCLEAR TRANSPORT FACTOR 2-LIKE improves drought tolerance by modulating leaf water loss in alfalfa (Medicago sativa L.). Plant J. 2022, 112, 429–450. [Google Scholar] [CrossRef]
  55. Jia, X.; Deng, Y.; Sun, X.; Liang, L. Impacts of salt stress on the growth and physiological characteristics of Paspalum vaginatum. Acta Prataculturae Sin. 2015, 24, 204–212. [Google Scholar]
  56. Liu, A.; Zhang, Y.; Fang, Y.; Li, W.; Chen, Z. Effects of salt stress on the growth, antioxidant ability and salt stress protein of Calendula of ficinalis. Acta Prataculturae Sin. 2011, 20, 52–59. [Google Scholar]
  57. Mi, Y.; Wang, G.; Gong, C.; Cai, Z.; Wu, W. Effects of salt stress on growth and physiology of Isatis indigotica seedings. Acta Prataculturae Sin. 2018, 27, 43–51. [Google Scholar]
  58. Sun, W.; Han, B.; Hu, X.; Hu, T. Malonyl Dialdehyde Changes of Alfalfa under Salt Stress. J. Anhui Agric. Sci. 2009, 37, 1905–1906+1911. [Google Scholar]
  59. Chandra, A.; Dubey, A. Effect of ploidy levels on the activities of delta(1)-pyrroline-5-carboxylate synthetase, superoxide dismutase and peroxidase in Cenchrus species grown under water stress. Plant Physiol. Biochem. 2010, 48, 27–34. [Google Scholar] [CrossRef] [PubMed]
  60. Srivastava, A.K.; Srivastava, S.; Penna, S.; D’Souza, S.F. Thiourea orchestrates regulation of redox state and antioxidant responses to reduce the NaCl-induced oxidative damage in Indian mustard (Brassica juncea (L.) Czern.). Plant Physiol. Biochem. 2011, 49, 676–686. [Google Scholar] [CrossRef] [PubMed]
  61. Wang, X.; Li, H.; Yan, L.; Mi, F.; Yu, J.; Jia, Z.; Yang, Z.; Yang, W. Salt-Tolerance of Seed Germination and Seedling Growth for Five Grass Species. Seed 2016, 35, 27–31. [Google Scholar]
  62. Yang, Y.; Guo, Y. Unraveling salt stress signaling in plants. J. Integr. Plant Biol. 2018, 60, 796–804. [Google Scholar] [CrossRef]
  63. Zhang, H.; Zhu, J.; Gong, Z.; Zhu, J.K. Abiotic stress responses in plants. Nat. Rev. Genet. 2022, 23, 104–119. [Google Scholar] [CrossRef]
  64. Jiang, J.; Ma, S.; Ye, N.; Jiang, M.; Cao, J.; Zhang, J. WRKY transcription factors in plant responses to stresses. J. Integr. Plant Biol. 2017, 59, 86–101. [Google Scholar] [CrossRef]
  65. Ishihama, N.; Yoshioka, H. Post-translational regulation of WRKY transcription factors in plant immunity. Curr. Opin. Plant Biol. 2012, 15, 431–437. [Google Scholar] [CrossRef]
  66. Wang, H.; Li, Z.; Ren, H.; Zhang, C.; Xiao, D.; Li, Y.; Hou, X.; Liu, T. Regulatory interaction of BcWRKY33A and BcHSFA4A promotes salt tolerance in non-heading Chinese cabbage [Brassica campestris (syn. Brassica rapa) ssp. chinensis]. Hortic. Res. 2022, 9, uhac113. [Google Scholar] [CrossRef]
  67. Sugimoto, M.; Oono, Y.; Gusev, O.; Matsumoto, T.; Yazawa, T.; Levinskikh, M.A.; Sychev, V.N.; Bingham, G.E.; Wheeler, R.; Hummerick, M. Genome-wide expression analysis of reactive oxygen species gene network in Mizuna plants grown in long-term spaceflight. BMC Plant Biol. 2014, 14, 4. [Google Scholar] [CrossRef] [PubMed]
  68. Rentel, M.C.; Lecourieux, D.; Ouaked, F.; Usher, S.L.; Petersen, L.; Okamoto, H.; Knight, H.; Peck, S.C.; Grierson, C.S.; Hirt, H. OXI1 kinase is necessary for oxidative burst-mediated signalling in Arabidopsis. Nature 2004, 427, 858–861. [Google Scholar] [CrossRef] [PubMed]
  69. Moon, H.; Lee, B.; Choi, G.; Shin, S.; Prasad, D.T.; Lee, O.; Kwak, S.S.; Kim, D.N.J.; Bahk, J.; Hong, J.C. NDP kinase 2 interacts with two oxidative stress-activated MAPKs to regulate cellular redox state and enhances multiple stress tolerance in transgenic plants. Proc. Natl. Acad. Sci. USA 2003, 100, 358–363. [Google Scholar] [CrossRef] [PubMed]
  70. Pitzschke, A.; Djamei, A.; Bitton, F.; Hirt, H. A major role of the MEKK1-MKK1/2-MPK4 pathway in ROS signalling. Mol. Plant 2009, 2, 120–137. [Google Scholar] [CrossRef] [PubMed]
  71. Teige, M.; Scheikl, E.; Eulgem, T.; Dóczi, R.; Hirt, H. The MKK2 pathway mediates cold and salt stress signaling in Arabidopsis. Mol. Cell 2004, 15, 141–152. [Google Scholar] [CrossRef]
  72. Bari, R.; Jones, J.D.G. Role of plant hormones in plant defence responses. Plant Mol. Biol. 2009, 69, 473–488. [Google Scholar] [CrossRef]
  73. Depuydt, S.; Hardtke, C.S. Hormone signalling crosstalk in plant growth regulation. (Special Issue: Plant signalling pathways: A comparative evolutionary overview.). Curr. Biol. CB 2011, 21, R365–R373. [Google Scholar] [CrossRef]
  74. Goossens, J.; Fernández-Calvo, P.; Schweizer, F.; Goossens, A. Jasmonates: Signal transduction components and their roles in environmental stress responses. Plant Mol. Biol. 2016, 91, 673–689. [Google Scholar] [CrossRef]
Figure 1. Effect of saline–alkali stresses on the germination of sweet clover seeds. The germination under Na2CO3 (A); NaHCO3 (B); NaCl (C) treatments. Different small letters above the columns indicate significant (p < 0.05) differences between different concentrations. The type 061898 is represented by green, 061930 is represented by orange, 55WF is represented by red, and NXWF is represented by blue. Values given are the mean ± SE (n = 3). Data were tested for significance by one-way ANOVA at p < 0.05.
Horticulturae 10 00297 g001
Figure 2. Effect of saline–alkali stresses on root length of sweet clover. The root length under Na2CO3 (A); NaHCO3 (B); NaCl (C) treatments. The type 061898 is labeled with a green square, 061930 labeled with an orange dot, 55WF labeled with a red equilateral triangle, and NXWF labeled with a blue inverted triangle. Values represent mean ± SE (n = 5). Data were tested for significance by one-way ANOVA at p < 0.05.
Horticulturae 10 00297 g002
Figure 3. Effect of saline–alkali stresses on shoot length of sweet clover. The shoot length under Na2CO3 (A); NaHCO3 (B); NaCl (C) treatments. The type 061898 is labeled with a green square, 061930 labeled with an orange dot, 55WF labeled with a red equilateral triangle, and NXWF labeled with a blue inverted triangle. Values represent mean ± SE (n = 5). Data were tested for significance by one-way ANOVA at p < 0.05.
Horticulturae 10 00297 g003
Figure 4. Effect of saline–alkali stress on chlorophyll content in sweet clover seedlings. The chlorophyll content under Na2CO3 (A); NaHCO3 (B); NaCl (C) treatments. The type 061898 is labeled with a green square, 061930 labeled with an orange dot, 55WF labeled with a red equilateral triangle, and NXWF labeled with a blue inverted triangle. Values represent mean ± SE (n = 3). Data were tested for significance by one-way ANOVA at p < 0.05.
Horticulturae 10 00297 g004
Figure 5. Effect of saline–alkali stresses on Fv/Fm of sweet clover. The Fv/Fm under Na2CO3 (A); NaHCO3 (B); NaCl (C) treatments. The type 061898 is labeled with a green square, 061930 labeled with an orange dot, 55WF labeled with a red equilateral triangle, and NXWF labeled with a blue inverted triangle.
Horticulturae 10 00297 g005
Figure 6. Fluorescence imaging of Fv/Fm of in sweet clover under saline–alkali stress. The severity of damage is represented by the progression from weak to strong fluorescence, indicated by green, yellow, and red, respectively. Fluorescence observation through Multi-functional Photosynthetic Phenotypic Measurement System for Plants.
Horticulturae 10 00297 g006
Figure 7. Analysis of H2O2 accumulation caused by saline–alkali stress in sweet clover leaves. Detection of H2O2 accumulation by di-aminobenzine (DAB) staining. For the histochemical assays, stained leaves were soaked in 90% ethanol to remove the chlorophyll and then photographed.
Horticulturae 10 00297 g007
Figure 8. Analysis of O2 accumulation caused by saline–alkali stress in sweet clover leaves. Detection of O2 accumulation by nitroblue tetrazolium (NBT) staining. For the histochemical assays, stained leaves were soaked in 90% ethanol to remove the chlorophyll and then photographed.
Horticulturae 10 00297 g008
Figure 9. Analysis of cell death caused by saline–alkali stress in sweet clover leaves. Detection of cell death by Evan’s blue staining. For the histochemical assays, stained leaves were soaked in 90% ethanol to remove the chlorophyll and then photographed.
Horticulturae 10 00297 g009
Figure 10. Effect of saline–alkali stress on soluble sugar content in sweet clover seedlings. The soluble sugar content under Na2CO3 (A); NaHCO3 (B); NaCl (C) treatments. The type 061898 is labeled with a green square, 061930 labeled with an orange dot, 55WF labeled with a red equilateral triangle, and NXWF labeled with a blue inverted triangle. Values represent mean ± SE (n = 3). Data were tested for significance by one-way ANOVA at p < 0.05.
Horticulturae 10 00297 g010
Figure 11. Effect of saline–alkali stress on proline content in sweet clover seedlings. The proline content under Na2CO3 (A); NaHCO3 (B); NaCl (C) treatments. The type 061898 is labeled with a green square, 061930 labeled with an orange dot, 55WF labeled with a red equilateral triangle, and NXWF labeled with a blue inverted triangle. Values represent mean ± SE (n = 3). Data were tested for significance by one-way ANOVA at p < 0.05.
Horticulturae 10 00297 g011
Figure 12. Effect of saline–alkali stress on MDA content in sweet clover seedlings. The MDA content under Na2CO3 (A); NaHCO3 (B); NaCl (C) treatments. The type 061898 is labeled with a green square, 061930 labeled with an orange dot, 55WF labeled with a red equilateral triangle, and NXWF labeled with a blue inverted triangle. Values represent mean ± SE (n = 3). Data were tested for significance by one-way ANOVA at p < 0.05.
Horticulturae 10 00297 g012
Figure 13. Effect of saline–alkali stress on SOD activity in sweet clover seeding. The SOD activity under Na2CO3 (A); NaHCO3 (B); NaCl (C) treatments. The type 061898 is labeled with a green square, 061930 labeled with an orange dot, 55WF labeled with a red equilateral triangle, and NXWF labeled with a blue inverted triangle. Values represent mean ± SE (n = 3). Data were tested for significance by one-way ANOVA at p < 0.05.
Horticulturae 10 00297 g013
Figure 14. Effect of saline–alkali stress on POD activity in sweet clover seeding. The POD activity under Na2CO3 (A); NaHCO3 (B); NaCl (C) treatments. The type 061898 is labeled with a green square, 061930 labeled with an orange dot, 55WF labeled with a red equilateral triangle, and NXWF labeled with a blue inverted triangle. Values represent mean ± SE (n = 3). Data were tested for significance by one-way ANOVA at p < 0.05.
Horticulturae 10 00297 g014
Figure 15. Effects of saline–alkali stress on CAT activity in sweet clover seeding. The CAT activity under Na2CO3 (A); NaHCO3 (B); NaCl (C) treatments. The type 061898 is labeled with a green square, 061930 labeled with an orange dot, 55WF labeled with a red equilateral triangle, and NXWF labeled with a blue inverted triangle. Values represent mean ± SE (n = 3). Data were tested for significance by one-way ANOVA at p < 0.05.
Horticulturae 10 00297 g015
Figure 16. Gene expression level of 061898 and NXWF after saline–alkali stress. Different small letters above the columns indicate significant (p < 0.05) differences between different concentrations. The control is represented by red, NaCl is represented by yellow, NaHCO3 is represented by blue, and Na2CO3 is represented by orange. Values given are the mean ± SE (n = 3).
Horticulturae 10 00297 g016
Disclaimer/Publisher’s Note: The statements, opinions and data contained in all publications are solely those of the individual author(s) and contributor(s) and not of MDPI and/or the editor(s). MDPI and/or the editor(s) disclaim responsibility for any injury to people or property resulting from any ideas, methods, instructions or products referred to in the content.

