Abstract
Water shortages and soil salinization are the bottlenecks of sustainable agricultural development in many arid and semi-arid regions of the world. Brackish water as a supplementary water source for agricultural irrigation is an important way to solve the shortage of agricultural water resources in arid regions. To study the effect of the mineralization degree of irrigation water (MIW) on the yield and quality of greenhouse fruit cucumber in arid, semi-arid, and cold regions, the effects of MIW on the photosynthesis, yield, and quality of greenhouse fruit cucumber, as well as the soil microorganisms and enzyme activity, were evaluated based on observed data from spring–summer (S−S) and autumn–winter (A−W). In this study, fruit cucumbers from Ningxia sunlight greenhouses were studied in a comparative experimental design with four MIW levels (CK, 2.8–3.0 g L−1; S1, 1.9–2.3 g L−1; S2, 1.2–1.4 g L−1; S3, 0.3–0.5 g L−1) where CK was used as the control treatment. The main indicators of fruit cucumber yield and fruit quality increased with MIW from 0.3 g L−1 to 3.0 g L−1. Compared with CK, the leaf area index (LAI) and net photosynthetic rate (A) of S3 of S−S (A−W) increased by 17.92% (26.32%) and 112.89% (17.68%), respectively. Vitamin C, soluble protein, and nitrate contents increased by 118.75% (24.92%), 41.67% (28.89%), and 43.09% (41.90%), respectively. The soil respiration rate (SRR) increased by 46.51% (90.48%). The yield and water use efficiency (WUE) increased by 35.98% (27.94%) and 12.95% (10.64%), respectively. A model of MIW and soil EC was developed and the applicability of the model was verified, with relative errors ranging from 2.7% to 7.8% (less than 10%). Within the experimental range, irrigation with lower MIW, which facilitated the increase in soil microbial load and soil respiration rate, promoted fruit cucumber growth, A, yield, and DMA, but was not conducive to fruit sugar accumulation; higher MIW was more conducive to improving fruit quality. The comprehensive assessment determined that the better MIW was 0.3–0.5 g L−1 (S3). The results of the study provide a feasible way to improve the quality and efficiency of greenhouse crops irrigated with brackish water in arid and semi-arid cold regions.
1. Introduction
Water scarcity and soil salinization are bottlenecks to sustainable agricultural development in many arid and semi-arid regions of the world, and by 2050, half of China’s arable land will be affected by soil salinization [1]. In the arid regions of northwest China, agriculture is facing the risk of freshwater deficiency due to high evaporation and low precipitation [2], and salinization under drip irrigation in arid regions is also a common problem [3]. While brackish water as a supplementary water source for agricultural irrigation is an important initiative to solve the problem of agricultural water shortage in arid regions [4,5,6,7], brackish water irrigation also represents the future of agriculture in arid regions of northwest China [8]. At present, brackish water irrigation has been used in agriculture by many countries and regions [9,10,11,12,13,14,15]. It is generally believed that brackish water is salt water with a salinity of 2–5 g L−1 [7]. Brackish water has been used for irrigation in China for more than 50 years. It has been found that long-term brackish water irrigation inevitably brings salt ions (such as Na+) to the soil, causing soil salt accumulation [16], destroying soil aggregate structure, causing secondary soil salinization [17], and reducing soil permeability [18,19]. It leads to changes in the characteristics of soil water and salt transport [20,21,22,23]. Under the condition of salt stress, soil bacteria and enzyme activities are inhibited [24,25], and soil respiration decreases with the increase in brackish water salt concentration [26]. More importantly, salt ions, to some extent, restrict the uptake of soil nutrients and water by crop roots [27,28], and growth indicators such as leaf area index and plant height can be inhibited to varying degrees; water loss in the root system inevitably leads to water deficiency in plant leaves, which indirectly inhibits leaf photosynthesis [29], decreases chlorophyll content and the ability of chloroplasts to absorb light energy [30], and decreases the accumulation of photosynthetic assimilation products [31], affecting crop growth and reducing yields [3,10,32,33].
However, many studies have found that crop growth is not affected by appropriate brackish water irrigation [33]. According to an analysis of the available literature, studies on the use of brackish water for irrigation have focused on crops such as wheat, cotton, maize, and rice, and have typically focused on variables such as crop growth, yield, water use efficiency, and physical and chemical properties of the soil [21,34,35,36,37]. But yields are increased [38,39,40] and fruit quality is improved [41,42,43], and studies have shown that brackish water irrigation improves tomato quality; the contents of soluble solids, reducing sugars, organic acids, and vitamin C were increased [2,44]. Irrigation water use efficiency (IWUE) increased with the increase in irrigation water salinity (1.1–4.9 dS m−1) [45]. Brackish water significantly reduced the average fruit weight and fruit number of cucumber, and thus significantly reduced cucumber yield, but salinity improved fruit quality by increasing the dry matter, soluble sugar, and titratable acid content [29]. Brackish water irrigation reduces cucumber yield but saves freshwater resources [46], and studies have shown that brackish water irrigation saves freshwater resources by 60–75%, although it reduces winter wheat and summer maize yields by 10–15% [47]. These research findings provide a sound theoretical basis for the sustainable development of brackish water irrigated crops. Therefore, the key to the successful use of brackish water irrigation is to mitigate the damage to plants from soil salt accumulation.
Fruit cucumber is a kind of cucumber (Cucumis sativus L.) which is generally welcomed by consumers because of its good taste and strong flavor. Ningxia, located in northwest China, is an area in China which uses brackish water for farmland irrigation. Although there is a shortage of freshwater resources in this area, brackish water and saltwater resources are relatively abundant. Brackish water irrigation is one of the important ways to alleviate the crisis of agricultural freshwater resources in Ningxia. The research on the yield and fruit quality of fruit cucumber under salt stress is still not thorough enough. Determining the effect law and mechanism of brackish water irrigation on the growth, yield, and quality of fruit cucumber is an important basis for the rational utilization of brackish water. In this study, fruit cucumber under mulch drip irrigation in the greenhouse was taken as the research object, and local brackish water was mixed with fresh water and used for experimental irrigation. We aimed to elucidate the effect of the mineralization degree of irrigation water (MIW) on the growth, photosynthesis, yield, quality, water use efficiency, soil microorganisms, and enzyme activity of fruit cucumber in order to scientifically determine efficient regulation strategies for saltwater-irrigated fruit cucumber.
2. Materials and Methods
2.1. Experimental Site
Both tests (spring–summer, S–S; autumn–winter; A–W) were conducted in a greenhouse (38°30′ N, 106°07′ E) in the experimental area of Xinrong Village, Heilan County, Yinchuan, Ningxia, China, located at an altitude of 1111.5 m, with greenhouse dimensions (75 m long and 7 m wide). The site had a temperate continental climate with an average temperature of 10.7 °C, a maximum temperature of 31.5 °C, a minimum temperature of −11.1 °C, annual precipitation of 227.4 mm, annual evaporation of 1288.0 mm, and a relative humidity of 60–70%. Temperature and humidity conditions in the greenhouse during the tomato growing season were as follows: minimum temperature 10.45 °C, maximum temperature 36.6 °C, minimum humidity 22.6%, and maximum humidity 77.1%. The meteorological data (Figure 1) were obtained from small weather stations installed inside and outside the greenhouse.
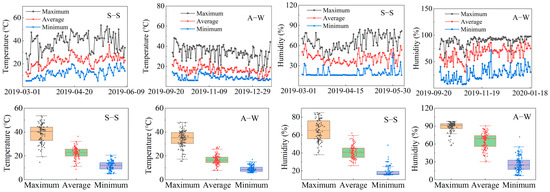
Figure 1.
Changes in temperature and humidity inside the greenhouse in spring–summer (S–S) and autumn–winter (A–W).
The groundwater in the test area was brackish water (mineralization degree of about 2.8–3.0 g L−1). A reverse osmosis water treatment system (RO) independently developed by the research team, which had been used for many years, was installed in the greenhouse, and the water treatment system desalinated the brackish groundwater (desalination rate of more than 90%). The chemical properties of fresh water (FW), brackish water (BW), and strong salt water (SW) in the test area are shown in Table 1.

Table 1.
Chemical properties of FW, BW, and SW in the test area.
2.2. Experimental Design
Since the chemical composition of brackish water varies from region to region, the mineralization degree is usually used to reflect the salinity ion content of brackish water comprehensively to facilitate research and the generalized application of research results [48]. A randomized block design was used for this study (Table 2), with four MIW levels, and each treatment was replicated 3 times.
Table 2.
Experimental design of irrigation water mineralization degree (MIW).
2.3. Experimental Implementation
The experiments involving greenhouse fruit cucumber irrigated with brackish water in spring–summer (S–S) and autumn–winter (A–W) were carried out. The S–S (5 March 2019–5 June 2019) and A–W (28 September 2019–18 January 2020) trial periods lasted 93 and 115 days (from transplantation to the end of the trial). The tested fruit cucumber (Cucumis sativus L.) which has self-rooted (non-grafted) seedlings with three leaves when transplanted. The area of the test plot was 7.7 m2 (length 5.5 m, width 1.4 m), and two rows were arranged in each plot. The plant spacing was 0.45 m, the row spacing was 0.30 m, and the planting density was 31,185 plants hm−2. All treatments were carried out by drip irrigation under mulch, and two parallel in-panel drip irrigation belts were arranged along the planting row in each test area with a a distance of 0.40 m, a pipe diameter of 16 mm, distance between the drippers of 0.15 m, and a dripper flow rate of 2 L h−1.
CK was drip-irrigated with brackish water, S1 was drip-irrigated with a 1:1 mixture of brackish water and fresh water, S2 was drip-irrigated with a 1:2 mixture of brackish water and fresh water, and S3 was drip-irrigated with fresh water. All the treatments were irrigated 27 times (including 9 times during the slowing period) throughout the experimental period, with an irrigation quota of 3375 m3 hm−2. The amount of fertilizer was determined according to the nutrient balance method, and the difference between the target yield fertilizer requirement and the soil fertilizer available was calculated to determine the fertilization amount (N:105 kg hm−2; P2O5:30 kg hm−2; K2O:75 kg hm−2). The fertilization amount was implemented five times throughout the test period. The nitrogen, phosphorus, and potassium fertilizers were urea (N 46%), diammonium phosphate (N 16%, P2O5 44%), and potassium sulfate (K2O 22%), respectively. For the fertilizers, 205 kg hm−2 urea, 69 kg hm−2 diammonium phosphate, and 34 kg hm−2 potassium sulfate were calculated, and the accurately weighed fertilizer was placed into the fertilizer bucket before each fertilization. After fully stirring and dissolving it, it was transported to the root zone by the integrated intelligent drip irrigation system of water and fertilizer.
2.4. Measurement Items and Methods
At the end of the seedling stage, three plants with good growth were randomly selected and marked for each plot to observe the later plant growth. Plant height was measured using a steel tape measure (stem base to top of natural growth point); root collar diameter using a digital vernier caliper (base stem diameter); and leaf area index using a canopy analyzer (LAI-2200C, LI-COR, Lincoln, NE, USA). Plant height, stem thickness, and leaf area index (LAI) were measured once every 10 days. At each growth stage, the leaf net photosynthetic rate (A), stomatal conductance (gsw), intercellular CO2 concentration (Ci), transpiration rate (E), and leaf temperature (Tleaf) were measured using a portable photosynthesizer (LI-6800, LI-COR, Lincoln, NE, USA). The times of observation of the plant photosynthetic characteristics were from 9:00 am to 10:00 am on 30 May 2019 (S–S) and 15 November 2019 (A–W), respectively. The chlorophyll content of the labeled leaves was measured using a chlorophyll meter (SPAD-502, Minolta, Osaka, Japan) at 10-day intervals.
At the fruit ripening stage, samples were taken according to Chinese national and industry standards, and the fruit vitamin C, soluble protein, nitrate, total soluble sugar, total acid, and soluble solids contents were measured. The yield of each plot was recorded for each picking, and the final yield was the sum of each picking. At the end of the growth period (after all fruits were picked), the aboveground and underground parts of the plants in each plot were all cut down. The roots, stems, and leaves were placed into an oven at 105 °C for 15 min, then dried at 75 °C to a constant weight.
Fresh soil was taken and air-dried before the experiment to determine the initial soil nutrients, and the specific method was based on the Methods of Agricultural Chemical Analysis of soil to detect soil pH, total salinity, organic matter, fast-acting phosphorus, fast-acting potassium, and alkaline decomposition nitrogen [49]. Soil microorganisms (soil bacteria, fungi, soil respiration rate) were measured via the dilution plate method. Microbial carbon and nitrogen (microbial carbon, microbial nitrogen) were measured through chloroform fumigation. Soil urease activity was measured using indophenol blue colorimetry, alkaline phosphatase activity was measured via phthalate disodium colorimetry, and catalase activity was determined using potassium permanganate titration. Soil respiration rate (SRR) was measured using an ACE automatic soil respirometer (ADC, Hoddesdon, Herts, UK), and the measurements were carried out at 9:00–11:00 am in clear weather, once for each reproductive stage. The EM50 data collector + TEROS12 sensor (METER, San Francisco, CA, USA) was used to monitor soil water content, soil temperature, and conductivity (EC) changes in each plot during the experimental period, with a sensor probe depth of 20 cm. A regression analysis between EC and MIW data was adjusted.
Crop water consumption during the test period was calculated using the water balance method [50], and the depth of groundwater burial in the study area was 3 m, so groundwater recharge to fruit cucumber was negligible; the drip head irrigation intensity was less than the soil infiltration rate, so there was no surface runoff or deep seepage. This experiment was conducted in a solarium, so there was no rainfall. The change in water storage in the wetted layer (H) of the soil at any one time (t) can be expressed as:
In the equation, W0 and WT are the planned moisture storage in the soil layer at the beginning of the period and any period t, M is the irrigation water quantity during period t, mm; ETc is the water consumption (actual crop water consumption) in period t, mm; ET0 is the reference evapotranspiration, mm; and Kc is the crop coefficient. The irrigation water use efficiency (IWUE), water use efficiency (WUE), and leaf instantaneous water use efficiency (WUEleaf) were calculated according to the following formulas: IWUE = Y/I, where Y is the yield (kg) and I is the irrigation quota (m3); WUE = Y/ETc, where ETc is the crop water consumption (m3); and WUEleaf = A/E, where A is the net photosynthetic rate (μmol m−2 s−1) and E is transpiration rate (mmol m−2 s−1).
Because evaporation and heat transfer still exist when the wind speed is zero in a solar greenhouse, to avoid the problem of the calculation results contradicting the reality when the wind speed is zero, the ET0 was calculated according to the Penman–Monteith formula, modified for the greenhouse environment by Wang [51] and Shi [52]. The tomato experiment irrigated with different mineralized water was shown in Figure 2.
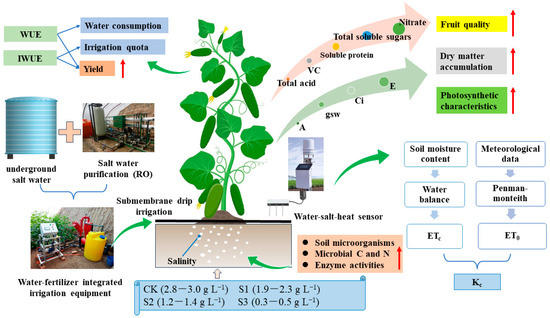
Figure 2.
Experiments on the effect of irrigation water mineralization on yield and quality of fruit cucumbers under drip irrigation. Fresh water (FW), brackish water (BW), strong salt water (SW).
2.5. Data Analyses
Data Processing System 18.10 (Hangzhou Ruifeng Information Technology Co., Ltd., Hangzhou, China) was used for the analysis of variance (ANOVA), Duncan multiple comparisons, and the contribution rate and cumulative contribution rate of the principal components (PCA). Different lowercase letters in the graph indicate significant difference levels (p < 0.05). Origin 2022 software (Origin Lab Corporation, Northampton, MA, USA) was used for drawing.
3. Results and Analysis
3.1. Growth of Fruit Cucumber
The data on the leaf area index (LAI), plant height, and root collar diameter (RCD) were derived from fruit cucumber in the mature stage. LAI was particularly sensitive to water and salt stress [53]; changes in leaf area helped us to evaluate the ability of the crops to resist salt [54]. The LAI, plant height, and RCD of the two-season experiment increased with decreasing MIW (CK < S1 < S2 < S3) (Figure 3). Compared with CK, 95 days after seedling transplantation, the LAI, plant height, and RCD of S3 in S–S (A–W) increased by 17.92% (26.32%), 16.50% (15.00%), and 23.97% (3.29%), respectively. It was not difficult to find that the differences among treatments were not significant (p > 0.05) at 33 days after transplanting in S–S, and with the implementation of saline irrigation practices in each treatment, the differences among treatments became significant (p < 0.05) at 43 days after transplanting. In particular, the effects of different MIW values on plant height, RCD, and LAI were highly significant (p < 0.01) at 63 days after seedling transplantation. In contrast, in fall and winter, the growth rates of LAI and RCD were slow at 53 days after transplantation and not much different from that at 100 d after transplanting. The growth of plant height was rapid at 53 d and 65 d after transplanting. A comparison of the results of the two-season trial revealed that growth indicators increased slowly in the fall and winter, and were generally lower than in the spring and summer. The results showed that the lower the salinity, the better the growth index and the better the growth potential of the fruit cucumber. The increase in soil salt ions made it difficult for the root system to absorb water and inhibited the plant growth to some extent.
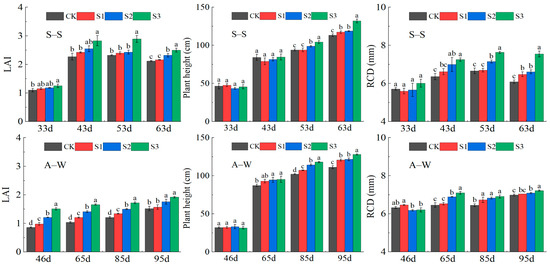
Figure 3.
Effect of MIW on the growth of greenhouse fruit cucumber. CK: 2.8–3.0 g L−1, S1: 1.9–2.3 g L−1, S2: 1.2–1.4 g L−1, S3: 0.3–0.5 g L−1. Different lowercase letters in the graph represent significant differences (p < 0.05) between treatments. The horizontal coordinate represents the time after seedling transplantation.
3.2. Photosynthesis of Fruit Cucumber
A, E, gsw, and Ci increased with decreasing MIW in both seasons of the experiment (CK < S1 < S2 < S3) (Figure 4). Compared to the control CK, 95 days after seedling transplantation, the A, E, Ci, and gsw of S3 increased by 112.89% (17.68%), 73.57% (23.10%), 22.26% (9.06%), and 142.65% (42.26%) in S–S (A–W), respectively. The effects of mineralization on A, E, and gsw were highly significant (p < 0.01), it is not difficult to find that S3 and CK differed significantly between S3 and CK in the photosynthetic characteristics of the two seasons (p < 0.05). The results show that the increase in soil salinity in the experimental range limits the photosynthetic capacity of plants and is not conducive to the accumulation of photosynthetic chlorophyll; on the contrary, a lower MIW can promote the photosynthesis of plants and the DMA of fruit cucumbers, because lower soil salinity is conducive to root absorption of soil moisture and nutrients, thereby providing sufficient substrate for plant photosynthesis.
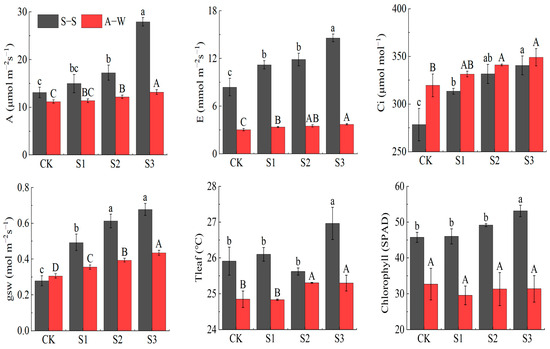
Figure 4.
Effect of MIW on the photosynthetic characteristic of greenhouse fruit cucumber. Different lowercase letters in the graph represent significant differences (p < 0.05) between treatments in spring–summer (S–S), and different uppercase letters represent significant differences (p < 0.05) between treatments in autumn–winter (A–W).
3.3. Fruit Quality of Fruit Cucumber
Fruit vitamin C, nitrate, total acid, and soluble protein contents increased with decreasing MIW (CK < S1 < S2 < S3) (Figure 5), while the soluble sugar and soluble solids contents decreased with decreasing MIW (CK > S1 > S2 > S3) in both seasons of the trial. Compared to the control CK, vitamin C, soluble protein, total acid, and nitrate content increased by 118.75% (24.92%), 41.67% (28.89%), 80.30% (25.58%), and 43.09% (41.90%), respectively, while soluble sugars and soluble solids decreased by 35.78% (52.83%) and 26.67% (33.33%), respectively. S1, S2, and S3 of the two-season trial differed significantly (p < 0.05) from CK, and the effect of MIW on fruit soluble protein, soluble sugar, soluble solids, and nitrate content was highly significant (p < 0.01). The results of the two-season experiment showed that an appropriate decrease in MIW was beneficial, increasing vitamin C, soluble protein, total acid, and nitrate content, while an appropriate increase in MIW was beneficial to the soluble sugar and soluble solids contents in the fruit. This was because a higher MIW resulted in higher soil salinity, which was not conducive to root water uptake, but was beneficial to fruit sugar accumulation.
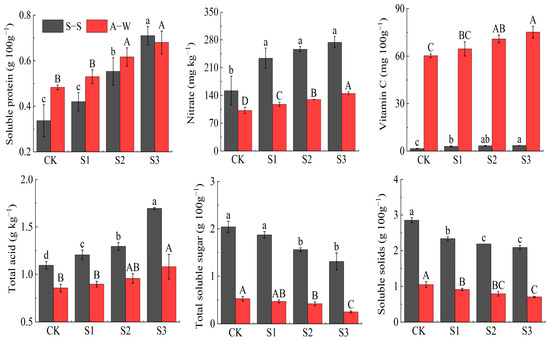
Figure 5.
Effect of MIW on the fruit quality of greenhouse fruit cucumber. Different lowercase letters in the graph represent significant differences (p < 0.05) between treatments in spring–summer (S–S), and different uppercase letters represent significant differences (p < 0.05) between treatments in autumn–winter (A–W).
3.4. Plant Biomass of Fruit Cucumber
The fresh weight of the aboveground part (WFA), fresh weight of the belowground part (WFB), dry weight of the aboveground part (WDA), dry weight of belowground part (WDB), dry matter accumulation (DMA), dry/fresh ratio (DFR) and root/shoot ratio (RSR) of the plants in both seasons of the experiment increased with decreasing MIW (CK < S1 < S2 < S3) (Figure 6), while, compared to the control CK, the DMA, WDA, WDB, WFA, and WFB of S3 in S–S (A–W) increased by accumulation by 57.76% (83.44%), 55.81% (85.00%), 58.59% (40.54%), 39.31% (51.89%), and 113.43% (80.58%), respectively. Overall, the tissue water content (TMC, as a percentage of fresh weight) of cucumber plants decreased with decreasing irrigation water mineralization; it was reduced by 2.51%, 2.30%, and 1.12% in the S3, S2, and S1 treatments, respectively, as compared to the CK. According to the results of the two-season experiment, S3 and S1 have significant differences (p < 0.05). The MIW has a significant impact on the WFB, WDA, WDB, and DMA of the fruit cucumber plant (p < 0.01). The results of the two-season study showed that the plant biomass (fresh weight, dry weight, DMA) increased with the decrease in the MIW. Lower salinity within the experimental range can promote plant growth and help the root system absorb water and fertilizer for photosynthesis, and the enhancement of photosynthesis further promotes the DMA of fruit cucumber.
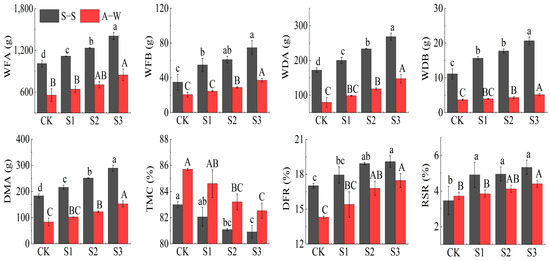
Figure 6.
Effect of MIW on the plant biomass of greenhouse fruit cucumber. Different lowercase letters in the graph represent significant differences (p < 0.05) between treatments in spring−summer (S–S), and different uppercase letters represent significant differences (p < 0.05) between treatments in autumn−winter (A–W).
3.5. Yield and WUE of Fruit Cucumber
The yield, IWUE, WUE, and WUEleaf increased with decreasing MIW (CK < S1 < S2 < S3) in both seasons of the experiment (Figure 7). Compared to the control CK, in S–S (A–W), the yield, IWUE, WUE and WUEleaf of S3 increased by 35.98% (27.94%), 35.97% (27.95%), 12.95% (10.64%), and 22.09% (−6.08%), respectively. The ET0 values were 590.36 mm and 332.47 mm for the two seasons during the test period, respectively. In the two-season experiment, S3 differed significantly (p < 0.05) from CK. The effect of MIW on the yield and IWUE of fruit cucumber was highly significant (p < 0.01). The results showed that yield, IWUE, and WUE all increased with decreasing MIW, and within the test range, decreasing MIW was beneficial in terms of raising the IWUE, WUE, and yield. This was mainly because lower mineralized water irrigation resulted in lower soil salinity, which was more favorable for the root absorption of water and nutrients, obtaining more yield with less water, promoting plant photosynthesis and DMA, and finally achieving improved quality and efficiency, as well as, to a certain extent, improving WUE.
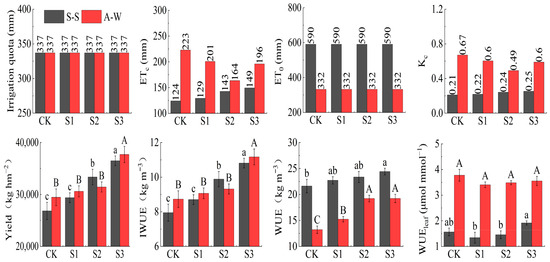
Figure 7.
Effect of MIW on the yield, IWUE, and WUE of greenhouse fruit cucumber. Different lowercase letters in the graph represent significant differences (p < 0.05) between treatments in spring–summer (S–S), and different uppercase letters represent significant differences (p < 0.05) between treatments in autumn–winter (A–W).
3.6. Soil Microorganism and Enzyme Activity
The soil microorganisms (soil bacteria, fungi, SRR), microbial carbon and nitrogen (MC, MN), and enzyme activities (urease, AP, catalase) increased with decreasing MIW (CK < S1 < S2 < S3). Actinomycetes decreased with decreasing MIW (CK > S1 > S2 > S3) in both seasons of the experiment (Figure 8). Compared to the control CK, the soil bacteria, fungi, and soil respiration rate (SRR) of S3 increased in S–S (A–W) by 3.53% (46.15%), 33.33% (23.53%), and 46.51% (90.48%), respectively. The microbial carbon (MC) and microbial nitrogen (MN) increased by 39.58% (21.95%) and 76.47% (69.23%), respectively. Urease, alkaline phosphatase (AP), and catalase increased by 51.52% (16.67%), 50.00% (35.09%), and 23.53% (36.67%), respectively, and actinomycetes decreased by 30.00% (33.33%). Apparently, S1, S2, and S3 differed from CK to different degrees in the two seasons of the experiment, with S3 differing significantly from CK (p < 0.05), and MIW had highly significant effects on soil bacteria, fungi, actinomycetes, SRR, and AP (p < 0.01).
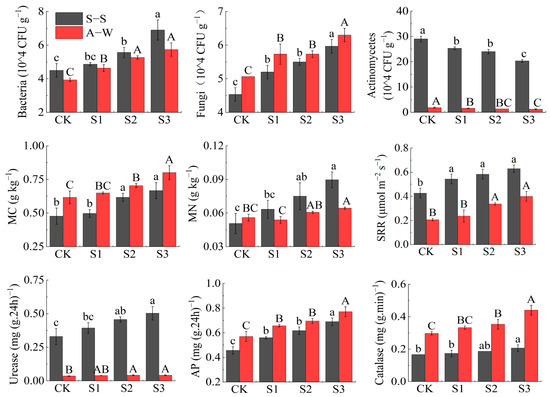
Figure 8.
Effect of MIW on the soil microorganism and enzyme activity. Different lowercase letters in the graph represent significant differences (p < 0.05) between treatments in spring–summer (S–S), and different uppercase letters represent significant differences (p < 0.05) between treatments in autumn–winter (A–W).
The results of the two seasons showed that the lower MIW was beneficial as it improved the soil microbial load, MC and MN, and enzyme activity within the test range, mainly because the lower mineralized irrigation water was more favorable in terms of optimizing the water, fertilizer, air, and heat environment in the root zone of the crop. It promoted the growth of soil microorganisms and the SRR, improved soil enzyme activity, and promoted the uptake of soil nutrients such as nitrogen, phosphorus, and potassium by the root system, thus indirectly providing a good root zone environment for the root system.
3.7. Soil EC
In general, there is a significant linear correlation between soil salinity concentration and soil electrical conductivity (EC) [55,56]. EC increased with increasing MIW (CK < S1 < S2 < S3) in both seasons of the experiment (Figure 9), and compared with the control CK, the soil conductivity of S3, S2, and S1 increased by 37.44% (45.58%), 25.70% (26.28%) and 14.07% (9.80%) in S–S (A–W), respectively. S1, S2, and S3 differed significantly (p < 0.05) from CK in both seasons of the experiment, and the effect of MIW on soil conductivity was highly significant (p < 0.01). The results showed that soil EC increased with increasing MIW in all cases, indicating that increasing MIW increased soil EC within the test range, which was due to the inevitable introduction of salt ions (such as Na+) when using a higher MIW for drip irrigation of the fruit cucumbers. This, in turn, increased the ion concentration in the soil solution, resulting in enhanced soil EC. Meanwhile, based on the complete monitoring data of soil conductivity during the S–S test periods, a relationship model between MIW and soil EC for fruit cucumber was constructed: EC = 0.019 × MIW + 0.071 (R2 = 0.995). It was verified using soil EC during the A–W test periods, with relative errors ranging from 2.7% to 7.8%.
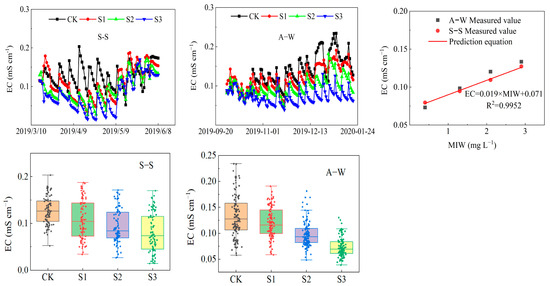
Figure 9.
Effect of MIW on the EC and the relationship between EC and mineralization.
3.8. Comprehensive Evaluation of MIW on Fruit Cucumber
Since the response of each index of fruit cucumber to brackish water irrigation varies in degree, we are especially concerned about the yield and quality differences. Therefore, indicators such as yield and quality were evaluated comprehensively, and growth indicators (plant height and LAI), photosynthesis indicators (A, E, Ci, gsw, chlorophyll), fruit quality indicators (vitamin C, soluble protein, nitrate, total soluble sugar, total acid), biomass (DMA), yield, soil microenvironmental indicators (MC, MN, bacteria, fungi, actinomycetes, urease, AP, catalase, SRR), and WUE were analyzed via principal component analysis.
The cumulative contribution rates (Table 3) of the first principal component were 90.84% and 94.10% (both greater than 85%) in the two seasons, indicating that the first principal component already contains most of the variation information of the original data, and choosing the first principal component as the main principal component can serve the purpose of reducing the number of variables. The selection of the first principal component as the main component can reduce the number of variables and retain most of the original information.
Table 3.
Eigenvalue and variance contribution rates based on the principal component analysis.
As can be seen from Table 4, the combined score of the two seasons’ experimental results increased with the decrease in MIW (CK < S1 < S2 < S3), and a comprehensive analysis of the effect of MIW on the growth, photosynthesis, quality, DMA, yield, and WUE of fruit cucumbers determined that the optimal treatment was S3 (freshwater irrigation).
Table 4.
Principal component analysis score.
4. Discussion
In this study, greenhouse fruit cucumber plants were irrigated with brackish water and purified water (freshwater). Compared with the control CK, the soil EC of S3 decreased by 36.57% and 45.58%, respectively (Figure 9), and plant height and LAI increased by 16.50% (15.00%) and 17.92% (26.32%) (Figure 3), respectively. The fresh and dry weight increased to varying degrees (Figure 6). This was mainly because, under the suitable conditions of soil moisture, fertility, air permeability, and temperature, increasing the salinity of irrigation water led to an increase in the soil electrical conductivity, and the increase in soil solution electrical conductivity reduced the soil solution’s osmotic potential. As a result, the total water potential of the soil decreased and the root system had difficulty absorbing water, which affected the growth of root system and led to physiological and morphological changes in the aboveground part [47]. Treatment with NaCl for 7 days decreased the dry biomass of both the leaf rosettes and the roots of chamomile plants [57]. However, the difference in fresh weight, dry weight, and DMA between the two seasons was obvious, which may be because the average temperature, light hours, and heat in S–S are greater than those in A–W.
Lower MIW provides a suitable growth environment for soil microorganisms and roots. Reducing the MIW increased the soil microbial content and SRR in this study, as well as MC and MN and soil enzyme activity (Figure 8). Compared to CK, the SRR increased by 46.51% and 90.48% in S3, and MC and MN increased by 39.58% (21.95%) and 76.47% (69.23%), respectively. Urease, AP, and catalase increased by 51.52% (16.67%), 50.00% (35.09%), and 23.53% (36.67%), respectively. This is because excess salinity leads to a reduction in soil pore space, a decrease in soil crust and permeability, and even a change in soil structure and a tendency to deteriorate soil physicochemical properties [58]. And within the experiment, reducing the MIW improved the water, fertilizer, and air environment for the soil, providing enrichment of soil microorganisms and increased root and microbial respiration rates. In addition, the large differences in actinomycetes and urease between the results of the two seasons may have been due to the higher temperatures in S–S, which provided a suitable temperature environment for soil urease and microorganisms, improved the soil enzyme activity, and increased the microbial load, while the low temperatures in A–W inhibited soil enzyme activity to some extent.
The improvements in the soil water, fertilizer, and air environment are conducive to creating a suitable root zone environment, which provides strong conditions for crop roots to absorb soil water and nutrients and, in turn, provides a constant supply of raw materials for photosynthesis in the aboveground part of the crop, enhancing the chlorophyll content and photosynthetic capacity of the plant (Figure 4). In this study, the A of S3 increased by 112.89% (17.68%) in S–S (A–W). Conversely, soil salinity reduces the effectiveness of soil water, causing physiological drought in crops, and to prevent water loss in leaves and maintain a higher osmotic water potential in leaves, plants inhibit transpiration by reducing stomatal opening. This, at the same time, prevents the entry of CO2 into the leaf flesh cells to participate in photosynthesis, directly leading to a decrease in photosynthetic efficiency [59]. However, the structure of the plant membrane system is damaged under salt stress, reducing the efficiency of protein synthesis and the accumulation of excessive harmful metabolites in the plant, ultimately affecting chlorophyll formation and photosynthetic capacity.
Chlorophyll is the main pigment involved in photosynthesis in crops, and its content is related not only to the process of photosynthesis assimilation, but also to one of the important physiological indices used to measure the salt tolerance of crops under salt stress [33]. In this study, the enhancement of plant photosynthesis favored plant and fruit growth as well as DMA (Figure 6); the DMA of S3 increased by 57.76% (83.44%) in the two seasons. Soil salinity affects yield quality by influencing physiological and biochemical processes in crops, and saline irrigation without exceeding a certain threshold can improve the quality of some crops [7]. In particular, the lower soil salinity promoted the continuous growth of the root system, and although it limited the root uptake of soil water and nutrients to some extent, it facilitated the accumulation of sugar, vitamin C, and other components in the fruit (Figure 5), which promoted the growth and quality of the fruit.
Meanwhile, suitable soil salinity also promoted an increase in fruit cucumber yield and efficiency, but excessive salinity stress resulted in significant yield reduction. In this study, compared to CK, the yield of S3 fruit cucumber increased by 35.98% and 27.94% in two seasons of the experiment (Figure 10). This shows that with the increase in the salinity of irrigation water, the yield gradually decreases, which is consistent with the research results proposed by Wan et al. that cucumber yield decreases sharply with the increase in EC [46]; the IWUE and WUE decreased with the increase in the salinity of irrigation water (Figure 7). Ref. [60] showed that WUE in sensitive crops decreases with increasing salinity, as yield decreases in sensitive crops are greater than evapotranspiration decreases. The WUE of salt-tolerant crops was also considered to be unchanged by the researchers [61], which is not consistent with the results of this study. This is mainly due to the difference in varieties, regions, and agronomic measures, and different varieties and crops have different sensitivities to salt stress. Some interesting results were obtained based on the two-season experiment. However, brackish water irrigation is a long-term practice. With future years of brackish water irrigation and the accumulation of soil salinity, the negative effects on crop growth will gradually become apparent; therefore, this is an exercise that still needs to be monitored and evaluated on an ongoing basis in the future. Growth of cucumbers at different growth stages in a two-season experiment.
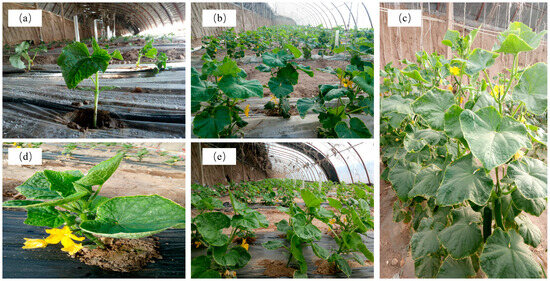
Figure 10.
Growth of cucumbers at different growth stages in a two-season experiment. (a–c) indicate the early, middle, and late stages of cucumber growth in spring–summer (S–S), respectively. (d,e) indicate the early, and middle stages of cucumber growth in autumn–winter (A–W), respectively.
5. Conclusions
- (1)
- The LAI, A, DMA, yield, and soil microbial and enzyme activities increased with decreasing MIW. The superior MIW was 0.3–0.5 g L−1 (S3), and the yield increased by 35.98% (27.94%).
- (2)
- Fruit vitamin C, soluble protein, total acid, and nitrate contents increased with decreasing MIW, while soluble sugar and soluble solids contents increased with increasing MIW.
- (3)
- A comprehensive assessment showed that the appropriate MIW facilitated increases in soil enzyme activity, enriched the soil microbial population, promoted the growth of fruit cucumber, enhanced photosynthetic capacity and DMA, increased yield, and improved quality.
- (4)
- Brackish irrigation (higher MIW) is not conducive to increased yields, but may be beneficial in enhancing fruit quality.
Author Contributions
Z.O. conducted the greenhouse experiments, analyzed the data, plotted the graphs, and wrote the manuscript. J.T. funded the study and improved the manuscript. X.Y. provided important suggestions for revision. All authors have read and agreed to the published version of the manuscript.
Funding
This study was funded by Ningxia Hui Autonomous Region Key Research and Development Plan Major Project (2018BBF02022), National Natural Science Foundation of China (51469027, 51869024), Ningxia Hui Autonomous Region Colleges and Universities First-Class Subject Construction Project (NXYLXK2021A03, NXYLXK2017A03), Natural Science Foundation of Changsha (kq2208080), Scientific Research Project of Hunan Provincial Education Department (22B0226), and Water Resources Science and Technology Program of Hunan Province (XSKJ2023059-46).
Data Availability Statement
Data are contained within the article.
Conflicts of Interest
The authors declare that they have no known competing financial interests or personal relationships that could have appeared to influence the work reported in this paper.
References
- Jiang, Q.; Peng, J.; Biswas, A.; Hu, J.; Zhao, R.; He, K.; Shi, Z. Characterising dryland salinity in three dimensions. Sci. Total Environ. 2019, 682, 190–199. [Google Scholar] [CrossRef] [PubMed]
- Li, D.; Wan, S.; Li, X.; Kang, Y.; Han, X. Effect of water-salt regulation drip irrigation with saline water on tomato quality in an arid region. Agric. Water Manag. 2022, 261, 107347. [Google Scholar] [CrossRef]
- Wang, Z.; Fan, B.; Guo, L. Soil salinization after long-term mulched drip irrigation poses a potential risk to agricultural sustainability. Eur. J. Soil Sci. 2019, 70, 20–24. [Google Scholar] [CrossRef]
- Dehghanisanij, H.; Agassi, M.; Anyoji, H.; Yamamoto, T.; Inoue, M.; Eneji, A.E. Improvement of saline water use under drip irrigation system. Agric. Water Manag. 2006, 85, 233–242. [Google Scholar] [CrossRef]
- Oster, J.D. Irrigation with poor quality water. Agric. Water Manag. 1994, 25, 271–297. [Google Scholar] [CrossRef]
- Minhas, P.S.; Ramos, T.B.; Ben-Gal, A.; Pereira, L.S. Coping with salinity in irrigated agriculture: Crop evapotranspiration and water management issues. Agric. Water Manag. 2020, 227, 105832. [Google Scholar] [CrossRef]
- Tian, F.; Wen, J.; Hu, H.; Ni, G. Review on water and salt transport and regulation in drip irrigated fields in arid regions. J. Hydraul. Eng. (Shuili Xuebao) 2018, 49, 126–135. [Google Scholar]
- Wang, Q.; Huo, Z.; Zhang, L.; Wang, J.; Zhao, Y. Impact of saline water irrigation on water use efficiency and soil salt accumulation for spring maize in arid regions of China. Agric. Water Manag. 2016, 163, 125–138. [Google Scholar] [CrossRef]
- Tedeschi, A.; Dell’Aquila, R. Effects of irrigation with saline waters, at different concentrations, on soil physical and chemical characteristics. Agric. Water Manag. 2005, 77, 308–322. [Google Scholar] [CrossRef]
- Cheng, M.; Wang, H.; Fan, J.; Wang, X.; Sun, X.; Yang, L.; Zhang, S.; Xiang, Y.; Zhang, F. Crop yield and water productivity under salty water irrigation: A global meta-analysis. Agric. Water Manag. 2021, 256, 107105. [Google Scholar] [CrossRef]
- Pérez-Pérez, J.G.; Robles, J.M.; García-Sánchez, F.; Botía, P. Comparison of deficit and saline irrigation strategies to confront water restriction in lemon trees grown in semi-arid regions. Agric. Water Manag. 2016, 164, 46–57. [Google Scholar] [CrossRef]
- Aktas, H.; Abak, K.; Cakmak, I. Genotypic variation in the response of pepper to salinity. Sci. Hortic. 2006, 110, 260–266. [Google Scholar] [CrossRef]
- Jiang, J.; Zhai, D.; Zhang, C.; Ma, J. Influence of Saline Water Irrigation on Root Distribution, Wheat Yield, and Soil Salinity. J. Irrig. Drain. Eng. 2021, 147, 04021005. [Google Scholar] [CrossRef]
- Amer, K.H. Corn crop response under managing different irrigation and salinity levels. Agric. Water Manag. 2010, 97, 1553–1563. [Google Scholar] [CrossRef]
- Cucci, G.; Lacolla, G.; Boari, F.; Mastro, M.A.; Cantore, V. Effect of water salinity and irrigation regime on maize (Zea mays L.) cultivated on clay loam soil and irrigated by furrow in Southern Italy. Agric. Water Manag. 2019, 222, 118–124. [Google Scholar] [CrossRef]
- Chen, W.; Jin, M.; Ferré, T.P.A.; Liu, Y.; Xian, Y.; Shan, T.; Ping, X. Spatial distribution of soil moisture, soil salinity, and root density beneath a cotton field under mulched drip irrigation with brackish and fresh water. Field Crops Res. 2018, 215, 207–221. [Google Scholar] [CrossRef]
- Chen, W.; Hou, Z.; Wu, L.; Liang, Y.; Wei, C. Evaluating salinity distribution in soil irrigated with saline water in arid regions of northwest China. Agric. Water Manag. 2010, 97, 2001–2008. [Google Scholar] [CrossRef]
- Zhong, R.; Dong, X.; Ma, Y. Sustainable water saving: New concept of modern agricultural water saving, starting from development of Xinjiang’s agricultural irrigation over the last 50 years. Irrig. Drain. 2009, 58, 383–392. [Google Scholar]
- Wu, Y.; Zheng, C.; Sun, J.; Li, K.; Dang, H.; Zhang, J. The Effects of Long-term Saline Water Irrigation on Stability of Soil Aggregates in a Cotton Field. J. Irrig. Drain. 2020, 39, 58–64, 107. [Google Scholar]
- Oster, J.D.; Schroer, F.W. Infiltration as Influenced by Irrigation Water Quality. Soil Sci. Soc. Am. J. 1979, 43, 444–447. [Google Scholar] [CrossRef]
- Liu, B.; Wang, S.; Kong, X.; Liu, X.; Sun, H. Modeling and assessing feasibility of long-term brackish water irrigation in vertically homogeneous and heterogeneous cultivated lowland in the North China Plain. Agric. Water Manag. 2019, 211, 98–110. [Google Scholar] [CrossRef]
- Wu, Z.; Wang, Q. Both Soil Infiltration Characteristics and Ion Mobility Features by Mineralization Degree of Infiltration Water. Trans. Chin. Soc. Agric. Mach. 2010, 41, 64–69. [Google Scholar]
- Chen, L.; Feng, Q.; Wang, Y.; Yu, T. Water and salt movement under saline water irrigation in soil with clay interlayer. Trans. Chin. Soc. Agric. Eng. (Trans. CSAE) 2012, 28, 44–51. [Google Scholar]
- Zhou, D.-P.; Wu, S.-H.; Chu, C.-B.; Liu, F.-F.; Jiang, Z.-F.; Fan, J.-Q. Eco-Toxicological Effects of Salt Stress on Microorganisms and Enzymes Activities in Vegetable Soil. J. Agro-Environ. Sci. 2011, 30, 1602–1607. [Google Scholar]
- Wu, F.-Z.; Bao, J.; Liu, S.-Q. Effects of Salt Stress on Rhizospheric Soil Bacterial Community Structure and Cucumber Yield. Acta Hortic. Sin. 2010, 37, 741–748. [Google Scholar]
- Chowdhury, N.; Yan, N.; Islam, M.N.; Marschner, P. The extent of drying influences the flush of respiration after rewetting in non-saline and saline soils. Soil Biol. Biochem. 2011, 43, 2265–2272. [Google Scholar] [CrossRef]
- Lakhdar, A.; Hafsi, C.; Rabhi, M.; Debez, A.; Montemurro, F.; Abdelly, C.; Jedidi, N.; Ouerghi, Z. Application of municipal solid waste compost reduces the negative effects of saline water in Hordeum maritimum L. Bioresour. Technol. 2008, 99, 7160–7167. [Google Scholar] [CrossRef]
- Chinnusamy, V.; Jagendorf, A.; Zhu, J.-K. Understanding and Improving Salt Tolerance in Plants. Crop Sci. 2005, 45, 437–448. [Google Scholar] [CrossRef]
- Huang, Y.; Tang, R.; Cao, Q.; Bie, Z. Improving the fruit yield and quality of cucumber by grafting onto the salt tolerant rootstock under NaCl stress. Sci. Hortic. 2009, 122, 26–31. [Google Scholar] [CrossRef]
- Zhu, X.-G.; Wang, Q.; Zhang, Q.-D.; Lu, C.-M.; Kuang, T.-Y. Response of photosynthetic functions of winter wheat to salt stress. Plant Nutr. Fertil. Sci. 2022, 8, 177–180. [Google Scholar]
- Cramer, G.R.; Alberico, G.J.; Schmidt, C. Salt Tolerance Is Not Associated With the Sodium Accumulation of Two Maize Hybrids. Funct. Plant Biol. 1994, 21, 675–692. [Google Scholar] [CrossRef]
- Wei, Y.; Shen, J.; Mingyuan, A.; Lan, Z.; Yin, C.; Tian, Y.; Cao, Y.E. Effects of different materials on soil quality and yield of cucumber under brackish irrigation. Trans. Chin. Soc. Agric. Eng. (Trans. CSAE) 2022, 38, 95–104. [Google Scholar]
- Wan, S.; Kang, Y.; Wang, D.; Liu, S. Effect of saline water on tomato growth and yield by drip irrigation in semi-humid regions of north China. Trans. Chin. Soc. Agric. Eng. (Trans. CSAE) 2008, 24, 30–35. [Google Scholar]
- Deb, P.; Tran, D.A.; Udmale, P.D. Assessment of the impacts of climate change and brackish irrigation water on rice productivity and evaluation of adaptation measures in Ca Mau province, Vietnam. Theor. Appl. Climatol. 2016, 125, 641–656. [Google Scholar] [CrossRef]
- Zhu, M.; Wang, Q.; Sun, Y.; Zhang, J. Effects of oxygenated brackish water on germination and growth characteristics of wheat. Agric. Water Manag. 2021, 245, 106520. [Google Scholar] [CrossRef]
- Chen, W.; Jin, M.; Ferré, T.P.A.; Liu, Y.; Huang, J.; Xian, Y. Soil conditions affect cotton root distribution and cotton yield under mulched drip irrigation. Field Crops Res. 2020, 249, 107743. [Google Scholar] [CrossRef]
- Huang, M.; Zhang, Z.; Sheng, Z.; Zhu, C.; Zhai, Y.; Lu, P.; Brinkman, D. Soil Salinity and Maize Growth under Cycle Irrigation in Coastal Soils. Agron. J. 2019, 111, 2276–2286. [Google Scholar] [CrossRef]
- Karlberg, L.; Rockström, J.; Annandale, J.G.; Steyn, J.M. Low-cost drip irrigation—A suitable technology for southern Africa?: An example with tomatoes using saline irrigation water. Agric. Water Manag. 2007, 89, 59–70. [Google Scholar] [CrossRef]
- Pasternak, D.; De Malach, Y. Irrigation with brackish water under desert conditions X. Irrigation management of tomatoes (Lycopersicon esculentum Mills) on desert sand dunes. Agric. Water Manag. 1995, 28, 121–132. [Google Scholar] [CrossRef]
- Mitchell, J.P.; Shennan, C.; Grattan, S.R.; May, D.M. Tomato Fruit Yields and Quality under Water Deficit and Salinity. J. Am. Soc. Hortic. Sci. 1991, 116, 215–221. [Google Scholar] [CrossRef]
- Gawad, G.A.; Arslan, A.; Gaihbe, A.; Kadouri, F. The effects of saline irrigation water management and salt tolerant tomato varieties on sustainable production of tomato in Syria (1999–2002). Agric. Water Manag. 2005, 78, 39–53. [Google Scholar] [CrossRef]
- Malash, N.; Flowers, T.J.; Ragab, R. Effect of irrigation systems and water management practices using saline and non-saline water on tomato production. Agric. Water Manag. 2005, 78, 25–38. [Google Scholar] [CrossRef]
- Li, J.; Tian, P.; Li, J.; Gao, Y.; Ren, H.; Liu, M. Effects of saline water irrigation on sugar accumulation and activities of sucrose-metabolizing enzymes of greenhouse tomato. J. Northwest AF Univ. 2018, 46, 101–110. [Google Scholar]
- Wang, X.; Tian, W.; Zheng, W.; Shah, S.; Li, J.; Wang, X.; Zhang, X. Quantitative relationships between salty water irrigation and tomato yield, quality, and irrigation water use efficiency: A meta-analysis. Agric. Water Manag. 2023, 280, 108213. [Google Scholar] [CrossRef]
- Wan, S.; Kang, Y.; Wang, D.; Liu, S.-P.; Feng, L.-P. Effect of drip irrigation with saline water on tomato (Lycopersicon esculentum Mill) yield and water use in semi-humid area. Agric. Water Manag. 2007, 90, 63–74. [Google Scholar] [CrossRef]
- Wan, S.; Kang, Y.; Wang, D.; Liu, S.; Feng, L. Effects of saline water on cucumber yields and irrigation water use efficiency under drip irrigation. Trans. Chin. Soc. Agric. Eng. (Trans. CSAE) 2007, 23, 30–35. [Google Scholar]
- Ma, W.; Cheng, Q.; Li, L.; Yu, Z.; Niu, L.a. Effect of slight saline water irrigation on soil salinity and yield of crop. Trans. Chin. Soc. Agric. Eng. (Trans. CSAE) 2010, 26, 73–80. [Google Scholar]
- Wang, Q.; Shang, Y. Review of Research Development on Water and Soil Regulation with Brackish Water Irrigation. Trans. Chin. Soc. Agric. Mach. 2015, 46, 117–126. [Google Scholar]
- Lu, R. Analytical Methods of Soil Agrochemistry; China Agricultural Science and Technology Press: Beijing, China, 1999. [Google Scholar]
- Shi, H.; Tian, J.; Liu, Q. Irrigation and Drainage Engineering; Water Resources and Hydropower Press: Beijing, China, 2006. [Google Scholar]
- Wang, J.; Cai, H.-J.; Li, H.-X.; Chen, X.-M. Study and Evaluation of the Calculation Methods of Reference Crop Evapotranspiration in Solar-heated Greenhouse. J. Irrig. Drain. 2006, 25, 11–14. [Google Scholar]
- Shi, X.; Cai, H.; Zhao, L.; Yang, P.; Wang, Z. Estimation of greenhouse tomato evapotranspiration under deficit irrigation based on SIMDualKc model. Trans. Chin. Soc. Agric. Eng. (Trans. CSAE) 2015, 31, 131–138. [Google Scholar]
- Hsiao, T.C. Plant responses to water stress. Annu. Rev. Plant Physiol. 1973, 24, 519–570. [Google Scholar] [CrossRef]
- Aslam, M.; Qureshi, R.; Ahmed, N. A rapid screening technique for salt tolerance in rice (Oryza sativa L.). Plant Soil 1993, 150, 99–107. [Google Scholar] [CrossRef]
- Corwin, D.L.; Lesch, S.M. Application of Soil Electrical Conductivity to Precision Agriculture. Agron. J. 2003, 95, 455–471. [Google Scholar]
- Williams, B.G.; Hoey, D. The use of electromagnetic induction to detect the spatial variability of the salt and clay contents of soils. Soil Res. 1987, 25, 21–27. [Google Scholar] [CrossRef]
- Kováčik, J.; Klejdus, B.; Hedbavny, J.; Bačkor, M. Salicylic acid alleviates NaCl-induced changes in the metabolism of Matricaria chamomilla plants. Ecotoxicology 2009, 18, 544–554. [Google Scholar] [CrossRef] [PubMed]
- Zhang, Y.-L.; Lu, W.-L.; Zhang, W.; Li, Y. Effects of long term brackish water irrigation on characteristics of agrarian soil. J. Agro-Environ. Sci. 2006, 25, 969–973. [Google Scholar]
- Pang, G.; Zhang, L.; Wang, T.; Zhao, Z.; Xu, Z. Review on plant physiological and growth responses and regulation mechanisms under slight saline water irrigation. J. Univ. Jinan (Sci. Technol.) 2016, 30, 250–255. [Google Scholar]
- Wan, S.; Kang, Y.; Wang, D.; Liu, S.-P. Effect of saline water on cucumber (Cucumis sativus L.) yield and water use under drip irrigation in North China. Agric. Water Manag. 2010, 98, 105–113. [Google Scholar] [CrossRef]
- Katerji, N.; Van Hoorn, J.; Hamdy, A.; Mastrorilli, M. Salinity effect on crop development and yield, analysis of salt tolerance according to several classification methods. Agric. Water Manag. 2003, 62, 37–66. [Google Scholar] [CrossRef]
Disclaimer/Publisher’s Note: The statements, opinions and data contained in all publications are solely those of the individual author(s) and contributor(s) and not of MDPI and/or the editor(s). MDPI and/or the editor(s) disclaim responsibility for any injury to people or property resulting from any ideas, methods, instructions or products referred to in the content. |
© 2024 by the authors. Licensee MDPI, Basel, Switzerland. This article is an open access article distributed under the terms and conditions of the Creative Commons Attribution (CC BY) license (https://creativecommons.org/licenses/by/4.0/).