Article

A Comparison of Watermelon Flesh Texture across Different Ploidy Levels Using Histology and Cell Wall Measurements

1
National Key Laboratory for Germplasm Innovation & Utilization of Horticultural Crops, Zhengzhou Fruit Research Institute, Chinese Academy of Agricultural Sciences, Zhengzhou 450009, China
2
Zhongyuan Research Center, Chinese Academy of Agricultural Sciences, Xinxiang 453400, China
3
Henan Key Laboratory of Fruit and Cucurbit Biology, Zhengzhou Fruit Research Institute, Chinese Academy of Agricultural Sciences, Zhengzhou 450009, China
*
Authors to whom correspondence should be addressed.
Horticulturae 2024, 10(2), 112; https://doi.org/10.3390/horticulturae10020112
Submission received: 14 December 2023 / Revised: 13 January 2024 / Accepted: 22 January 2024 / Published: 24 January 2024

Abstract

:
Watermelon fruits of different ploidy levels exhibit significant variations in texture. This study aimed to investigate the primary factors that influence texture differences. To achieve this, we conducted an investigation into the differences in fruit texture development using homozygous autogamous diploid (2×) lines and their autotriploid (3×) and autotetraploid (4×) lines ‘Yixuan’. The study investigated fruit development, flesh texture profile analysis (TPA), flesh cell wall polysaccharide content, and flesh cell microstructure analysis in 2×, 3×, and 4× watermelon fruits. The study found that as watermelon fruits matured, several characteristics increased, including fruit weight, TSS (total soluble solids) content, rind hardness, flesh cell size, and cell wall polysaccharide contents such as crude fiber, cellulose, hemicellulose, lignin, and protopectin. In contrast, the flesh texture parameters and soluble pectin content of the flesh cell wall decreased over time. Significant differences in fruit flesh texture and flesh cell structure were observed among fruits of different ploidy levels at the 32 DAP. Specifically, the 2× fruits displayed considerably lower rind hardness, reduced flesh texture (Hardness, Fracturability, Chewiness, Gumminess), and cell density compared to the 3× and 4× fruits. Additionally, the 2× fruits had larger cell sizes than the 3× and 4× fruits. However, there were no significant differences observed in the flesh cell wall polysaccharide contents across various ploidy levels. These findings suggest that the variation in texture among watermelon fruits of different ploidy levels can be attributed to the size and arrangement of the flesh cells. This research provides a foundation for the further exploration of the intrinsic regulatory factors and molecular mechanisms contributing to texture variation in polyploid watermelon fruits.

1. Introduction

Watermelon (Citrullus lanatus) belongs to the Cucurbitaceae family and is an herbaceous annual plant native to Africa. The fruit of watermelon is rich in water and essential nutrients that are highly beneficial for human health [1]. According to the Food and Agriculture Organization (FAO), as of 2021, the global cultivation area of watermelon had exceeded 3 million hectares, accounting for approximately 7% of the world’s total vegetable production area [2]. Triploid seedless watermelon is an example of artificially induced polyploid crops. It offers several advantages over diploid watermelon, triploid seedless watermelon, including high yield, increased stress resistance, and seedlessness [3]. Its cultivation area has been expanding annually and now accounts for approximately 20% of the total watermelon area [3].
Polyploidy is a defining characteristic of genome evolution in higher plants and plays a crucial role in the evolutionary trajectory of organisms [3]. Homopolyploidy is an ideal system for exploring ploidy variations [4]. Homopolyploidy represents an inheritable system that is characterized by multiple gene repetitions. This enhances gene function conservation, markedly reduces the incidence of mutations and expression of latent genes, and establishes a stable ecological niche for competitive survival under challenging natural conditions [5]. When compared to diploid, doubling the genome of polyploid chromosomes can have multi-level effects on the morphological, developmental, and physiological functions of plants [6,7]. Commercial watermelon varieties include seedless triploids achieved through crossbreeding female tetraploid with male diploid. Tetraploid watermelon serves as a progenitor for triploid watermelon breeding and is typically obtained through diploid chromosome doubling [8]. Tetraploid watermelons are typically distinguished by their larger leaves, thicker vines and rinds, enlarged pistil and stamen floral organs, and bigger seeds [9].
Fruit texture is a sensory attribute that can be perceived through vision, hearing, and touch [10]. It plays a crucial role in determining the sensory quality of watermelon and serves as a vital indicator for assessing the fruit’s commercial viability [11]. The characteristics of watermelon flesh texture influence the taste, flavor, and shelf-life of ripe watermelon [12]. Changes in fruit texture are a complex physiological and biochemical process that are regulated by various factors, including genetic background, cell wall structure and composition, cell wall degrading enzyme activities, cell size, and hormones [13,14]. Fruit softening typically involves water loss, reduced turgor, and degradation of pectin, cellulose, and hemicellulose [14,15,16,17,18]. Variations in watermelon flesh firmness are primarily caused by changes in the structural components of the flesh cell wall. The major components of the cell wall, cellulose, pectin, and hemicellulose, significantly influence the flesh firmness and sensory quality of watermelon [19,20,21,22,23,24]. Fruit texture is also impacted by the size and arrangement of fruit cells. During the transition from fruit set to maturity, the flesh cells gradually enlarge, resulting in a change in flesh texture from firm to soft [25]. The texture of watermelon fruits of different ploidy levels significantly affects their taste [3]. However, there have been limited studies on the factors that influence the watermelon fruit texture in different ploidy levels.
Previously, watermelon flesh texture evaluation primarily relied on sensory evaluation methods or the utilization of fruit hardness testers to measure fruit hardness [23]. The sensory evaluation method encompasses various factors, including flesh water content, fiber content, flesh firmness, and flesh hardness. However, the method suffers from significant subjective bias, limited reproducibility, and the inability to quantitatively measure other sensory parameters that impact flesh texture, such as crispness and elasticity [21]. In recent years, researchers have aimed to enhance the objectivity of fruit texture evaluation parameters by employing instruments like texture meters. These meters find extensive application in assessing the quality of fruits and vegetables. These devices have been used to evaluate various fruit crops, including apple [26], watermelon [21], melon [27], pear [28], peach [29], and tomato [30].
Fruit texture is an important characteristic of watermelon merchantability. It is related to the development period, polysaccharide composition and content, and cell structure. The purpose of this research was to investigate how the ploidy level affects the watermelon flesh texture. The investigation was conducted by comparing the polysaccharide contents, flesh texture profile parameters, and cell structure of 2×, 3×, and 4× watermelon fruits at different development stages. This study provides information at the physiological level for the mechanism of fruit texture in diploid and polyploid watermelons, which should provide a theoretical basis for utilizing the benefits of polyploid.

2. Materials and Methods

2.1. Plant Materials and Growth Conditions

In this study, the materials used were ‘Yi Xuan’, a watermelon inbred line obtained from the Polyploidy Watermelon Genetic Breeding Project at Zhengzhou Fruit Research Institute, Chinese Academy of Agricultural Sciences. The diploid inbred line (2n = 2× = 22, 2×) was induced to autotetraploidy (4n = 4× = 44, 4×) using 0.1% colchicine during the cotyledon spreading stage. The success of tetraploid mutagenesis was confirmed through physiological phenotype and chromosome observation. The plants underwent self-crossing for seven generations to restore fertility. Subsequently, they were crossbred with their diploid counterpart to produce autotriploid watermelon (3n = 3× = 33, 3×). Chromosome observation method was used to determine the ploidy level; the newly germinated root tips of the 2×, 3×, and 4× fruits were used as the materials; the method was according to that reported by Zhu et al. (2018) [31]. The results of chromosome counting observations are shown in Supplemental Figure S1. The appearances of diploid, triploid, and tetraploid plants were similar, differing only in ploidy level. ‘Yi Xuan’ belongs to the cultivar type and is commonly utilized as the maternal variety for Asian watermelon cultivars; the fruit is globular with green rind, pink flesh, 3.5 kg weight, total soluble solid (TSS) content of 11.5%, and rind thickness of 0.7 cm. It takes about 32 days from its flowering to fruit maturing.
The field experiment was conducted at Xinxiang experimental base of Zhengzhou Fruit Research Institute, Chinese Academy of Agricultural Science, Xinxiang City, China (35.16° N; 113.80° E), in spring 2020. The seedlings were grown in a seed bed and transplanted to the main field at the stage of four to six leaves after sowing. The seedlings were set to maintain a plant spacing of 50 cm and a row spacing of 2.5 m. Plants were planted in three replications following a randomized complete block design (RCBD). Three vines were cultivated using regular agronomic practices. One fruit from the third female flower of the primary vine was preserved and manually pollinated at anthesis, with the pollination date being recorded. Watermelon fruits were harvested at 8, 16, 24, and 32 days after pollination (DAP) for analysis of physiological and biochemical indices as well as cell microstructure. Three fruits with normal growth potential and similar fruiting nodes were selected for each measurement (Figure 1).

2.2. Physiological and Biochemical Indicators and Measurement Methods

2.2.1. Evaluation of Fruit Weight, Rind Hardness, and Flesh TSS Content

The phenotypic traits were measured according to Saminathan’s protocol [8]. Fruit weight was determined using electronic scales, while rind hardness was assessed at the equatorial line of the fruit using an FT011 fruit hardness tester (Italy, France). Additionally, the TSS content was measured from the fruit center’s using an Atago PAL-2 digital refractometer (Tokyo, Japan). Each measurement was performed in three biological replicates.

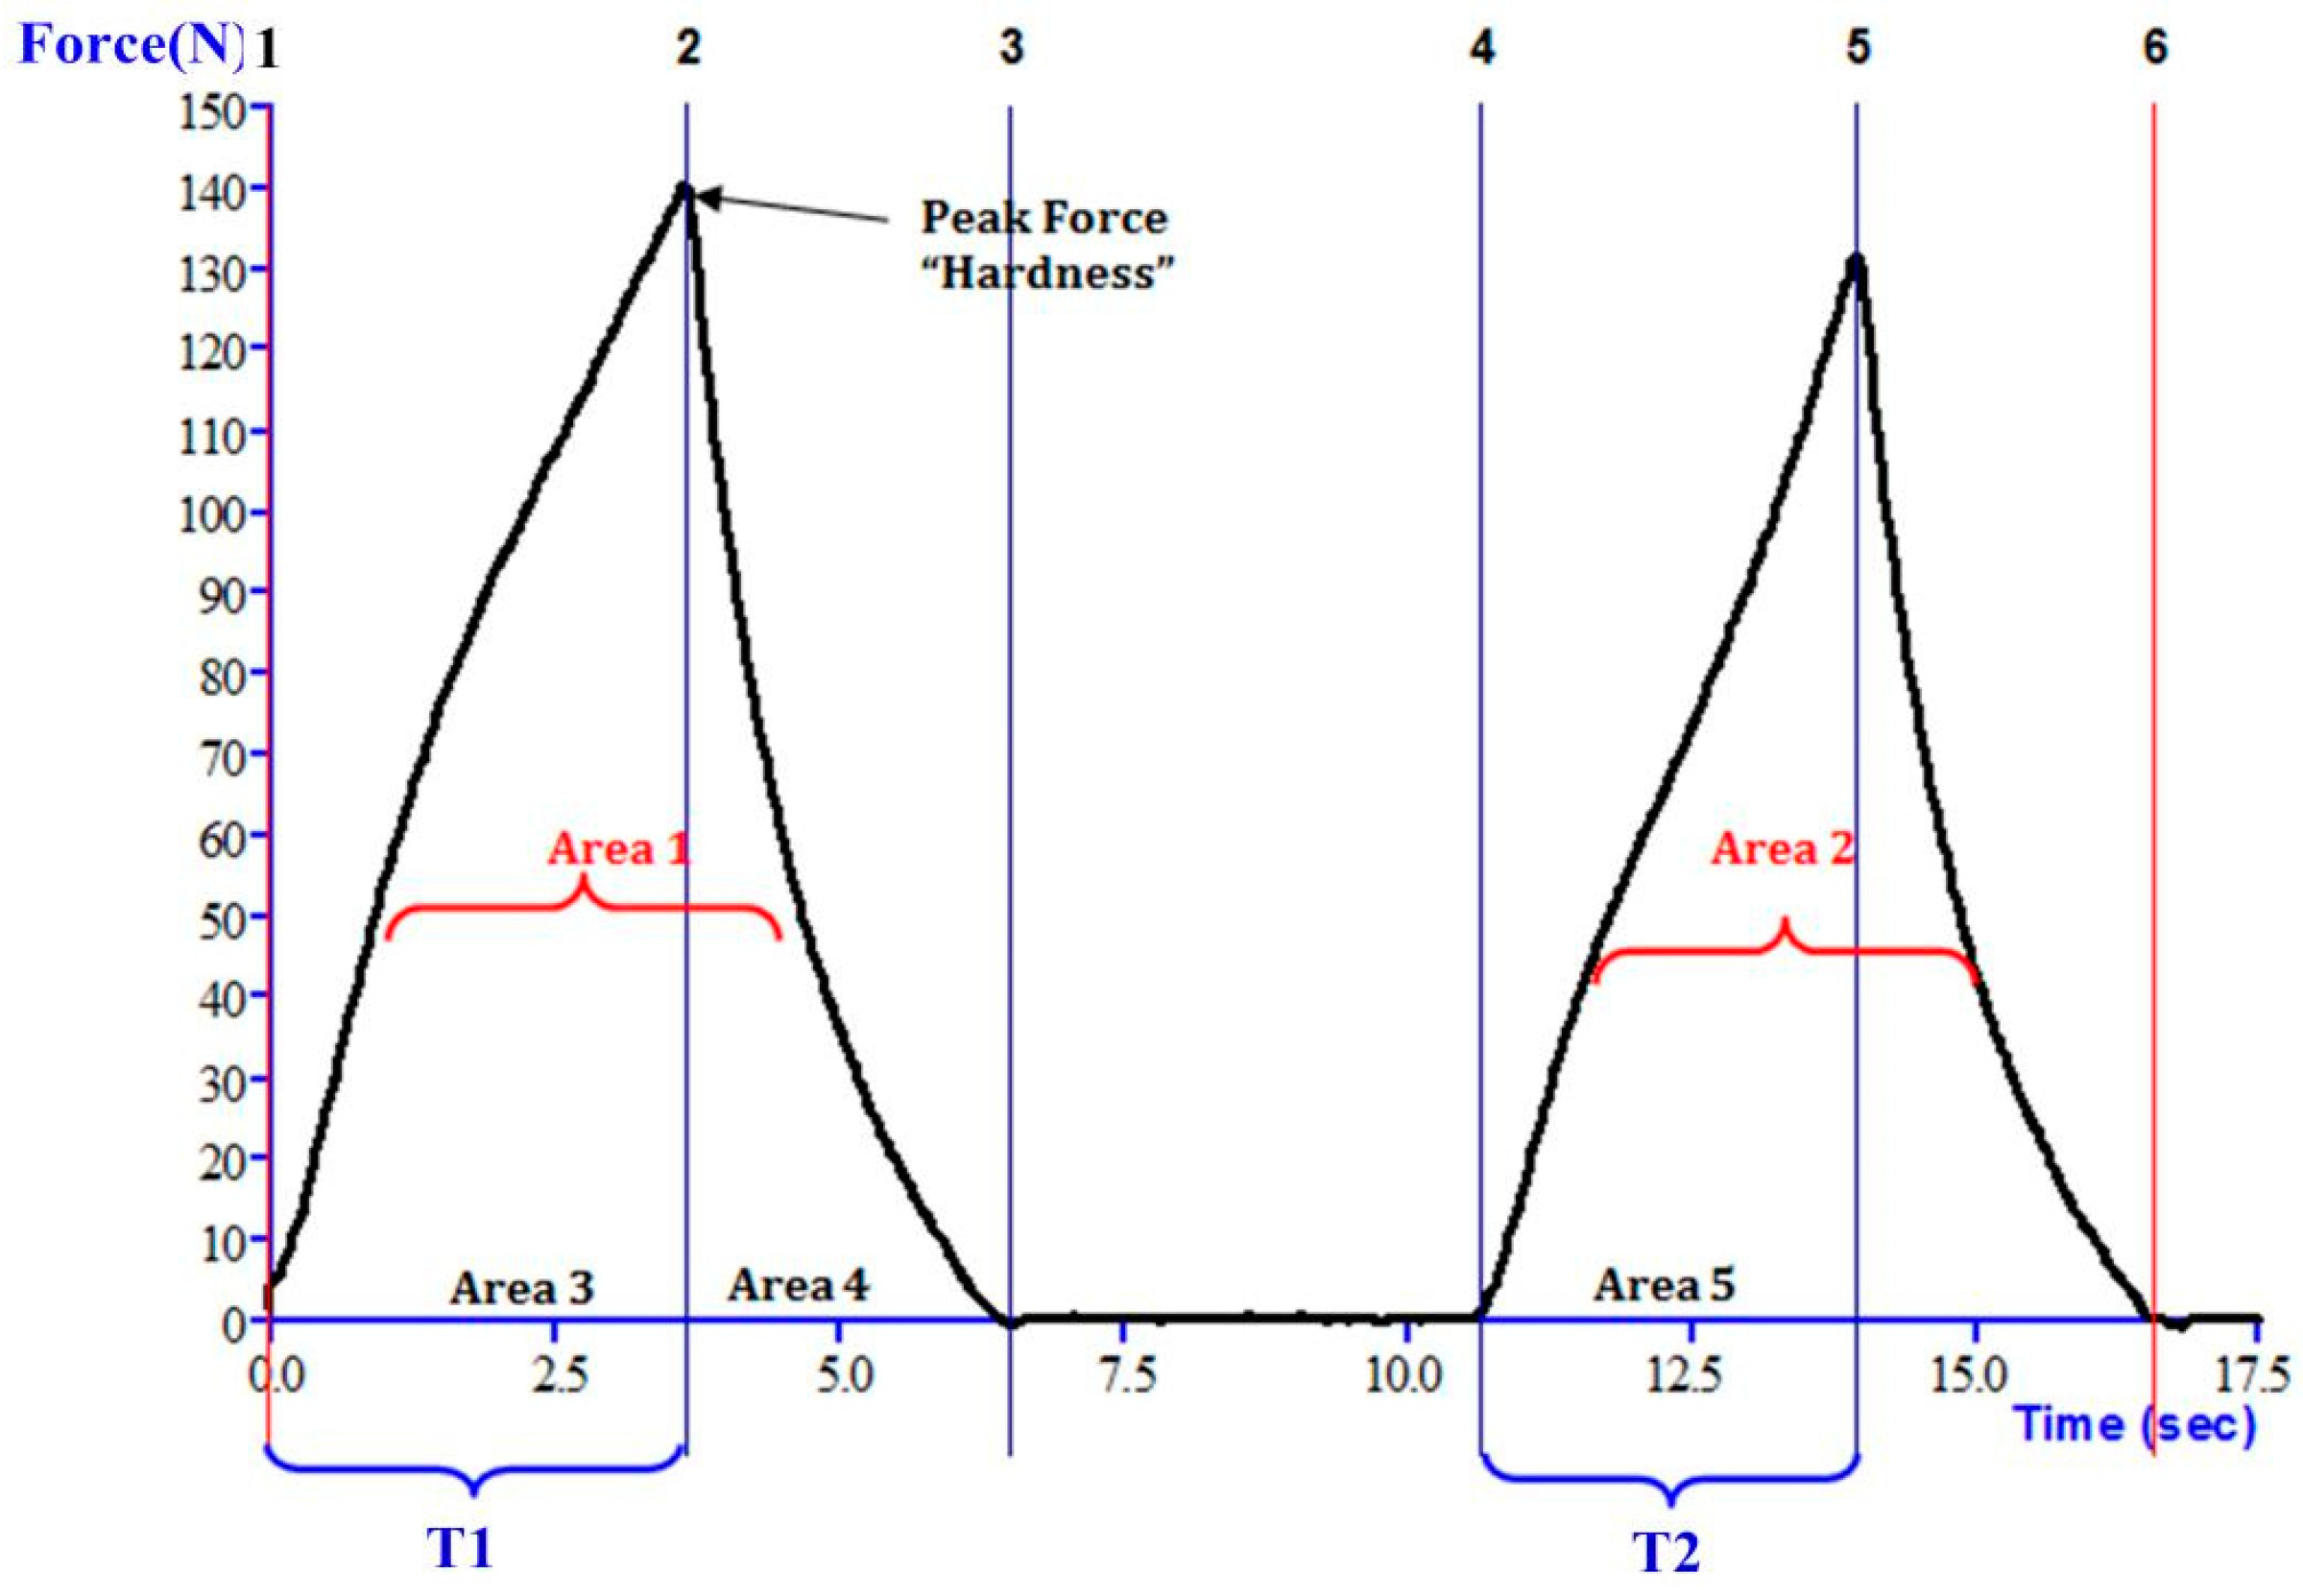
2.2.2. Flesh Texture Measurement

Texture profile analysis (TPA) was performed using the TA.XT Plus Physical Property Analyzer (Stable Micro System, Godalming, UK). The watermelon fruits were longitudinally divided into two halves, and various sections of the flesh were selected and cubed into 1 cm × 1 cm × 1 cm pieces, as illustrated in Figure 2. The samples were placed on a TPA test plate, and texture analysis was conducted using a P/100 probe (φ100 mm platen). The pre-test speed, test speed, and upward speed after the test were set at 2.0 mm/s, 1.0 mm/s, and 1.0 mm/s, respectively. The flesh’s compression deformation rate was 70%, with a compression stopping time of 5.0 s and a trigger force of 10.0 g. Texture Exponent 32 was used to calculate texture parameters. Figure 3 shows the texture curve of this machinery. The resulting curve provides information on Hardness, Fracturability, Gumminess, and Chewiness.
Hardness = Peak Force 1
Fracturability = Hardness/T1
Gumminess = A2/A1 × Hardness
Chewiness = A2/A1 × Hardness × Springiness

2.2.3. Determination of Cell Wall Polysaccharide Content

The crude fiber content was determined using the methodology outlined by Oyeyinka [32]. A 5 g sample was boiled with 100 mL of 0.25 M sulfuric acid (H2SO4) solution under reflux for 30 min; then, it was filtered. The insoluble matter was rinsed four times with boiling water to remove any residual acid contents. The residue was then treated with 100 mL of 0.31 M sodium hydroxide (NaOH) solution using a similar procedure. The remaining base was eliminated by thoroughly washing the final residue with distilled water. The sample was then oven-dried at 100 °C, cooled in a desiccator, and weighed (C1). The sample was incinerated at 550 °C for 2 h, cooled in a desiccator, and weighed again (C2).
Crude fiber content was quantified thus:
Crude fiber = (C2 − C1)/Weight of Sample × 100%
The method proposed by Gao [21] was used to measure the pectin, cellulose, and hemicellulose contents. The steps are as follows: 1.0 g of flesh was treated with liquid nitrogen; then, 10 mL of 80% ethanol was added and cooked for 20 min. After cooling for 8 min at 8000 r/min, the supernatant was discarded. The crude cell wall (CWM) was obtained after re-centrifuging twice with 20 mL of ethanol and acetone. The dried CWM was weighed (50 mg), and the different components were extracted in sequence as follows: to obtain soluble pectin, 10 mL of 50 mmol/L sodium acetate (pH 6.5) was used. Protopectin was extracted using 10 mL of 50 mmol/L Na2CO3 (containing 2 mmol/L CDTA). Hemicellulose was obtained by shaking 4 mol/L KOH (containing 1% NaBH4) for 5 h. Cellulose was obtained by washing the rest twice with ion-free water. The pectin content was determined using the carbazole method, the hemicellulose content was determined using the anthrone method, and the cellulose content was determined gravimetrically. Each treatment assay was repeated three times.

2.2.4. Observation of Flesh Cell Microstructure

The fruit’s flesh tissue from the fruit center was selected and cut into 0.5 cm × 0.5 cm × 0.5 cm pieces. These pieces were fixed with FAA fixative (70% ethanol), dehydrated through an alcohol gradient, embedded in paraffin wax after being dipped in wax, and stained with toluidine blue. The trimmed wax block was then sliced to a thickness of 4 μM to observe the tissue’s cellular structure. The tissue’s target area was imaged at 100× magnification using an Eclipse Ci-L photomicrographic microscope. Image-Pro Plus 6.0 analysis software was used to evaluate the total cell area in each image, along with the total number of cells, the average cell area, and cell density, using millimeters as the standard unit of measurement. Ten fields of view were observed per section. Normal cells within each field of view were manually circled and used as a template for subsequent searches. For cell gaps and cells with incomplete display, no counting or area statistics were performed.
The calculation formulas used in one field of view were as follows:
Average cell area = Total cell area/Total number of cells;
Cell density = Total number of cells/Total cell area.

2.3. Statistical Analysis of Data

The experimental data were analyzed using SPSS 27 software. OriginPro 2022 SR1 was used for correlation analysis and principal components analysis. Bonferroni’s test was performed to determine significant differences between groups. The results were presented as mean ± standard deviation (SD), and a significance level of p < 0.05 was applied, all raw data has been added in Supplementary Table S1.

3. Results

3.1. Differences in Fruit Weight, Rind Hardness, and TSS Content among Different Ploidy Levels of Watermelon

As shown in Figure 4, the weight of watermelon fruits increased consistently as they matured. A rapid increase in weight was observed during the early stage of fruit development, followed by a slower increase in the later stage. Significant differences in fruit weight between watermelons with different ploidy levels were only observed in the late stage of fruit development. The weight of tetraploid watermelons was significantly lower (2.53 ± 0.51 kg) than that of diploid (3.5 ± 0.69 kg) and triploid (3.53 ± 0.25 kg) watermelons.
The hardness of the watermelon rind remained relatively constant during fruit development, except for a sharp increase during the ripening stage. The hardness of the ripe watermelon rind increased by 19.6%, 29.9%, and 29.0% compared to that of young fruits (8 DAP). At the maturity stage, the hardness of the watermelon rind of the triploid and tetraploid watermelons was significantly higher than that of the diploid watermelons by 14.9% and 17.0%, respectively.
The TSS content continued to accumulate as the watermelon fruits developed, reaching its maximum at maturity. The TSS content in the ripe flesh of the watermelon fruits was approximately 11.5%, and there were no significant differences in TSS content among the different ploidy levels.

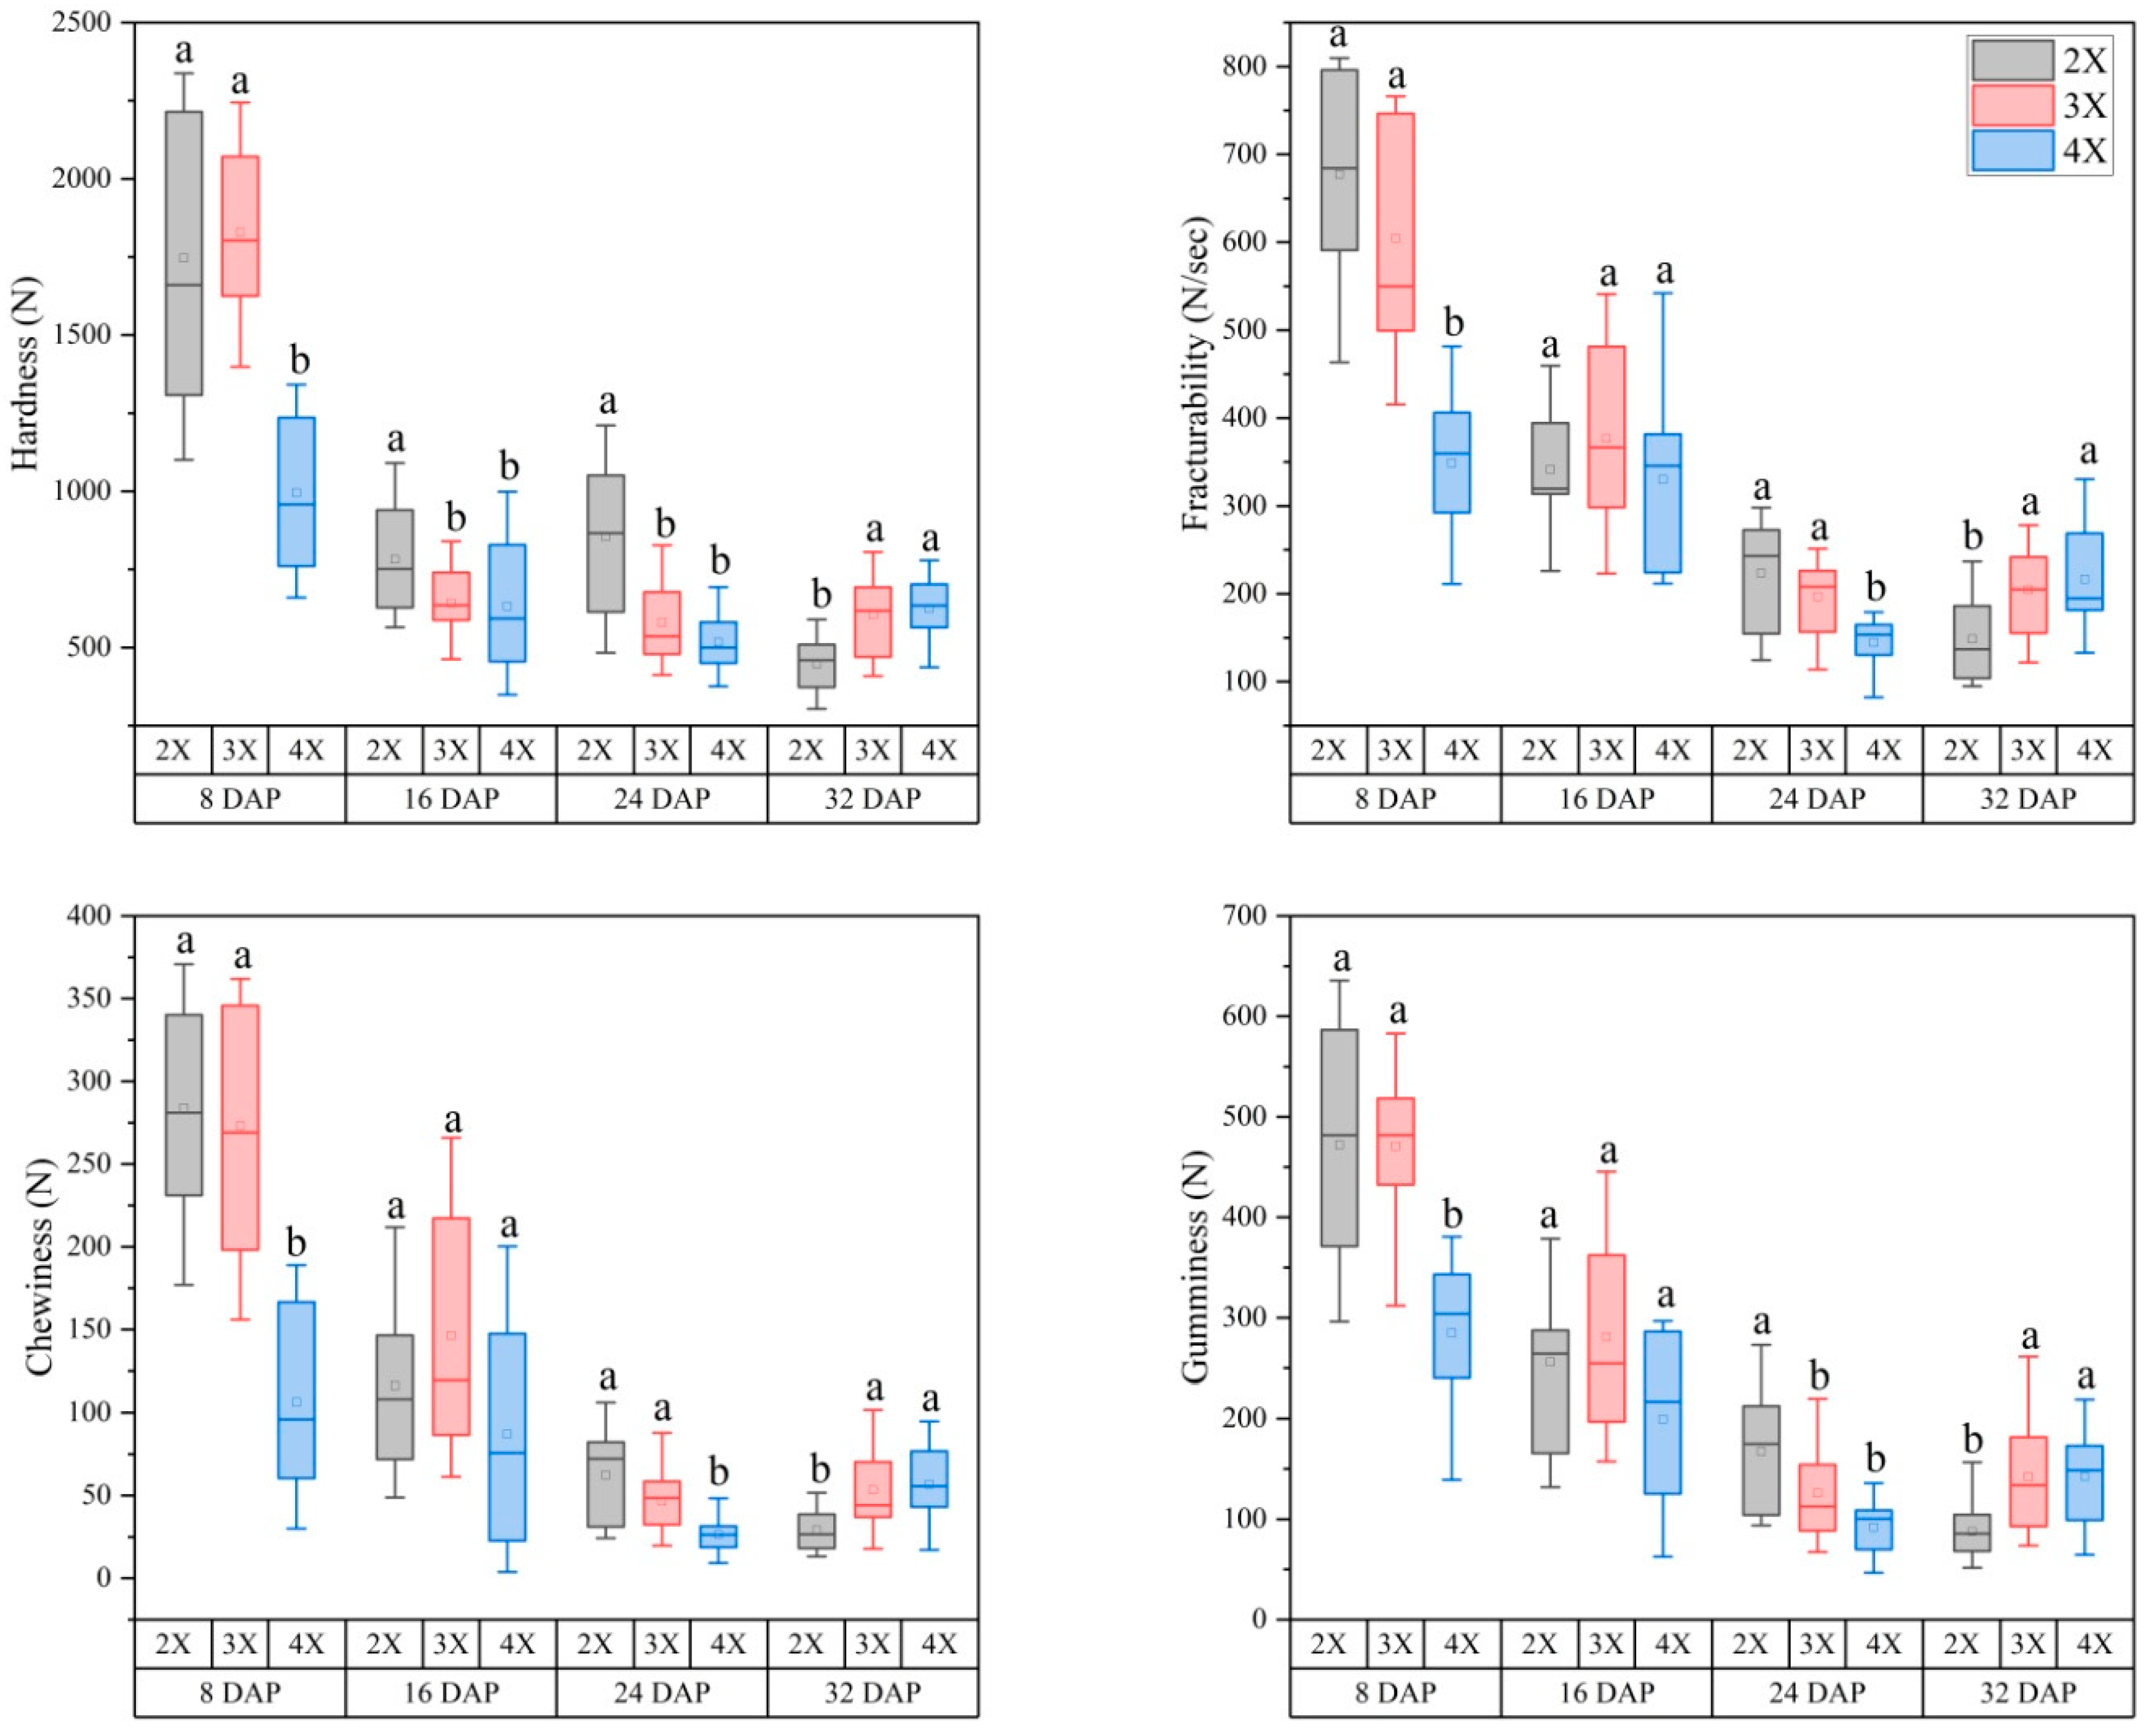
3.2. Variations in the Flesh Texture of Watermelon Fruits with Different Ploidy Levels

This study analyzed the texture parameters of watermelon flesh at different developmental stages. The parameters analyzed were hardness, fracturability, gumminess, and chewiness. The results showed that these parameters followed a similar trend to watermelon fruit development, with a sharp decrease from 8 DAP to 16 DAP, followed by a gradual decrease. However, there was a slightly different trend observed in the diploids compared to the polyploids. The four parameters consistently decreased with fruit development in the diploid, while in the polyploid, these values tended to increase slightly at 32 DAP.
When comparing the four parameters at different ploidy levels, it was found that the values of the four parameters in the tetraploid watermelon fruits were significantly lower than those in the diploid and triploid at 8 DAP. However, the differences were not significant at 16 DAP. At 24 DAP, the values of the four parameters were significantly lower in the polyploids than in the diploids. In 32 DAP fruits, the polyploids exhibited significantly higher values for the four parameters than the diploid (refer to Figure 5).

3.3. Variations in the Polysaccharide Content within the Cell Walls of Watermelon Flesh across Different Ploidy Levels

To investigate the effect of polysaccharide fractions on the texture of watermelon flesh, the contents of crude fiber, cellulose, hemicellulose, lignin, protopectin, and soluble pectin were compared in the pulp of watermelon of different ploidy levels. During the early stage of fruit development, from 8 to 24 DAP, cellulose, hemicellulose, and lignin decreased significantly by 91.0%, 92.7%, and 99.7%, respectively. Subsequently, during fruit maturity, there was a slight increase in their content. The hemicellulose content decreased gradually with fruit development, with a 60.7% decrease from 8 to 32 DAP. The protopectin content remained stable during the early stages of fruit development but decreased sharply by 45.4% from 4.32 g/kg at 24 DAP to 2.36 g/kg at 32 DAP. The soluble pectin content was negligible at 8 and 16 days, measuring only 0.027 g/kg and 0.046 g/kg, respectively. At 24 DAP, the content increased significantly by approximately five times, and at 32 DAP, it continued to increase by nearly two times. Surprisingly, the contents of all these polysaccharide substances were not significantly different between the different ploidy levels of watermelon pulp, as shown in Figure 6.

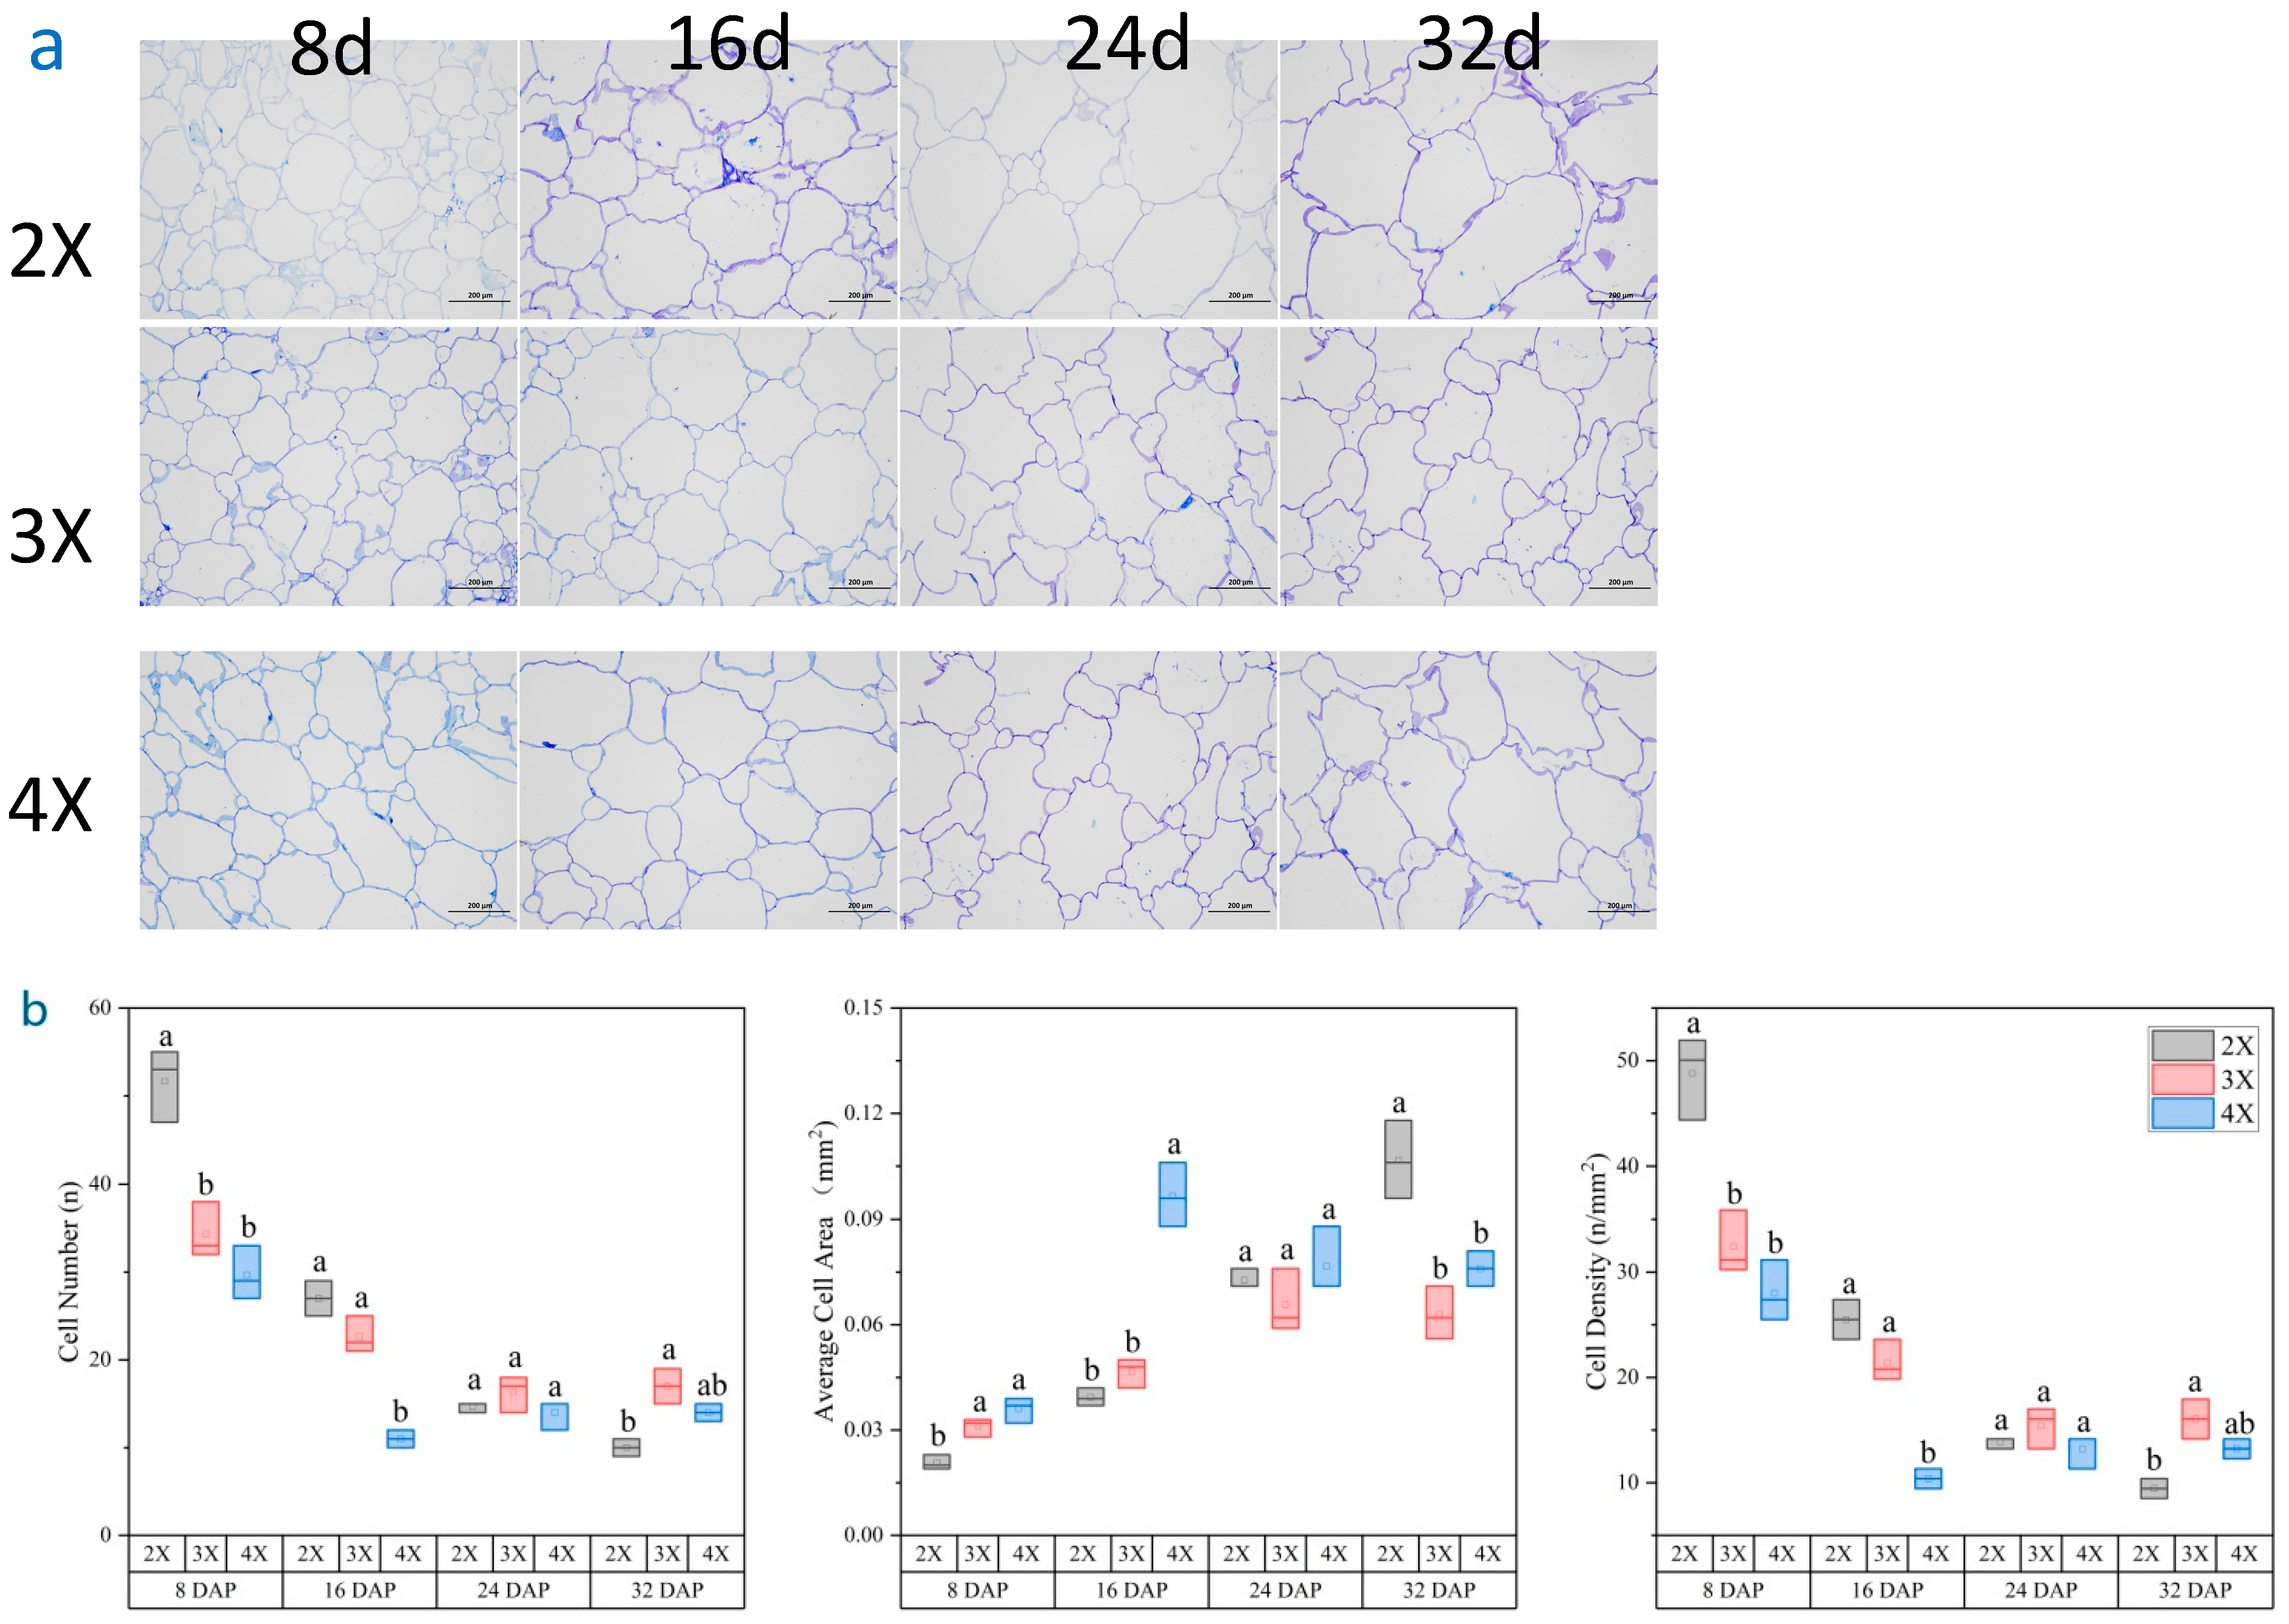
3.4. Differences in the Cellular Structure of Watermelon Flesh of Different Ploidy Levels

The dimensions and organization of fruit flesh cells can provide insights into variations in fruit texture. Observations and measurements were conducted on flesh cells of watermelons with different ploidy levels across distinct developmental stages. Figure 7a illustrates the cellular microstructure of the fruit flesh, revealing that during the initial 8 DAP of fruit development, the flesh cells exhibited a tight arrangement and regular shapes. However, during the fruit’s development, the flesh cells enlarged progressively, resulting in a loose arrangement, irregular shapes, and increased intercellular gaps.
The results of the study show that the area of watermelon flesh cells increased gradually as they developed, while the number and density of flesh cells per unit area decreased. At the 8 DAP, the cell number and density of the 2× cells were significantly higher than those of 3× and 4× cells per unit area of the same view field (100×). No significant difference in flesh cell size was observed among ploidy levels at 16 DAP and 24 DAP. Likewise, the variation in size of flesh cells between ploidy levels remained insignificant at 16 DAP and 24 DAP. However, at 34 DAP, during fruit development and maturation, there was a significant increase in the number and density of flesh cells with 3× and 4× compared to those with 2×. Notably, the average cell area exhibited an opposite trend to that of cell number and density (refer to Figure 7b).

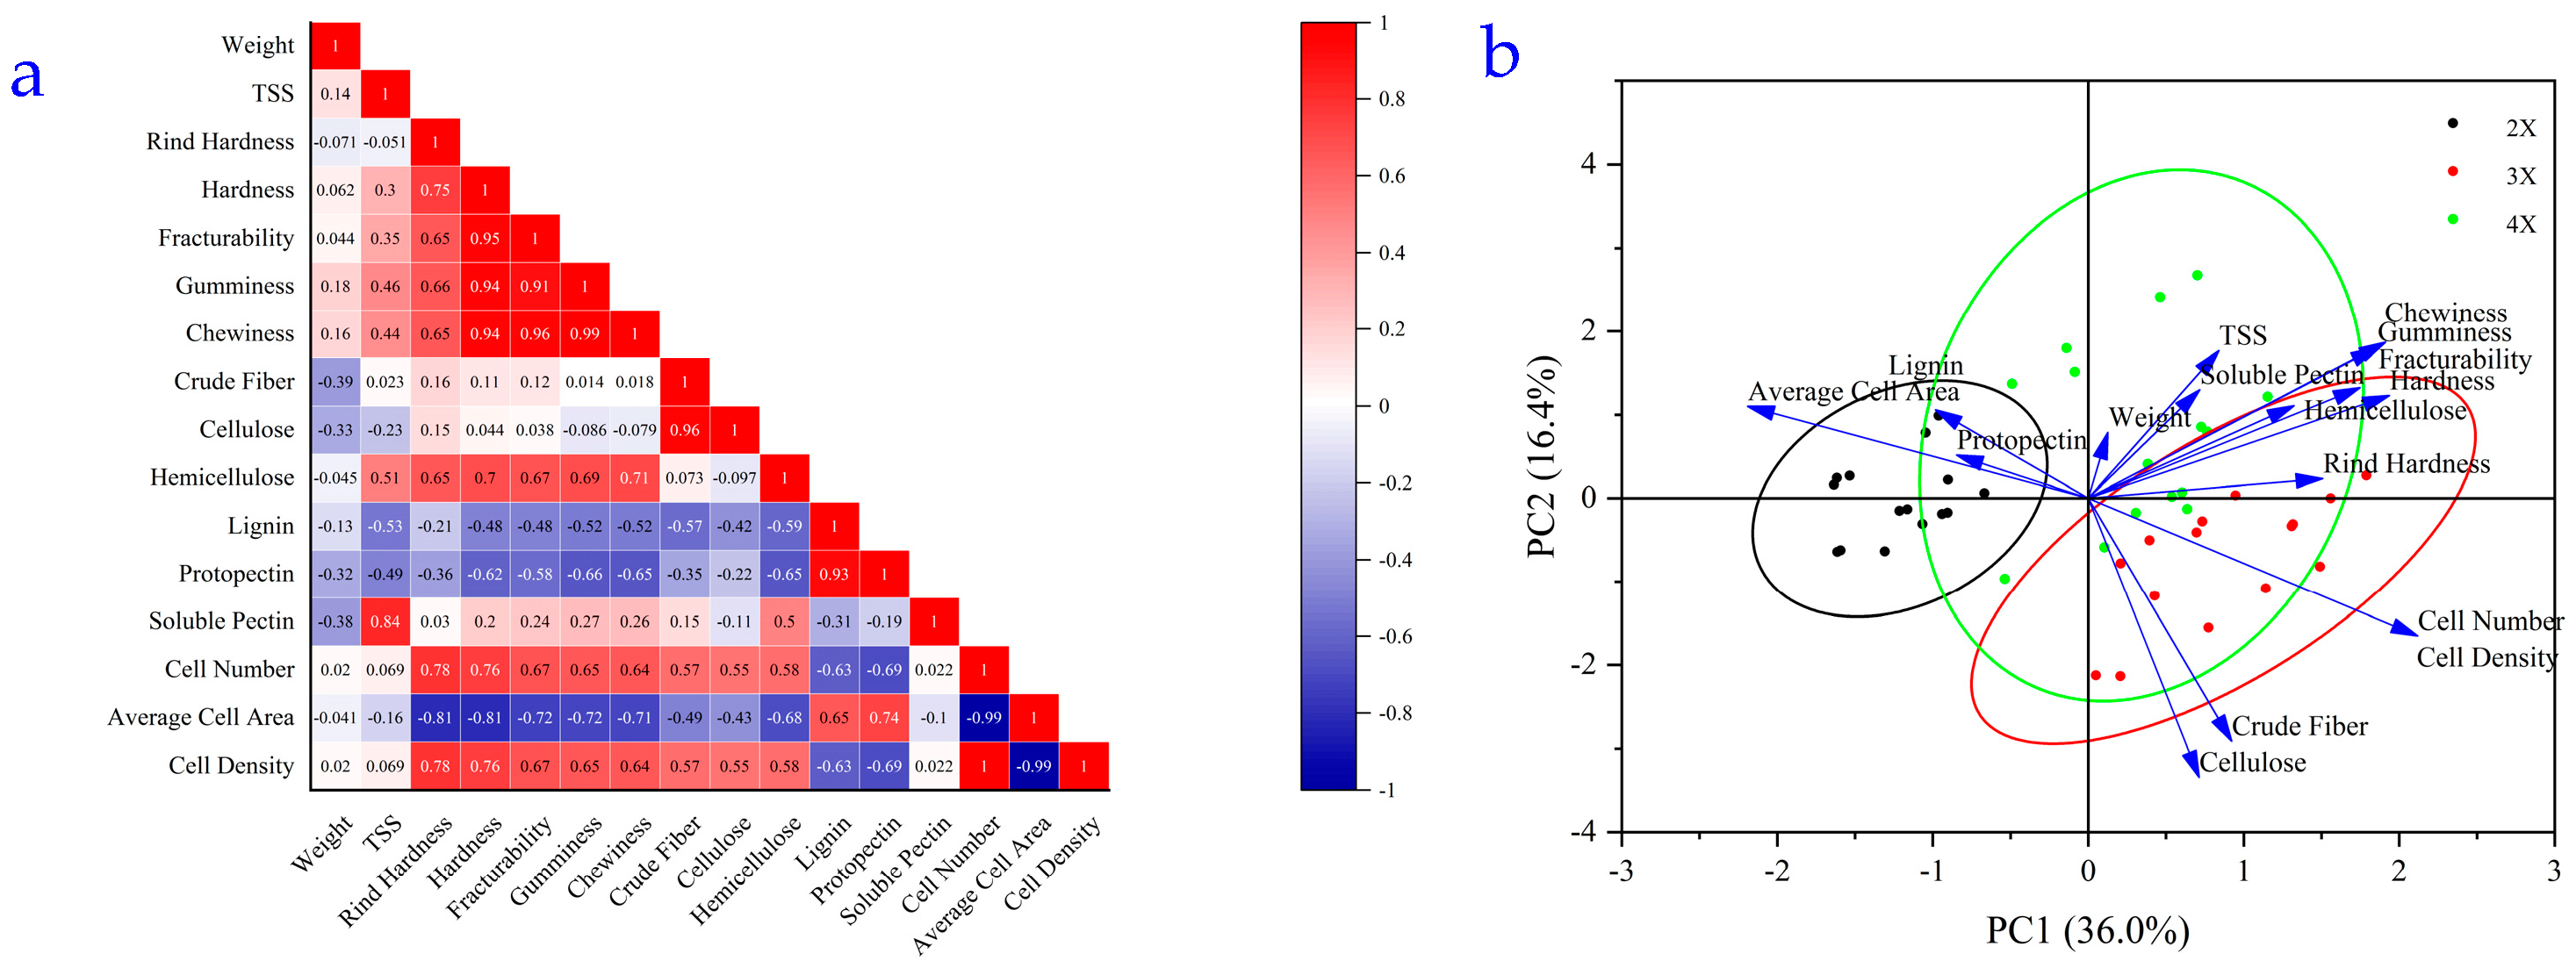
3.5. Correlation Analysis of Flesh Texture with Cell Microstructure and Cell Wall Polysaccharide Content in Watermelon at Different Ploidy Levels

The correlation analysis revealed that soluble pectin content had a strong positive correlation with TSS content (r = 0.84). Additionally, hardness showed a strong positive correlation with fracturability (r = 0.95), gumminess (r = 0.94), and chewiness (r = 0.94), while exhibiting a strong negative correlation with an average cell area (r = −0.81). Furthermore, the correlation coefficients between cellulose content and crude fiber content, protopectin content, and lignin content, as well as cell number and mean cell area, were highly correlated at 0.96%, 0.93, and −0.99, respectively (refer to Figure 8a). Based on this, it can be concluded that the texture of watermelon flesh is significantly influenced by cell area and cell density.
The principal component analysis (PCA) revealed that PC1 accounted for approximately 36.0% of the variance, while PC2 accounted for approximately 16.4% of the variance. Based on the scatter distances in the PCA plot, it is evident that there was less variation among the samples within the group, suggesting that the experiment was reproducible and reliable. Notably, the diploids were distinguishable from each other, whereas there was considerable overlap between the triploids and tetraploids (refer to Figure 8b).

4. Discussion

4.1. Differences in Fruit Weight and TSS Content among Different Ploidy Levels of Watermelon

Fruit weight and TSS content are important agronomic traits in horticultural plants. According to Henderson and Angela, autotetraploid watermelon fruits were significantly lighter in weight than triploid fruits [33,34]. This finding is consistent with our results, which showed that the fruit weights of different ploidies differed significantly only at later stages of fruit development. An artificially induced polyploidy can increase enzyme content and activity in plants by increasing gene copy number. This can contribute to the enhancement of secondary metabolites [35]. Henderson concluded that tetraploid watermelon fruits generally have a higher TSS content than triploid fruits [34]. Meanwhile, Perkins-Veazie observed that triploid watermelon varieties typically have slightly higher TSS content than diploid varieties [36]. Our results indicate that there is no significant difference in TSS content between watermelon flesh of different ploidy levels. This is consistent with the findings of Davis et al. [33]. Therefore, the variation in TSS at different ploidy levels may be influenced by genotype, whereas watermelon TSS is less affected by ploidy level.

4.2. Differences in Texture among Different Ploidy Levels of Watermelon

The texture of watermelon flesh has a significant impact on the taste, flavor, and shelf life of ripe watermelon [12]. The TPA analysis of the texture instrument is a testing method that simulates the biting action of the human mouth to evaluate the texture characteristics of a product. It quantifies various textural parameters in a single experimental process with objectivity, greatly improving the authenticity, reliability, and repeatability of the data [21,27]. At present, TPA analysis methods have been used in the study of pulp textures, such as apple [26], melon [27], pear [28], peach [29], and tomato [30]. Previous research on watermelon flesh texture has primarily focused on flesh hardness, with relatively few studies on other textural indices. Additionally, the texture of the watermelon flesh of different ploidy levels has not been extensively studied. In this study, it was observed that the flesh texture parameters gradually decreased as the watermelon fruits developed. This finding is consistent with the results of Anees et al. (2021) and Sun et al. (2020) who studied the hardness of watermelon flesh [22,23]. In the ripening-stage flesh, the texture parameters of the 2× flesh were all significantly lower than those of the 3× and 4× flesh, which is consistent with the phenotypic differences that our oral cavity usually feeds us when we normally eat watermelon. Polyploid watermelon is not as tender as diploid watermelon, and chewing the flesh of polyploid watermelon requires the exertion of a greater force. Therefore, the texture parameter of watermelon flesh can maximally simulate the sensation of the human oral cavity and be used to distinguish the differences in texture of the flesh of different ploidy levels.

4.3. Differences in the Content of Cell Wall Polysaccharides in the Fruit Flesh among Different Ploidy Levels of Watermelon

Fruit softening is linked to the remodeling of cell walls, specifically the breakdown of pectin and other polysaccharides [14]. As fruit develops, the levels of crude fiber, cellulose, hemicellulose, lignin, and protopectin decrease in flesh cells, while the level of soluble pectin content gradually increases [19,21,23]. Our results similarly validated this trend. Our analysis did not reveal any significant differences in the quantity of cell wall polysaccharides in watermelon flesh with varying ploidy levels. Therefore, we hypothesize that changes in watermelon ploidy levels do not significantly impact the cell wall polysaccharide content in the fruit’s flesh.

4.4. Differences in Cell Structure among Different Ploidy Levels of Watermelon

The texture of a fruit is affected by the size and arrangement of its cells [25]. During fruit development, the cell architecture, arrangement, and size of hard-flesh watermelon differed from soft-flesh watermelon, which could be the reason for the high and low flesh firmness [22]. Our study found that as watermelon flesh developed, the cells became larger and more loosely arranged, and the cell interstitial space also became larger, and at the same time, the texture parameters of watermelon fruit showed a tendency to decrease, and such results were also confirmed in apple [37], watermelon [23], melon [18], kiwifruit [38], and other fruits. The most common effect of polyploidy in plants is an increase in cell size due to the larger number of gene copies, known as the ‘gigas’ effect [6]. Additionally, the chloroplast count in stomatal defense cells increases with plant ploidy. For instance, in watermelon leaves, the ratio of chloroplast count in defense cells was 4:3:2 for homotetraploid, triploid, and diploid leaves, respectively [39]. The ripe-flesh cells of polyploid (3×, 4×) watermelons were observed to be significantly more than those of diploid watermelons across various ploidies. This finding is consistent with the trend of texture parameters. Through correlation and PCA analyses, we found a strong correlation between the size of the flesh cells and the texture parameters of the flesh, and, therefore, we can conclude that the differences in the texture of the flesh of watermelon fruits with different ploidy levels were caused by the size and arrangement of the flesh cells.

5. Conclusions

In conclusion, our results demonstrated that the flesh texture parameters and soluble pectin content of the flesh cell wall gradually declined with the watermelon fruit development. The 2× watermelon fruits displayed a considerably lower rind hardness, as well as reduced flesh texture and cell density compared to the 3× and 4× fruits. The differences in fruit texture among different ploidy watermelons were attributed to cell size and arrangement.

Supplementary Materials

The following are available online at https://www.mdpi.com/article/10.3390/horticulturae10020112/s1, Figure S1: The ploidy level of the experimental materials was determined using the chromosome observation method; Table S1: Summary table of raw data for all experiments.

Author Contributions

Conceptualization, X.L. (Xuqiang Lu), W.L. and H.Z.; methodology, H.Z. and X.L. (Xuqiang Lu); software, X.L. (Xuqiang Lu); validation, H.Z.; formal analysis, X.L. (Xiaowen Luo); investigation, D.Y., W.K., J.Z. and L.Y.; resources, N.H.; data curation, X.L. (Xuqiang Lu); writing—original draft preparation, X.L. (Xuqiang Lu); writing—review and editing, W.L., H.Z. and M.A.; visualization, X.L. (Xuqiang Lu); supervision, W.L. and H.Z.; project administration, W.L. and H.Z.; funding acquisition, W.L. and X.L. (Xuqiang Lu). All authors have read and agreed to the published version of the manuscript.

Funding

This research was funded by Agricultural Science and Technology Innovation Program (CAAS-ASTIP-2021-ZFRI), the China Agriculture Research System of MOF and MARA (CARS-25-03), and the Major Science and Technology Projects of Henan Province (221100110400).

Data Availability Statement

Data are contained within the article. Additional data can be obtained by contacting the corresponding author of the article.

Conflicts of Interest

The authors declare no conflicts of interest.

References

  1. Guo, S.; Zhao, S.; Sun, H.; Wang, X.; Wu, S.; Lin, T.; Ren, Y.; Gao, L.; Deng, Y.; Zhang, J.; et al. Resequencing of 414 cultivated and wild watermelon accessions identifies selection for fruit quality traits. Nat. Genet. 2019, 51, 1616–1623. [Google Scholar] [CrossRef] [PubMed]
  2. FAO. Available online: https://faostat.fao.org/ (accessed on 12 June 2023).
  3. Bharadwaj, D.N. Polyploidy in Crop Improvement and Evolution. In Plant Biology and Biotechnology; Bahadur, B., Venkat Rajam, M., Sahijram, L., Krishnamurthy, K.V., Eds.; Springer: New Delhi, India, 2015; pp. 619–638. [Google Scholar]
  4. Soltis, P.S.; Marchant, D.B.; Van de Peer, Y.; Soltis, D.E. Polyploidy and genome evolution in plants. Curr. Opin. Plant Biol. 2015, 35, 119–125. [Google Scholar] [CrossRef]
  5. Madlung, A. Polyploidy and its effect on evolutionary success: Old questions revisited with new tools. Heredity 2013, 110, 99–104. [Google Scholar] [CrossRef] [PubMed]
  6. Sattler, M.C.; Carvalho, C.R.; Clarindo, W.R. The polyploidy and its key role in plant breeding. Planta 2015, 243, 281–296. [Google Scholar] [CrossRef] [PubMed]
  7. Cohen, H.; Fait, A.; Tel-Zur, N. Morphological, cytological and metabolic consequences of autopolyploidization in Hylocereus (Cactaceae) species. BMC Plant Biol. 2013, 13, 173. [Google Scholar] [CrossRef] [PubMed]
  8. Saminathan, T.; Nimmakayala, P.; Manohar, S.; Malkaram, S.; Almeida, A.; Cantrell, R.; Tomason, Y.; Abburi, L.; Rahman, M.A.; Vajja, V.G.; et al. Differential gene expression and alternative splicing between diploid and tetraploid watermelon. J. Exp. Bot. 2015, 66, 1369–1385. [Google Scholar] [CrossRef]
  9. Zhang, N.; Bao, Y.N.; Xie, Z.L.; Huang, X.; Sun, Y.H.; Feng, G.; Zeng, H.X.; Ren, J.; Li, Y.H.; Xiong, J.S.; et al. Efficient Characterization of Tetraploid Watermelon. Plants 2019, 8, 419. [Google Scholar] [CrossRef]
  10. Contador, L.; Shinya, P.; Infante, R. Texture phenotyping in fresh fleshy fruit. Sci. Hortic. 2015, 193, 40–46. [Google Scholar] [CrossRef]
  11. Predieri, S.; Ragazzini, P.; Rondelli, R. Sensory evaluation and peach fruit quality. Acta Hortic. 2006, 713, 429–434. [Google Scholar] [CrossRef]
  12. Risse, L.A.; Brecht, J.K.; Sargent, S.A.; Locascio, S.J.; Crall, J.M.; Elmstrom, G.W.; Maynard, D.N. Storage Characteristics of Small Watermelon Cultivars. J. Am. Soc. Hortic. Sci. 1990, 115, 440–443. [Google Scholar] [CrossRef]
  13. Caffall, K.H.; Mohnen, D. The structure, function, and biosynthesis of plant cell wall pectic polysaccharides. Carbohydr. Res. 2009, 344, 1879–1900. [Google Scholar] [CrossRef] [PubMed]
  14. Zhang, B.C.; Gao, Y.H.; Zhang, L.J.; Zhou, Y.H. The plant cell wall: Biosynthesis, construction, and functions. J. Integr. Plant Biol. 2021, 63, 251–272. [Google Scholar] [CrossRef] [PubMed]
  15. Ng, J.K.T.; Schröder, R.; Sutherland, P.W.; Hallett, I.C.; Hall, M.I.; Prakash, R.; Smith, B.G.; Melton, L.D.; Johnston, J.W. Cell wall structures leading to cultivar differences in softening rates develop early during apple (Malus × domestica) fruit growth. BMC Plant Biol. 2013, 13, 183. [Google Scholar] [CrossRef] [PubMed]
  16. Jia, K.A.; Wang, W.; Zhang, Q.; Jia, W.S. Cell Wall Integrity Signaling in Fruit Ripening. Int. J. Mol. Sci. 2023, 24, 4054. [Google Scholar] [CrossRef] [PubMed]
  17. Brummell, D.A. Cell wall metabolism during maturation, ripening and senescence of peach fruit. J. Exp. Bot. 2004, 55, 2029–2039. [Google Scholar] [CrossRef] [PubMed]
  18. Zhang, W.D.; Guo, M.R.; Yang, W.T.; Liu, Y.X.; Wang, Y.; Chen, G.G. The Role of Cell Wall Polysaccharides Disassembly and Enzyme Activity Changes in the Softening Process of Hami melon (L.). Foods 2022, 11, 841. [Google Scholar] [CrossRef] [PubMed]
  19. Soteriou, G.A.; Siomos, A.S.; Gerasopoulos, D.; Rouphael, Y.; Georgiadou, S.; Kyriacou, M.C. Biochemical and histological contributions to textural changes in watermelon fruit modulated by grafting. Food Chem. 2017, 237, 133–140. [Google Scholar] [CrossRef]
  20. Liao, N.; Hu, Z.; Li, Y.; Hao, J.; Chen, S.; Xue, Q.; Ma, Y.; Zhang, K.; Mahmoud, A.; Ali, A.; et al. Ethylene-responsive factor 4is associated with the desirable rind hardness trait conferring cracking resistance in fresh fruits of watermelon. Plant Biotechnol. J. 2019, 18, 1066–1077. [Google Scholar] [CrossRef]
  21. Gao, Y.; Guo, Y.; Su, Z.Y.; Yu, Y.; Zhu, Z.C.; Gao, P.; Wang, X.Z. Transcriptome analysis of genes related to fruit texture in watermelon. Sci. Hortic. 2020, 262, 109075. [Google Scholar] [CrossRef]
  22. Sun, L.; Zhang, Y.; Cui, H.; Zhang, L.; Sha, T.; Wang, C.; Fan, C.; Luan, F.; Wang, X. Linkage Mapping and Comparative Transcriptome Analysis of Firmness in Watermelon (Citrullus lanatus). Front. Plant Sci. 2020, 11, 831. [Google Scholar] [CrossRef]
  23. Anees, M.; Gao, L.; Umer, M.J.; Yuan, P.L.; Zhu, H.J.; Lu, X.Q.; He, N.; Gong, C.S.; Kaseb, M.O.; Zhao, S.J.; et al. Identification of Key Gene Networks Associated with Cell Wall Components Leading to Flesh Firmness in Watermelon. Front. Plant Sci. 2021, 12, 630243. [Google Scholar] [CrossRef] [PubMed]
  24. Anees, M.; Gao, L.; Gong, C.; Umer, M.J.; Yuan, P.; Zhu, H.; Lu, X.; He, N.; Kaseb, M.O.; Yang, D.; et al. Aux/IAA gene Cla004102, is involved in synergistic regulation of various endogenous hormones, regulating flesh firmness in watermelon. Sci. Hortic. 2023, 310, 111719. [Google Scholar] [CrossRef]
  25. Poles, L.; Gentile, A.; Giuffrida, A.; Valentini, L.; Endrizzi, I.; Aprea, E.; Gasperi, F.; Distefano, G.; Artioli, G.; La Malfa, S.; et al. Role of fruit flesh cell morphology and MdPG1 allelotype in influencing juiciness and texture properties in apple. Postharvest Biol. Technol. 2020, 164, 111161. [Google Scholar] [CrossRef]
  26. Kim, M.S.; Duizer, L.M.; Grygorczyk, A. Application of a texture analyzer friction rig to evaluate complex texture attributes in apples. Postharvest Biol. Technol. 2022, 186, 111820. [Google Scholar] [CrossRef]
  27. Bianchi, T.; Guerrero, L.; Gratacós-Cubarsí, M.; Claret, A.; Argyris, J.; Garcia-Mas, J.; Hortós, M. Textural properties of different melon (Cucumis melo L.) fruit types: Sensory and physical-chemical evaluation. Sci. Hortic. 2016, 201, 46–56. [Google Scholar] [CrossRef]
  28. Zhang, W.; Cui, D.; Ying, Y. Nondestructive measurement of pear texture by acoustic vibration method. Postharvest Biol. Technol. 2014, 96, 99–105. [Google Scholar] [CrossRef]
  29. Ciacciulli, A.; Cirilli, M.; Chiozzotto, R.; Attanasio, G.; Da Silva Linge, C.; Pacheco, I.; Rossini, L.; Bassi, D. Linkage and association mapping for the slow softening (SwS) trait in peach (P. persica L. Batsch) fruit. Tree Genet. Genomes 2018, 14, 93. [Google Scholar] [CrossRef]
  30. Pieniazek, F.; Messina, V. Texture and color analysis of freeze-dried potato (cv. Spunta) using instrumental and image analysis techniques. Int. J. Food Prop. 2016, 20, 1422–1431. [Google Scholar] [CrossRef]
  31. Zhu, H.; Zhao, S.; Lu, X.; He, N.; Gao, L.; Dou, J.; Bie, Z.; Liu, W. Genome duplication improves the resistance of watermelon root to salt stress. Plant Physiol. Biochem. 2018, 133, 11–21. [Google Scholar] [CrossRef]
  32. Oyeyinka, B.O.; Afolayan, A.J. Comparative Evaluation of the Nutritive, Mineral, and Antinutritive Composition of Musa sinensis L. (Banana) and Musa paradisiaca L. (Plantain) Fruit Compartments. Plants 2019, 8, 598. [Google Scholar] [CrossRef]
  33. Davis, A.; Webber, C.; Wenge, L.; Perkins, P.; Levi, A.; King, S. Watermelon Quality Traits as Affected by Ploidy. HortScience 2013, 48, 1113–1118. [Google Scholar] [CrossRef]
  34. Henderson, W. Effect of Cultivar, Polyploidy and “Reciprocal” Hybridization on Characters Important in Breeding Triploid Seedless Watermelon Hybrids1. J. Am. Soc. Hortic. Sci. 1977, 102, 293–297. [Google Scholar] [CrossRef]
  35. Mohammadi, V.; Talebi, S.; Ahmadnasab, M.; Mollahassanzadeh, H. The effect of induced polyploidy on phytochemistry, cellular organelles and the expression of genes involved in thymol and carvacrol biosynthetic pathway in thyme (Thymus vulgaris). Front. Plant Sci. 2023, 14, 1228844. [Google Scholar] [CrossRef] [PubMed]
  36. Perkins-Veazie, P.; Collins, J.K.; Davis, A.R.; Roberts, W. Carotenoid content of 50 watermelon cultivars. J. Agric. Food Chem. 2006, 54, 2593–2597. [Google Scholar] [CrossRef] [PubMed]
  37. Hou, J.; Sun, Y.; Chen, F.; Yu, L.; Mao, Q.; Wang, L.; Guo, X.; Liu, C. Analysis of microstructures and macrotextures for different apple cultivars based on parenchyma morphology. Microsc. Res. Tech. 2016, 79, 304–312. [Google Scholar] [CrossRef]
  38. Li, H.; Pidakala, P.; Billing, D.; Burdon, J. Kiwifruit firmness: Measurement by penetrometer and non-destructive devices. Postharvest Biol. Technol. 2016, 120, 127–137. [Google Scholar] [CrossRef]
  39. Ramsey, J.; Schemske, D.W. Pathways, Mechanisms, and Rates of Polyploid Formation in Flowering Plants. Annu. Rev. Ecol. Syst. 1998, 29, 467–501. [Google Scholar] [CrossRef]
Figure 1. The fruits of different ploidy watermelons. The 2×, 3×, and 4× represent diploids, triploids, and tetraploids, respectively.
Horticulturae 10 00112 g001
Figure 2. Five-point sampling site diagram for watermelon fruit texture determination, with A, B, C, D, and E representing the stalk end, flower scar end, sunny side, shady side, and center of the fruit, respectively.
Horticulturae 10 00112 g002
Figure 3. The texture curve of the TA.XT Plus Physical Property Analyzer. 1 represents the point at which the probe begins to contact the sample and generate force in the first circulating. 2 represents the highest point of the first peak. 3 represents the probe leaving the sample and the force ending in the first circulating. 4 represents that the probe starts to contact the sample and starts to generate force in the second circulating. 5 represents the highest point of the second peak. 6 represents the probe leaving the sample and the force ending in the second circulating.
Horticulturae 10 00112 g003
Figure 4. Watermelon fruit weight, TSS content, and rind hardness vary among different ploidy levels during different developmental stages. The 2×, 3×, and 4× represent diploid, triploid, and tetraploid, respectively. Also, 8 DAP, 16 DAP, 24 DAP, and 32 DAP represent 8, 16, 24, and 32 days after pollination, respectively. Letters a and b in the graphs indicate significance of differences at the p < 0.05 level. The fruit weight and TSS content values are the mean of three replicates, and the fruit rind hardness value is the mean of nine replicates.
Horticulturae 10 00112 g004
Figure 5. Watermelon flesh texture varies among different ploidy levels during different developmental stages. The 2×, 3×, and 4× represent diploid, triploid, and tetraploid, respectively. Then, 8 DAP, 16 DAP, 24 DAP, and 32 DAP represent 8, 16, 24, and 32 days after pollination, respectively. Letters a and b in the graphs indicate significance of differences at the p < 0.05 level. Each value is the mean of fifteen replicates.
Horticulturae 10 00112 g005
Figure 6. Variations in the polysaccharide content within the cell walls of watermelon flesh at different developmental stages across different ploidy levels. The 2×, 3×, and 4× represent diploid, triploid, and tetraploid, respectively. Then, 8 DAP, 16 DAP, 24 DAP, and 32 DAP represent 8, 16, 24, and 32 days after pollination, respectively. Letter a in the graphs indicates significance of differences at the p < 0.05 level. Each value is the mean of three replicates.
Horticulturae 10 00112 g006
Figure 7. (a) Observation on the microstructure of flesh cells at different developmental stages across different ploidy levels. (b) Variations in the cell number, average cell area, and cell density of watermelon flesh at different developmental stages across different ploidy levels. The 2×, 3×, and 4× represent diploid, triploid, and tetraploid, respectively. Then, 8 DAP, 16 DAP, 24 DAP, and 32 DAP represent 8, 16, 24, and 32 days after pollination, respectively. Letters a and b in the graphs indicate significance of differences at the p < 0.05 level. Each value is the mean of three replicates.
Horticulturae 10 00112 g007
Figure 8. (a) Correlation analysis heat map of flesh texture with cell microstructure and cell wall polysaccharide content in watermelon of different ploidy levels at 32 DAP. (b) Principal component analysis of watermelon flesh texture with cell microstructure and cell wall polysaccharide content. Different groups are circled with different colored solid coils accordingly. The 2×, 3×, and 4× represent diploid, triploid, and tetraploid, respectively.
Horticulturae 10 00112 g008
Disclaimer/Publisher’s Note: The statements, opinions and data contained in all publications are solely those of the individual author(s) and contributor(s) and not of MDPI and/or the editor(s). MDPI and/or the editor(s) disclaim responsibility for any injury to people or property resulting from any ideas, methods, instructions or products referred to in the content.

