Article

Evaluation of the Genome Size and Ploidy Level of Pears (Pyrus spp.) in Relation to Their Morphological Traits

by
Jonáš Fiala
,
Eliška Zezulová
and
Tomáš Nečas
*
Department of Fruit Science, Faculty of Horticulture in Lednice, Mendel University in Brno, 691 44 Lednice, Czech Republic
*
Author to whom correspondence should be addressed.
Horticulturae 2024, 10(12), 1241; https://doi.org/10.3390/horticulturae10121241
Submission received: 16 October 2024 / Revised: 19 November 2024 / Accepted: 19 November 2024 / Published: 22 November 2024
(This article belongs to the Section Genetics, Genomics, Breeding, and Biotechnology (G2B2))

Abstract

:
In this study, 53 pear genotypes were evaluated, including 19 Asian varieties, 7 botanical species and 13 new interspecific hybrids. The ploidy level and nuclear DNA content were determined by flow cytometry. In addition, the morphological traits and their possible correlations with the genome size were analyzed. One triploid genotype was found. The Asian varieties had a lower average genome size (553.4 Mbp) than the European varieties (564.1 Mbp). The average nuclear DNA content was 1.14 pg/2C for the diploid genotypes and 1.77 pg/2C DNA for the triploids. The Asian varieties had significantly larger leaves than the European ones. Pyrus calleryana had the smallest flowers and P. Caucasica the largest, but the varieties showed no significant differences in flower size. The pollen grain size ranged from 37.7 to 59.0 μm. However, there were no significant correlations between the genotype groups or genome sizes. The Asian cultivars had, on average, smaller stomata (28.4 μm) than the European cultivars (31.6 μm). The largest stomata size was measured for the triploid genotypes (37.9 μm). There was a positive correlation between the genome size and stomatal length and a negative correlation between the genome size and leaf length, leaf width and flower diameter.

1. Introduction

Pears are categorized into two main groups: European pears and Asian pears. European pears, represented by Pyrus communis, are naturally found not only in Europe but also in North Africa, Asia Minor, Iran, Central Asia and Afghanistan. Asian pears are further divided into Japanese pears (Pyrus pyrifolia, also known as Pyrus serotina), which are widespread from East Asia to Japan, Chinese pears (P. bretschneideri) and Ussurian pears (Pyrus ussuriensis). While Ussurian pears have worse fruit quality, they excel in other aspects, such as deep root system formation, high frost resistance and scab resistance. Assessing morphological diversity among these species is crucial for breeding programs, managing genetic resources, protecting cultivars and enhancing commercial pear production [1,2].
In recent years, flow cytometry has become a highly popular method for effectively obtaining information about chromosome ploidy and the plant genome size. The study of the ploidy and size of a nuclear genome is often the point of interest to many breeders, as it provides information on the evolutionary relationships between the species or varieties of the studied plants [3]. The obtained information serves to streamline the breeding process itself and the subsequent selection of new varieties [4]. The genome size of individual species varies depending on the climatic conditions, altitude, temperature, precipitation, geographical location, etc. [5].
Thanks to a combination of favorable properties, pears could be popular plants in the field of landscaping. In this case, the development of infertile cultivars would be desirable. Triploid breeding is one way to develop seedless cultivars for many crops. The progeny of triploid mothers are predominantly abnormal aneuploids with lower vitality and fertility. These facts provide the basis for the creation of new infertile flowering pears with ornamental and landscaping potential which will not be self-sowing and become wild [6].
Most pears have 2n = 34 chromosomes, except for Pyrus armeniacifolia, some clones of Pyrus xerophila, certain varieties derived from Pyrus × sinkiangensis and Pyrus pyrifolia and certain Chinese white pears with a higher degree of ploidy [2]. In previous studies, the ploidy level and genome size were assessed in several Asian pear varieties in Xinjiang using flow cytometry [7]. Most of the cultivars were diploid with a genome size ranging from 480.95 ± 16.24 to 599.14 ± 38.36 Mbp. Furthermore, five polyploids were found—‘Yilikamut’, ‘Kotoamut’, ‘Aiwenqieke’, ‘Heisuanli’ and ‘Sha01’—which may be the basis for further studies and breeding [7].
In addition, among the known pear triploids [8], which are formed by fertilizing an unreduced egg of a diploid mother with a haploid male gamete, triploid mothers would, according to evidence from apple trees, produce predominantly aneuploids. It is possible that in European pears, triploids are less common in wild strains (P. communis subsp. pyraster). In Asian pears (P. pyrifolia, P. bretschneideri, etc.), the lack of information on triploids suggests that these species either do not produce unreduced gametes or do so extremely rarely [8,9].
There are currently not many studies dealing with the ploidy and genome size of the genus Pyrus, and their results often diverge. A proper methodology is essential to achieving relevant results. The aim of our study was to optimize the method of ploidy and genome size analysis through flow cytometry, clarify the differences in the obtained data among European and Asian pears, find possible polyploids in the evaluated assortment and describe the possible relationships between the genome size, ploidy level and selected morphological traits.

2. Materials and Methods

In total, 33 pear (Pyrus spp.) cultivars, 13 new hybrids (P. communis × P. pyrifolia) and 7 botanical species growing in the orchard of the Faculty of Horticulture, Lednice, Mendel University in Brno were analyzed in this study. The pear cultivars were divided into three different groups based on their origin: Asian (19), European (10) and interspecific (4) (Table 1).

2.1. Flow Cytometry

The samples subjected to genome size and ploidy level measurements via flow cytometry were analyzed in CyFlow Space-3 (Sysmex CZ s.r.o., Brno, Czech Republic) equipped with a 532 nm laser. Healthy, intact and fully developed leaves of individual varieties and hybrids were collected and analyzed immediately. All cultivars were analyzed in three samples, which consisted of 10 leaves gathered from 5 different trees, using a 05-5027 CyStain PI OxProtect kit (Sysmex CZ s.r.o., Brno, Czech Republic). According to the protocol of the producer, the analyzed sample consisted of approximately 0.5 cm2 of the leaf tissue of a sample and the internal standard of Raphanus sativus ‘Saxa’ (2C = 1.11 pg DNA) [10].
The leaf tissues were homogenized together in 0.5 mL of Nuclei Extraction Buffer (Sysmex CZ s.r.o., Brno, Czech Republic). (pH = 1.8) using a razor blade. After 60 s, the prepared sample was filtered through a 50 μm membrane (Partec CellTrics®, Munster, Germany) and supplemented with 2 mL of Staining Buffer solution (pH = 7.5), which contained 12 μL of propidium iodide (PI) and 6 μL RNase (Sysmex CZ s.r.o., Brno, Czech Republic). The samples were analyzed after 30 min of incubation in the dark at room temperature. The speed of flow was held at up to 50 particles per second, and at least 5000 particles were analyzed for each sample. The coefficient of variation (CV) values lower than 5% were considered reliable data. Ploidy was estimated using the same species with a known ploidy level as reference and calculated according to the following formula: sample ploidy level = peak position sample/peak position reference × ploidy level reference. The 2C nuclear DNA content was calculated according to the following formula: 2C (pg) = DNA content of standard × (mean fluorescence value of sample/mean fluorescence value of standard) [11]. The mean nuclear DNA content was calculated for each cultivar from three replications. The results were also expressed as monoploid genome sizes (1Cx) (i.e., DNA content of the non-replicated base set of chromosomes) according to following formula: 1Cx = 2C genome size/ploidy level × 0.978 × 10⁹ bp [12].
However, the chosen standard, Raphanus sativus, proved unsuitable for analyzing the genome size of diploid pears because its genome is similar in size compared with that of pears and their peaks overlapped each other on the histogram. An alternative standard triploid pear cultivar Pyrus communis ‘Alexander Lucas’ was selected and standardized through repeated (10 fold) analysis against the Raphanus sativus standard. The genome size of Pyrus communis ‘Alexander Lucas’ was determined to be 2C = 1.75 pg DNA, and this variety was subsequently used as a reference sample to determine the genome size of the other samples (Figure 1).

2.2. Morphological Research

The evaluation of the selected cultivars and hybrids was focused on the measurement of the size of the flowers, leaves and their petioles and microscopic measurement of the size of the stomata and pollen grains. For each measurement, we collected and evaluated 10 flowers and leaves gathered from 5 trees per each genotype.
The analyzed leaves were collected fresh, fully grown, undamaged and without any abnormalities. The size measurement was performed using millimeter paper and a sliding scale. The size of the flowers was evaluated with fresh, fully opened flowers with powdering pollen grains. The collected pollen was measured in a Petri dish using a ZEISS V12 microscope, ZEN 2.6 blue edition software (ZEISS AG, Oberkochen, Germany). The settings were as follows: pixel size = 2.2 × 2.2 μm, objective = 1.5× and magnification = 150×. The microscope was calibrated with a Carl Zeiss™ Microscope Stage Micrometer calibration slide.
The software STATISTICA 12 (TIBCO software Inc., Palo Alto, CA, USA) was used for statistical analysis. The data were averaged, and the standard deviation was expressed. In the results, the analysis of variance (ANOVA) and correlation analysis are provided.

3. Results and Discussion

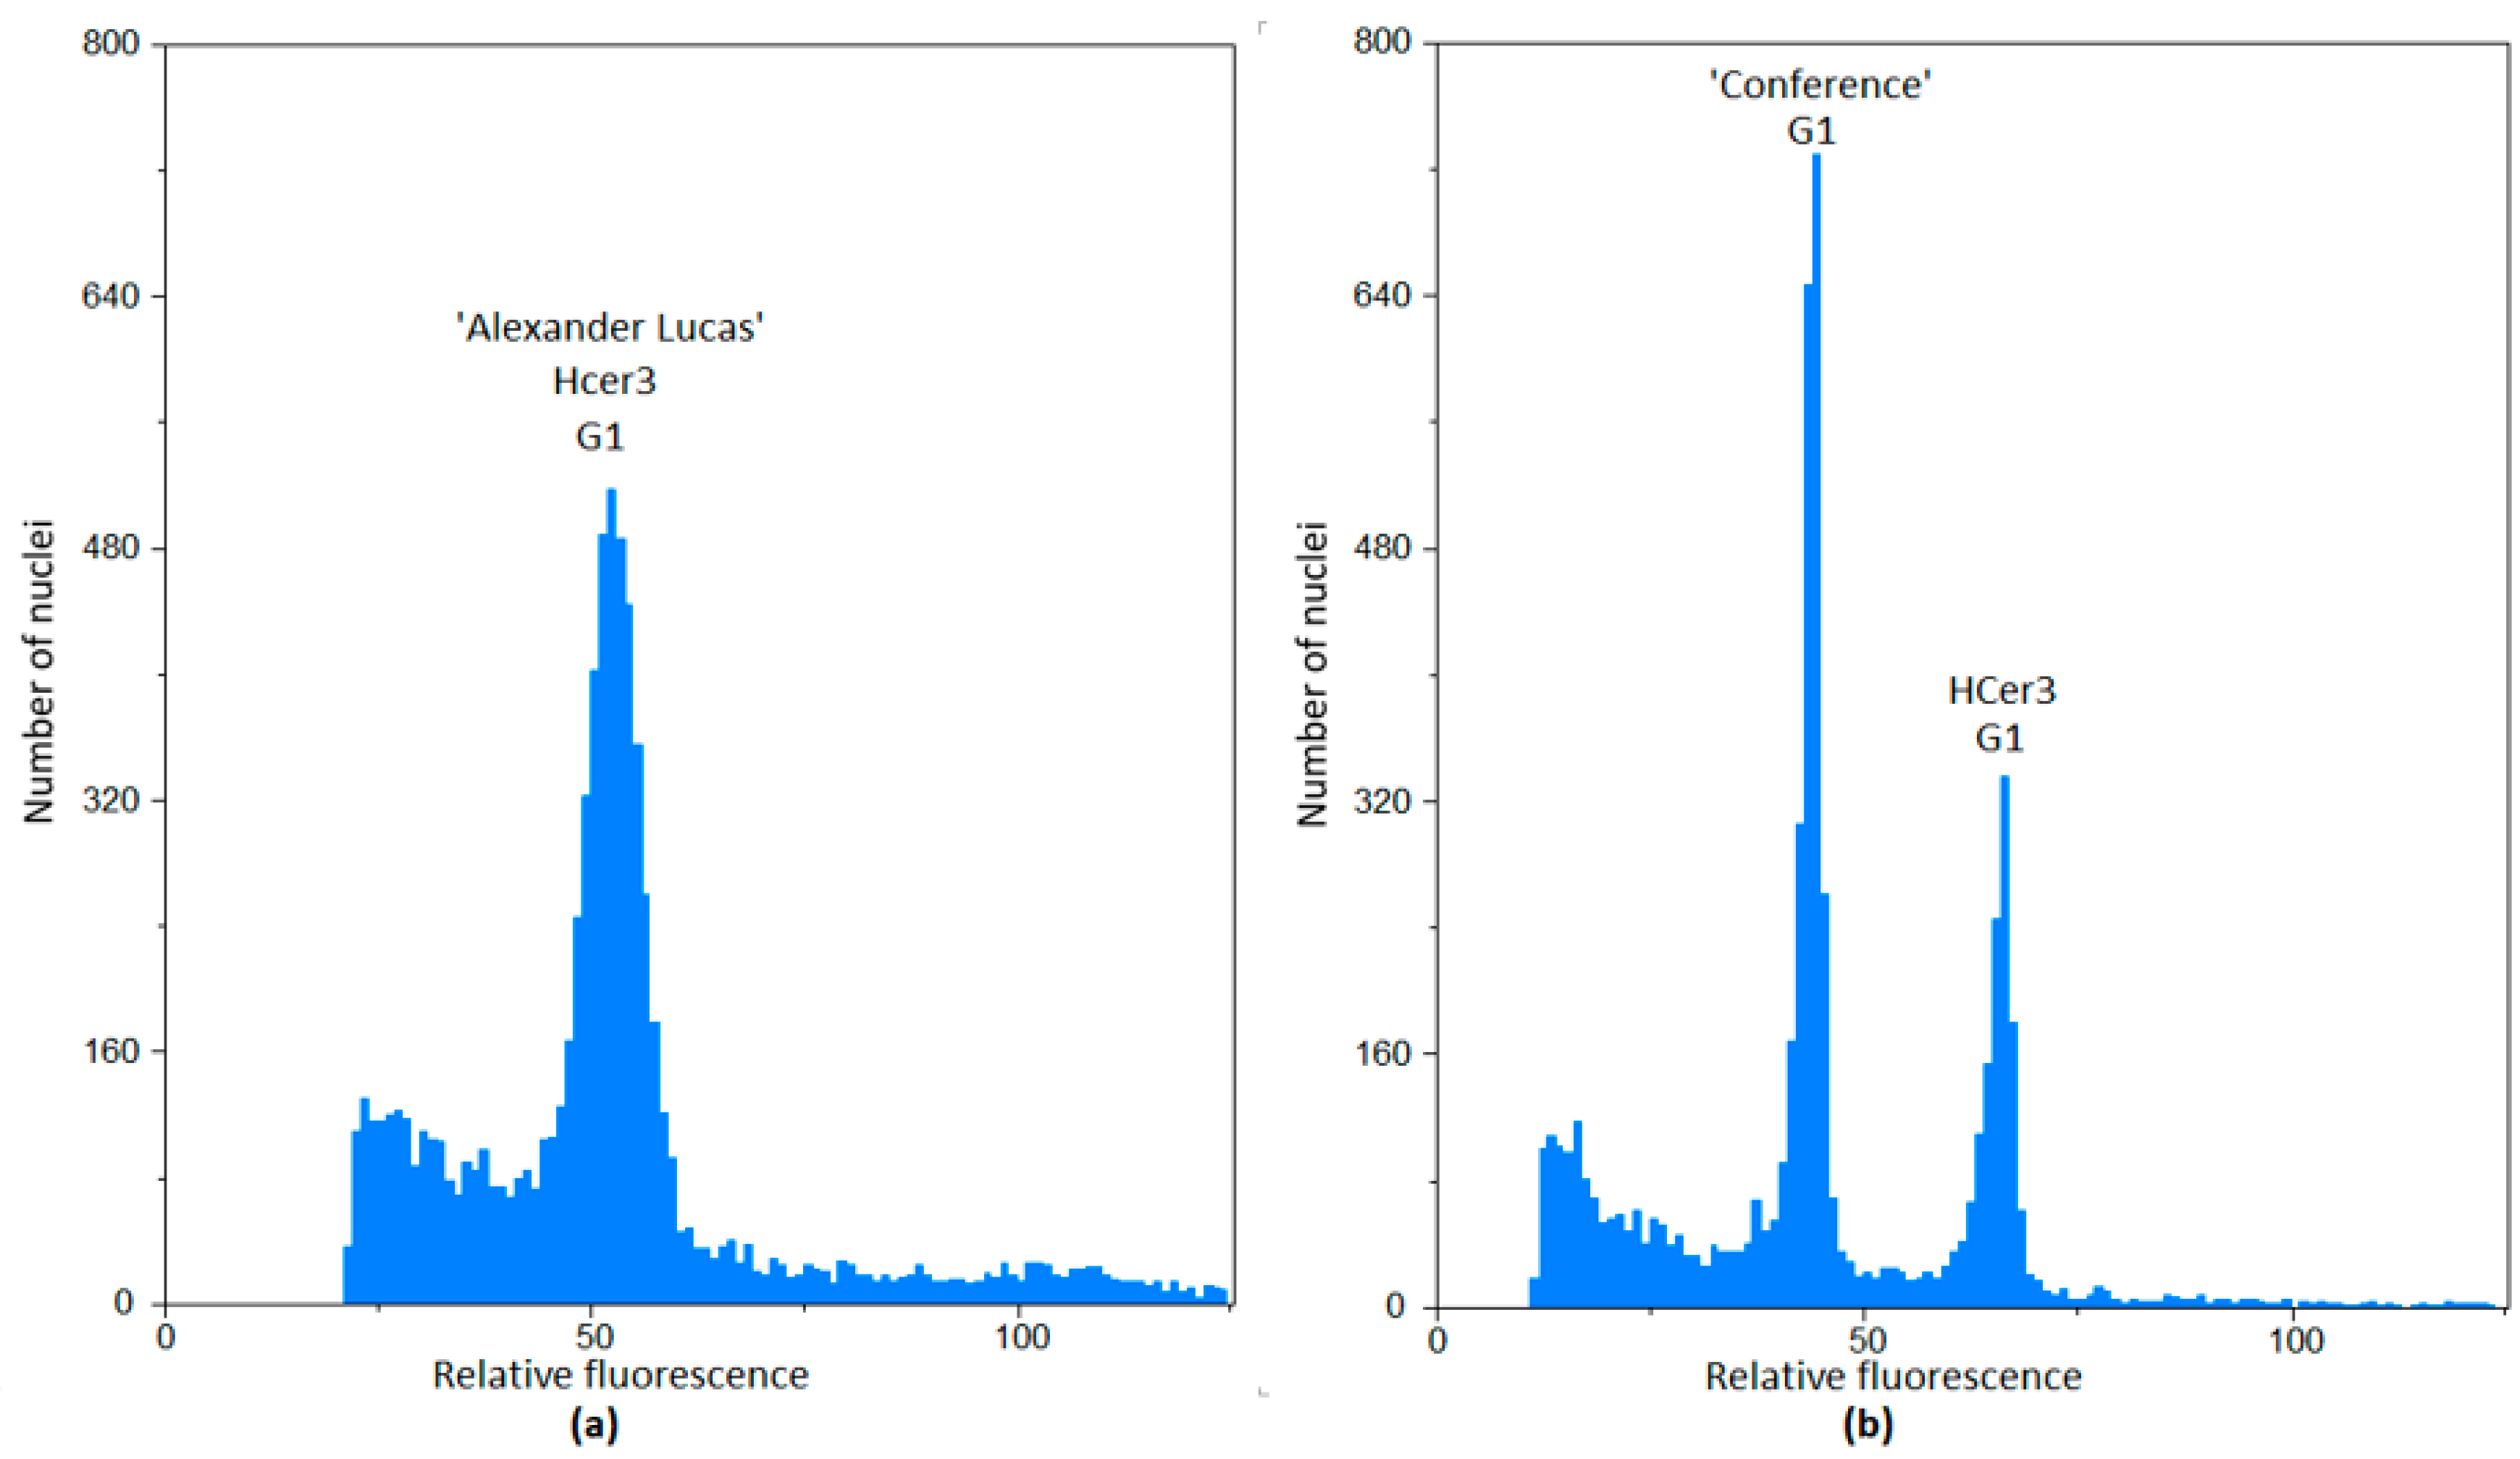
Except for ‘Alexander Lucas’, which was used as a reference sample, and one European-type hybrid, all genotypes analyzed were diploids. The discovery of the triploid genotype Hcer3 is illustrated in Figure 2.
All genotypes were divided, according to their origin, into three groups: European, Asian and interspecific. Their mean genome size values and selected morphological parameters were then compared, and they are presented along with the botanical species values in Table 2.
The individual values of all evaluated traits for each variety or new hybrid are given in Table 3.
The ANOVA showed statistically significant results (p < 0.05) in determining the variation in genotype origin (Asian, European and interspecific) in terms of genome size, leaf width and length, petiole length and stomatal size. According to the results for the flower size and pollen grain size, the different groups were not statistically distinguished.

3.1. The Relative Genome Size

In this study, the average genome size of the botanical species ranged from 542.5 ± 0.6 Mbp (1.11 pg/2C) in P. caucasica to 571.7 ± 0.9 Mbp (1.17 pg/2C) in P. betulifolia. According to [1], the genome size of P. betulifolia is 684.6 Mbp, while that of P. bretschneiderii is 782.4 Mbp and that of P. calleryana is 772.62 Mbp. In the present study, the values were much lower. According to [13], the genome size of P. calleryana is 1.26 pg/2C, which is equivalent to 616.14 Mbp, while in [14], it was reported to be 1.24 pg/2C (606.4 Mbp). In our study, P. calleryana had 1.13 pg/2C (554.2 Mbp).
The mean relative genome size of the diploid pear genotypes was 556.8 ± 0.9 Mbp (1.14 ± 0.012 pg/2C), while the mean relative genome size for the triploids was 576.8 ± 2.9 Mbp (1.77 ± 0.0002 pg/2C). These values are like those presented in [6] for diploid pears (1.25 ± 0.05 pg) and triploids (1.88 ± 0.12 pg).
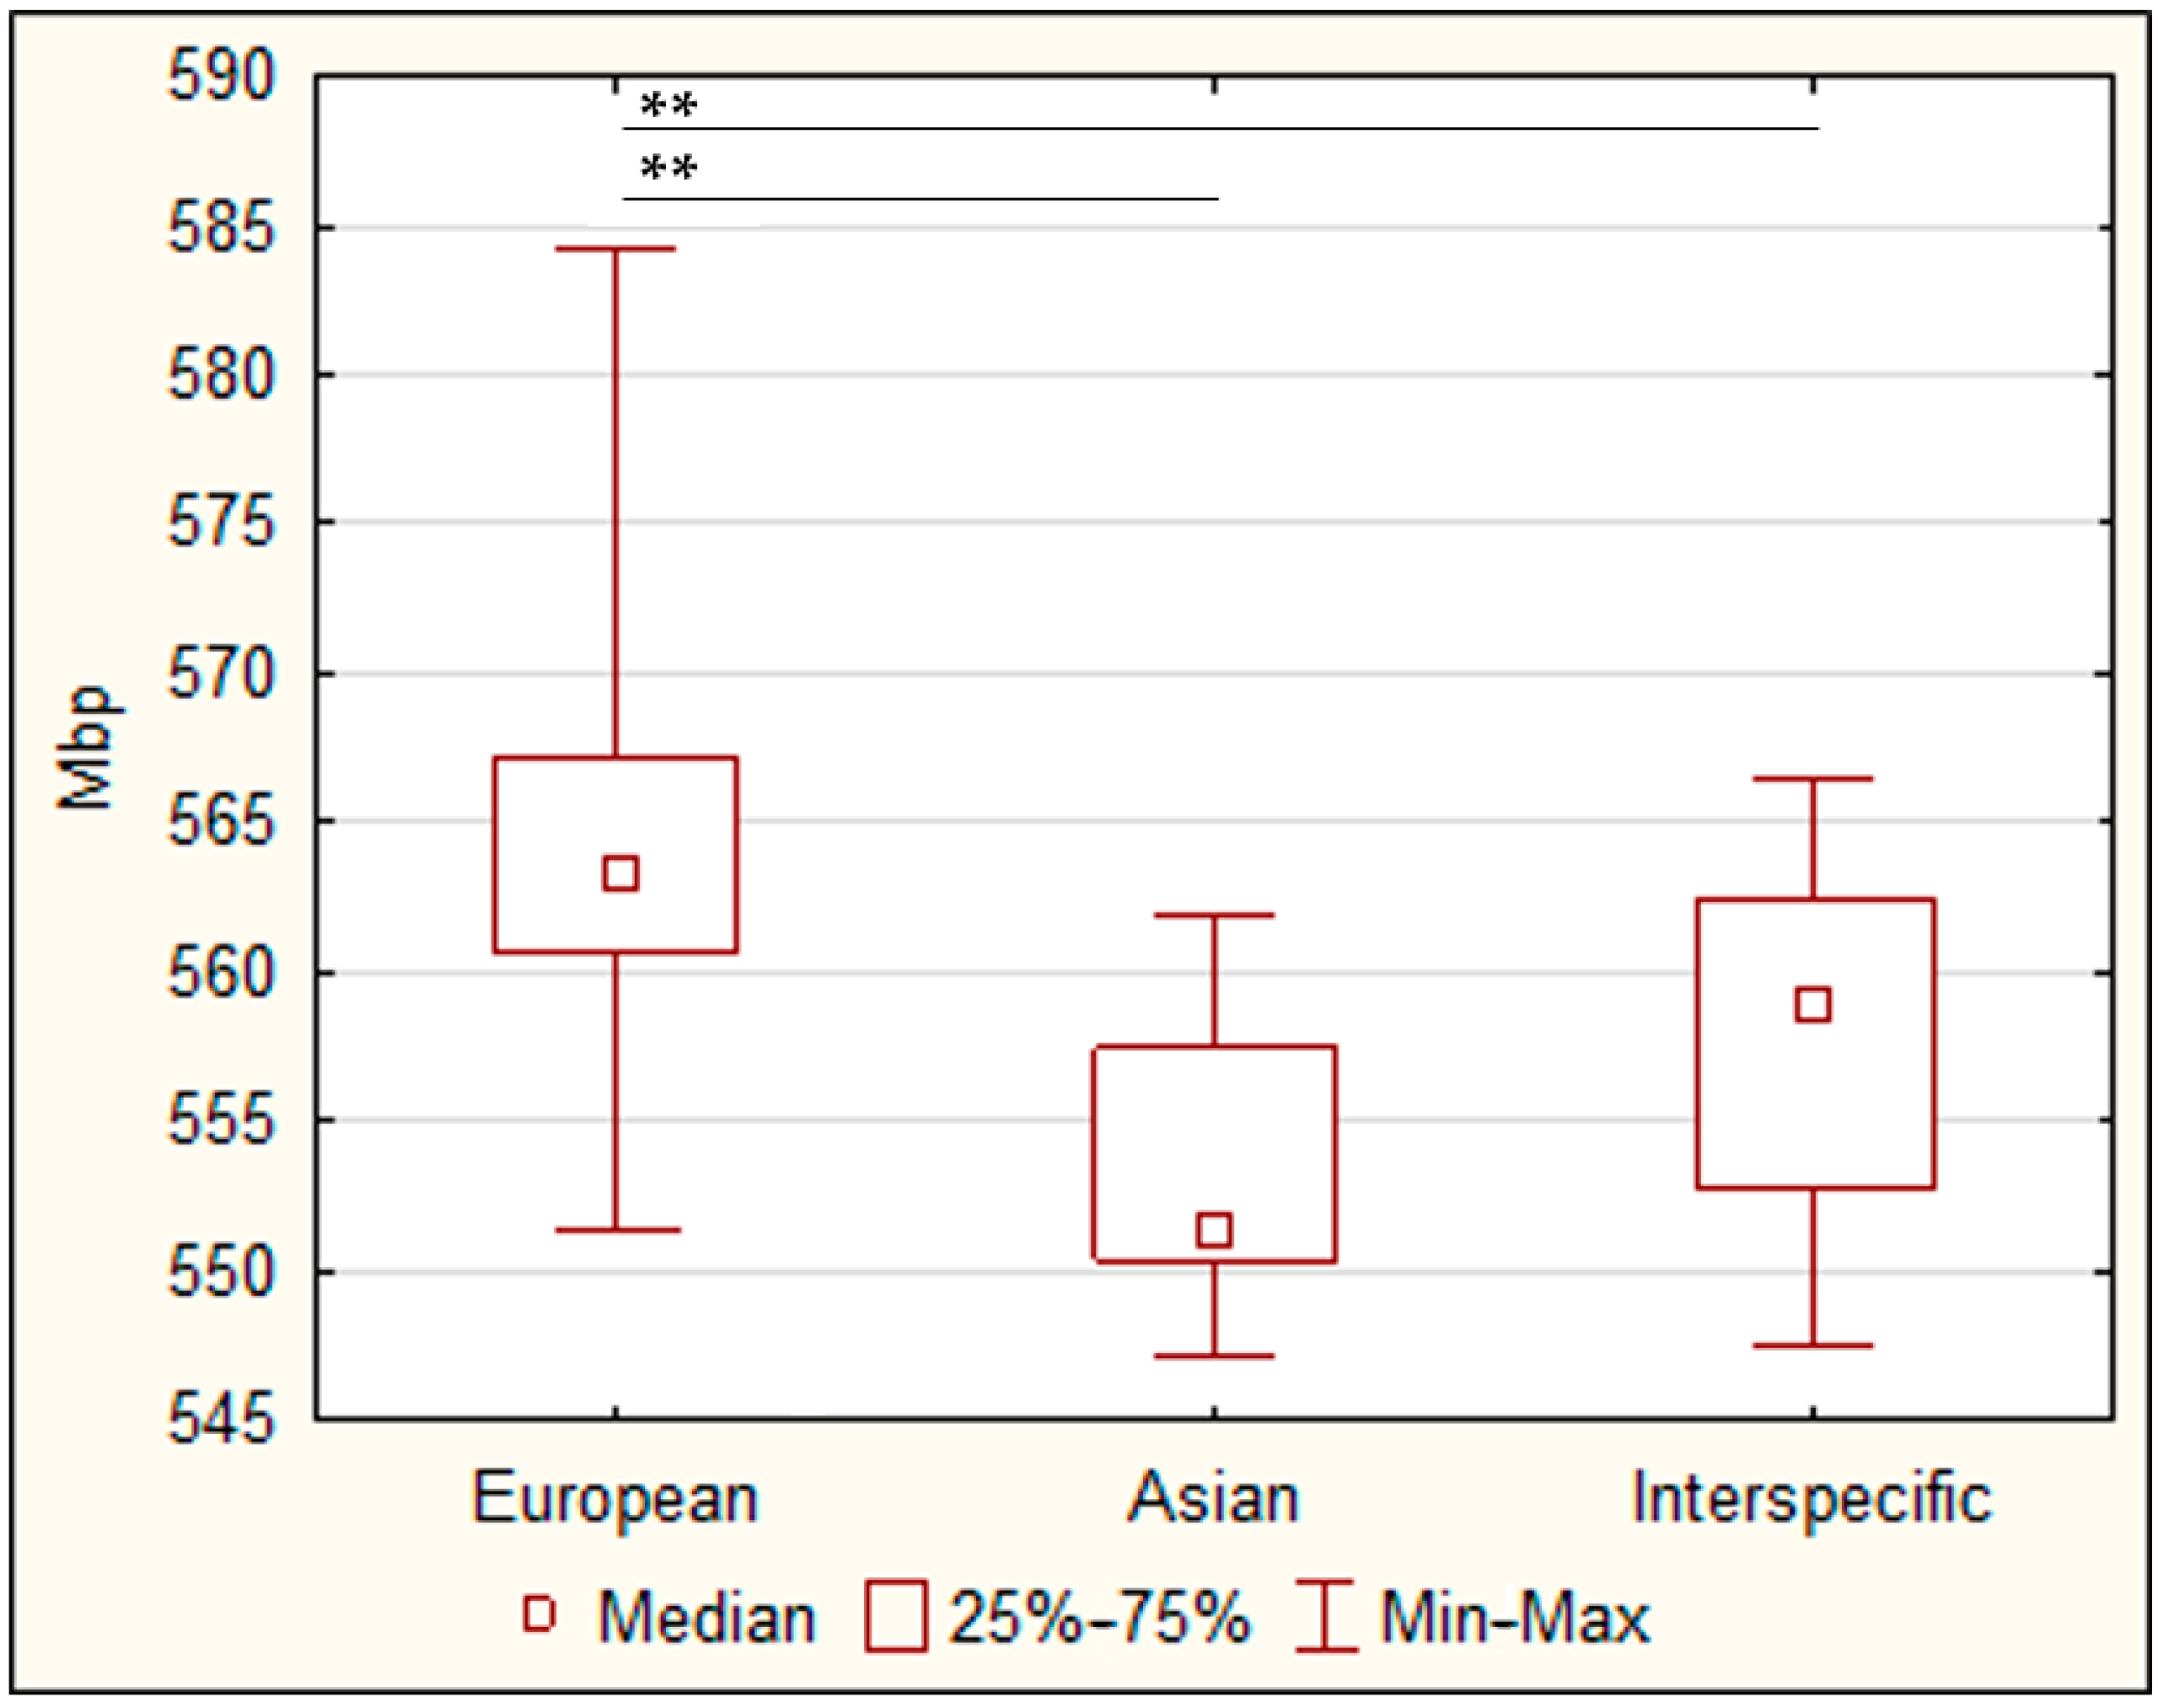
There was a significant diference between the European and Asian genotype groups (Figure 3). The average genome size of the European group (564.1 ± 2.2 Mbp) was similar to that of the genome of Pyrus communis (559.1 ± 1.5 Mbp), from which it was derived. Similarly, the genome size of the Asian genotypes (553.4 ± 0.9 Mbp) corresponded to the genome size of Pyrus pyrifolia 553.1 ± 2.2 Mbp. The genome size of the interspecific hybrids (557.5 ± 1.7 Mbp) was significantly different from that of the European genotypes but not the Asian group.
The biggest genome sizes of the selected varieties were found for ‘Alexander Lucas’ (569.4 ± 2.9 Mbp) and the diploid ‘Karina’ (567.2 ± 1 Mbp). Overall, the higher values reached only two European-type hybrids: triploid Hcer3 (584.2 ± 3 Mbp) and diploid Hcer4 (567.5 ± 0.4 Mbp).The smallest genome size was found for the Asian ‘Xin Gao’ (547.1 ± 1.7 Mbp).
In our study, similar genome size values were evaluated for the selected varieties. According to Wu et al. (2012) [15], the genome size of ‘Dangshanshuli’ is 527 Mbp, and this variety was used by Niu et al. (2020) [7] as an internal reference with the genome size 527.00 ± 62.99 Mbp (1.08 ± 0.13 pg/2C). In our study, a similar value for the genome size was found (557.7 ± 0.4 Mbp).
Niu et al. (2020) [7] reported the relative genome size of ‘Yali’ to be 550.96 ± 16.89 Mbp, while in our study, it was 551.3 ± 0.3 Mbp. The genome size of ‘Nanguoli’ in their study was 567.94 ± 44.4 Mbp, while in our study, it was 562.0 ± 1.2 Mbp.
When evaluating the genetic diversity and ploidy of pears (Pyrus spp.) using molecular profiles, flow cytometry and leaf size measurement, 15% of the pears in the entire set of 80 unique individuals were identified as triploids [8]. In this study, only 3 of the 166 analyzed Asian genotypes were triploids (1.8%). However, many authors did not mention the presence of triploids in their studies.

3.2. Selected Morphological Characteristics

Overall, the Asian varieties achieved higher average values in the selected morphological signs than the European ones. The only exception was the stomata length, which was longest for the European pears. The values of the interspecific hybrids varied between the Asian and European cultivars.

3.2.1. Size of the Leaves

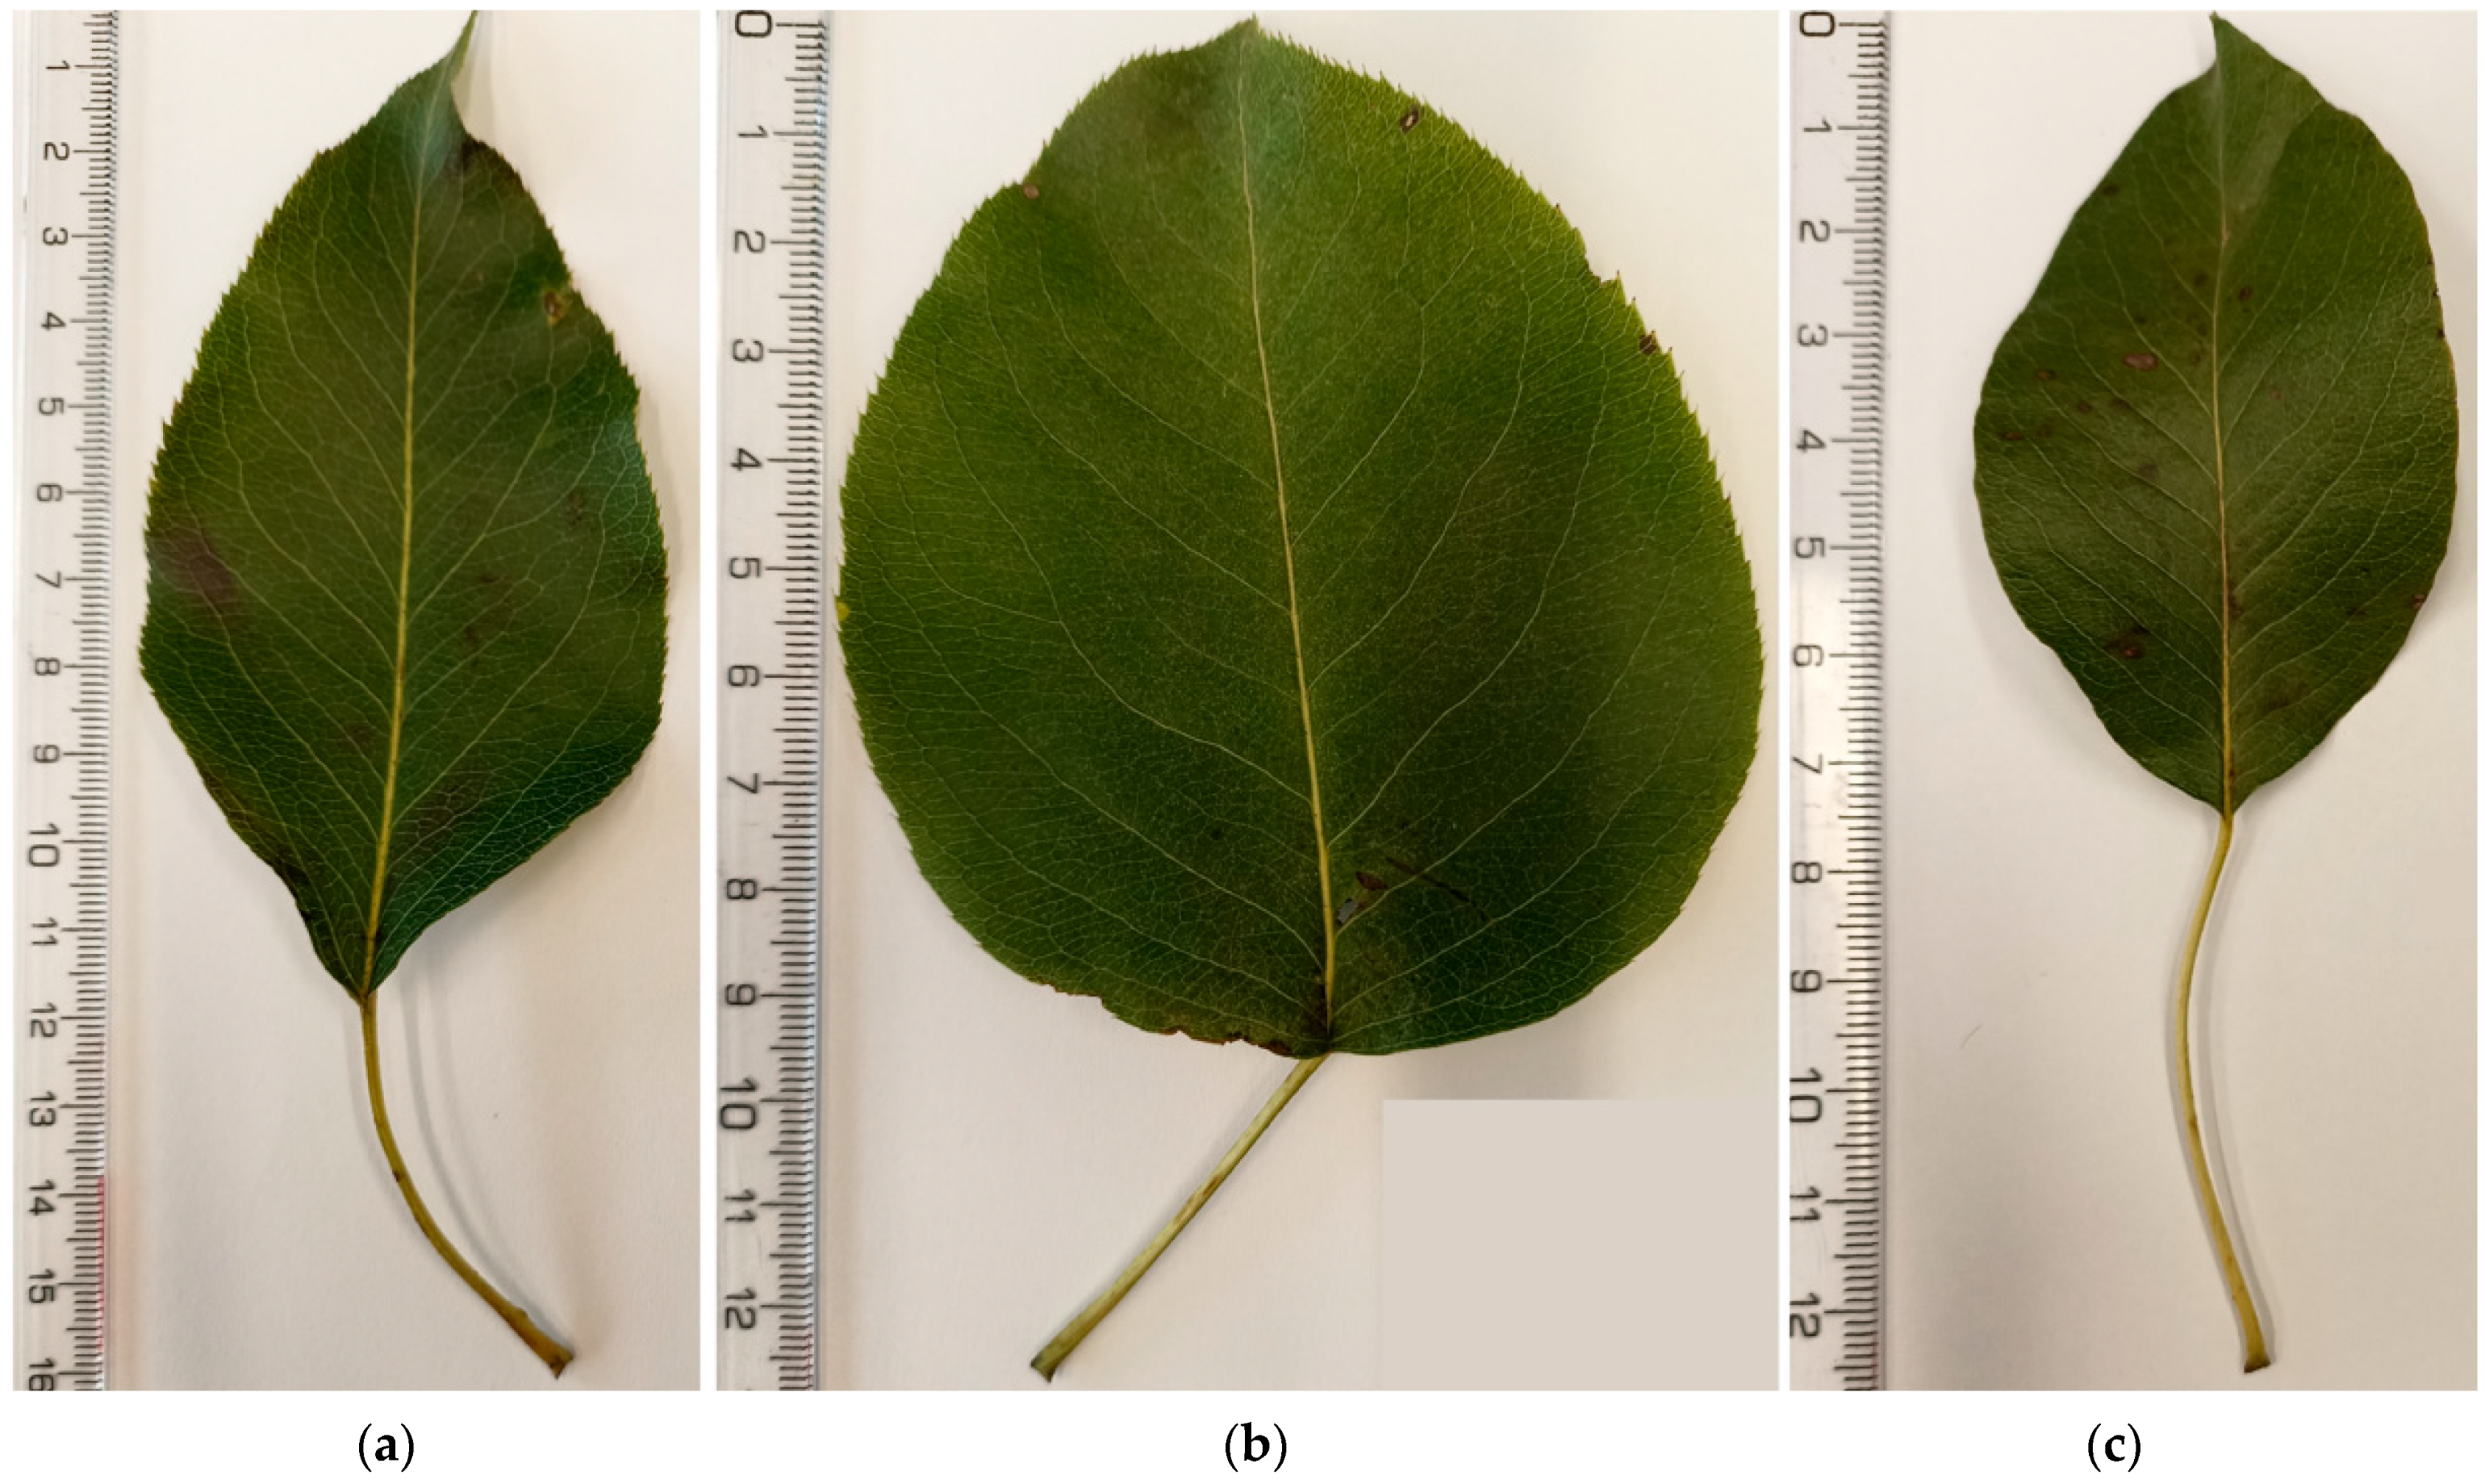
In botanical species, on average, the narrowest leaves were found for P. bretschneiderii (34.8 mm), and the widest were found for P. pyrifolia (67.2 mm). The shortest leaves were found for P. communis (55.6 mm), and the longest leaves belonged to P. pyrifolia (104.6 mm). Examples of leaf blades of diametrically different cultivars of different species are shown in Figure 4.
Kadkhodaei et al. (2021) [1] stated in their results that the leaves of P. betulifolia were 65 mm long and 36.7 mm wide, and those of P. calleryana were 76.3 mm long and 40 mm wide. In present study, our results were 83.2 and 56.4 mm for the former and 84.2 and 48.4 mm for the latter, respectively. These variations may have been caused by ecological and environmental factors [16]. The leaf size of P. communis was measured in [17], and it was found to be 50–84 mm long and 31–42 mm wide, similar to our results.
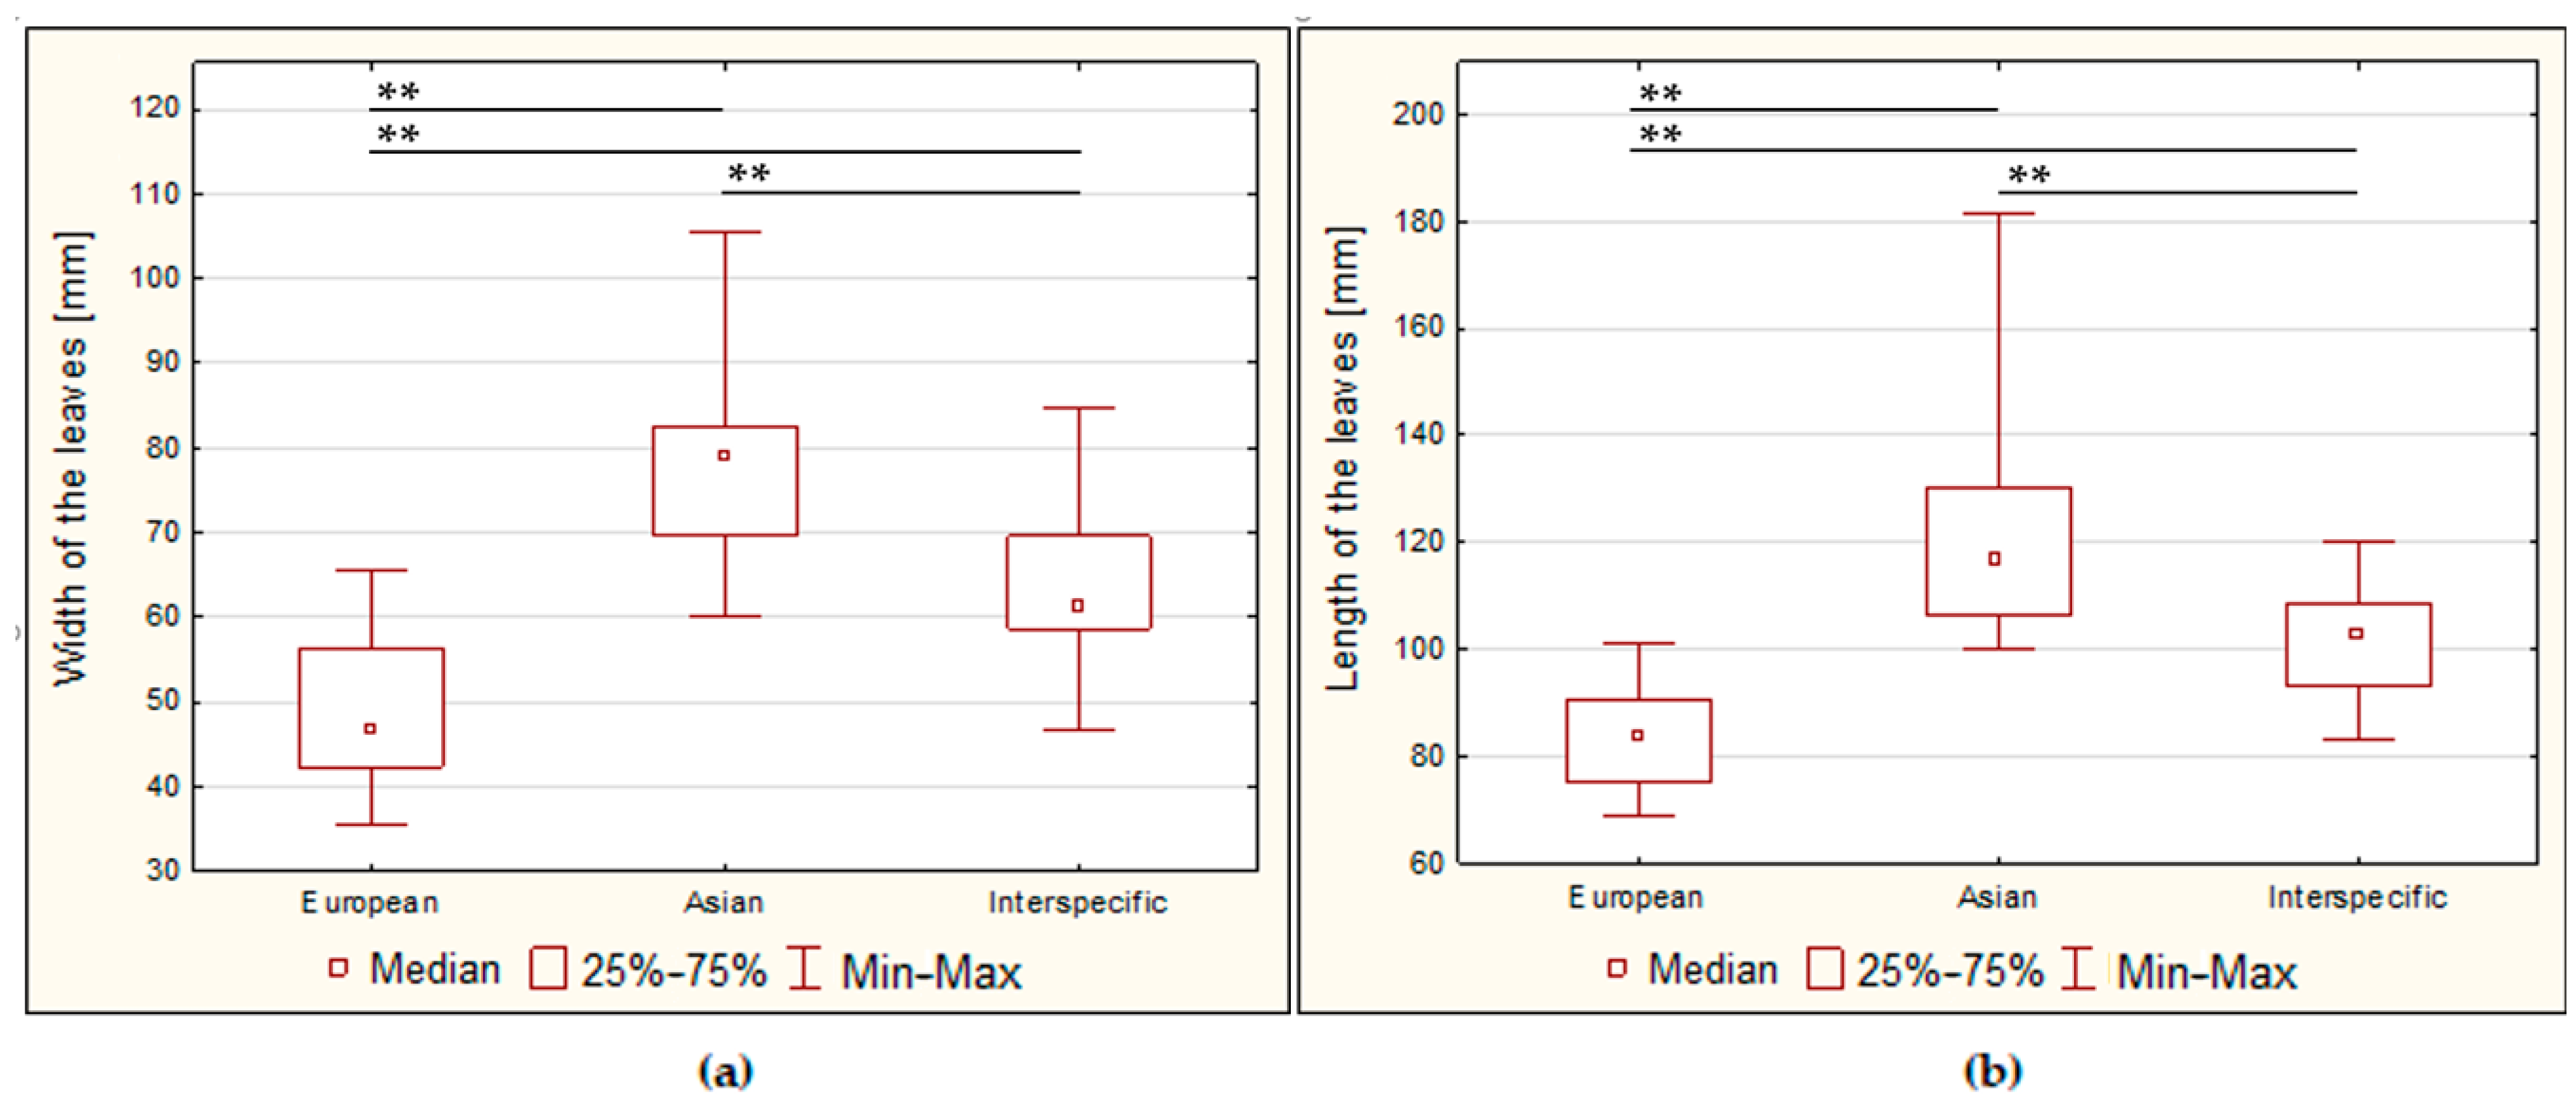
The group of Asian varieties had significantly larger leaves than the European varieties. They were 77.6 mm wide and 121.1 mm long on average, whereas the European varieties had leaves 49 mm wide and 84.1 mm long on average. The leaf size of interspecific hybrids was, on average, 63.3 mm wide and 101 mm long, falling between that of the European and Asian varieties (Figure 5).
Of the selected assortment, the widest and longest leaves were found for ‘Jin Hua’ (105.6 mm wide and 181.6 mm long). The narrowest leaves were measured for ‘Kulovita’ (35.6 mm), and the shortest ones belonged to ‘Elektra’ (68.8 mm).
Dalalbashi et al. (2020) [18] stated that ‘Conference’ had leaves 52–68 mm long and 44–50 mm wide in Iraq’s environmental conditions. In the present study, its leaves were 75–91 mm long and 41–53 mm wide. These data correspond to the results of Wang et al. (2019) [16], who reported that a smaller leaf size has a positive effect on thermoregulation in hotter regions with higher solar radiation.
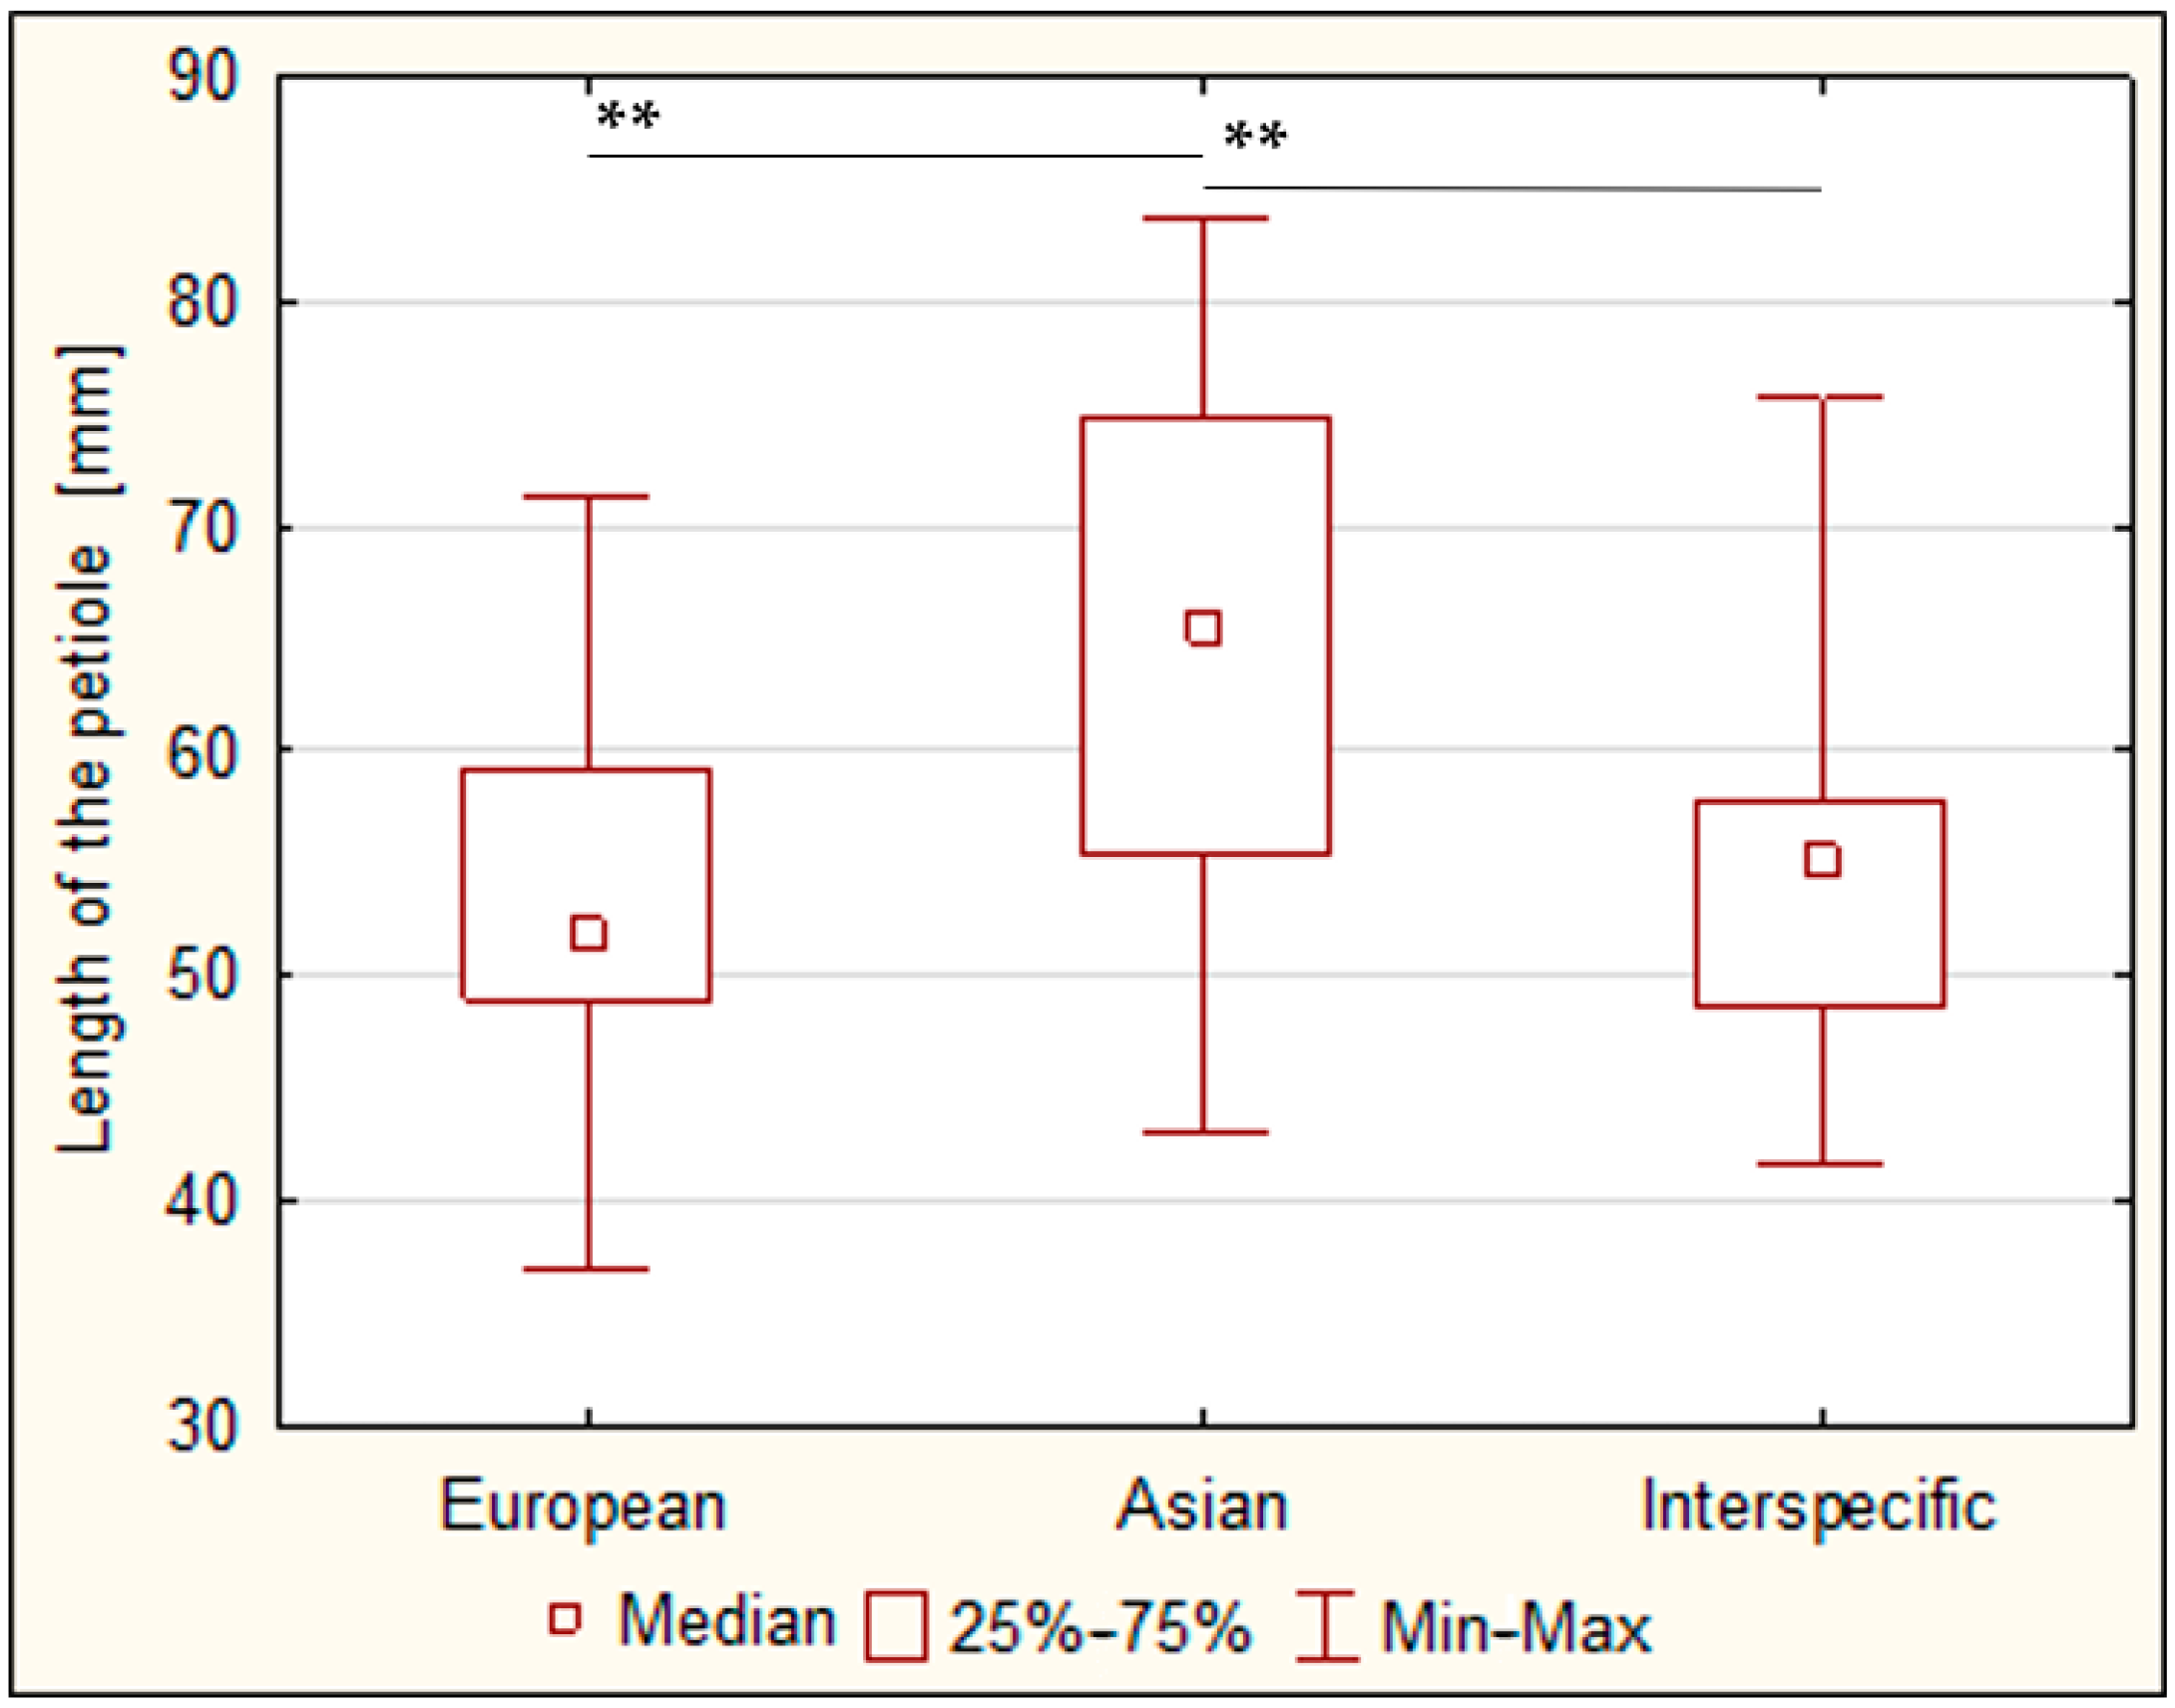
The length of the leaf petiole in the botanical species was as follows. The shortest petiole belonged to P. communis (44.8 mm), though Antkowiak et al. (2008) [17] reported a size of 28–72 mm. The longest petiole measured was for P. ussuriensis (61.6 mm). According to Kadkhodaei et al. (2021) [1], the lengths of the petioles of P. betulifolia and P. calleryana were 33.7 mm and 37 mm, respectively. In the present study, the lengths were 45.8 and 52.8 mm, respectively.
Within the genotype groups, the shortest petioles were measured in the European varieties (53.4 mm), and the longest ones were among the Asian varieties (64.9 mm) (Figure 6).
The shortest leaf petiole in the whole assortment was measured for ‘Elektra’ (37.0 mm), and the longest one was found for ‘Cangxixueli’ (83.6 mm).

3.2.2. Diameter of the Flowers

The biggest flowers of the botanical species belonged to P. caucasica (35.0 mm), and the smallest ones were found for P. calleryana (23.3 mm). The diameter of the flower of P. betulifolia was 25.8 mm on average. Farkas and Orosz-Kovács (2004) [19] stated that the diameter of the flower of the species is 30.1 mm.
On average, the largest flower diameter was found for the group of Asian pears (36.8 mm), and the smallest diameter belonged to the group of interspecific hybrids and also European varieties (34.3 mm).
In the selected assortment, the largest flower diameters were determined in the interspecific hybrid H4 (44.0 mm) and ‘Jin Hua’ (43.3 mm). In contrast, the smallest diameter of flowers was found for ‘Karina’ (23.5 mm). In the present study, the interspecific hybrid ‘Kieffer’ had 32.9 mm as the average diameter of the flower. Singh et al. (2004) [20] reported that ‘Kieffer’ had flowers 30.03 mm in diameter.
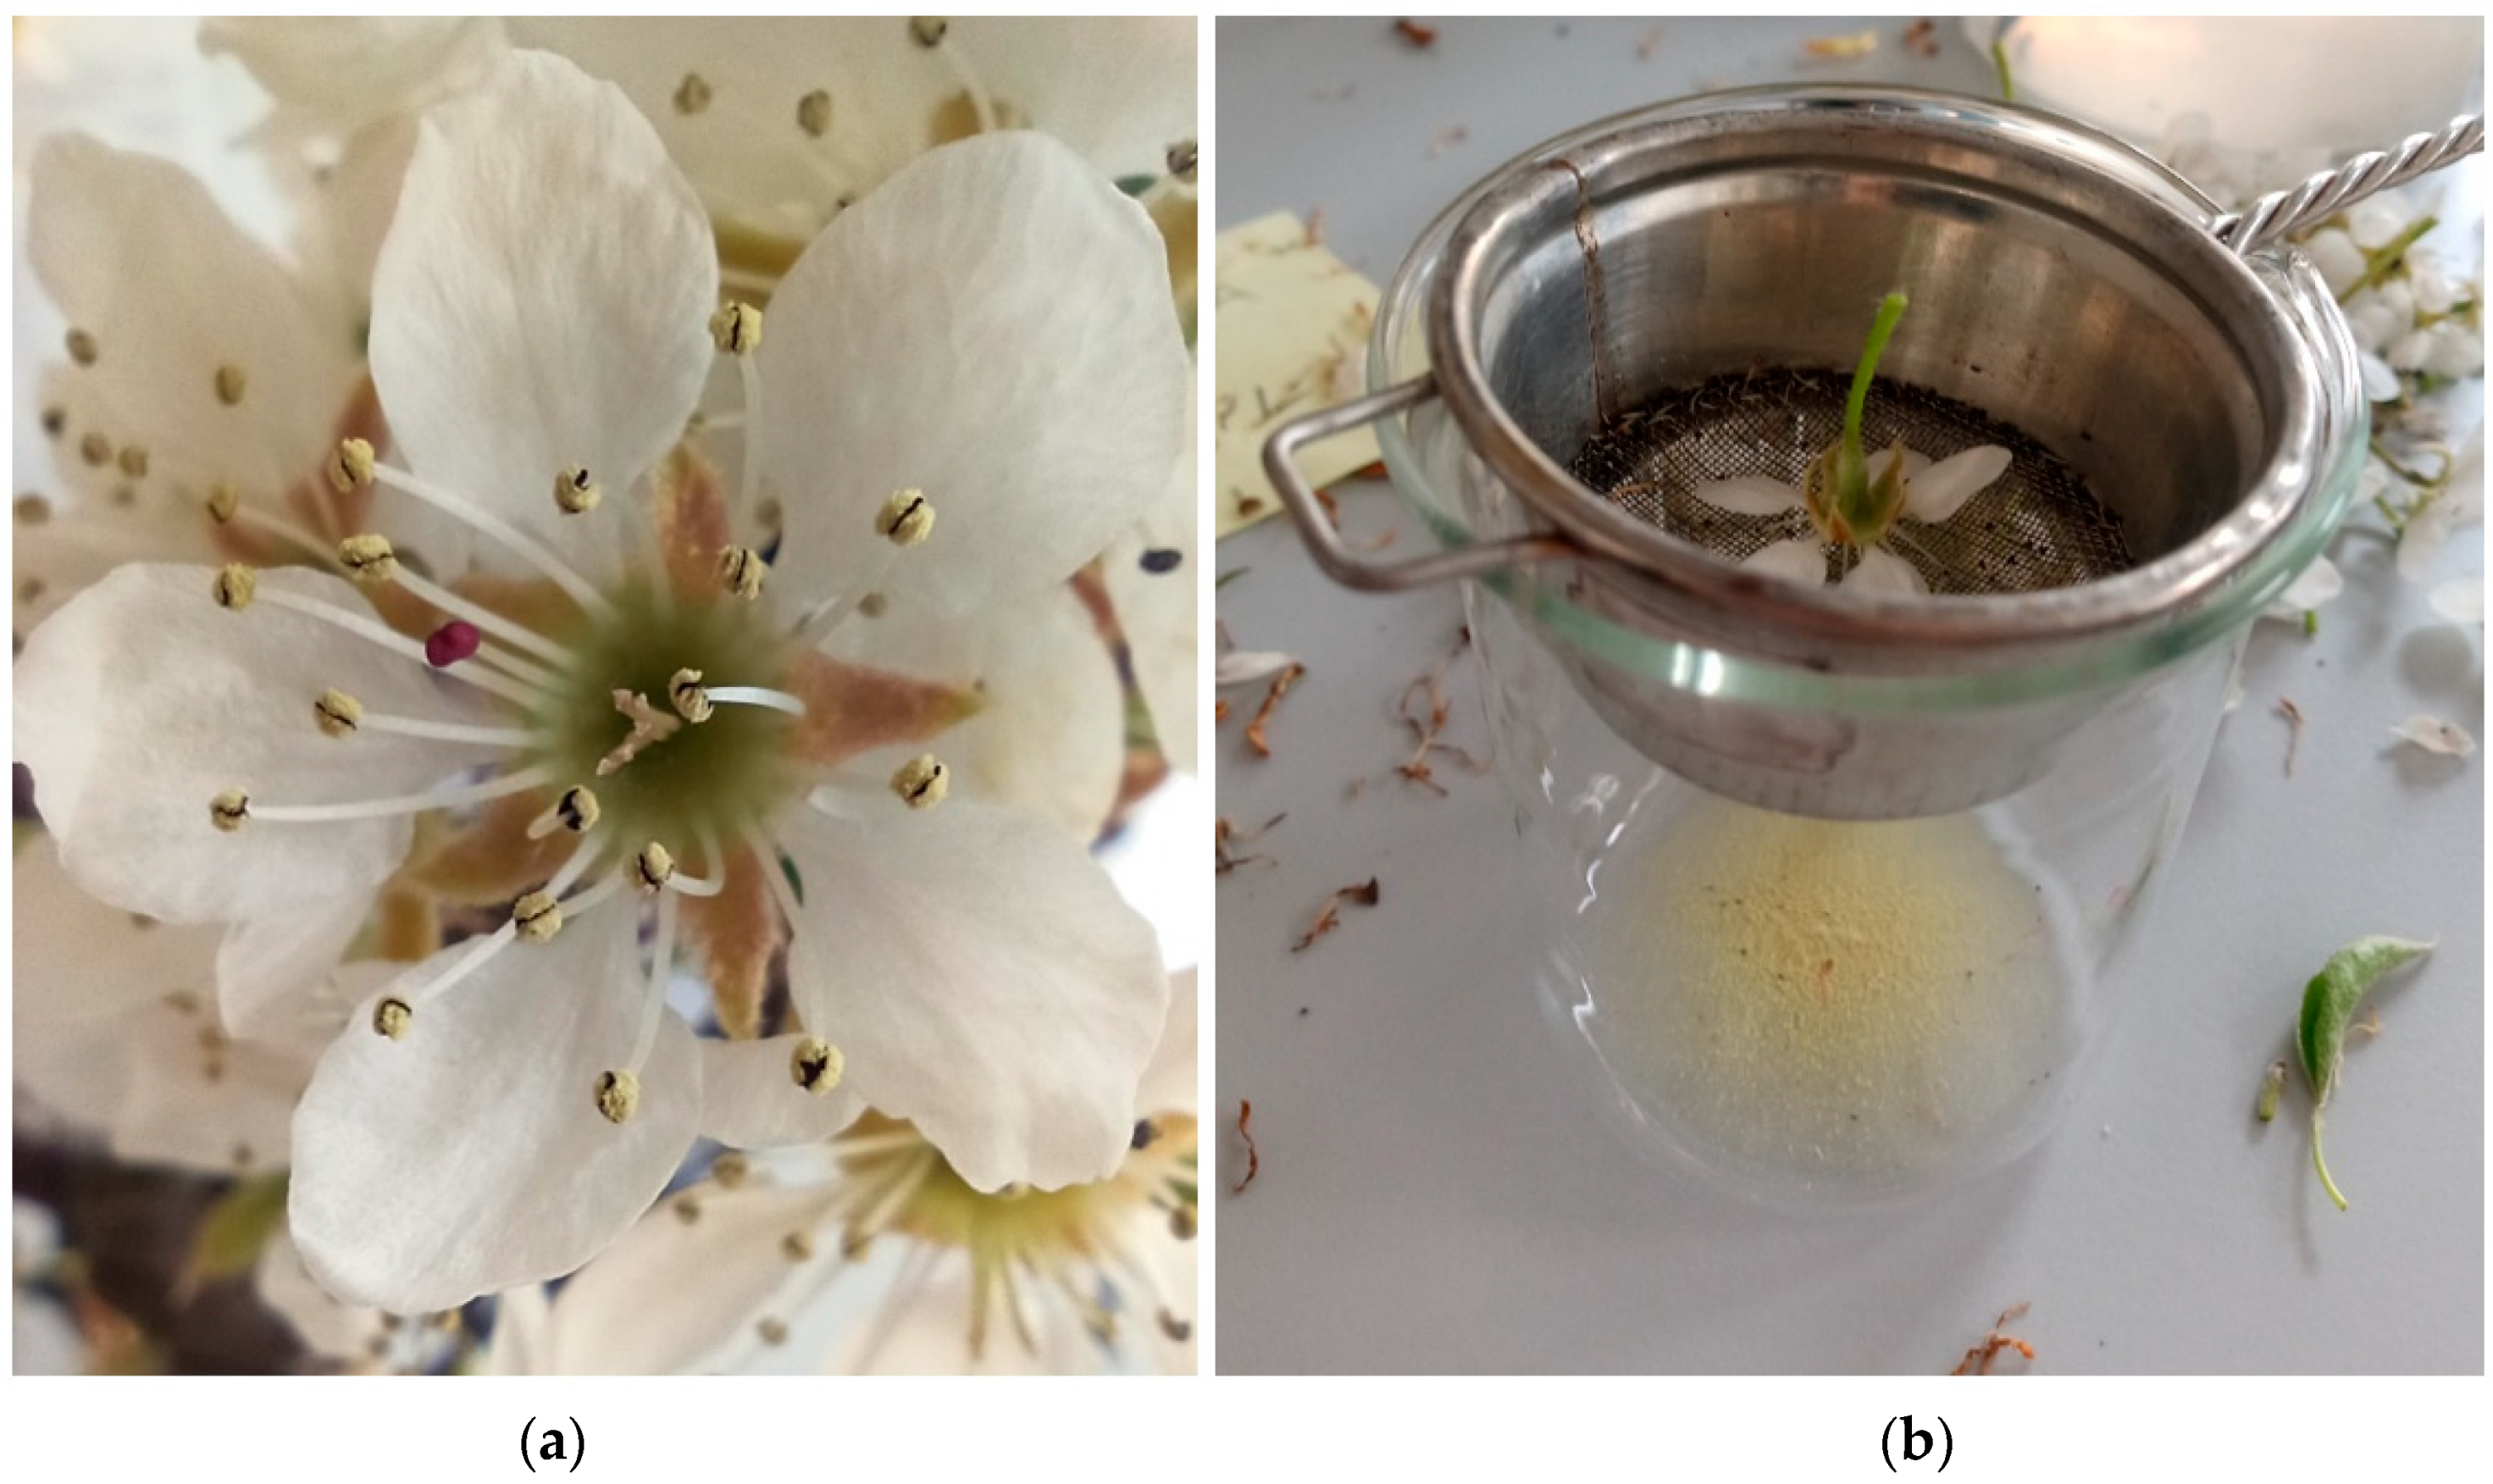
In Figure 7, the flower of ‘Karina’ and the subsequent collection of pollen grains are shown.

3.2.3. Length of the Pollen Grains

The pollen grains of the pears across the assortment evaluated were mostly prolate in shape, sometimes tending to be subprolate (Chili, Jing Bai, Cangxixueli, Nanguo and Zao Su). Their colors ranged from yellow-white to yellow to beige. However, there were no conclusive associations between the origin of the genotypes and these characteristics.
Compared with Malus domestica (Rosaceae) (36.22 μm), Pyrus spp. had slightly bigger pollen grains, but they were similar to other Rosaceae family members’ pollen [21]. In botanical species, we were able to determine the size of the pollen grains of P. calleryana (41.5 μm), P. caucasica (43.6 μm) and P. communis, which had the biggest pollen grains (46.91 μm) on average. According to Motyleva et al. (2017) [21], the biggest pollen grain size was 47.83 μm, and according to Westwood and Challice (1978) [22], it was 44.6 μm. Westwood et al. (1978) [22] also reported the size of pollen grains of P. caucasica (47.0 μm), P. calleryana (43.3 μm), P. betulifolia (43.4 μm), P. ussuriensis (44.0 μm) and P. pyrifolia (45.8 μm).
In the sense of genotype groups, the shortest pollen grains were measured in the group of interspecific hybrids (43.5 μm), while for the European group, it was 44.5 μm, and the longest ones were among the Asian varieties (45.9 μm). Matsuta et al. (1982) [23] measured the pollen sizes of four Japan varieties and found them to be 44.15 μm on average.
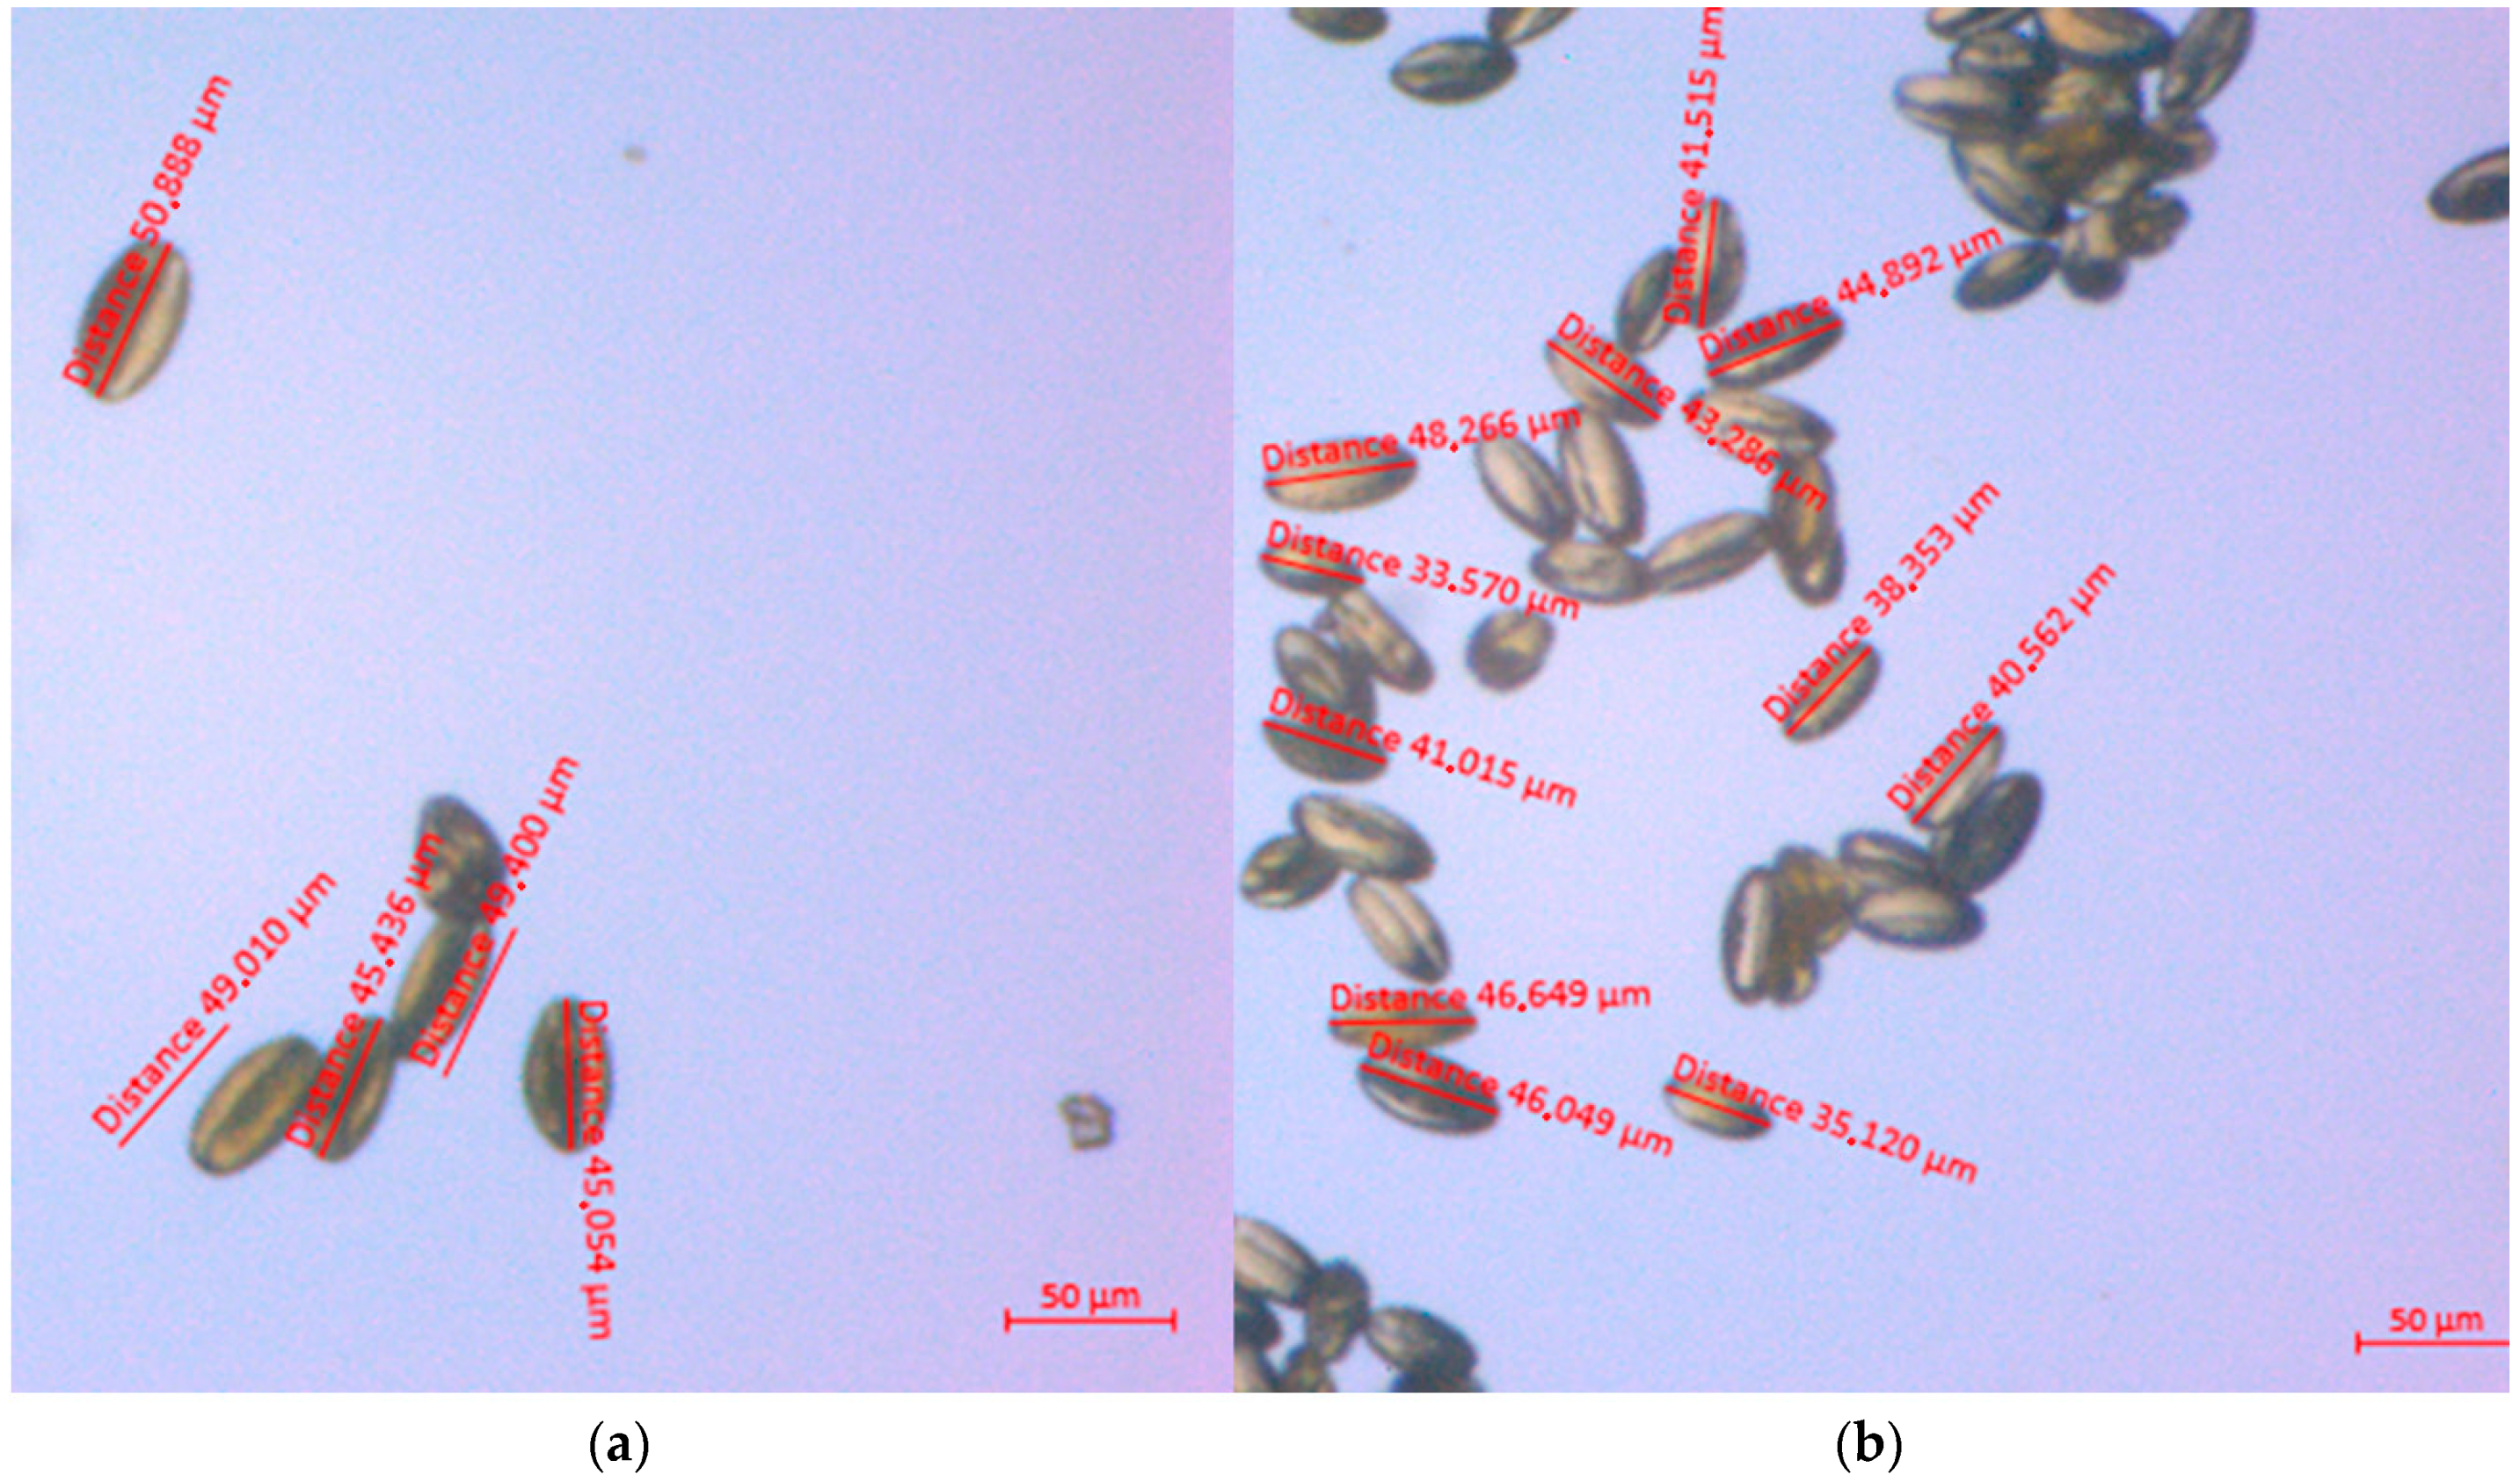
Among the varieties, the smallest pollen grains were found from ‘Chili’ (37.7 μm), and the largest ones were from ‘Xin Gao’ (59.0 μm). Microscopic measurement of the pollen grain size is illustrated in Figure 8.

3.2.4. Length of the Stomata

The longest stomata for the leaves of the botanical species were found for P. ussuriensis (35.1 μm), and the shortest ones were measured in the leaves of P. pyrifolia (26.0 μm), which were also the shortest of the entire assortment. Antkowiak et al. (2008) [17] reported the average length of the stomata of P. communis to be 36.3 μm, and in the present study, it was 34.2 μm on average.
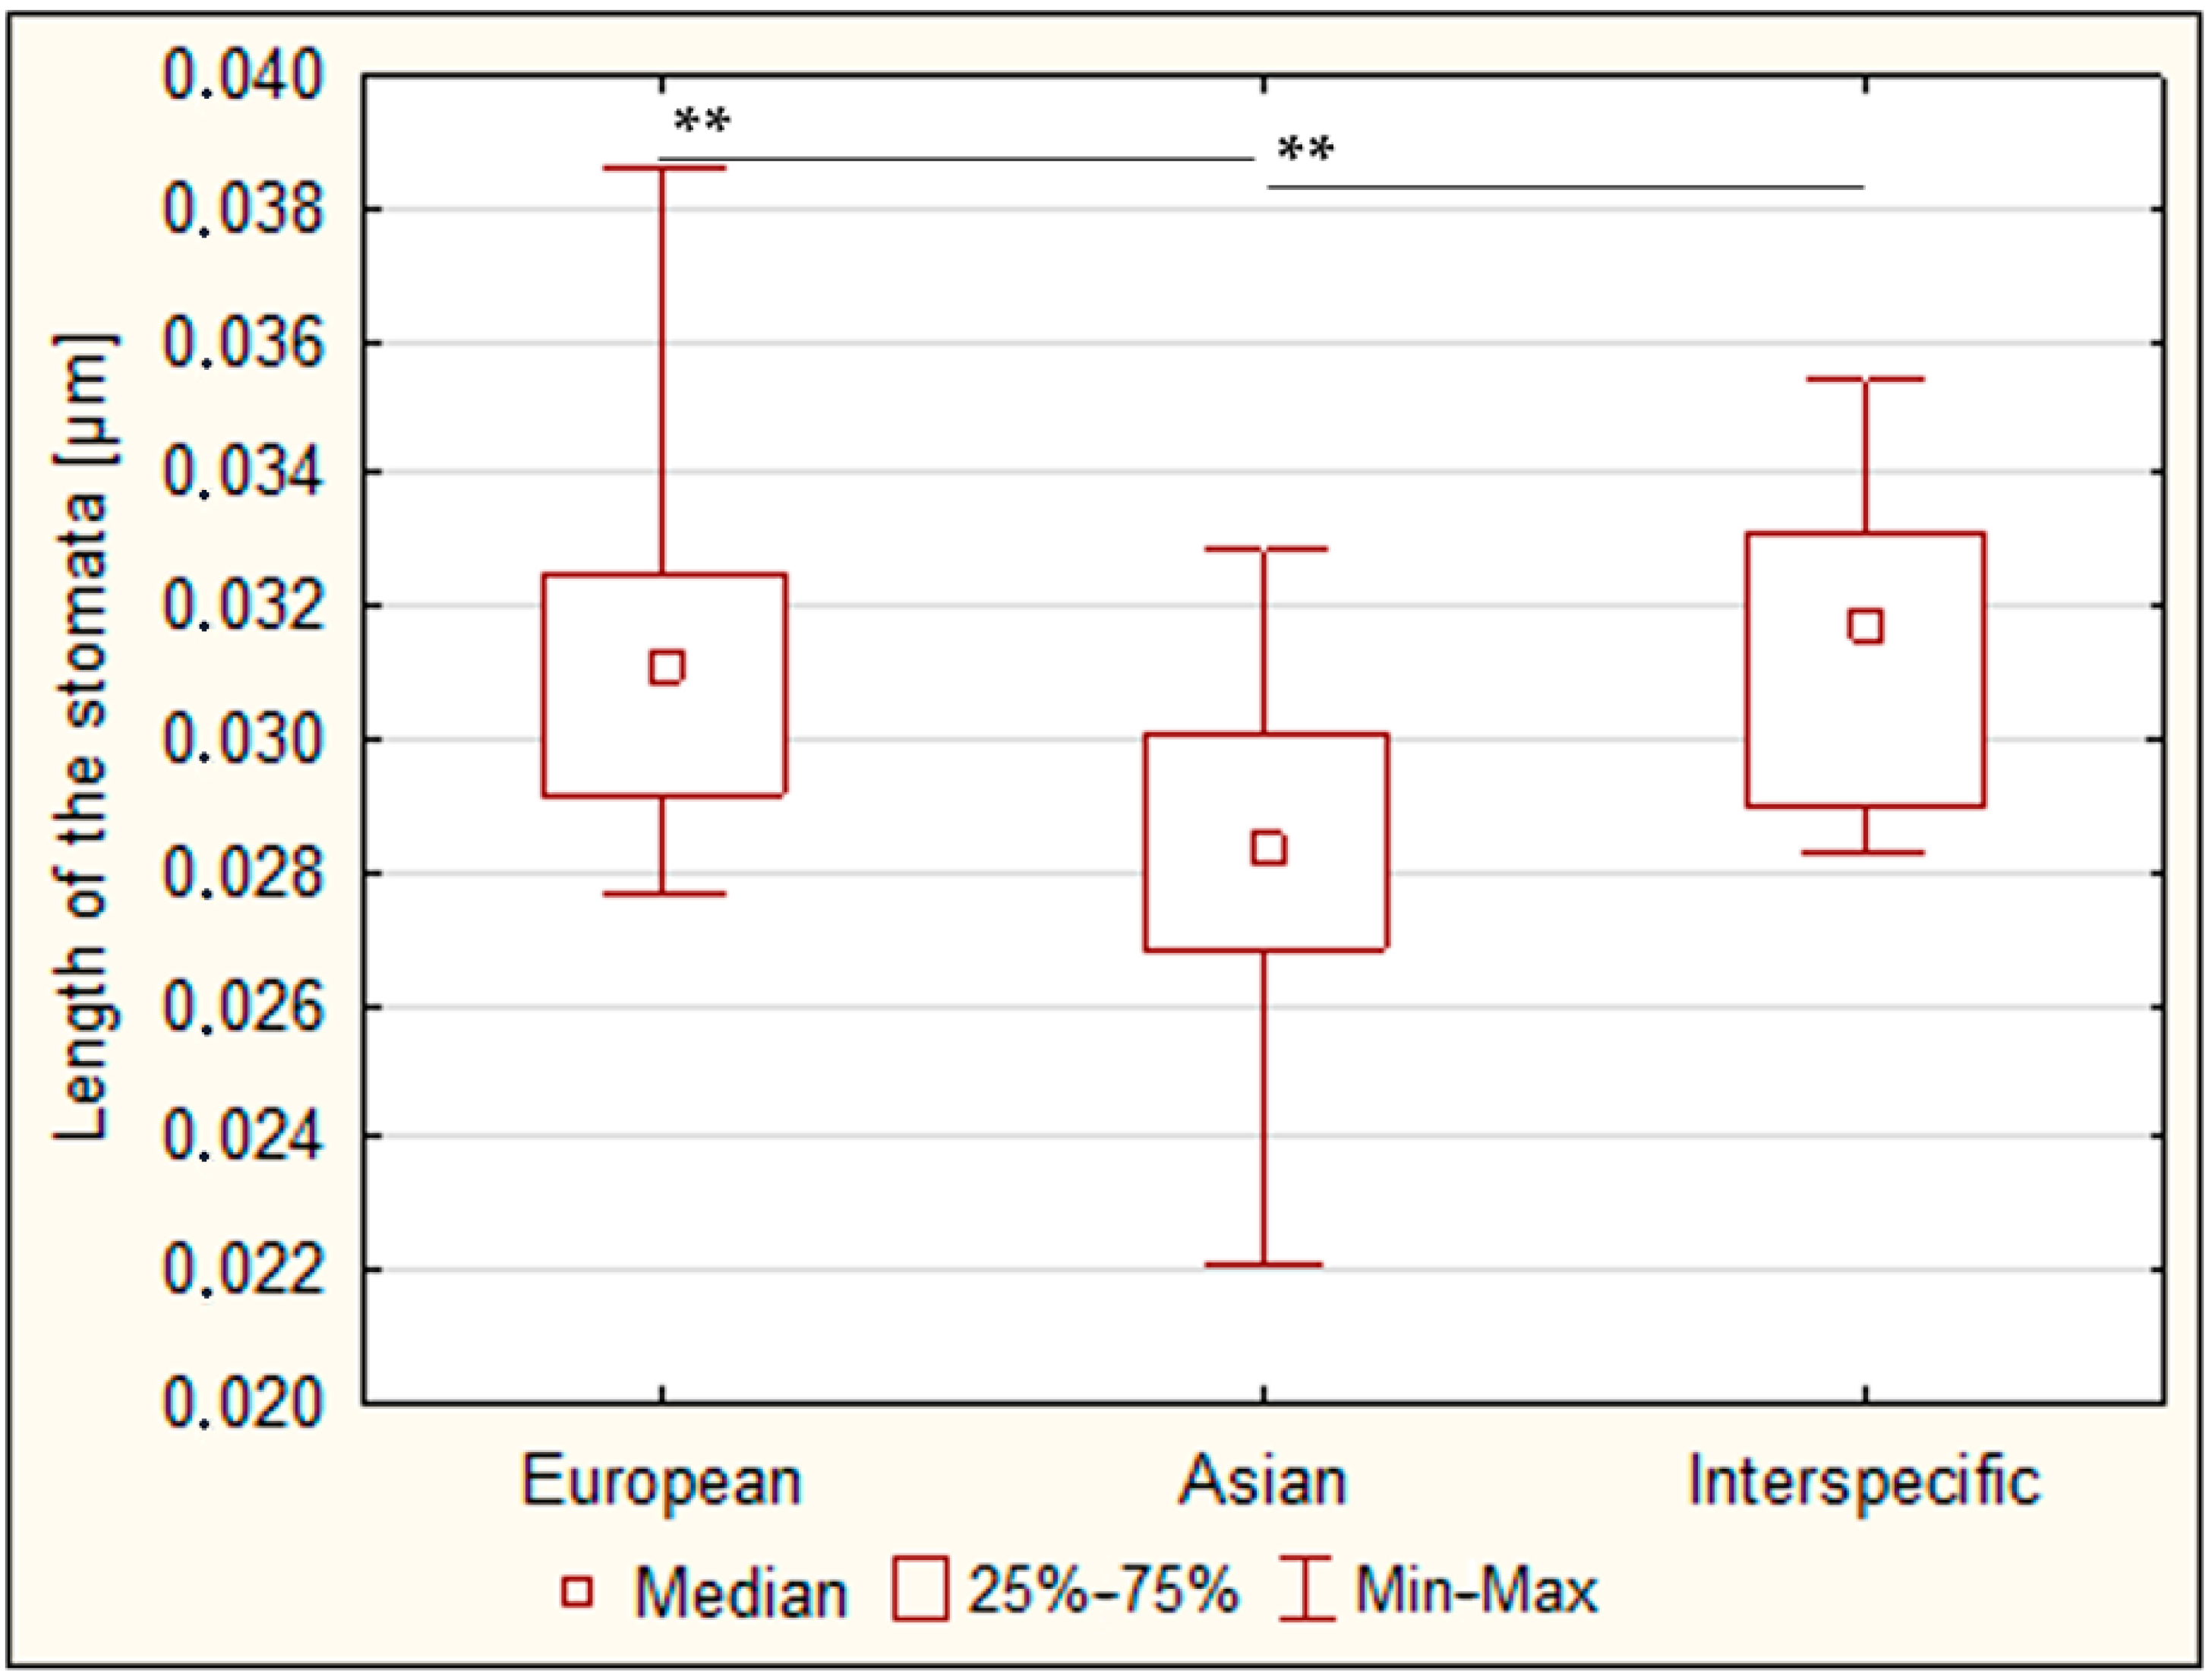
The stomatal length of P. caucasica was 31.1 μm on average. Babosha et al. (2022) [24] found the stomatal length of P. caucasica to be 34.5 μm in the primary stomata and 29.4 μm in the secondary stomata on average. They also noted the decreasing size of the length of the secondary stomata at higher altitudes (31.4 μm at 600 m above sea level and 27.4 μm at 1750 m above sea level). In contrast to previous morphological characteristics, the Asian varieties had the shortest stomata (28.4 μm on average), while the group of European had the longest (31.6 μm) (Figure 9).
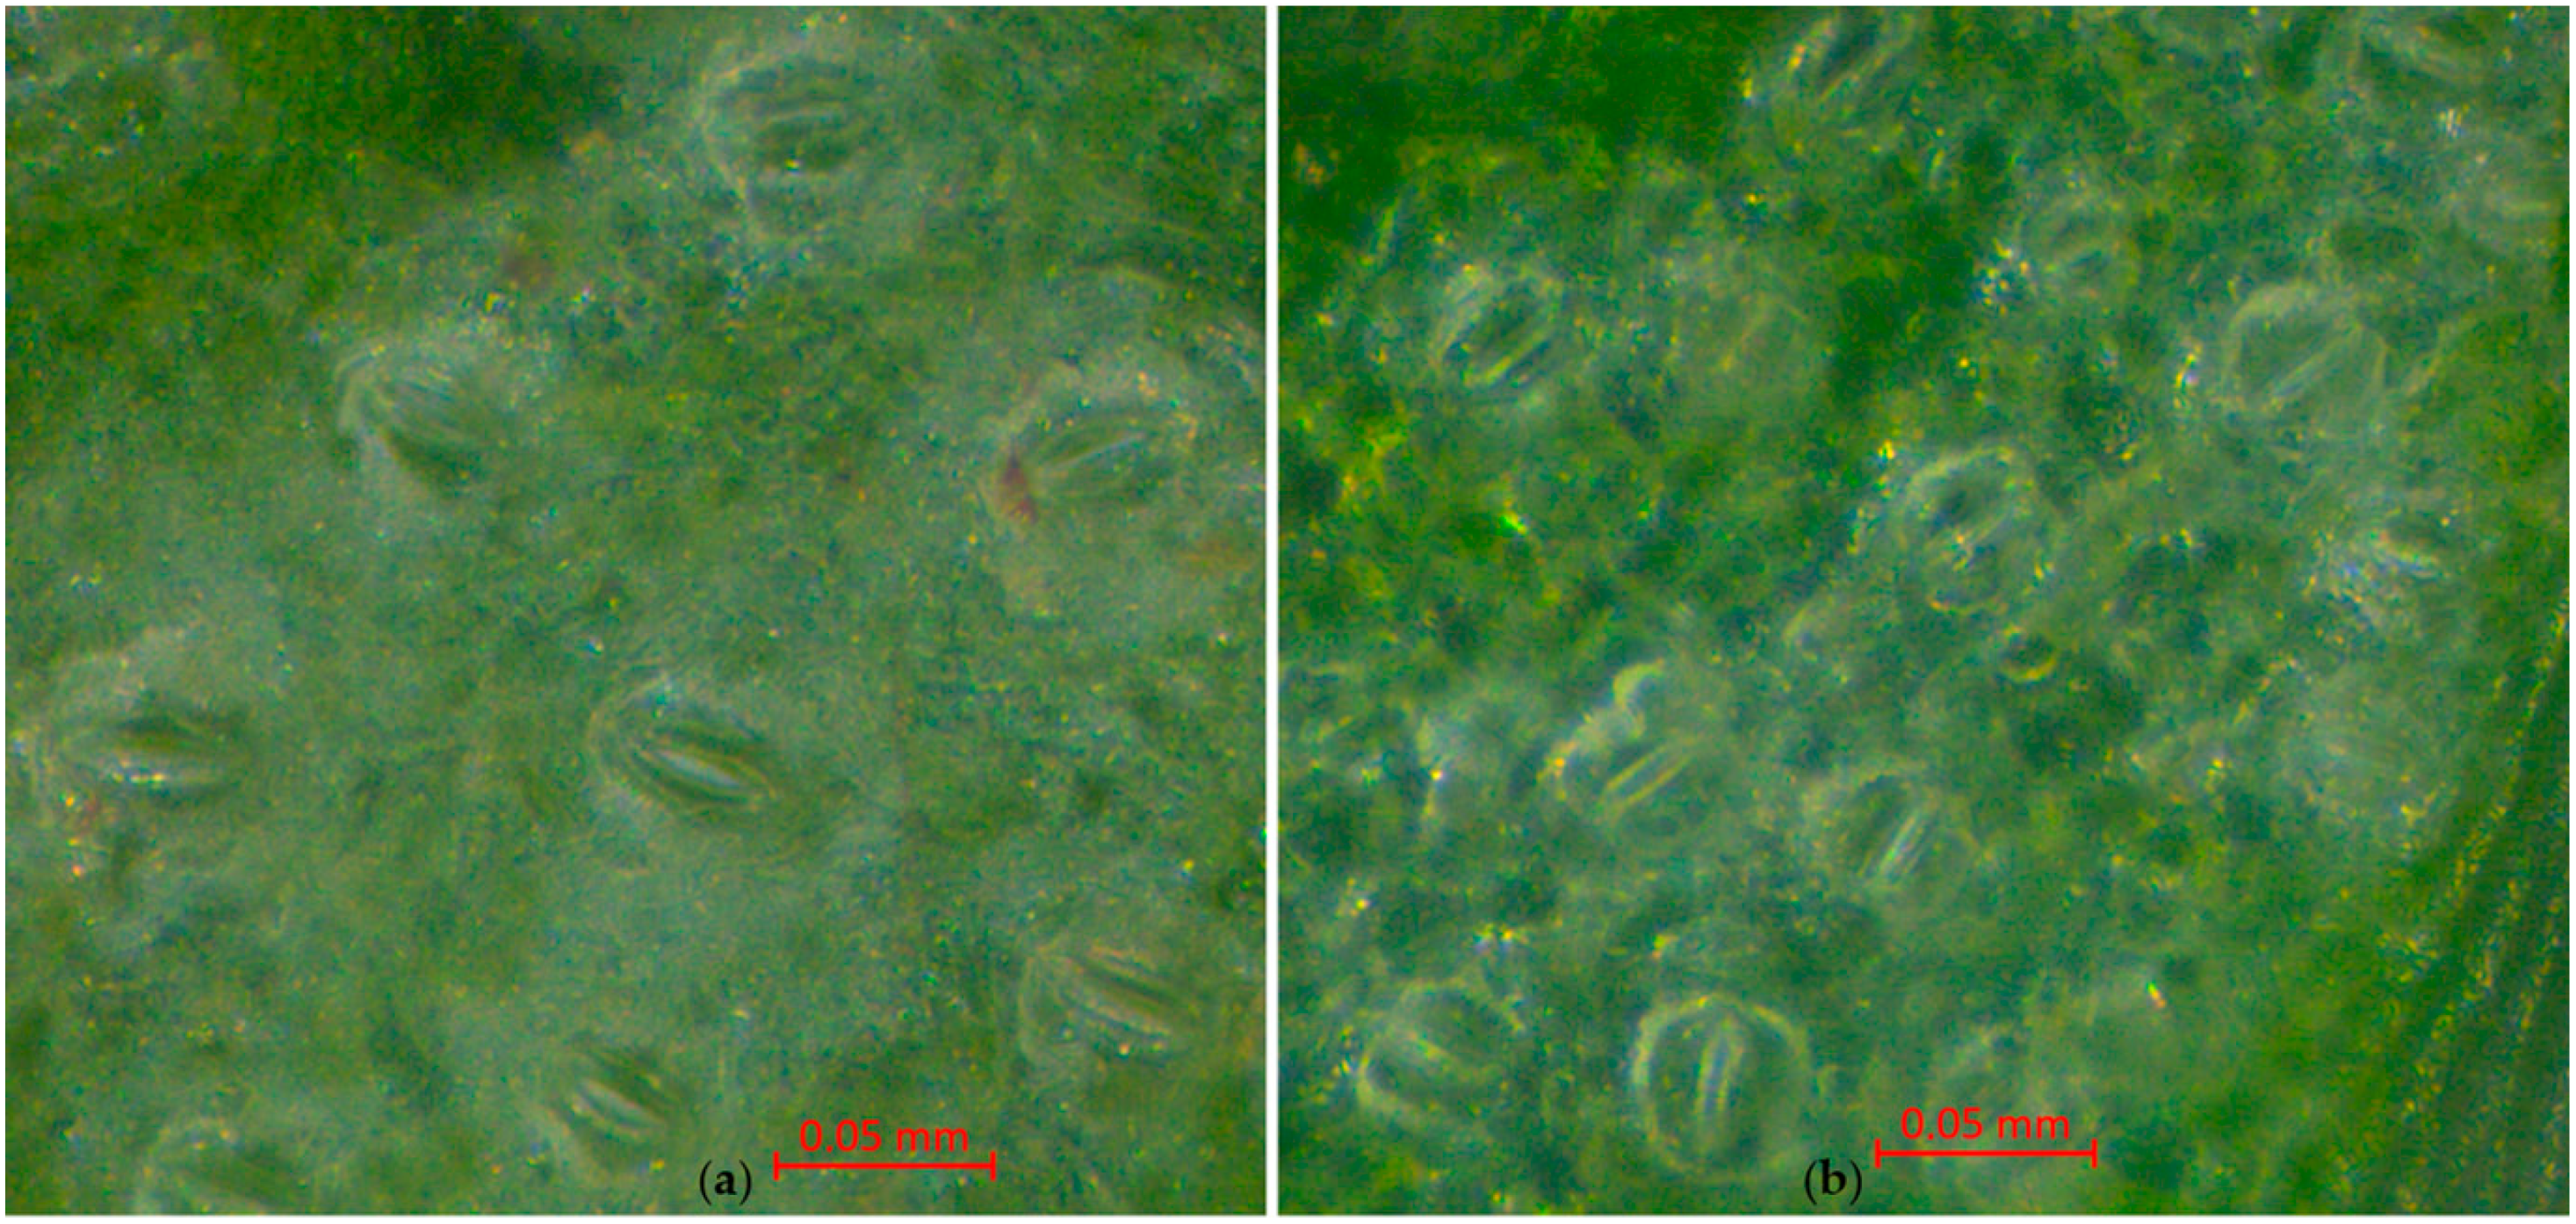
Ameri et al. (2020) [25] conducted a study on the ploidy level of Pyrus communis and revealed that the mixoploids had a lower leaf area index, captured light better and had better stomatal conductivity, which implies higher productivity by polyploids. Across all evaluated varieties and interspecific hybrids in this study, the biggest stomata were in European triploids Hcer3 (38.6 μm) and ‘Alexander Lucas’ (37.2 μm). The smallest ones were measured in the Asian ‘Snow Flower’ (22.1 μm). The microscopy of the stomata is illustrated in Figure 10.

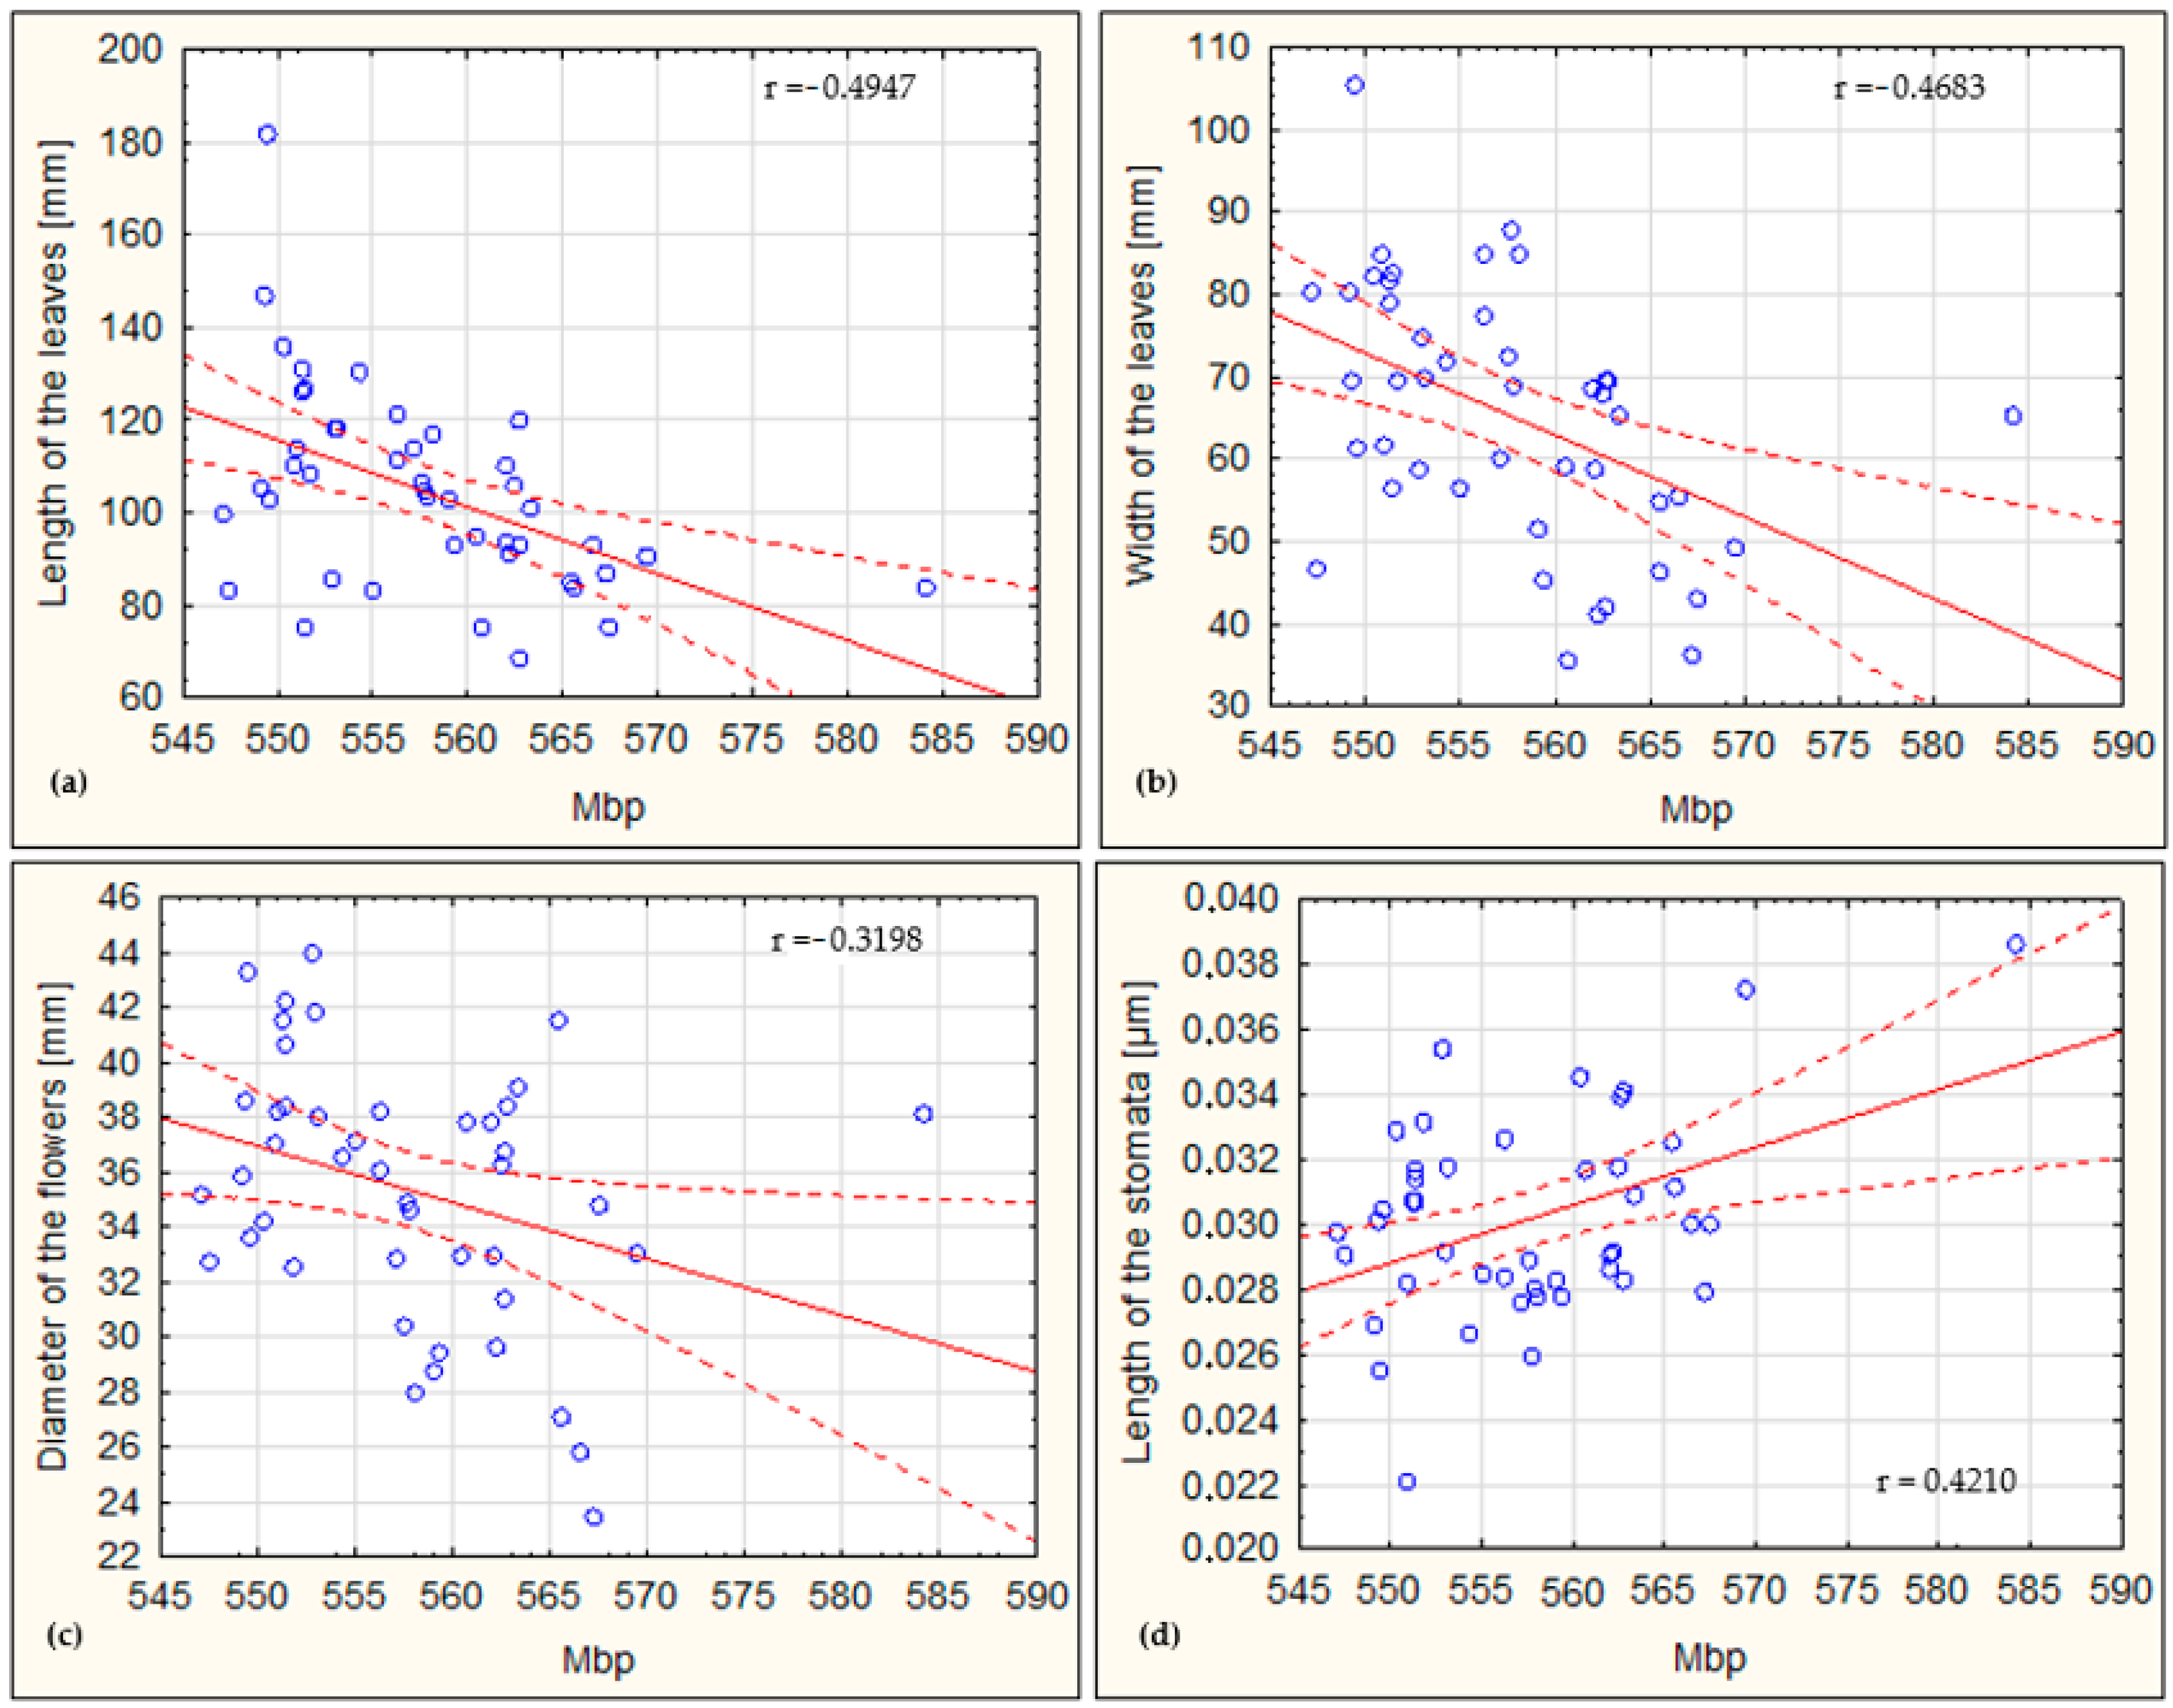
3.3. Correlations of the Genome Size and Morphological Traits

ANOVA analysis showed statistically significant results (p < 0.05), and in addition, a correlation relationship was found for the genome size with the leaf width, leaf length, flower diameter and stomata size (Table 4). The results suggest that decreasing leaf and flower sizes and increasing stomata sizes may be related to larger genome sizes (Table 5, Figure 11), which is inconsistent with previous research, where polyploids were often associated with larger leaves, flowers, pollen grains and fruits [26]. The results could be affected by the fact that an extremely wide range of pear cultivars with different origins was analyzed in this study, whereas botanical species were included.
Kadkhodaei et al. (2021) [1] presented significant relationships found between the amount of 2Cx DNA and some morphological characters such as fruit diameter, fruit length to diameter ratio, fruit pedicel length and fruit size. Beaulieu et al. (2008) [27] states, that the genome size correlated with cell size and stomatal density in angiosperms, while [28] reported, that morphological traits had no significant effect on genome size in Turnip. According to [29], the genome size is in correlation with altitude, habitat and growth form.
In present study, we used fresh samples with alternative internal reference, and our results are consistent with those in [6,7], but at the same time, some studies [1,13,14] presented different results. The intraspecific variation in genome size is still relatively unclear. Savas et al. (2019) [30] suggested that the genome size is influenced by geographical origin (altitude and location), which had a statistically significant effect on the genome size of Brachypodium distachyon (0.732 to 0.752 pg/2C), with negative correlations between the altitude and genome size. However, in B. hybridum, they did not find any effect. Basak et al. (2019) [28] reported that environments had no significant effect on the genome size in turnips.
The variations in relative genome size could be caused by the incorrect transport and storage of samples, by unrecognized taxonomic differences in the material, by the content of endogenous inhibitors of a phenolic nature, which can strongly influence the results, or by an increase or decrease in the copy number of DNA sequences [31]. Most of the variation seems to be influenced by methodological aspects [12]. The intraspecific genome size variation is mainly caused by differences in the repetitive DNA content as a consequence of the dynamics of transposable elements and also may be related to phenotypic variation [32].
In the context of previous research, there could be a rather close relationship between the cultivars of ‘Dangshanshuli’, ‘Snow Flower’ and ‘Shon Shu’. In [33], it was reported that there was an identical SSR profile found between these cultivars. It is believed that ‘Snow Flower’ and ‘Shon Shu’ may be clones of ‘Dangshanshuli’. According to [34], these cultivars are similar pomologically, but there are subtle differences in their phenophases. In our study, the genome size was found to be quite similar in ‘Dangshanshuli’ (557.7 Mbp) and ‘Shon Shu’ (558.1 Mbp) but not ‘Snow Flower’ (550.9 Mbp). In addition, they were similar morphologically, especially in terms of the length of the pollen grains and the size of the leaves (Table 3).

4. Conclusions

In this study, flow cytometry analysis was performed, and some morphological traits were measured in 53 pear genotypes. One triploid genotype of the European type was found in the collection of new hybrids from the production of our Institute of Fruit Science in Lednice, which will be used in further breeding. We found that the Asian varieties had a smaller genome size than the European ones. However, compared with some articles, there was some intraspecific variation in genome size, which is still not sufficiently clarified and requires further studies. Furthermore, some relationships between the morphological traits and genome size were suggested. A statistically significant positive correlation was found between the genome size and stomatal length, and a negative correlation was found between the genome size and leaf length, leaf width and flower diameter. A further point of interest could be more in-depth studies on these correlations, including the relationships between the stomatal size, genome size and ploidy level as well as the stomatal density. Also, cases of intraspecific differences in genome size are still unclear and require further investigation. Because of the many factors which can influence the results, it is difficult to prove the validity of correlations and decide which previous studies are presenting the facts and which may be misleading.

Author Contributions

Conceptualization, T.N. and J.F.; methodology, E.Z.; software, E.Z. and J.F.; validation, E.Z., J.F. and T.N.; formal analysis, J.F. and E.Z.; investigation, J.F.; resources, J.F.; data curation, J.F. and E.Z.; writing—original draft preparation, J.F.; writing—review and editing, J.F., E.Z. and T.N.; visualization, E.Z.; supervision, T.N.; project administration, E.Z and J.F.; funding acquisition, T.N. All authors have read and agreed to the published version of the manuscript.

Funding

This research was funded by project IGA-ZF/2023-SI1-016: Diversity of chromosome ploidy and genome size of pear cultivars in relation to their geographical origin and morphological traits assigned by Mendel University in Brno.

Data Availability Statement

The raw data supporting the conclusions of this article will be made available by the authors upon request.

Acknowledgments

This research used the infrastructure was acquired by project CZ.02.1.01/0.0/0.0/16_017/0002334, Research Infrastructure for Young Scientists, which is co-financed by the Operational Program of Research, Development and Education.

Conflicts of Interest

The authors declare no conflicts of interest. The funders had no role in the design of the study; in the collection, analyses, or interpretation of data; in the writing of the manuscript; or in the decision to publish the results.

References

  1. Kadkhodaei, S.; Arzani, K.; Yadollahi, A.; Karimzadeh, G.; Abdollahi, H. Genetic Diversity and Similarity of Asian and European Pears (Pyrus spp.) Revealed by Genome Size and Morphological Traits Prediction. Int. J. Fruit Sci. 2021, 21, 619–633. [Google Scholar] [CrossRef]
  2. Nečas, T.; Balík, J.; Wolf, J.; Goliáš, J.; Láčík, J.; Šillerová, J.; Kiss, T.; Ondrášek, I.; Horák, M.; Kožíšková, J.; et al. ASIJSKÉ HRUŠNĚ V PODMÍNKÁCH ČESKÉ REPUBLIKY, Pěstování, Pomologie, Skladování a Choroby, 1st ed.; Ediční středisko Mendelovy Univerzity: Brno, Czech Republic, 2018; 184p, ISBN 978-80-7509-557-2. [Google Scholar]
  3. Rampáčková, E.; Mrázová, M.; Čížková, J.; Nečas, T. Pomological Traits and Genome Size of Prunus armeniaca L. Considering to Geographical Origin. Horticulturae 2022, 8, 199. [Google Scholar] [CrossRef]
  4. Sakhanokho, H.F.; Timothy Rinehart, A.; Stringer, S.J.; Islam-Faridi, M.N.; Pounders, C.T. Variation in nuclear DNA content and chromosome numbers in blueberry. Sci. Hortic. 2018, 233, 108–113. [Google Scholar] [CrossRef]
  5. Kolano, B.; Siwinska, D.; Gomez Pando, L.; Szymanowska-Pulka, J.; Maluszynska, J. Genome size variation in Chenopodium quinoa (Chenopodiaceae). Plant Syst. Evol. 2012, 298, 251–255. [Google Scholar] [CrossRef]
  6. Phillips, W.D.; Ranney, T.G.; Touchell, D.H.; Eaker, T.A. Fertility and reproductive pathways of triploid flowering pears (Pyrus sp.). HortScience 2016, 51, 968–971. [Google Scholar] [CrossRef]
  7. Niu, Y.; Zhou, W.; Chen, X.; Fan, G.; Zhang, S.; Liao, K. Genome size and chromosome ploidy identification in pear germplasm represented by Asian pears—Local pear varieties. Sci. Hortic. 2020, 265, 109202. [Google Scholar] [CrossRef]
  8. Baccichet, I.; Foria, S.; Messina, R.; Peccol, E.; Losa, A.; Fabro, M.; Gori, G.; Zandigiacomo, P.; Cipriani, G.; Testolin, R. Genetic and ploidy diversity of Pear (Pyrus spp.) germplasm of Friuli Venezia Giulia, Italy. Genet. Resour. Crop Evol. 2019, 67, 83–96. [Google Scholar] [CrossRef]
  9. Postman, J.; Bassil, N.; Bell, R. Ploidy of USDA World Pear Germplasm Collection determined by flow cytometry. Acta Hortic. 2014, 1094, 75–81. [Google Scholar] [CrossRef]
  10. Doležel, J.; Sgorbatti, S.; Lucretti, S. Comparison of three DNA fluorochromes for flow cytometric estimation of nuclear DNA content in plants. Physiol. Plant. 1992, 85, 625–631. [Google Scholar] [CrossRef]
  11. Doležel, J.; Greihuber, J.; Suda, J. Flow Cytometry with Plant Cells. Analysis of Genes, Chromosomes and Genomes; WILEY-VCH Verlag GmbH & Co. KGaA: Weinheim, Germany, 2007; ISBN 978-3-527-31487-4. [Google Scholar]
  12. Doležel, J.; Bartoš, J.A.N. Plant DNA flow cytometry and estimation of nuclear genome size. Ann. Bot. 2005, 95, 99–110. [Google Scholar] [CrossRef]
  13. Dickson, E.E.; Arumuganathan, K.; Kresovich, S.; Doyle, J.J. Nuclear DNA content variation within the Rosaceae. Am. J. Bot. 1992, 79, 1081–1086. [Google Scholar] [CrossRef]
  14. Pustahija, F.; Brown, S.C.; Bogunić, F.; Bašić, N.; Muratović, E.; Ollier, S.; Hidalgo, O.; Bourge, M.; Stevanović, V.; Siljak-Yakovlev, S. Small genomes dominate in plants growing on serpentine soils in West Balkans, an exhaustive study of 8 habitats covering 308 taxa. Plant Soil 2013, 373, 427–453. [Google Scholar] [CrossRef]
  15. Wu, J.; Wang, Z.; Shi, Z.; Zhang, S.; Ming, R.; Zhu, S.; Khan, M.A.; Tao, S.; Korban, S.S.; Wang, H.; et al. The genome of the pear (Pyrus bretschneideri Rehd.). Genome Res. 2012, 23, 396–408. [Google Scholar] [CrossRef] [PubMed]
  16. Wang, C.; He, J.; Zhao, T.-H.; Cao, Y.; Wang, G.; Sun, B.; Yan, X.; Guo, W.; Li, M.-H. The smaller the leaf is, the faster the leaf water loses in a temperate forest. Front. Plant Sci. 2019, 10, 58. [Google Scholar] [CrossRef]
  17. Antkowiak, W.; Czarna, A.; Wawrzyniak, M. Pyrus x myloslavensis (P. communis L. x P. salicifolia Pall.)—A new spontaneous pear hybrid. Dendrobiology 2008, 60, 45–49. [Google Scholar]
  18. Dalalbashi, A.A.; Alhatem, J.Y. Morphological and anatomical study of some Italian pear leaves Pyrus communis L. cultivated in Iraq. In Proceedings of the 2nd International Conference on Materials Engineering & Science (IConMEAS 2019), Baghdad, Iraq, 25–26 September 2019. [Google Scholar] [CrossRef]
  19. Farkas, A.; Orosz-Kovács, Z.S. Primary and secondary attractants of flowers in Pear Pyrus betulifolia. Acta Hortic. 2004, 636, 317–324. [Google Scholar] [CrossRef]
  20. Singh, S.K.; Bist, L.D.; Patel, V.B. Flowering and floral biology studies in low-chill pear cultivars. Indian J. Hortic. 2004, 61, 94–96. [Google Scholar]
  21. Motyleva, S.; Brindza, J.; Kulikov, I. The morphology of pollen grains of the some species of Rosaceae Juss. family. Agrobiodivers. Improv. Nutr. Health Life Qual. 2017, 1, 338–341. [Google Scholar] [CrossRef]
  22. Westwood, M.N.; Challice, J.S. Morphology and surface topography of pollen and anthers of Pyrus species. J. Am. Soc. Hortic. Sci. 1978, 103, 28–37. [Google Scholar] [CrossRef]
  23. Matsuta, N.; Omura, M.; Akihama, T. Difference in micromorphological pattern on pollen surface of Japanese pear cultivars. Jpn. J. Breed. 1982, 32, 123–128. [Google Scholar] [CrossRef]
  24. Babosha, A.; Kumachova, T.; Ryabchenko, A.; Komarova, G. Microrelief of the leaf epidermis and stomatal polymorphism of malus orientalis, Pyrus caucasica and Mespilus germanica in mountains and Plains. Flora 2022, 291, 152074. [Google Scholar] [CrossRef]
  25. Ameri, A.; Davarynejad, G.; Moshtaghi, N.; Tehranifar, A. SEMICOMPACT canopy form in mixoploid plants differentiated from the endosperm of Pyrus communis cv. Natanzi: Evidence from flow cytometric analysis and anatomical and morphological traits. Ann. Appl. Biol. 2020, 177, 385–394. [Google Scholar] [CrossRef]
  26. Wang, X.; Wang, H.; Shi, C.; Zhang, X.; Duan, K.; Luo, J. Morphological, cytological and fertility consequences of a spontaneous tetraploid of the diploid pear (Pyrus pyrifolia Nakai) cultivar ‘cuiguan’. Sci. Hortic. 2015, 189, 59–65. [Google Scholar] [CrossRef]
  27. Beaulieu, J.M.; Leitch, I.J.; Patel, S.; Pendharkar, A.; Knight, C.A. Genome size is a strong predictor of cell size and stomatal density in angiosperms. New Phytol. 2008, 179, 975–986. [Google Scholar] [CrossRef]
  28. Basak, S.; Sun, X.; Wang, G.; Yang, Y. Genome size unaffected by variation in morphological traits, temperature, and precipitation in Turnip. Appl. Sci. 2019, 9, 253. [Google Scholar] [CrossRef]
  29. Dušková, E.; Kolář, F.; Sklenář, P.; Rauchová, J.; Kubešová, M.; Fér, T.; Suda, J.; Marhold, K. Genome size correlates with growth form, habitat and phylogeny in the Andean genus Lasiocephalus (Asteraceae). Preslia 2010, 82, 127–148. [Google Scholar]
  30. Savaş Tuna, G.; Bbaşer, İ.; Tuna, M. Genome size variation among natural populations of Brachypodium distachyon and B. hybridum collected from different regions of Turkey. Turk. J. Bot. 2019, 43, 196–207. [Google Scholar] [CrossRef]
  31. Greilhuber, J. Intraspecific variation in genome size in angiosperms: Identifying its existence. Ann. Bot. 2005, 95, 91–98. [Google Scholar] [CrossRef]
  32. Šmarda, P.; Bureš, P. Understanding intraspecific variation in genome size in plants. Preslia 2010, 82, 41–61. [Google Scholar]
  33. Wolf, J.; Kiss, T.; Nečas, T. The use of SSRS for the identification of unknown Asian pear cultivars. Acta Hortic. 2021, 1307, 205–212. [Google Scholar] [CrossRef]
  34. Fiala, J.; Nečas, T. Asijské a mezidruhové odrůdy hrušní pro podmínky měnícího se klimatu v čr. Zahrad. = Záhradníctvo Měsíčník Pro Prof. Zahradníky. Odb. Recenzovaný Časopis 2024, XXIII, 38–43. [Google Scholar]
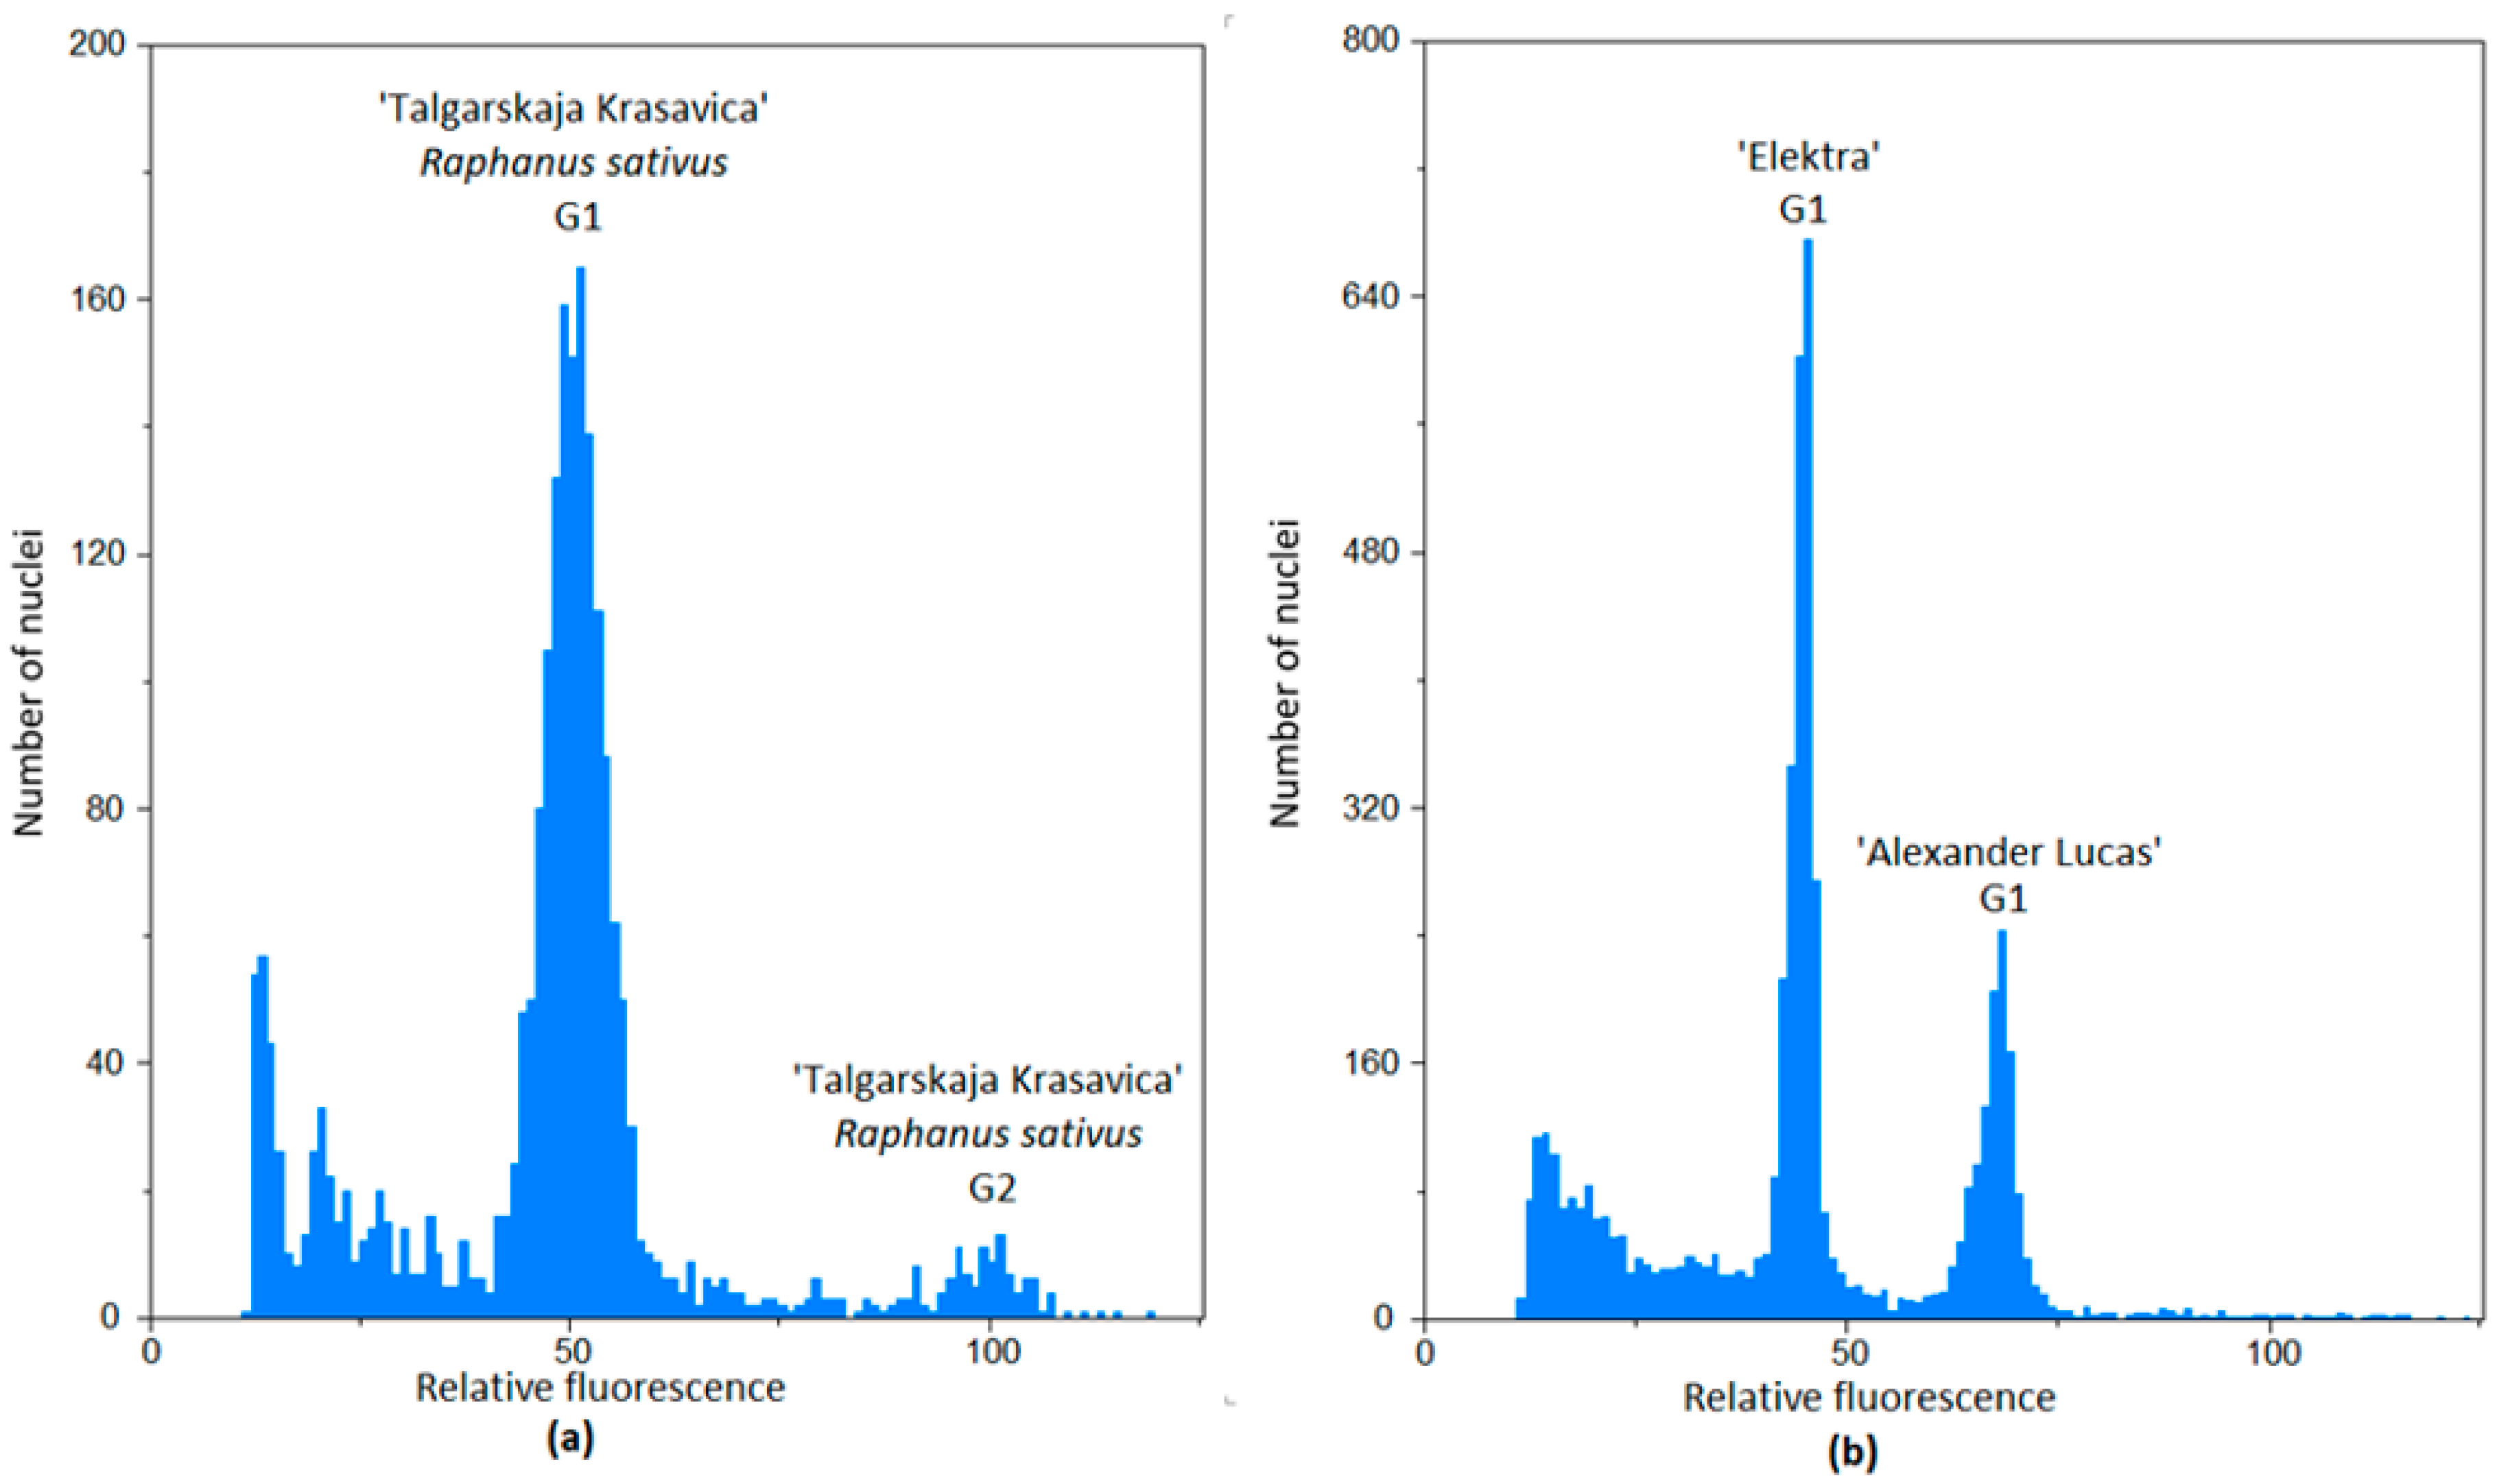
Figure 1. Raphanus sativus as an unsuitable reference for analyzing, Pyrus spp. genome size, (a) Overlapping peaks of the standard Raphanus sativus with a peak of sample of diploid “Talgarskaja krasavica’ and (b) clearly separated peaks of the diploid ‘Elektra’ and the new standard: the triploid ‘Alexander Lucas’.
Horticulturae 10 01241 g001
Figure 2. Histograms showing detection of the triploid genotype Hcer3. (a) Overlapping peaks of triploid reference ‘Alexander Luca’ and Hcer3 and (b) separate peaks of diploid ‘Conference’ and triploid hybrid Hcer3.
Horticulturae 10 01241 g002
Figure 3. Relative genome size of analyzed genotype groups. ** p < 0.01.
Horticulturae 10 01241 g003
Figure 4. Characteristics of leaf blades: (a) narrow elliptical leaf of ‘Baoshy’(P. breschneiderii), (b) round serrated leaf of ‘Nutika’ (P. pyrifolia) and (c) elliptical leaf of ‘Conference’ (P. communis).
Horticulturae 10 01241 g004
Figure 5. Average width (a) and length (b) of leaves of the selected genotype groups. ** p < 0.01.
Horticulturae 10 01241 g005
Figure 6. Average length of petioles of the selected genotype groups, ** p < 0.01.
Horticulturae 10 01241 g006
Figure 7. The flower of ‘Karina’ (a) and collection pollen grains (b).
Horticulturae 10 01241 g007
Figure 8. Illustration of measurement of the size of the pollen grains: (a) ‘Alexander Lucas’ and (b) “Talgarskaja krasavica’.
Horticulturae 10 01241 g008
Figure 9. Average length of stomata of the selected genotype groups. ** p < 0.01.
Horticulturae 10 01241 g009
Figure 10. Microscopic images of the stomata of: (a) ‘Alexander Lucas’ and (b) “Wujiuxiang’.
Horticulturae 10 01241 g010
Figure 11. Correlations found between relative genome size (Mbp) and morphological traits in analyzed genotypes: (a) length of the leaves, (b) width of the leaves, (c) diameter of the flowers and (d) length of the stomata. Red lines showing linear correlations (r) and blue circles demonstrating genotypes.
Horticulturae 10 01241 g011
Table 1. The list of genotypes analyzed in this study.
Asian VarietiesEuropean VarietiesInterspecific VarietiesEuropean Hybrids
AnhuixueliAlexander LucasBenitaHcer1
BaoshyBoscHoodHcer2
CangxixueliConferenceKiefferHcer3
DangshanshuliElektraWujiuxiangHcer4
Dong GuoKarina
Huang HuaKirgizskaja ZimnajaInterspecific HybridsBotanical Species
Chang BaKulovitaH2P. betulifolia
ChiliOharkulaH4P. calleryana
Jin HuaTalgarskaja krasavicaH7P. caucasica
Jing BaiWilliams RedH8P. communis
Mut Chen H12P. pyrifolia
Nanguoli H13P. ussuriensis
Nutika H15P. bretschneiderii
Shali H19
Shon Shu H24
Snow Flower
Xin Gao
Yali
Zaosuli
Table 2. The relative genome size and morphological characteristics of the main pear cultivar groups and botanical species.
1 Cx (Mbp)Width of the Leaves (mm)Length of the Leaves (mm)Length of the Petiole (mm)Diameter of the Flowers (mm)Length of the Pollen Grains (μm)Length of the Stomata (μm)
European564.1±2.249.0±2.884.1±2.553.4±2.834.3±1.544.5±0.531.6±0.9
Asian553.4±0.977.6±2.4121.1±4.464.9±2.736.8±0.945.9±1.328.4±0.6
Interspecific557.5±1.763.3±2.7101.0±3.254.7±2.434.3±1.343.5±1.231.4±0.7
P. betulifolia571.7±0.956.4±0.783.2±4.745.8±4.225.8±0.6 N 28.0±0.8
P. calleryana554.2±1.548.4±1.784.2±2.152.8±2.323.3±0.641.5±0.528.0±1.3
P. caucasica542.5±0.654.8±2.166.0±2.556.2±3.635.0±0.543.6±0.731.1±0.5
P. communis559.1±1.543.6±0.955.6±1.944.8±1.628.6±0.846.9±1.034.2±1.2
P. pyrifolia553.1±2.267.2±2.0104.6±3.449.8±2.431.0±0.7 N 26.0±0.9
P. ussuriensis560.7±1.167.0±1.189.0±0.761.6±1.331.7±0.9 N 35.1±1.1
P. bretschneiderii558.1±3.534.8±1.785.8±1.845.0±1.529.6±0.4 N 28.5±0.8
1Cx (Mbp) = monoploid DNA continent (mega base pairs). Pollen grains: N = not measurable.
Table 3. The relative genome size and morphological characteristics of all evaluated traits for each variety or new hybrid.
Origin **CV (s)CV (ref)2C (pg DNA)1Cx (Mbp)Width of the Leaves (mm)Length of the Leaves (mm)Length of the Petiole (mm)Diameter of the Flowers (mm)Length of the Pollen Grains (µm)Length of the Stomata (µm)
Alexander Lucas *E5.14.91.75±0.009569.4±2.949.2±1.190.6±3.851.6±2.633.0±1.046.6±0.937.2±1.2
AnhuixueliA4.33.21.14±0.002557.1±1.160.2±1.4114.0±2.862.0±2.632.8±0.438.6±1.927.6±0.8
BaoshyA3.93.11.13±0.002551.0±1.261.8±1.8114.0±6.349.0±3.138.2±1.048.5±1.128.2±1.2
BenitaI4.43.41.12±0.001547.5±0.446.8±1.583.0±2.560.8±2.232.7±0.643.8±1.229.0±1.1
BoscE3.63.21.16±0.002565.4±1.054.8±1.985.0±1.551.8±4.041.5±0.744.9±2.332.5±1.0
CangxixueliA3.82.81.12±0.003549.3±1.669.6±2.1146.6±4.883.6±4.838.6±0.838.1±0.630.1±0.6
ConferenceE2.82.11.16±0.004565.6±1.946.4±2.583.6±2.752.8±5.227.1±0.642.3±1.031.1±1.6
DangshanshuliA3.92.91.14±0.001557.7±0.487.8±0.5104.4±2.978.4±2.934.9±0.748.8±1.426.0±1.0
Dong GuoA4.84.11.13±0.003551.3±1.679.0±1.6126.0±4.455.4±7.442.2±1.048.2±1.130.7±0.8
ElektraE3.63.61.15±0.001562.7±0.242.2±1.268.8±0.737.0±2.336.7±0.743.6±1.234.0±0.6
HoodI3.32.91.14±0.001559.0±0.351.6±2.6102.6±2.957.0±2.328.7±0.639.2±0.728.3±1.1
Huang HuaA3.42.81.13±0.004550.3±1.882.2±2.1135.8±1.763.8±1.234.2±0.347.3±0.932.9±1.0
Chang BaA3.23.01.13±0.002552.9±0.774.6±1.5118.2±2.576.2±2.441.8±0.648.0±0.729.1±0.8
ChiliA4.12.91.13±0.002551.4±1.082.6±2.9126.4±5.272.6±5.040.6±0.537.7±1.331.4±1.4
Jin HuaA4.33.41.12±0.001549.5±0.7105.6±6.7181.6±8.274.8±3.343.3±0.847.7±0.625.5±0.7
Jing BaiA4.53.41.14±0.003557.5±1.572.6±0.9106.2±3.577.8±3.830.4±0.739.0±1.628.8±1.3
KarinaE4.94.11.16±0.002567.2±1.036.2±1.387.2±3.041.8±6.123.5±0.545.3±0.827.9±1.4
KiefferI3.12.71.15±0.002562.1±1.258.6±1.793.8±2.341.6±1.232.9±0.541.8±0.928.6±1.1
Kirgizskaja ZimnajaE3.53.21.14±0.001559.3±0.645.2±0.293.0±1.559.2±2.729.4±0.5 N 27.7±1.6
KulovitaE3.22.71.15±0.002560.7±0.935.6±0.975.0±1.651.8±6.037.8±1.047.6±1.231.6±1.1
Mut ChenA4.43.31.14±0.000557.9±0.268.8±0.9103.2±4.160.2±2.734.6±0.641.0±1.228.0±1.3
NanguoliA4.13.51.15±0.002562.0±1.268.6±2.4110.4±2.470.0±1.837.8±1.342.7±0.729.0±0.8
NutikaA3.72.71.12±0.002549.2±0.880.4±1.4105.2±3.949.0±3.435.9±0.7 N 26.9±1.1
OharkulaE4.43.21.13±0.002555.0±1.256.4±1.083.0±2.868.0±3.837.1±1.543.0±0.828.4±1.4
ShaliA4.84.91.14±0.001556.3±0.677.4±1.8121.2±2.658.0±4.336.1±1.049.2±0.928.3±0.8
Shon ShuA3.92.81.14±0.001558.1±0.785.0±3.5117.0±4.074.2±7.328.0±0.447.9±1.227.7±1.4
Snow FlowerA4.83.51.13±0.002550.9±1.185.0±2.8110.4±1.568.8±5.237.0±0.449.8±1.022.1±0.7
Talgarskaja krasavicaE4.33.21.15±0.002563.3±1.065.4±1.2101.0±3.549.0±2.439.1±0.841.3±1.530.9±1.1
Williams RedE2.92.51.15±0.002562.2±1.241.2±3.091.2±2.340.6±4.429.6±0.744.4±0.529.2±1.4
WujiuxiangI3.52.61.15±0.001562.7±0.469.6±2.9120.0±11.749.6±5.131.4±0.646.3±1.328.3±1.2
Xin GaoA3.83.21.12±0.003547.1±1.780.2±1.5100.0±2.543.0±1.735.2±0.659.0±0.829.7±0.6
YaliA4.23.21.13±0.001551.3±0.381.6±2.2131.0±2.765.6±3.141.5±1.348.2±0.930.7±1.2
ZaosuliA4.53.81.13±0.001554.3±0.671.8±2.0130.2±3.551.2±3.636.5±0.545.8±1.126.6±0.8
Hcer1E3.22.61.13±0.003550.8±1.448.2±1.982.2±3.253.4±1.735.0±0.745.0±1.026.9±0.7
Hcer2E4.13.91.13±0.002551.4±1.056.4±1.275.4±3.657.2±3.438.4±0.542.0±1.231.7±1.6
Hcer3*E2.02.71.79±0.009584.2±3.065.2±1.583.6±1.971.4±3.738.1±0.946.1±1.438.6±0.7
Hcer4E4.73.51.16±0.001567.5±0.443.2±1.175.4±1.662.4±2.034.8±0.845.8±0.730.0±1.0
H2I3.32.81.15±0.002560.5±0.959.2±2.294.8±1.246.4±3.532.9±0.7 N 34.5±1.4
H4I3.72.61.13±0.003552.8±1.558.8±2.285.8±4.446.4±4.944.0±0.740.6±1.235.4±1.4
H7I3.82.71.14±0.003556.3±1.684.8±1.5111.6±2.254.0±3.038.2±0.647.5±0.732.6±1.0
H8I4.23.11.13±0.001551.8±0.469.6±1.7108.4±2.060.2±3.632.5±0.5 N 33.1±1.3
H12I3.82.91.13±0.001553.1±0.770.0±2.3118.0±5.855.2±4.138.0±0.648.3±1.131.7±1.0
H13I3.02.61.15±0.002562.5±1.167.8±2.0105.6±3.457.8±1.636.2±0.540.7±0.831.7±1.4
H19I5.14.81.15±0.001562.8±0.569.4±2.993.2±3.757.8±4.038.4±0.7 N 34.1±1.9
H24I4.23.01.16±0.001566.5±0.755.6±2.093.2±3.275.8±3.725.8±0.8 N 30.0±1.0
* Triploid. ** Origin: E = European, A = Asian, I = interspecific. CV = coefficient of variation; 2C (pg DNA) = amount of DNA in diploid set of chromosomes (picograms); 1Cx (Mbp) = monoploid DNA continent (mega base pairs). Pollen grains: N = not measurable.
Table 4. Statistically significant differences (p < 0.05) in genome size, leaf width and length, length of petiole and stomatal size.
MbpWidth of the LeavesLength of the LeavesLength of the PetioleDiameter of the FlowersLength of the Pollen GrainsLength of the Stomata
p0.00004<10−8<10−70.0050.20.70.002
Table 5. Correlation coefficients of analysis of selected traits statistically significant correlations.
Width of the Leaves (mm)Length of the Leaves (mm)Length of the Petiole (mm)Diameter of the Flowers (mm)Length of the Stomata (µm)
Mbp−0.4683−0.4947−0.1029−0.31980.4210
Disclaimer/Publisher’s Note: The statements, opinions and data contained in all publications are solely those of the individual author(s) and contributor(s) and not of MDPI and/or the editor(s). MDPI and/or the editor(s) disclaim responsibility for any injury to people or property resulting from any ideas, methods, instructions or products referred to in the content.