Article

The Perfect Match: Testing the Effect of Increasing Red and Blue Ratio on Baby-Leaf Kale Growth, Yield and Physiology

1
DISTAL—Department of Agricultural and Food Sciences, Alma Mater Studiorum—University of Bologna, Viale Giuseppe Fanin 44, 40127 Bologna, Italy
2
IVL Swedish Environmental Research Institute, Valhallavägen 81, 114 28 Stockholm, Sweden
3
KTH-SEED—Department of Sustainable Development, Environmental Science and Engineering, KTH Royal Institute of Technology, Teknikringen 10b, 114 28 Stockholm, Sweden
4
Flytech s.r.l., 32016 Belluno, Italy
*
Author to whom correspondence should be addressed.
Horticulturae 2024, 10(11), 1134; https://doi.org/10.3390/horticulturae10111134
Submission received: 29 September 2024 / Revised: 16 October 2024 / Accepted: 17 October 2024 / Published: 24 October 2024
(This article belongs to the Special Issue Indoor Farming and Artificial Cultivation)

Abstract

:
Within the current scenario of cropland use and forest surface loss, there is a need for the implementation of viable urban farming systems, e.g., indoor vertical farming (VF). Light management is fundamental in VF, although responses to light spectra are often species-specific. As the interest of consumers and farmers towards baby-leaf vegetables has recently increased, this study aimed at assessing the most effective red:blue (RB) ratio for enhanced baby-leaf production of kale (Brassica oleracea). Within an ebb-and-flow system, increasing RB ratios (RB3, RB5, RB7 and RB9) were tested, sharing a photoperiod of 16 h day−1 and a light intensity of 215 μmol m−2 s−1. A larger yield was obtained for plants under RB5, featuring an intermediate B fraction compared to other treatments, with plants displaying more expanded and thinner leaves. Also, for lighting energy and cultivated surface use efficiency, RB5 was the most effective treatment, performing up to 57 g FW kWh−1 and 54 kg FW m−2 y−1, respectively. From multispectral data, a tendency of reduced Fv/Fm and Fq′/Fm′ was observed as the RB ratio increased, while the chlorophyll index was enhanced under RB ≥ 7. This study highlighted the light recipe with an RB ratio of 5 as the most effective lighting mixture for optimal baby-leaf kale production in terms of balanced growth, resource use efficiency and yield.

Graphical Abstract

1. Introduction

Urban agriculture (UA) allows for the exploitation of urban or peri-urban areas for food production [1], potentially reducing the burden on natural lands from their traditional agricultural use. The total cropland area has seen a rise from the beginning of the 21st century, with an increase of 80 million ha, which, in 2022, was roughly 12% of the world’s total land area [2]. Additionally, this increase represented a loss equal to 80% of forest land area in the last two decades, consisting of 100 million ha [2]. Taking these figures into consideration, finding solutions to produce crops with less land through, e.g., a novel UA system, is of importance.
A range of diversified typologies of UA systems can be implemented, featuring different degrees of automation or space needed, with technological innovation exploring rooftop farming systems (such as open-air farms or building-integrated greenhouses) or fully indoor technologies, e.g., vertical farming (VF) systems [3]. VF consists of closed plant production systems, where adopted technologies include artificial lighting, controlled climate and soilless cultivation techniques with closed-loop irrigation systems for plant growth, and allow for complete insulation from the external environment [4]. The term vertical is used, as these spaces are designed with multi-layer cultivation structures able to remarkably surge crop production available area, taking advantage of buildings’ height and reducing the effective land use [5,6]. Additionally, the possibility of profiting from vacant buildings, parking lots located underground, as well as warehouses, basements or shipping containers located in urban areas [7,8] further supports the strength of UA in maximizing the so-called surface use efficiency (SUE), an indicator of the food productive capacity of a unit of land occupied for production. Hence, the traditional idea of employing cropland for agricultural purposes is shifted towards the concept of “zero-acreage farming” (Z-Farming) to re-design and re-purpose unused urban spaces [9,10].
As mentioned, artificial lighting is one of the fundamental components of VF, replacing natural sunlight. In VF, commonly adopted horticultural lighting technologies are light-emitting diodes (LEDs) [11]. LEDs allow for accurate management of light properties (namely intensity, photoperiod and quality) that plants can perceive [12] due to the wide family of specialized plant photoreceptors able to translate light signals into reactions [13]. Considering the light quality or spectrum, plants provide specific responses according to the different wavelengths emitted. Within the traditionally defined photosynthetically active radiation (PAR, 400–700 nm), the most absorbed wavebands are the blue (B, 400–500 nm) and red (R, 600–700 nm) regions, where the absorbance peaks of chlorophyll pigments match [14,15]. For this reason, different combinations of red and blue (RB) wavelengths are among the most employed light recipes in VF, contributing to balanced plant growth. However, since species-specific responses to light quality exist, it is crucial to identify and comprehend the effects of different spectral compositions for any crop where commercial interest in VF emerges [15].
As reported by Kozai and Niu [16], for VF, economically viable crops commonly include leafy greens and herbs (especially lettuce). This is due to the elevated harvest index (HI, resulting from the ratio of edible plant portion over its total biomass) of these crops, which therefore allows for optimizing the exploitation of the energy received. Energy requirements in a vertical farm are significant, which, for lighting needs, can account for 50% [17] to 70% [18] of energy requirements. The rest is mostly associated with climatic control, with an overall energy expenditure that may represent about 40% of the whole production cost [18]. To increase VF energy use efficiency, strategies to reach a higher production should be combined, for instance, altering the lighting. The choice then goes to short-cycled compact plants (e.g., for the baby-leaf or ready-to-eat sector) that allow to fit the numerous stacked layers, granting a high cultivation density and allowing for multiple harvests throughout the year.
Ready-to-eat salads are highly requested by consumers, with a tendency to increase in the coming years [19]. In addition, the aforementioned high HI of baby-leaf vegetables [20] makes them a promising crop for VF. In order to improve product diversification, the present research addressed the effects of multiple combinations of red and blue light on baby-leaf kale (Brassica oleracea. cv. ‘Baby Kale #4.51). The analysis of productive features was combined with the identification of light-induced physiological responses and the assessment of resource (surface and lighting) use efficiency with the aim of identifying the spectrum that would allow for best performances.

2. Materials and Methods

2.1. Experimental Settings and Design

The experimental trial was carried out in AlmaVFarm, the experimental vertical farm of the Department of Agricultural and Food Sciences of the University of Bologna (Bologna, Italy). All the specific characteristics and designs of the structure are available in Carotti et al. [21]. During the cultivation period, the relative humidity of the facility was kept at 65/70 ± 10% day/night, respectively, while the temperature was set at 24/21 ± 1 °C day/night. Moreover, supplemental CO2 was provided in the room to maintain a constant concentration equal to 850 ppm.
An ebb-and-flow soilless system was used for the experiment and included 4 sectors with a 3-level stacked cultivation tray scheme (with each tray having a surface of 0.53 m2). The system featured a closed-loop water cycle: nutrient solution from the main tank circulated once a day for 10 min, flooding each tray and, when not absorbed by plants or substrate, returned to the main tank. The electrical conductivity (EC) and pH parameters of nutrient solution were checked 5 times per week manually with a tester (HI98130, Hanna instruments Italia Srl, Ronchi di Villafranca Padovana, Italy) in the main tank and accordingly adjusted to maintain the setting value of 2.3 dS m−1 and a 5.8 for EC and pH parameters, respectively. The nutrient solution formulation used for the whole growing cycle had the following composition: N-NO3: 15.44 mM, N-NH4: 1.93 mM, P: 1.93 mM, K: 9.65 mM, S-SO4: 2.32 mM, Ca: 4.34 mM, Mg: 0.97 mM, Fe: 45.7 μM, Cu: 15.1 μM, Zn: 14.8 μM, B: 30.0 μM, Mn: 46.3 μM, Mo: 0.7 μM.
Kale seeds (Brassica oleracea. cv. ‘Baby Kale #4.51, Smarties.bio, Chioggia, Italy) were sown in 240-hole (31 × 53 × 3.7 cm) polystyrene trays filled with sterilized preformed peat and coco coir plugs (Jiffy Group, Zwijndrecht, The Netherlands), adopting a planting density of 1460 plants m−2. One polystyrene tray per layer was placed under a LED lamp. After sowing, trays were placed inside the vertical farm until harvest, which was carried out 21 days after sowing (DAS), at the baby-leaf production size.

2.2. Light Treatments: Intensity, Quality and Photoperiod Properties

Four different lighting spectra were provided by dimmable LED fixtures (Flygrow®, Flytech srl, Belluno, Italy) from the beginning of the cycle (0 DAS). Each light treatment was replicated over 3 trays. In particular, the light spectra were characterized by only applying R (peak at 663 nm) and B (peak at 470 nm) wavelengths, obtaining selected RB increasing ratios: RB 3:1 (RB3), RB 5:1 (RB5), RB 7:1 (RB7) and lastly RB 9:1 (RB9) (Figure 1). Before the beginning of the trial, a manual illuminance spectrophotometer was used to determine the spectral properties (CL-500A, Konica Minolta, Chiyoda, Tokyo, Japan) of each treatment. Photoperiod (expressed as the duration of light in a day, h day1) and light intensity (expressed by the photosynthetic photon flux density, PPFD, in μmol m2 s1) were shared by all lighting treatments and equal to 16 h day1 and 215 μmol m−2 s−1, respectively. PPFD was accurately measured using a PAR meter (Apogee Instruments, Logan, UT, USA).

2.3. Morphological Measurements

Measurements were carried out at final harvest (21 DAS), and from each tray, five plots measuring 20.5 × 5 cm each (equal to 102.5 cm2) and hosting 16 plants were considered as a sampling area. Therefore, a total of 15 sampling plots per treatment were considered. For each plot, the plant fresh weight (FW, g FW plant1) was obtained, and consequently, the final fresh yield (expressed in kg FW m2) was calculated. Afterwards, the dry weight (DW, g DW plant1) was acquired after 72 h at 65 °C in a laboratory drying oven. Accordingly, dry matter content (DMC) was calculated as the ratio between dry and fresh biomass and expressed as a percentage (%). Leaf area (LA, cm2 plant1) was obtained using the open software Easy Leaf Area, developed by the University of California (USA) [22]. Specific leaf area (SLA) was calculated as the ratio of LA to leaf DW (cm2 g1 DW). Lastly, light use efficiency (LUE) was assessed as the relation of shoot DW biomass to the amount of light emitted by LEDs throughout the cultivation and expressed as g DW mol1.

2.4. Physiological Measurements

Physiological data were collected at final harvest (21 DAS) through a Plant Explorer Pro+ device (PhenoVation B.V., Wageningen, The Netherlands), enabling the gathering of plant multispectral images. After the border plants were removed, the entire cultivation tray was placed inside the device. After dark adaptation (15 min), firstly, maximal efficiency of photosynthesis of photosystem II (PSII), namely Fv/Fm, was obtained. Afterwards, PSII quantum efficiency (Fq′/Fm′) and chlorophyll index in light-adapted crops were recorded. Chlorophyll index measurement is based on the formulas developed by Gitelson et al. [23] through filters interchanging in front of the camera to measure both the near-infrared (NIR) and red-edge spectra, from which the index is then calculated. Data and images obtained were then examined and developed using the Plant Explorer Data Analysis Software Version 5.8.0 beta-64b. For each tray, one image and one value for each parameter were obtained, as the software provided averaged data for the canopy.

2.5. Resource Use Efficiency

Energy consumption for each light spectrum supplied was measured (Table 1). Lighting-energy use efficiency (L-EUE) was then calculated according to the crop cycle length, the final yield obtained and the total electricity consumption of the lamps. L-EUE was expressed as g FW kWh1. Lastly, cultivated surface use efficiency (SUE) was determined as well by calculating the potential achievable yield (all aerial biomass except for cotyledons) in AlmaVFarm per unit of the cultivated surface (42.93 m2) over one year for a total of 17 subsequential growing cycles and normalized per unit surface to be expressed as kg FW m2 y1. Non-edible biomass (cotyledons and roots) was processed as a waste. The 17 cultivation cycles allow 8 buffer days per year, which translates into half a daytime for each cycle for maintenance (such as cleaning and operational tasks for running the new cycle again).

2.6. Statistical Analysis

For morphological measurements, the experimental sampling units consisted of 5 plots with a dimension of 20.5 × 5 cm, 102.5 cm2 each, located in the central areas of the tray, avoiding border plants. As each sampling plot included 16 plants, data were normalized and reported per plant. For multispectral data, the entire canopy without border plants was considered, providing average data from three replicate trays per LED treatment. Normally distributed data were analyzed by one-way ANOVA using R Studio software (version 4.1.2). Significant differences were analyzed between the different light treatments and tested by the Tukey test at 95% confidence. Instead, as DMC results were not normally distributed, the Kruskal–Wallis test was performed and Dunn’s test with Bonferroni correction was used as a post hoc method to separate the means at 95% confidence.

3. Results

3.1. Plant Growth and Resource Use Efficiency

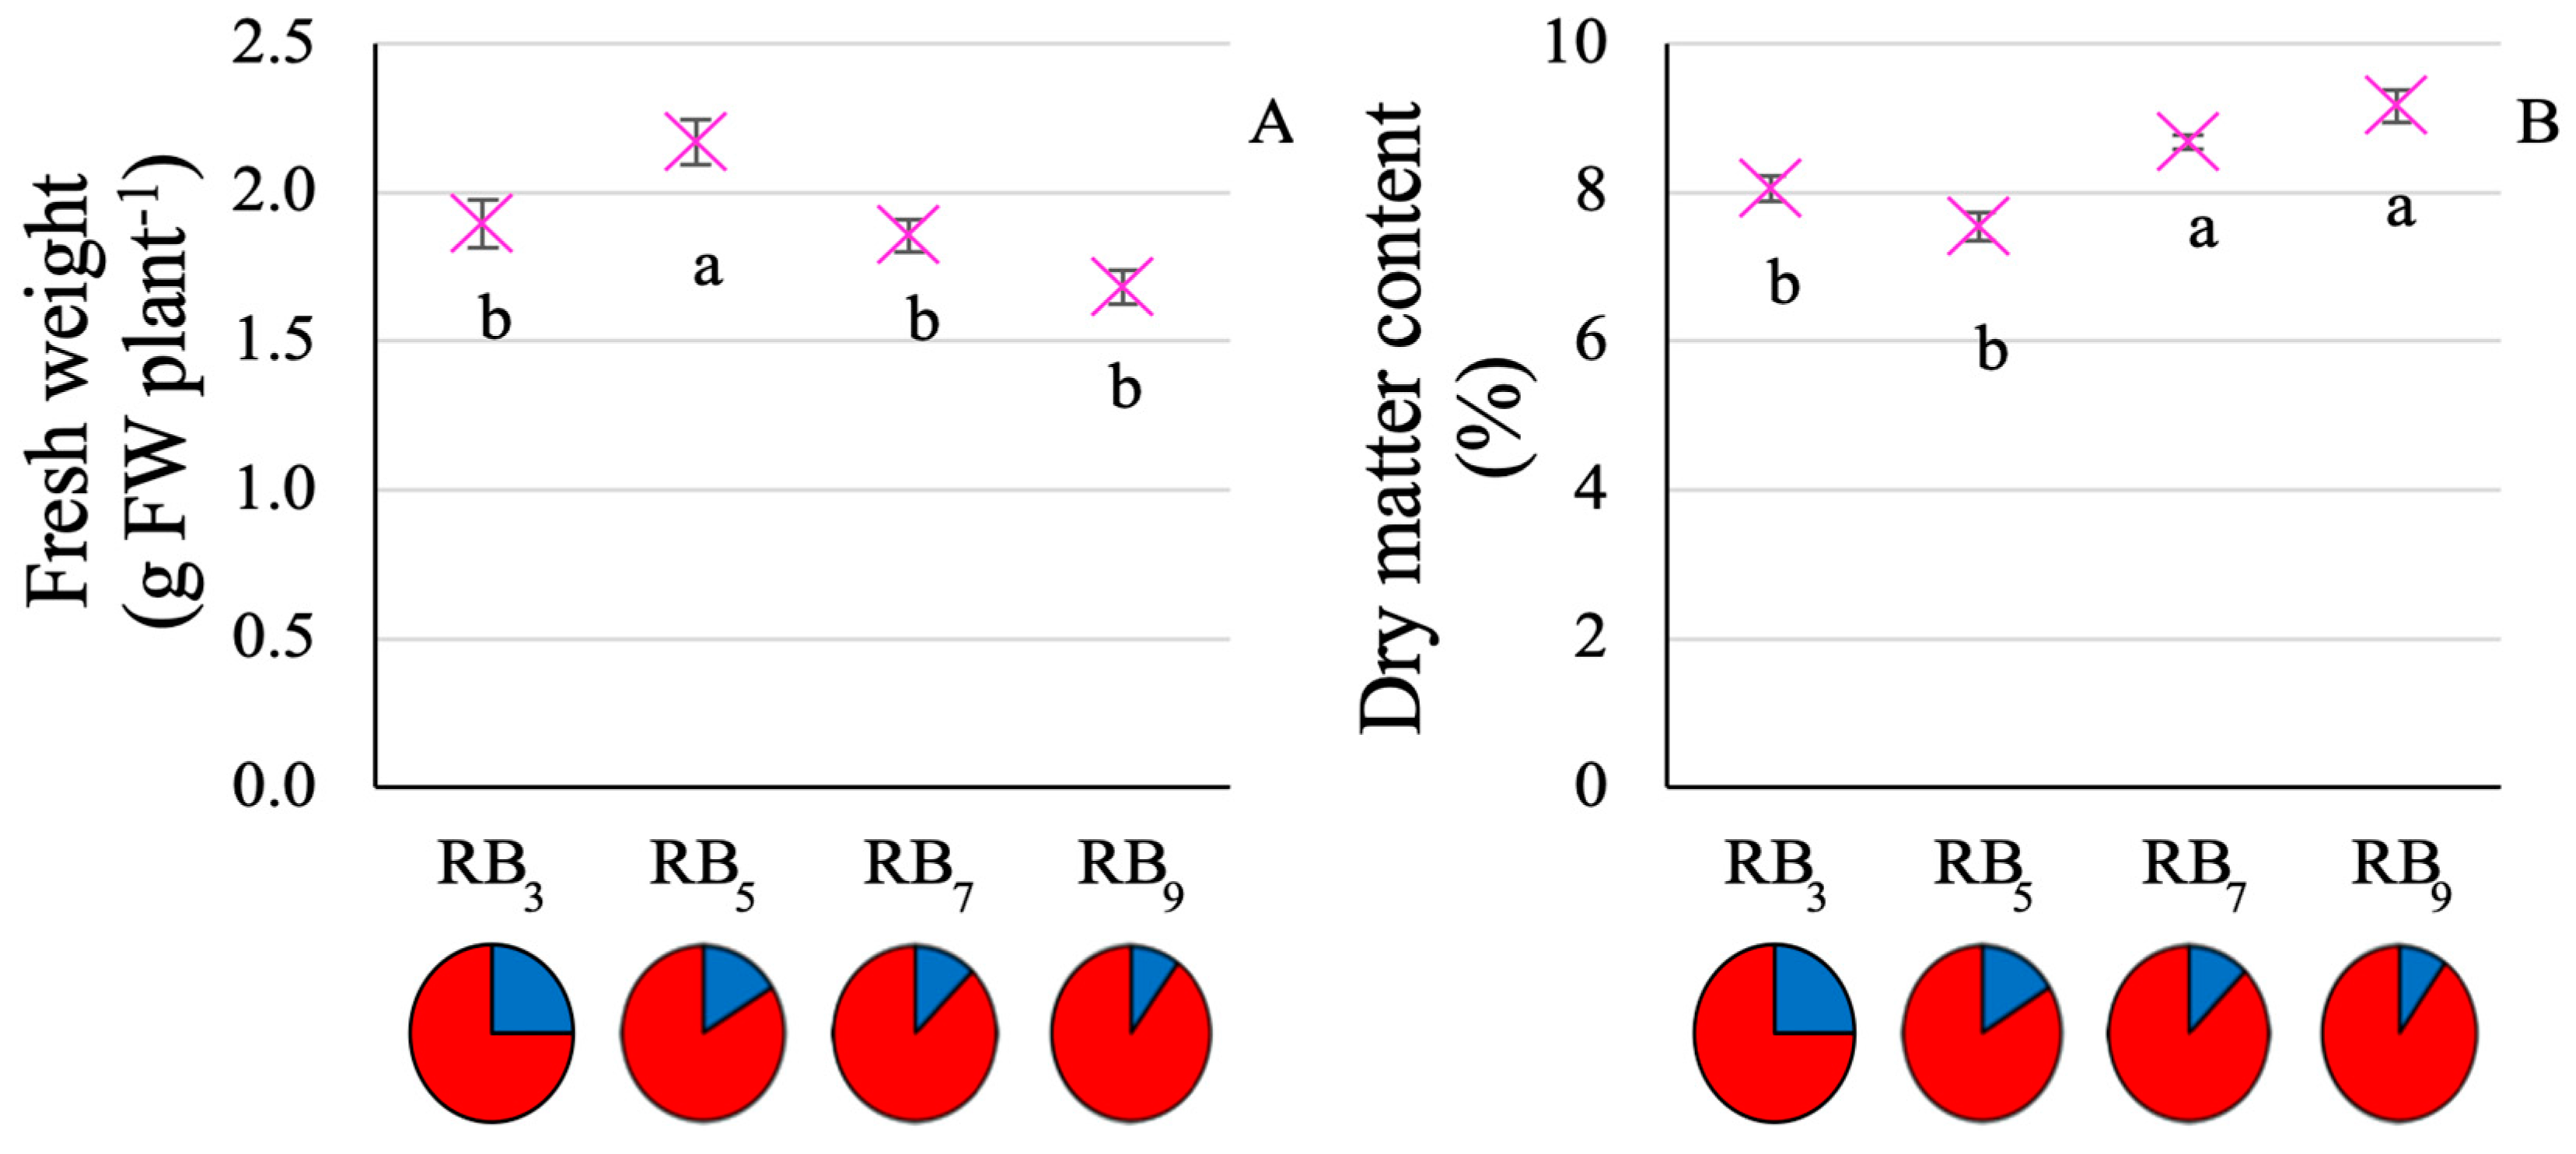
In terms of biomass produced, the highest values were associated with RB5 (2.2 g FW plant1), which resulted in a +20% increase as compared with other treatments (on average 1.8 g FW plant1) (Figure 2A). Conversely, DMC was increased when the RB ratio was higher than 7 (average value 8.9%), registering a +14% increase compared to a lower RB ratio (Figure 2B).
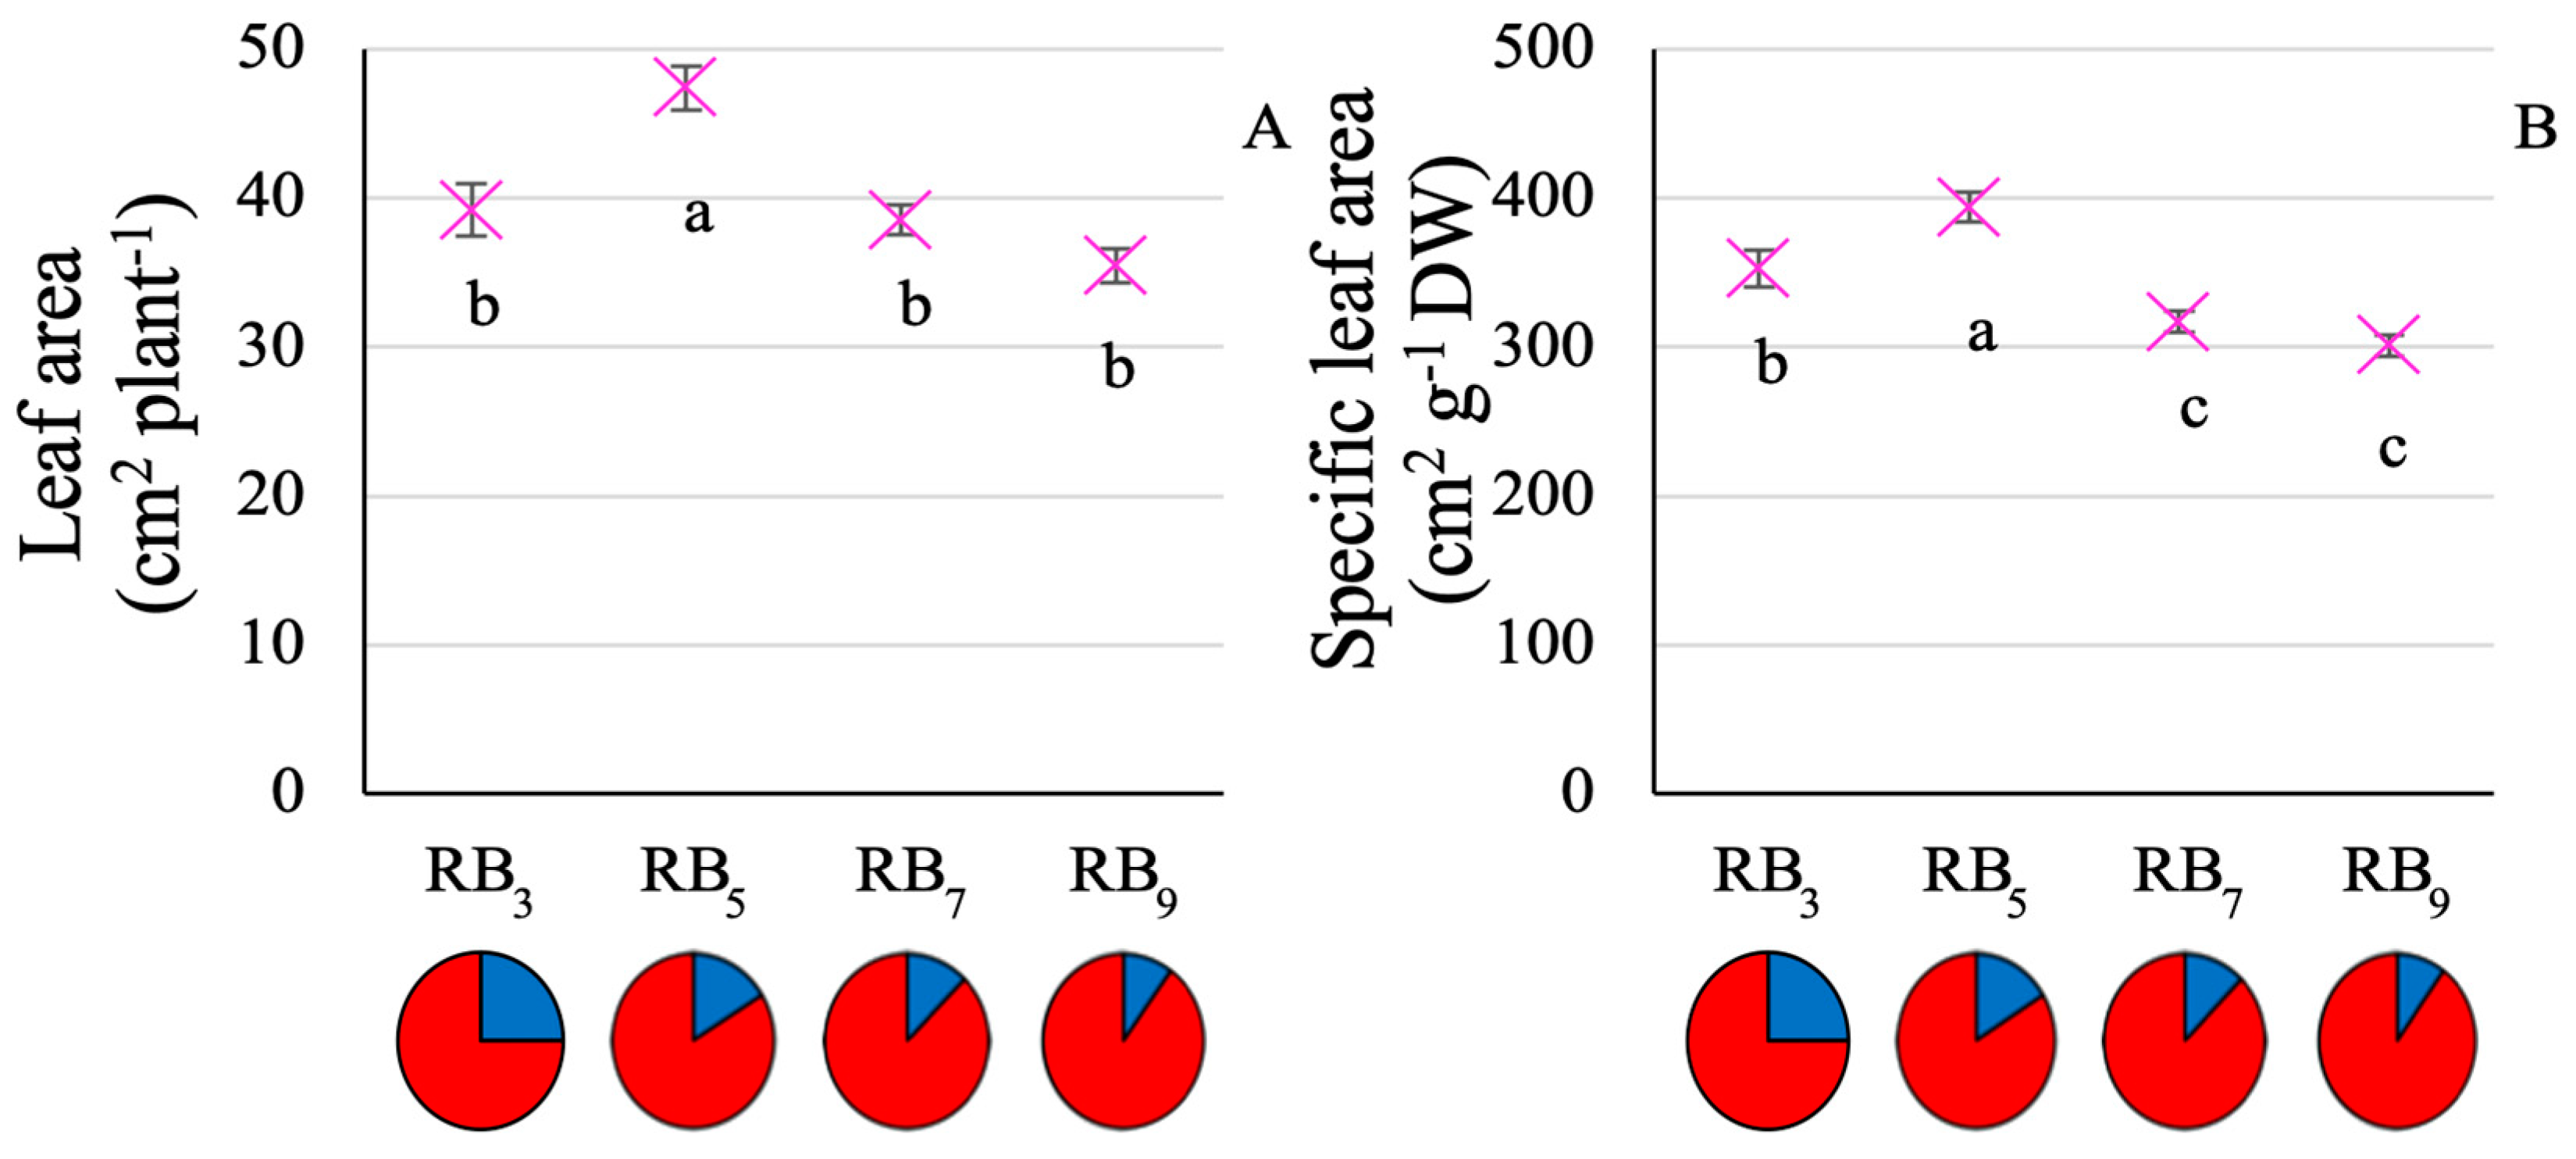
Considering leaf expansion and architecture, the RB5 light recipe influenced the most LA and SLA figures, resulting, respectively, in values up to 47.4 cm2 plant1 (Figure 3A) and 394 cm2 g1 DW (Figure 3B). LA showed the same tendency of yield, with comparable values obtained for RB3 and RB ≥ 7 (mean of 37.7 cm2 plant1) (Figure 3A). Instead, for SLA, the RB3 treatment displayed an intermediate result compared to RB5 and RB ≥ 7, with significant differences among them: RB5 registered a +12% compared to RB3 and up to +28% in relation to average values from RB7 and RB9 (Figure 3B).
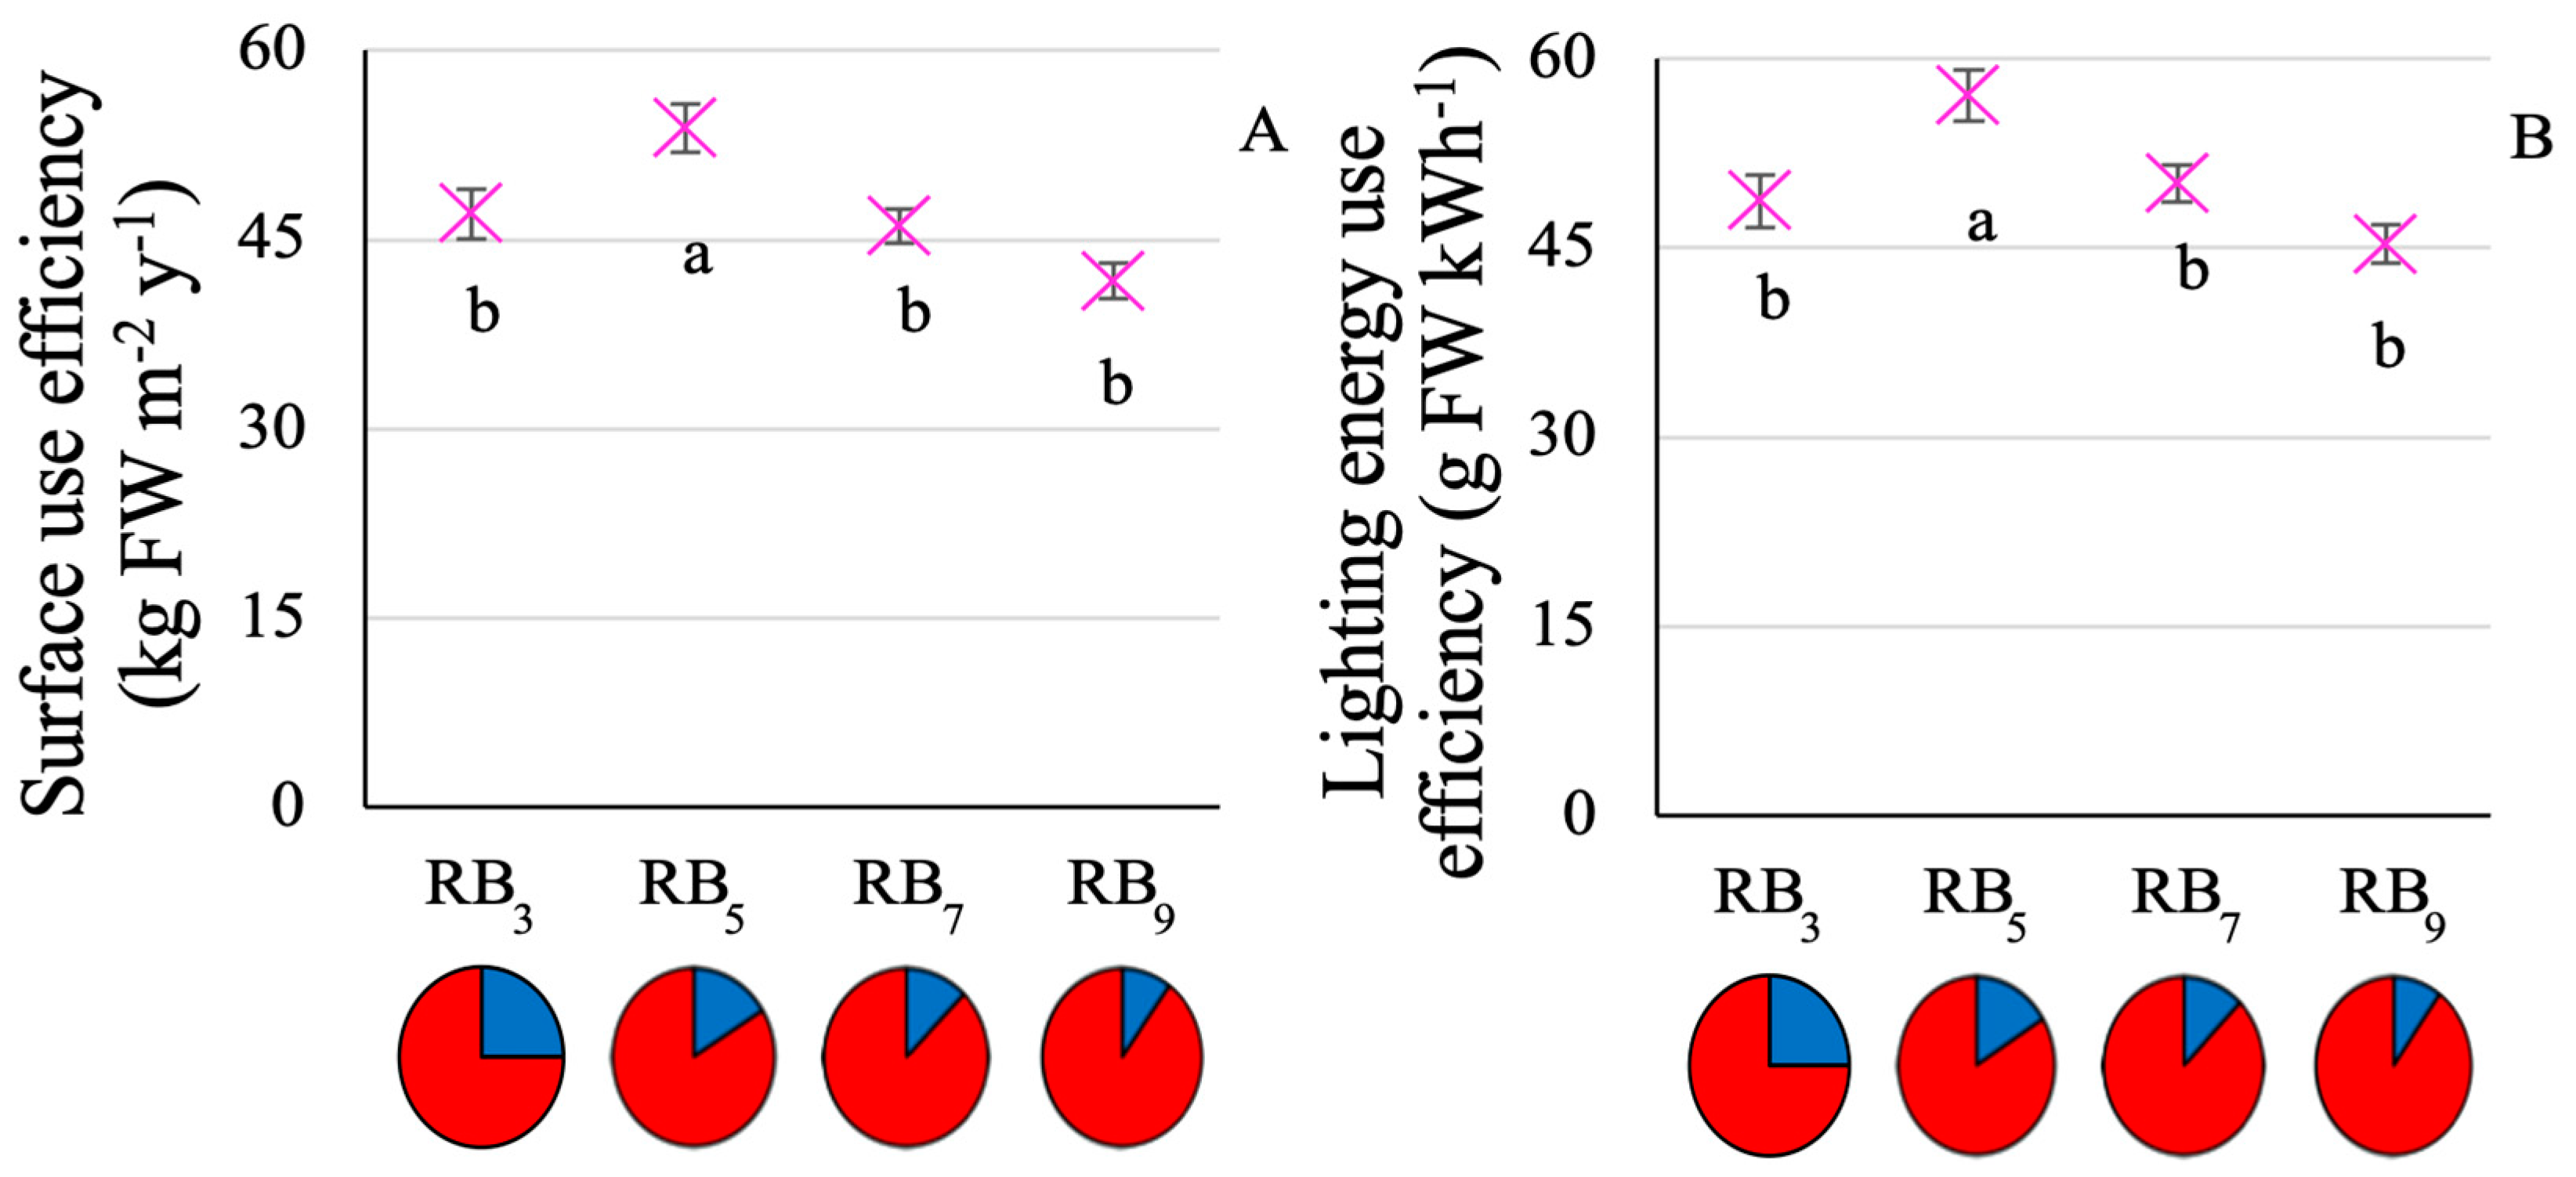
In terms of resources use efficiency, L-EUE and SUE presented an equal trend. As a consequence of yearly yield, the maximum SUE obtained with RB5 resulted in 54 kg FW m2 y1 against a mean of 45 kg FW m2 y1 for the other light recipes (Figure 4A). For L-EUE, higher values were detected again with RB5 (57.1 g FW kWh1) compared to RB3, RB7 and RB9 (average L-EUE of 48 g FW kWh1) (Figure 4B). However, if efficiency in using lighting energy to produce fresh biomass highlighted RB5 as the most effective light treatment, the observed opposite trend associated with differences in dry matter percentage resulted in a similar efficiency in using incident light for growth across treatments, with LUE data featuring non-significant differences (average of 0.66 g DW mol−1, Table S1).

3.2. Physiological Results: Multispectral Data

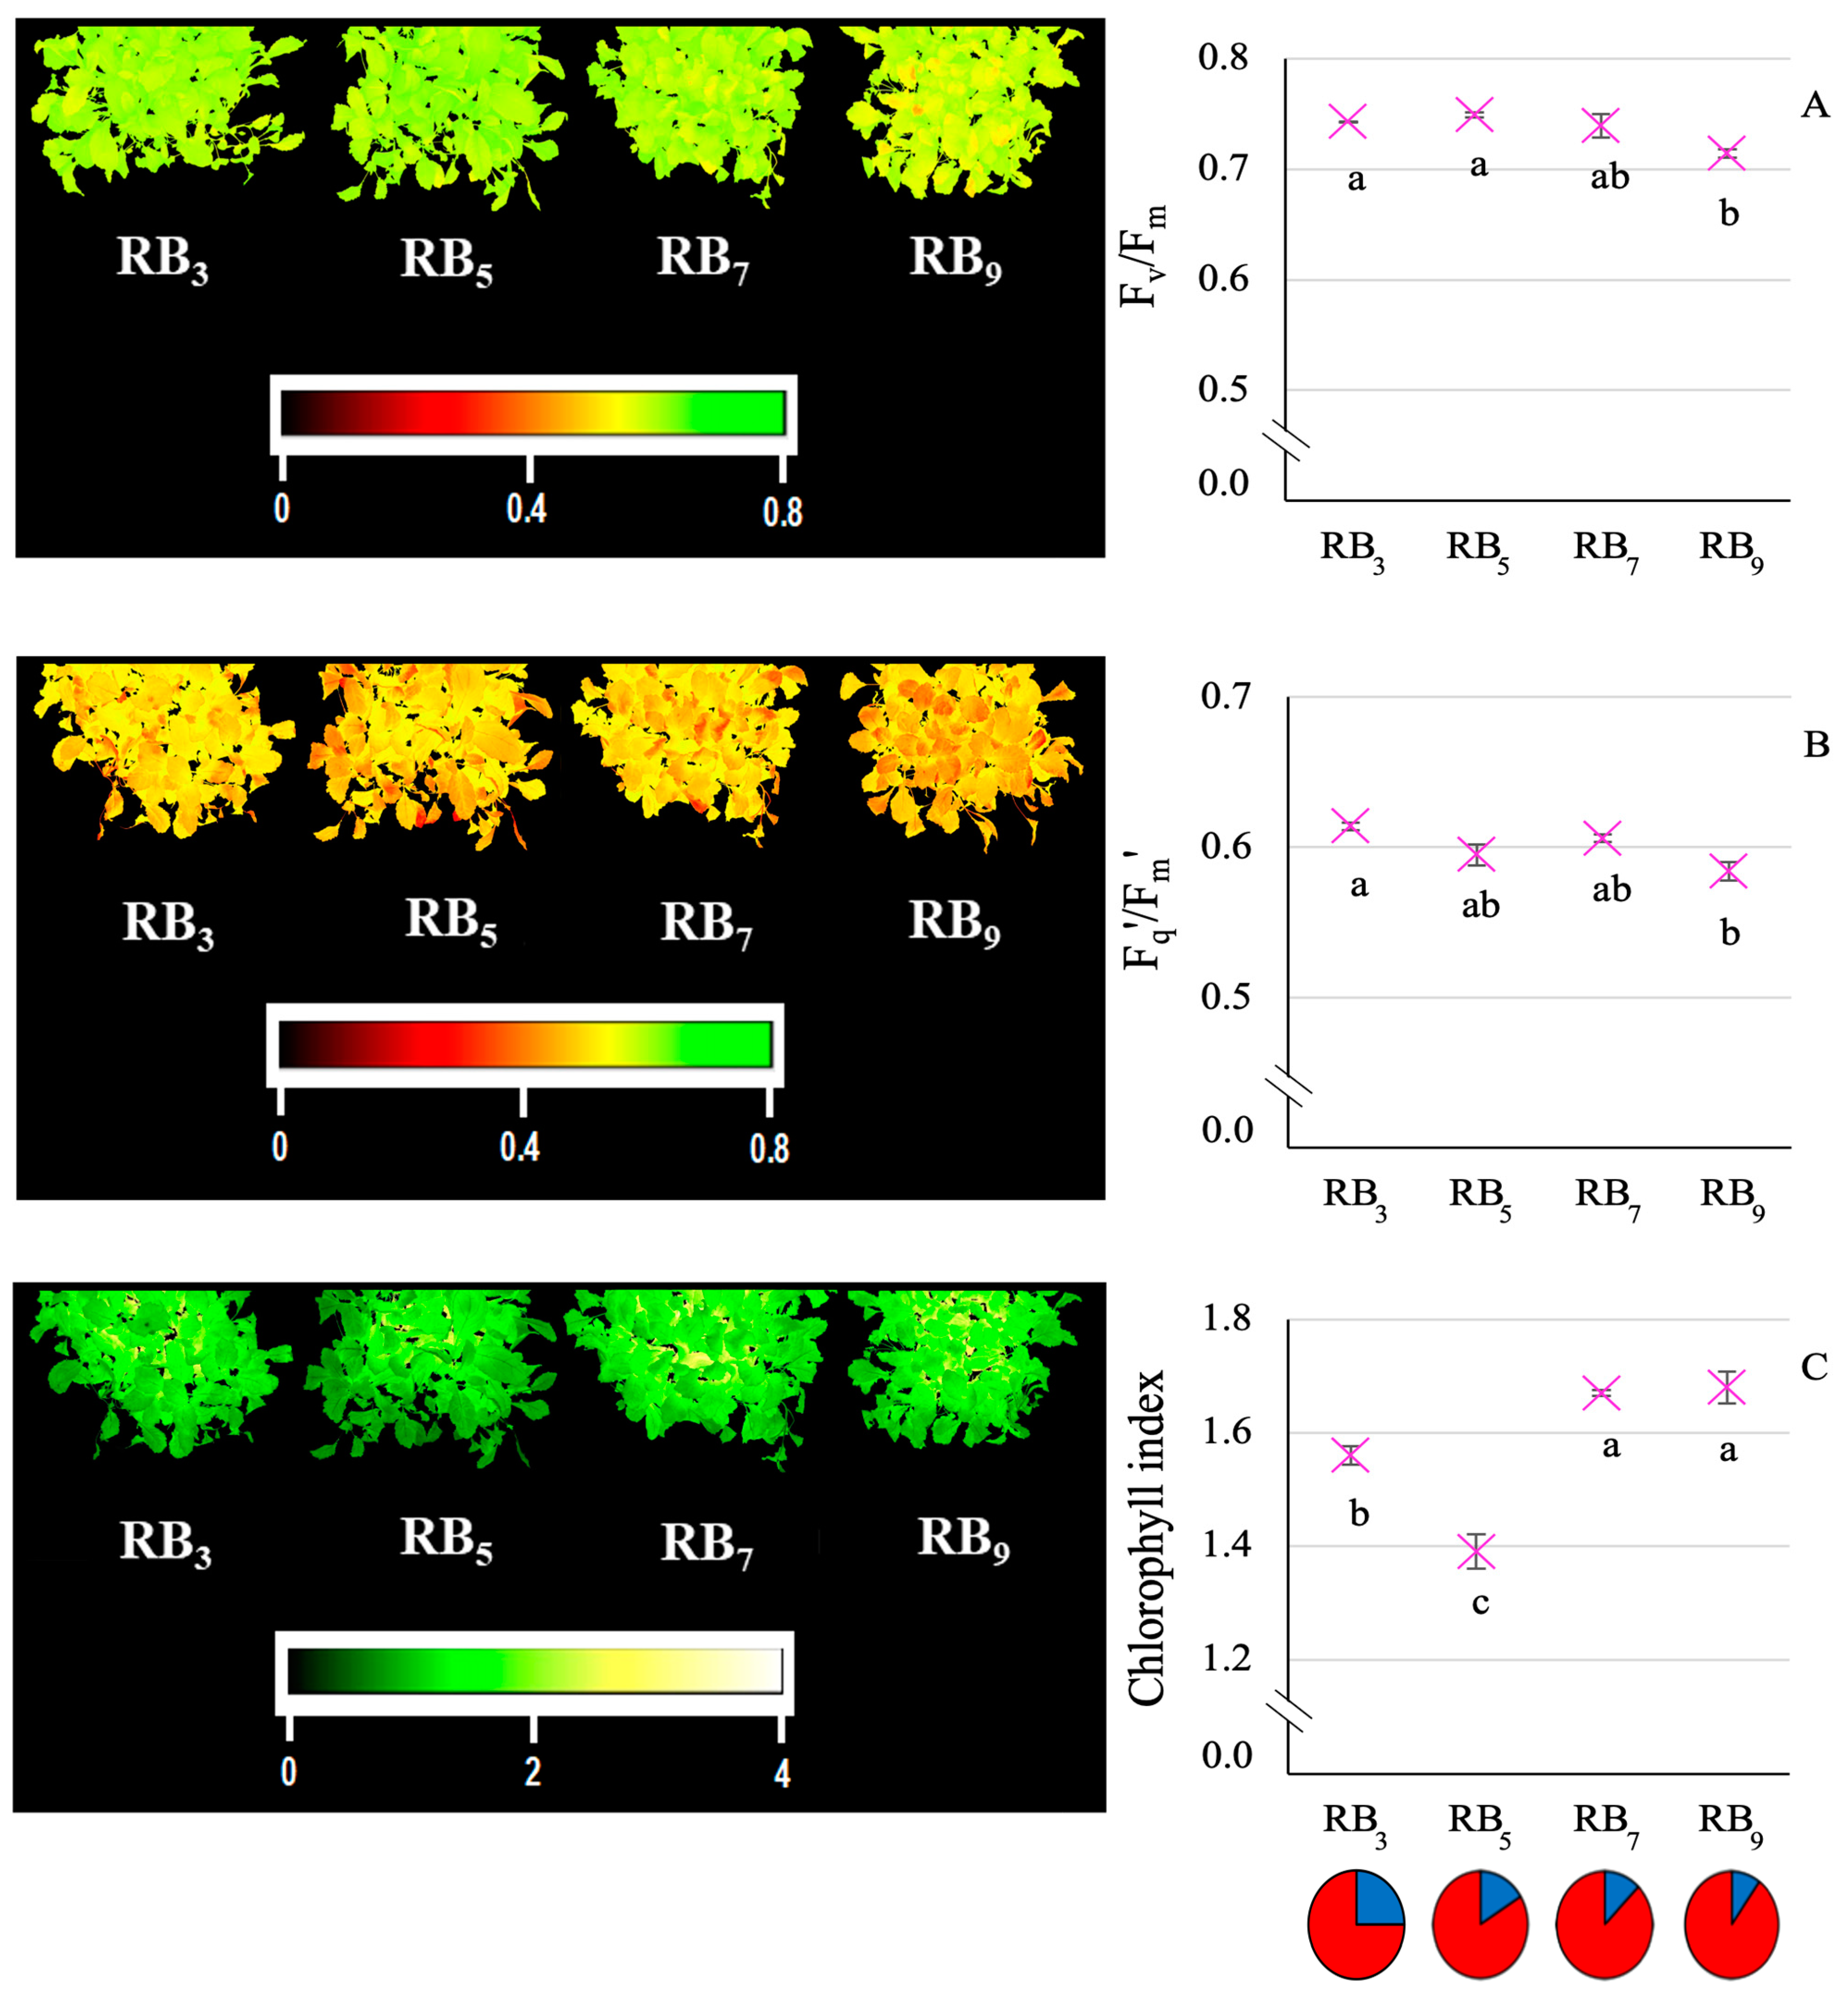
The lowest maximal efficiency of photosynthesis (Fv/Fm) was associated with RB9 treatment (0.71), therefore being when the highest red portion was included in the spectrum (Figure 5A). Instead, the greatest values were detected under RB ≤ 7, with an average datum of 0.74 (Figure 5A). Through canopy images, it is also detectable that RB9 presented a higher number of pixels with lower Fv/Fm values, visible by the higher presence of yellow-orange areas.
PSII quantum efficiency (Fq′/Fm′) data provided a different trend, where RB3 had the highest value (0.61) but was not statistically significantly different from RB5 and RB7 (Figure 5B). Again, RB9 presented the lowest PSII quantum efficiency, equal to 0.58 (Figure 5B). One more time, the multispectral image helped in identifying areas with different values through color scale: as visible in Figure 5B, the image from treatment RB9 recorded more orange-red pixels linked with minor Fq′/Fm′ values.
On the other hand, a higher R quota associated with a lower B amount in the spectrum (RB 7) resulted in higher estimates for chlorophyll index in light-adapted kale, with average values of 1.68. Conversely, RB5, which proved to be the most efficient treatment for many other parameters, provided the lowest amount (1.39) (Figure 5C). Again, darker green spots in RB5 observable in the images reflected the lowest estimated chlorophyll concentration in the canopy (Figure 5C).

4. Discussion

4.1. RB5 Allows for Optimized Baby-Leaf Kale Growth and Resource Use Efficiency

In this study, increasing red-over-blue lighting treatments were employed to understand and describe the relationship between these two PAR regions and baby-leaf kale responses. It is well known that the optimal ratio of red and blue wavelengths depends on the specific crop to be cultivated, carefully weighing up the morphological, physiological and qualitative aspects [15]. Therefore, defining only one efficient RB combination may not work equally for all the crops. Indeed, the literature validated different mixtures of red and blue wavelengths as the most efficient light recipes for leafy greens production in indoor environments in terms of fresh or dry biomass as well as efficiency in using different inputs. For instance, in basil (Ocimum basilicum L.) and lettuce (Lactuca sativa L.), the optimal ratio was identified in RB3 [24,25], while for spinach (Spinacia oleracea L.), benefits were associated with treatments of RB6 or RB10 [26]. Considering the Brassica family, evidence from other studies highlighted that several species tend to appreciate, in terms of fresh or dry biomass production, a lower blue presence in the spectrum when associated with red wavelengths. For instance, the growth of Chinese cabbage (Brassica rapa L.) improved under RB8 [27], while RB9 and RB3 resulted in being more efficient compared to RB0.3 for mustard (Brassica juncea L. ‘Red Lace’) and kale (Brassica oleracea L. ‘Red Russian’) cultivation [28]. Additionally, curled kale (Brassica oleracea var. sabellica) biomass increased when cultivated under RB ≥ 10 compared to RB4.9 [29]. However, excessive shrinking or even completely calling off blue wavelengths from the light treatment supplied, thus providing a monochromatic red light, cannot be the solution either. Indeed, blue radiation is captured by multiple plant photoreceptors, influencing leaves’ stomatal opening, elongation of stem and chloroplast development thanks to cryptochromes, as well as chloroplast position and stomatal opening via phototropins [30]. Therefore, testing the response of Brassicaceae such as kale under different doses of red and blue can be a starting point to provide a valuable and efficient light recipe for this crop.
In the present study, a moderate increase in the RB ratio wavelengths above 3 resulted to be effective in terms of fresh biomass production, with RB5 providing the highest fresh biomass per plant (Figure 2A). This treatment resulted to be efficient for other Brassicaceae as well, like broccoli (Brassica oleracea L. var. Italica) at the stage of microgreens, although a much lower intensity was applied (around 30 μmol m−2 s−1) [31]. On the other hand, further increasing the ratio (RB ≥ 7) did not scale up the growth of kale, maintaining the same efficiency of the commonly adopted RB3 spectrum. Therefore, although a lower blue presence has been observed to improve Brassica growth in several studies, our results showed how a portion of the blue region in combination with red was still necessary, translating into an RB ratio of 5. Increased fresh biomass associated with RB5 was due to a major leaf expansion, registering a +21% in LA (Figure 3A). Instead, higher RB ratios led to reduced leaf size and, therefore, a possible reduced capacity to intercept the needed light for boosted growth [32]. Reduced LA with a higher R fraction over B could be associated with plant shade-avoidance-syndrome (SAS) (more commonly associated with far-red radiation in a low red:far-red environment [33]) but is also possible in the absence of B light in the spectrum, which can lead to a major stem elongation in contrast with a lower leaf expansion [34]. In this experiment, while B light was not absent in either RB7 or RB9 treatments, it may be hypothesized that it was perhaps sufficiently low to trigger such a reaction. However, if the reduction in LA with RB ≥ 7 can be explained by a reduced B presence, RB3 also displayed the same tendency although presenting the highest B amount among all treatments. Therefore, RB5 may include the most appropriate balance of both R and B radiation for this specific crop. Upon the greater leaf area expansion associated with RB5, a thinner lamina was registered, resulting in an elevated SLA value as well, with the highest figures reaching +12% and 28% in SLA compared to RB3 and RB ≥ 7, respectively (Figure 3B). The influence of blue fraction on leaf expansion and thickness has provided controversial evidence in the literature. Some studies highlighted a major role of blue wavelengths on leaf area, with rising values as the B percentage in the RB ratio grew, for instance, up to 66% of the spectrum for lettuce compared to monochromatic R or B [35]. However, a number of other studies reported a reduction in LA in different leafy greens when LED recipes included an increasing portion of blue, as in the case of lettuce with RB ≤ 3 [25] or RB ≤ 13 [36], or RB ≤ 9 and RB < 6 for cucumber (Cucumis sativus L.) seedlings [37] and spinach [26], respectively (except for exclusively 100% B radiation [36,37]). These studies and the reported data underline that although, in many cases, both blue and red regions are needed for LA enhancement, it is fundamental to define the species-specific optimal RB balance.
Considering the importance of resource use efficiency in the VF business, special attention should be paid to production efficiency in relation to the different inputs needed for farm development and functioning. Here, the two indices evaluated regarded the efficiency of using the cultivated surface and the lighting provided by lamps in terms of yield. As mentioned, the exploration of the vertical dimension allows for a reduced acreage occupied for agricultural farming, compared to greenhouse or traditional agriculture, thus entailing a smaller land footprint [7]. In the present study, the maximum SUE reached amounted to 54 kg FW m2 y1 under RB5 (Figure 4A), estimating 17 consecutive cycles per year and the remaining 8 days per year for maintenance and operational tasks between running cycles. It should also be noted that separating germination from vegetative phases could further increase the number of yearly growing cycles and, consequently, the possible SUE achievable. This is also possible thanks to the complete insulation from the external environment, which allowed to prevent all those hurdles that seasonality, weather and climatic conditions entail: reduced solar radiation in winter times, excessive heat or cold, temperature leap, hail or extreme rainstorm, drought or flooding to name a few. The major productivity reached supported lighting energy use efficiency as well. Indeed, in this research, the applied light spectra featured similar energy consumptions (Table 1), leading to significant differences in terms of L-EUE because of a higher yield for RB5 (57.1 g FW kWh1, Figure 4B). Therefore, although the applied light spectra with the highest B fraction (namely RB3 and RB5) presented a slightly higher energy consumption due to the greater B radiation [38], this was compensated by a major yield, which, at last, positively drove the L-EUE parameter.
Considering the physiological efficiency in using incident light (namely the LUE) [39], plants registered the same value (on average 0.66 g DW mol1, Table S1) aside from the RB ratio applied. This uniformity was driven by an equal dry weight per plant obtained for all treatments (Table S1) along with the same light intensity provided. Although RB5 showed enhanced fresh weight, and, together with RB3, an enhanced photosynthetic efficiency, they displayed a lower DMC as well. Blue radiation is known to stimulate stomatal opening, leading to increased photosynthetic gas exchange and water loss via transpiration [40]. Although a higher blue fraction was present in RB ≤ 5, the opposite phenomenon was observed in this study, with an increasing water content registered according to fresh weight and DMC results (Figure 2A,B). It is possible that advancing in the growing cycle, RB5 plants presented a more expanded canopy and might have experienced augmented hydric stress compared to their water demand. In water stress conditions, the water-holding process in plants is the result of an abscisic acid (ABA) level increase inside or close to stomatal guard cells, inducing stomata closure to prevent excessive transpiration and water loss [41]. As reported by Ginzburg [42], this mechanism of increased water uptake under lower RB ratios has been observed in lettuce in Pennisi et al. [25], measuring reduced DMC and water use efficiency values with blue-enriched RB spectra. Thus, RB5 shared with the other treatments the same ability to accumulate dry biomass despite enlarged leaves able to capture a higher amount of light, fixing less dry content in their water-enriched aerial portions. However, at the same time, the photosynthetic efficiency did not result in lower dry mass accumulation, possibly because of the short growing cycle [43].

4.2. Photosynthetic Response to Rising RB Ratio in Kale

Dark-adapted Fv/Fm gives an indication of the physiological status of plants, providing an estimate of the maximal reachable quantum efficiency of PSII in crops. Accordingly, the literature estimates a value of around 0.76–0.83 for unstressed plants [44]. As suggested by Chen et al. [45], a lower Fv/Fm could be ascribed to light-induced reduced plant photosynthetic activity. In the present study, kale subjected to a higher B amount (in RB3 and RB5 treatments, respectively) registered an Fv/Fm of 0.75, slightly lower than the optimal value suggested in the literature. On the other hand, when the B light was decreased up to the lowest percentage in RB9, lower Fv/Fm figures were detected. Blue radiation is considered fundamental for PSII actions, more than the presence of red light. Miao et al. [46] suggested that possibly the PSII photoinhibition driven by red wavelengths might be due to two different phenomena, namely the absence of PSII core antenna CP47 and CP43 proteins [47] or an uneven process of demolition and consequent restoration of protein D1 always located in the PSII [48]. The same author observed that in cucumber plants, these effects were less visible when blue light was present in the spectrum, providing an up-regulation of the expression of the genes coding for the D1 protein (namely psbA) or the genes encoding protein CP47 and CP43 (psbB and psbD, respectively) [46]. Here, this mechanism could explain the reduced activity of photosystem II in baby-leaf kale grown under those ratios with decreasing B fraction. The Fq′/Fm′ value, on the other hand, indicates the relative amount of PSII operating efficiency in light-adapted plants; therefore, the light is effectively absorbed and utilized to power PSII photochemistry [49]. Here, again, a decreasing tendency was registered with an increasing RB ratio. Although, with different light recipes, the same trend was observed in other studies on lettuce, with diminishing values of Fq′/Fm′ when ranging from RB0.5 to RB4 [25] as well in basil, with higher values when a higher B fraction was present (RB0.5 and RB1) [24]. This evidence validates the main role of B light in forcing PSII operating efficiency. The yield increase observed for RB5 was not linked with a higher chlorophyll index in leaves instead. The slightly lower chlorophyll index value registered with a lower RB ratio, especially RB5, was not relatable with previous research, where higher B light positively influenced SPAD chlorophyll content and efficiency of photosynthesis [29,36]. Furthermore, while an increase in fresh biomass has been associated with a higher chlorophyll index in another study [24], in this study, an opposite outcome was detected. However, the use of monochromatic lights, both red and blue, did not support chlorophyll synthesis either [28]. Here, the lower chlorophyll index content in RB5 could be due to different phenomena related to enhanced leaf area and thinness or increased water content in leaves. Wang et al. [50] suggested that the presence of major blue wavelengths can influence plant architecture by expanding the leaf area, capturing a higher amount of light and keeping chlorophyll at lower content as an adaptation for preserving photosynthetic activity during senescence [50]. Also, reduced chlorophyll values per unit leaf area have been associated with a lower leaf thickness, a pattern that can be observed in RB5 plants as well [51,52]. Additionally, another driver for the reduced chlorophyll content could be the major water volume in the heavier plants under RB5, relatable to the reduced DMC value detected (Figure 2B), leading to chlorophyll dilution in the leaf [53].

5. Conclusions

Ready-to-eat products are experiencing an increasing interest from both consumers and farmers. Implementing more performing and resource-efficient protocols in VF for their production is needed, as they represent one of the most economically viable crops on such systems. An optimal light management allows to obtain a higher yield and efficiency in using inputs, especially lighting sources that represent one of the main hurdles for vertical farming development. Hence, identifying the most effective RB mixtures among increasing ratios up to RB9 is a required strategy for crops like baby-leaf kale. In this study, RB5 has been pointed out as the most convenient ratio for optimal fresh yield, thanks to more expanded and thinner leaves, allowing higher light interception. Higher production also led to major L-EUE and SUE, indicators of major relevance for the success of VF, given they directly affect production costs (e.g., in terms of energy and land). Physiological figures of plants reported few significant differences for maximal reachable quantum efficiency and effective operating efficiency of PSII (Fv/Fm and Fq′/Fm′, respectively) although with a tendency of reducing efficiency as the RB ratio increased up to 9:1. However, the greater yield observed for RB5 was not linked with a higher chlorophyll index in leaves, which did not apply with previous studies. As the highest production should advance along with high-quality products, future research should focus on the nexus between morphology and physiological status to further understand the patterns under different lighting conditions and the nutritional quality improvements.

Supplementary Materials

The following supporting information can be downloaded at: https://www.mdpi.com/article/10.3390/horticulturae10111134/s1, Table S1: morphological measurements; Table S2: physiological measurements.

Author Contributions

Conceptualization, I.Z.; methodology, I.Z., G.P., F.O. and A.C.; validation, G.P. and F.O.; formal analysis, I.Z.; investigation, I.Z. and E.R.; data curation, I.Z. and E.R.; writing—original draft preparation, I.Z.; writing—review and editing, G.P., M.M. and F.O.; visualization, G.P., F.O. and G.G.; supervision, G.P., M.M. and F.O.; funding acquisition, M.M. and F.O. All authors have read and agreed to the published version of the manuscript.

Funding

The research leading to this publication has received funding from the Italian Ministry of Education and Research (MUR) within the call for Research Projects of National Interest (PRIN) within the project “VFARM—Sustainable Vertical Farming” (Project code: 2020ELWM82, CUP:J33C20002350001) and was carried out within the Agritech National Research Center and received funding from the European Union Next-GenerationEU (PIANO NAZIONALE DI RIPRESA E RESILIENZA (PNRR)—MISSIONE 4 COMPONENTE 2, INVESTIMENTO 1.4—D.D. 1032 17/06/2022, CN00000022) and the Swedish Research Council for Sustainable Development-FORMAS through grant number 2021-02447. This manuscript reflects only the authors’ views and opinions, neither the European Union nor the European Commission can be considered responsible for them.

Data Availability Statement

Data that support the findings of this study are available in Supplementary Materials.

Conflicts of Interest

Author Andrea Crepaldi was employed by the company Flytech s.r.l. The remaining authors declare that the research was conducted in the absence of any commercial or financial relationships that could be construed as a potential conflict of interest.

References

  1. Orsini, F.; Kahane, R.; Nono-Womdim, R.; Gianquinto, G. Urban Agriculture in the Developing World: A Review. Agron. Sustain. Dev. 2013, 33, 695–720. [Google Scholar] [CrossRef]
  2. FAO. Land Statistics 2001–2022-Global, Regional and Country Trends; FAOSTAT Analytical Briefs n.88; FAO: Rome, Italy, 2024. [Google Scholar] [CrossRef]
  3. Xi, L.; Zhang, M.; Zhang, L.; Lew, T.T.S.; Lam, Y.M. Novel Materials for Urban Farming. Adv. Mater. 2022, 34, 2105009. [Google Scholar] [CrossRef] [PubMed]
  4. Avgoustaki, D.D.; Xydis, G. How Energy Innovation in Indoor Vertical Farming Can Improve Food Security, Sustainability, and Food Safety? In Advances in Food Security and Sustainability; Cohen, M.J., Ed.; Elsevier: Amsterdam, The Netherlands, 2020; Volume 5, pp. 1–51. [Google Scholar] [CrossRef]
  5. Benke, K.; Tomkins, B. Future Food-Production Systems: Vertical Farming and Controlled-Environment Agriculture. Sustain. Sci. Pract. Policy 2017, 13, 13–26. [Google Scholar] [CrossRef]
  6. Van Delden, S.H.; SharathKumar, M.; Butturini, M.; Graamans, L.J.A.; Heuvelink, E.; Kacira, M.; Kaiser, E.; Klamer, R.S.; Klerkx, L.; Kootstra, G.; et al. Current Status and Future Challenges in Implementing and Upscaling Vertical Farming Systems. Nat. Food 2021, 2, 944–956. [Google Scholar] [CrossRef]
  7. Bustamante, M.J. AgTech and the City: The Case of Vertical Farming and Shaping a Market for Urban-Produced Food. In Managing Digital Transformation; Andersson, P., Movin, S., Mähring, M., Teigland, R., Wennberg, K., Eds.; Stockholm School of Economics Institute for Research: Stockholm, Sweden, 2018; pp. 281–297. [Google Scholar]
  8. Martin, M.; Weidner, T.; Gullström, C. Estimating the Potential of Building Integration and Regional Synergies to Improve the Environmental Performance of Urban Vertical Farming. Front. Sustain. Food Syst. 2022, 6, 849304. [Google Scholar] [CrossRef]
  9. Thomaier, S.; Specht, K.; Henckel, D.; Dierich, A.; Siebert, R.; Freisinger, U.B.; Sawicka, M. Farming in and on Urban Buildings: Present Practice and Specific Novelties of Zero-Acreage Farming (ZFarming). Renew. Agric. Food Syst. 2015, 30, 43–54. [Google Scholar] [CrossRef]
  10. Zhang, H.; Asutosh, A.; Hu, W. Implementing Vertical Farming at University Scale to Promote Sustainable Communities: A Feasibility Analysis. Sustainability 2018, 10, 4429. [Google Scholar] [CrossRef]
  11. Paucek, I.; Appolloni, E.; Pennisi, G.; Quaini, S.; Gianquinto, G.; Orsini, F. LED Lighting Systems for Horticulture: Business Growth and Global Distribution. Sustainability 2020, 12, 7516. [Google Scholar] [CrossRef]
  12. Fankhauser, C.; Chory, J. Light Control of Plant Development. Annu. Rev. Cell Dev. Biol. 1997, 13, 203–229. [Google Scholar] [CrossRef]
  13. Appolloni, E.; Pennisi, G.; Zauli, I.; Carotti, L.; Paucek, I.; Quaini, S.; Orsini, F.; Gianquinto, G. Beyond Vegetables: Effects of Indoor LED Light on Specialized Metabolite Biosynthesis in Medicinal and Aromatic Plants, Edible Flowers, and Microgreens. J. Sci. Food Agric. 2022, 102, 472–487. [Google Scholar] [CrossRef]
  14. Lichtenthaler, H.K.; Buschmann, C. Chlorophylls and Carotenoids: Measurement and Characterization by UV-VIS Spectroscopy. Curr. Protoc. Food Anal. Chem. 2001, 1, F4.3.1–F4.3.8. [Google Scholar] [CrossRef]
  15. Stamford, J.D.; Stevens, J.; Mullineaux, P.M.; Lawson, T. LED Lighting: A Grower’s Guide to Light Spectra. HortScience 2023, 58, 180–196. [Google Scholar] [CrossRef]
  16. Kozai, T.; Niu, G. Role of the Plant Factory With Artificial Lighting (PFAL) in Urban Areas. In Plant Factory. An Indoor Vertical Farming System for Efficient Quality Food Production; Kozai, T., Niu, G., Takagaki, M., Eds.; Academic Press: Amsterdam, The Netherlands, 2016; pp. 7–33. [Google Scholar] [CrossRef]
  17. Yokoyama, R. Energy Consumption and Heat Sources in Plant Factories. In Plant Factory Using Artificial Light. Adapting to Environmental Disruption and Clues to Agricultural Innovation; Anpo, M., Fukuda, H., Wada, T., Eds.; Elsevier: Amsterdam, The Netherlands, 2019; pp. 177–184. [Google Scholar] [CrossRef]
  18. Penuela, J.; Ben, C.; Boldyrev, S.; Gentzbittel, L.; Ouerdane, H. The Indoor Agriculture Industry: A Promising Player in Demand Response Services. Appl. Energy 2024, 372, 123756. [Google Scholar] [CrossRef]
  19. Saini, R.K.; Ko, E.Y.; Keum, Y.-S. Minimally Processed Ready-to-Eat Baby-Leaf Vegetables: Production, Processing, Storage, Microbial Safety, and Nutritional Potential. Food Rev. Int. 2017, 33, 644–663. [Google Scholar] [CrossRef]
  20. Martínez-Sánchez, A.; Luna, M.C.; Selma, M.V.; Tudela, J.A.; Abad, J.; Gil, M.I. Baby-Leaf and Multi-Leaf of Green and Red Lettuces Are Suitable Raw Materials for the Fresh-Cut Industry. Postharvest Biol. Technol. 2012, 63, 1–10. [Google Scholar] [CrossRef]
  21. Carotti, L.; Pistillo, A.; Zauli, I.; Meneghello, D.; Martin, M.; Pennisi, G.; Gianquinto, G.; Orsini, F. Improving Water Use Efficiency in Vertical Farming: Effects of Growing Systems, Far-Red Radiation and Planting Density on Lettuce Cultivation. Agric. Water Manag. 2023, 285, 108365. [Google Scholar] [CrossRef]
  22. Easlon, H.M.; Bloom, A.J. Easy Leaf Area: Automated Digital Image Analysis for Rapid and Accurate Measurement of Leaf Area. Appl. Plant Sci. 2014, 2, 1400033. [Google Scholar] [CrossRef]
  23. Gitelson, A.A.; Gritz, Y.; Merzlyak, M.N. Relationships between Leaf Chlorophyll Content and Spectral Reflectance and Algorithms for Non-Destructive Chlorophyll Assessment in Higher Plant Leaves. J. Plant Physiol. 2003, 160, 271–282. [Google Scholar] [CrossRef]
  24. Pennisi, G.; Blasioli, S.; Cellini, A.; Maia, L.; Crepaldi, A.; Braschi, I.; Spinelli, F.; Nicola, S.; Fernandez, J.A.; Stanghellini, C.; et al. Unraveling the Role of Red:Blue LED Lights on Resource Use Efficiency and Nutritional Properties of Indoor Grown Sweet Basil. Front. Plant Sci. 2019, 10, 305. [Google Scholar] [CrossRef]
  25. Pennisi, G.; Orsini, F.; Blasioli, S.; Cellini, A.; Crepaldi, A.; Braschi, I.; Spinelli, F.; Nicola, S.; Fernandez, J.A.; Stanghellini, C.; et al. Resource Use Efficiency of Indoor Lettuce (Lactuca sativa L.) Cultivation as Affected by Red:Blue Ratio Provided by LED Lighting. Sci. Rep. 2019, 9, 14127. [Google Scholar] [CrossRef]
  26. Martínez-Moreno, A.; Frutos-Tortosa, A.; Diaz-Mula, H.; Mestre, T.C.; Martínez, V. Effect of the Intensity and Spectral Quality of LED Light on Growth and Quality of Spinach Indoors. Horticulturae 2024, 10, 411. [Google Scholar] [CrossRef]
  27. Zhang, Y.; Ji, J.; Song, S.; Su, W.; Liu, H. Growth, Nutritional Quality and Health-Promoting Compounds in Chinese Kale Grown under Different Ratios of Red:Blue LED Lights. Agronomy 2020, 10, 1248. [Google Scholar] [CrossRef]
  28. Brazaitytė, A.; Miliauskienė, J.; Vaštakaitė-Kairienė, V.; Sutulienė, R.; Laužikė, K.; Duchovskis, P.; Małek, S. Effect of Different Ratios of Blue and Red LED Light on Brassicaceae Microgreens under a Controlled Environment. Plants 2021, 10, 801. [Google Scholar] [CrossRef]
  29. Naznin, M.; Lefsrud, M.; Gravel, V.; Azad, M. Blue Light Added with Red LEDs Enhance Growth Characteristics, Pigments Content, and Antioxidant Capacity in Lettuce, Spinach, Kale, Basil, and Sweet Pepper in a Controlled Environment. Plants 2019, 8, 93. [Google Scholar] [CrossRef] [PubMed]
  30. Dou, H.; Niu, G. Plant Responses to Light. In Plant Factory. An Indoor Vertical Farming System for Efficient Quality Food Production, 2nd ed.; Elsevier: Amsterdam, The Netherlands, 2020; pp. 153–166. [Google Scholar] [CrossRef]
  31. Luo, L.; Zhang, G.; Liang, W.; Wu, D.; Sun, Q.; Hao, Y. Effects of LED Light Quality on Broccoli Microgreens Plant Growth and Nutrient Accumulation. J. Plant Growth Regul. 2024, 43, 3481–3489. [Google Scholar] [CrossRef]
  32. Kang, W.H.; Park, J.S.; Park, K.S.; Son, J.E. Leaf Photosynthetic Rate, Growth, and Morphology of Lettuce under Different Fractions of Red, Blue, and Green Light from Light-Emitting Diodes (LEDs). Hortic. Environ. Biotechnol. 2016, 57, 573–579. [Google Scholar] [CrossRef]
  33. Franklin, K.A. Shade Avoidance. New Phytol. 2008, 179, 930–944. [Google Scholar] [CrossRef]
  34. Cope, K.R.; Snowden, M.C.; Bugbee, B. Photobiological Interactions of Blue Light and Photosynthetic Photon Flux: Effects of Monochromatic and Broad-Spectrum Light Sources. Photochem. Photobiol. 2014, 90, 574–584. [Google Scholar] [CrossRef]
  35. Clavijo-Herrera, J.; Van Santen, E.; Gómez, C. Growth, Water-Use Efficiency, Stomatal Conductance, and Nitrogen Uptake of Two Lettuce Cultivars Grown under Different Percentages of Blue and Red Light. Horticulturae 2018, 4, 16. [Google Scholar] [CrossRef]
  36. Izzo, L.G.; Mickens, M.A.; Aronne, G.; Gómez, C. Spectral Effects of Blue and Red Light on Growth, Anatomy, and Physiology of Lettuce. Physiol. Plant. 2021, 172, 2191–2202. [Google Scholar] [CrossRef]
  37. Hernández, R.; Kubota, C. Physiological Responses of Cucumber Seedlings under Different Blue and Red Photon Flux Ratios Using LEDs. Environ. Exp. Bot. 2016, 121, 66–74. [Google Scholar] [CrossRef]
  38. Pennisi, G.; Sanyé-Mengual, E.; Orsini, F.; Crepaldi, A.; Nicola, S.; Ochoa, J.; Fernandez, J.; Gianquinto, G. Modelling Environmental Burdens of Indoor-Grown Vegetables and Herbs as Affected by Red and Blue LED Lighting. Sustainability 2019, 11, 4063. [Google Scholar] [CrossRef]
  39. Gitelson, A.A.; Peng, Y.; Arkebauer, T.J.; Suyker, A.E. Productivity, Absorbed Photosynthetically Active Radiation, and Light Use Efficiency in Crops: Implications for Remote Sensing of Crop Primary Production. J. Plant Physiol. 2015, 177, 100–109. [Google Scholar] [CrossRef]
  40. Whitelam, G.C.; Halliday, K.J. Light and Plant Development. Annual Plant Reviews Volume 30; Blackwell Publishing: Oxford, UK, 2007. [Google Scholar] [CrossRef]
  41. Assmann, S.M.; Shimazaki, K. The Multisensory Guard Cell. Stomatal Responses to Blue Light and Abscisic Acid1. Plant Physiol. 1999, 119, 809–816. [Google Scholar] [CrossRef] [PubMed]
  42. Ginzburg, D.N.; Klein, J.D. LED Pre-Exposure Shines a New Light on Drought Tolerance Complexity in Lettuce (Lactuca sativa) and Rocket (Eruca sativa). Environ. Exp. Bot. 2020, 180, 104240. [Google Scholar] [CrossRef]
  43. Chaves, M.M. How Plants Cope with Water Stress in the Field? Photosynthesis and Growth. Ann. Bot. 2002, 89, 907–916. [Google Scholar] [CrossRef] [PubMed]
  44. Proctor, M.C.F. Experiments on the Effect of Different Intensities of Desiccation on Bryophyte Survival, Using Chlorophyll Fluorescence as an Index of Recovery. J. Bryol. 2003, 25, 201–210. [Google Scholar] [CrossRef]
  45. Chen, D.; Zhang, J.; Zhang, Z.; Wan, X.; Hu, J. Analyzing the Effect of Light on Lettuce Fv/Fm and Growth by Machine Learning. Sci. Hortic. 2022, 306, 111444. [Google Scholar] [CrossRef]
  46. Miao, Y.; Wang, X.; Gao, L.; Chen, Q.; Qu, M. Blue Light Is More Essential than Red Light for Maintaining the Activities of Photosystem II and I and Photosynthetic Electron Transport Capacity in Cucumber Leaves. J. Integr. Agric. 2016, 15, 87–100. [Google Scholar] [CrossRef]
  47. Rajagopal, S.; Murthy, S.D.S.; Mohanty, P. Effect of Ultraviolet-B Radiation on Intact Cells of the Cyanobacterium Spirulina Platensis: Characterization of the Alterations in the Thylakoid Membranes. J. Photochem. Photobiol. B Biol. 2000, 54, 61–66. [Google Scholar] [CrossRef]
  48. Melis, A. Photosystem-II Damage and Repair Cycle in Chloroplasts: What Modulates the Rate of Photodamage in Vivo? Trends Plant Sci. 1999, 4, 130–135. [Google Scholar] [CrossRef] [PubMed]
  49. Henriques, F.S. Leaf Chlorophyll Fluorescence: Background and Fundamentals for Plant Biologists. Bot. Rev. 2009, 75, 249–270. [Google Scholar] [CrossRef]
  50. Wang, X.Y.; Xu, X.M.; Cui, J. The Importance of Blue Light for Leaf Area Expansion, Development of Photosynthetic Apparatus, and Chloroplast Ultrastructure of Cucumis Sativus Grown under Weak Light. Photosynthetica 2015, 53, 213–222. [Google Scholar] [CrossRef]
  51. Zou, J.; Zhang, Y.; Zhang, Y.; Bian, Z.; Fanourakis, D.; Yang, Q.; Li, T. Morphological and Physiological Properties of Indoor Cultivated Lettuce in Response to Additional Far-Red Light. Sci. Hortic. 2019, 257, 108725. [Google Scholar] [CrossRef]
  52. Jayalath, T.C.; Van Iersel, M.W. Canopy Size and Light Use Efficiency Explain Growth Differences between Lettuce and Mizuna in Vertical Farms. Plants 2021, 10, 704. [Google Scholar] [CrossRef]
  53. Gianquinto, G.; Fecondini, M.; Mezzetti, M.; Orsini, F. Steering Nitrogen Fertilisation by Means of Portable Chlorophyll Meter Reduces Nitrogen Input and Improves Quality of Fertigated Cantaloupe (Cucumis melo L. Var. Cantalupensis Naud.). J. Sci. Food Agric. 2010, 90, 482–493. [Google Scholar] [CrossRef]
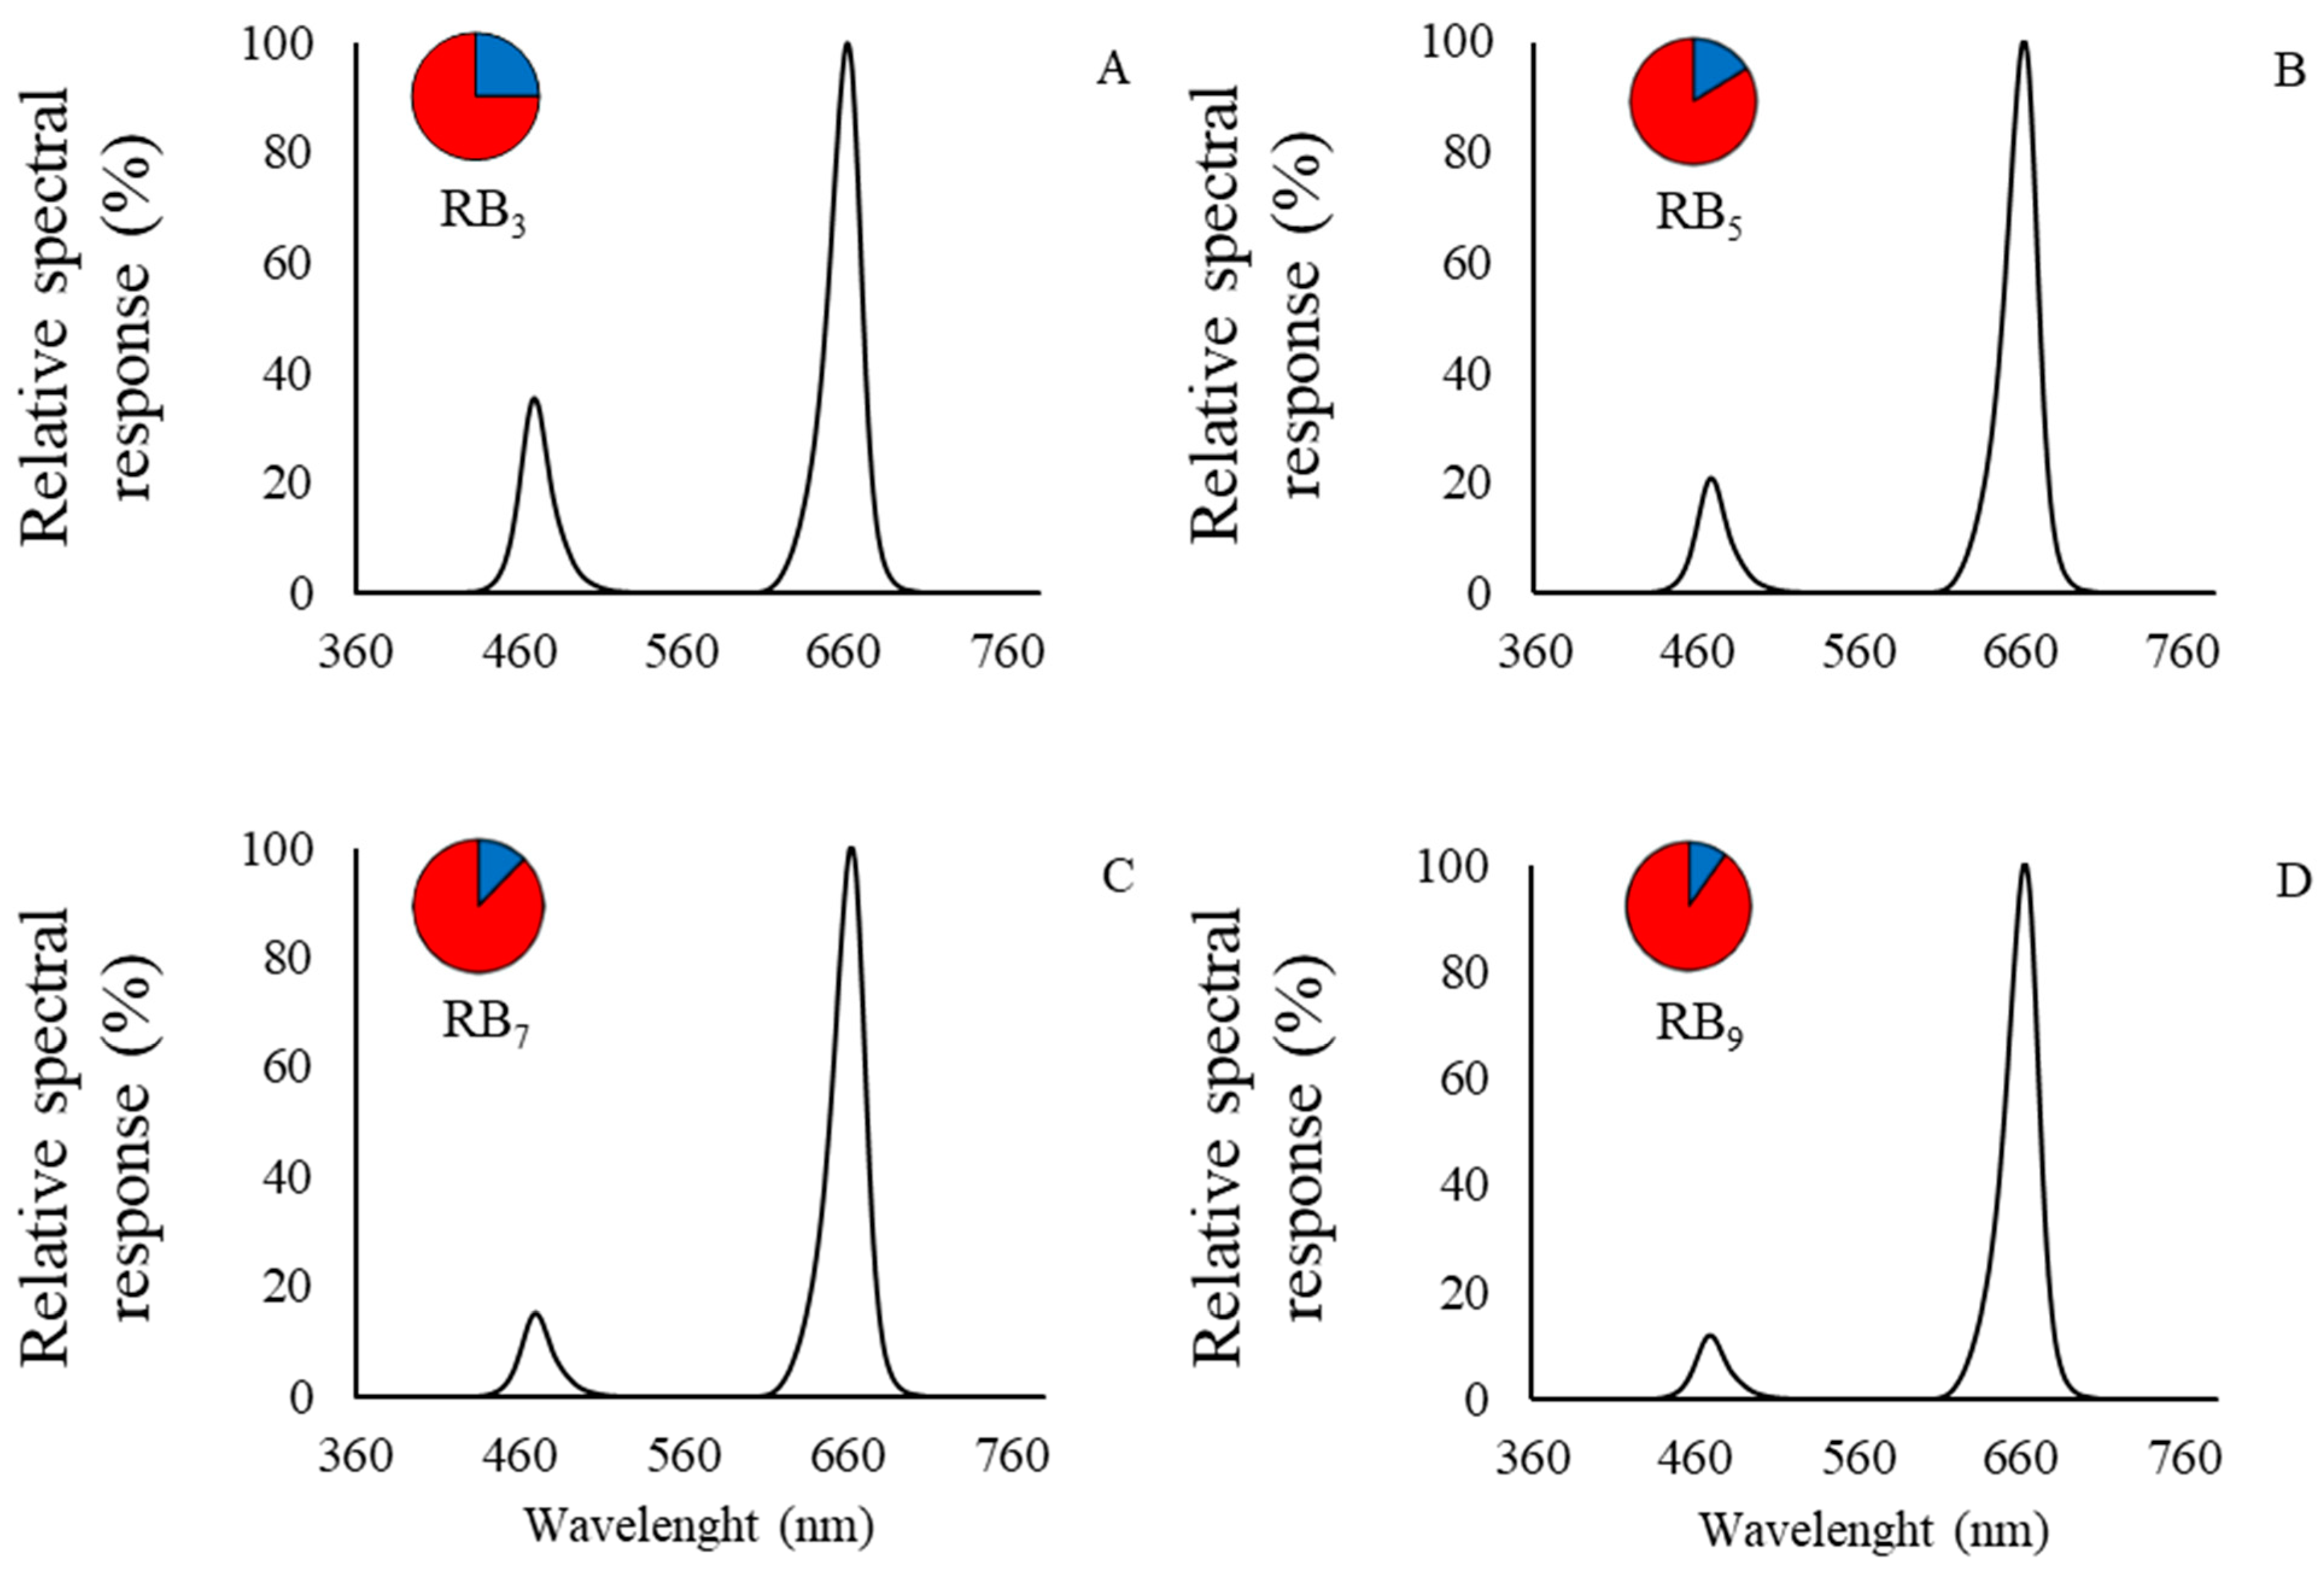
Figure 1. Relative spectral response (%) for the four lighting treatments with increasing RB ratio: (A) RB3, (B) RB5, (C) RB7 and (D) RB9.
Horticulturae 10 01134 g001
Figure 2. Effects of increasing RB ratio on baby-leaf kale cultivation on (A) fresh weight (g FW plant1) and (B) dry matter content (%). Average data identified by purple x, ±standard errors from vertical bars (n = 15) are reported. For FW results, different letters indicate significant differences according to Tukey’s post hoc test for mean separation with p < 0.05. For DMC results, different letters indicate significant differences according to Dunn’s post hoc test following the Kruskal–Wallis test, with p < 0.05.
Horticulturae 10 01134 g002
Figure 3. Effects of increasing RB ratio on baby-leaf kale cultivation on (A) leaf area (cm2 plant1) and (B) specific leaf area (cm2 g1 DW). Average data identified by purple x, ±standard errors from vertical bars (n = 15) are reported. Different letters indicate significant differences according to Tukey’s post hoc test for mean separation with p < 0.05.
Horticulturae 10 01134 g003
Figure 4. Effects of increasing RB ratio on baby-leaf kale cultivation on (A) surface use efficiency (SUE, kg FW m2 y1) and (B) lighting energy use efficiency (L-EUE, g FW kWh1). Average data identified by purple x, ±standard errors from vertical bars (n = 15) are reported. Different letters indicate significant differences according to Tukey’s post hoc test for mean separation with p < 0.05.
Horticulturae 10 01134 g004
Figure 5. Numerical results of (A) maximal quantum efficiency of photosynthesis (Fv/Fm), (B) effective PSII quantum efficiency electron transport (Fq′/Fm′) in light-adapted conditions and (C) chlorophyll index in light-adapted conditions of baby-leaf kale plants cultivated under increasing RB ratio. On the left of each graph, the most representative canopy image obtained through the Plant Explorer Pro+ device for each parameter is displayed. In (A,B), red pixels indicate lower values of Fv/Fm and Fq′/Fm′, whereas yellow-green areas indicate higher Fv/Fm and Fq′/Fm′, values, as defined in the integrated legend; in (C), dark green pixels indicate lower values for chlorophyll index, whereas yellow-white areas indicate higher chlorophyll index, as defined in the integrated legend. Average data identified by purple x, ±standard errors from vertical bars (n = 3) are reported. Different letters indicate statistically significant differences according to Tukey’s post hoc test for mean separation with p < 0.05.
Horticulturae 10 01134 g005
Table 1. Total lighting energy use (kWh m2 cycle1) for the four lighting treatments with increasing RB ratio over the 21 days of cultivation.
Lighting TreatmentsTotal Lighting Energy Use
(kWh m−2 cycle−1)
RB356.8
RB555.5
RB754.2
RB954.2
Disclaimer/Publisher’s Note: The statements, opinions and data contained in all publications are solely those of the individual author(s) and contributor(s) and not of MDPI and/or the editor(s). MDPI and/or the editor(s) disclaim responsibility for any injury to people or property resulting from any ideas, methods, instructions or products referred to in the content.