
Organic Nitrogen Nutrition Does Not Increase Glucosinolate Concentrations in Broccoli (Brassica oleracea L. var. italica)

 ,
,
Abstract
1. Introduction
2. Materials and Methods
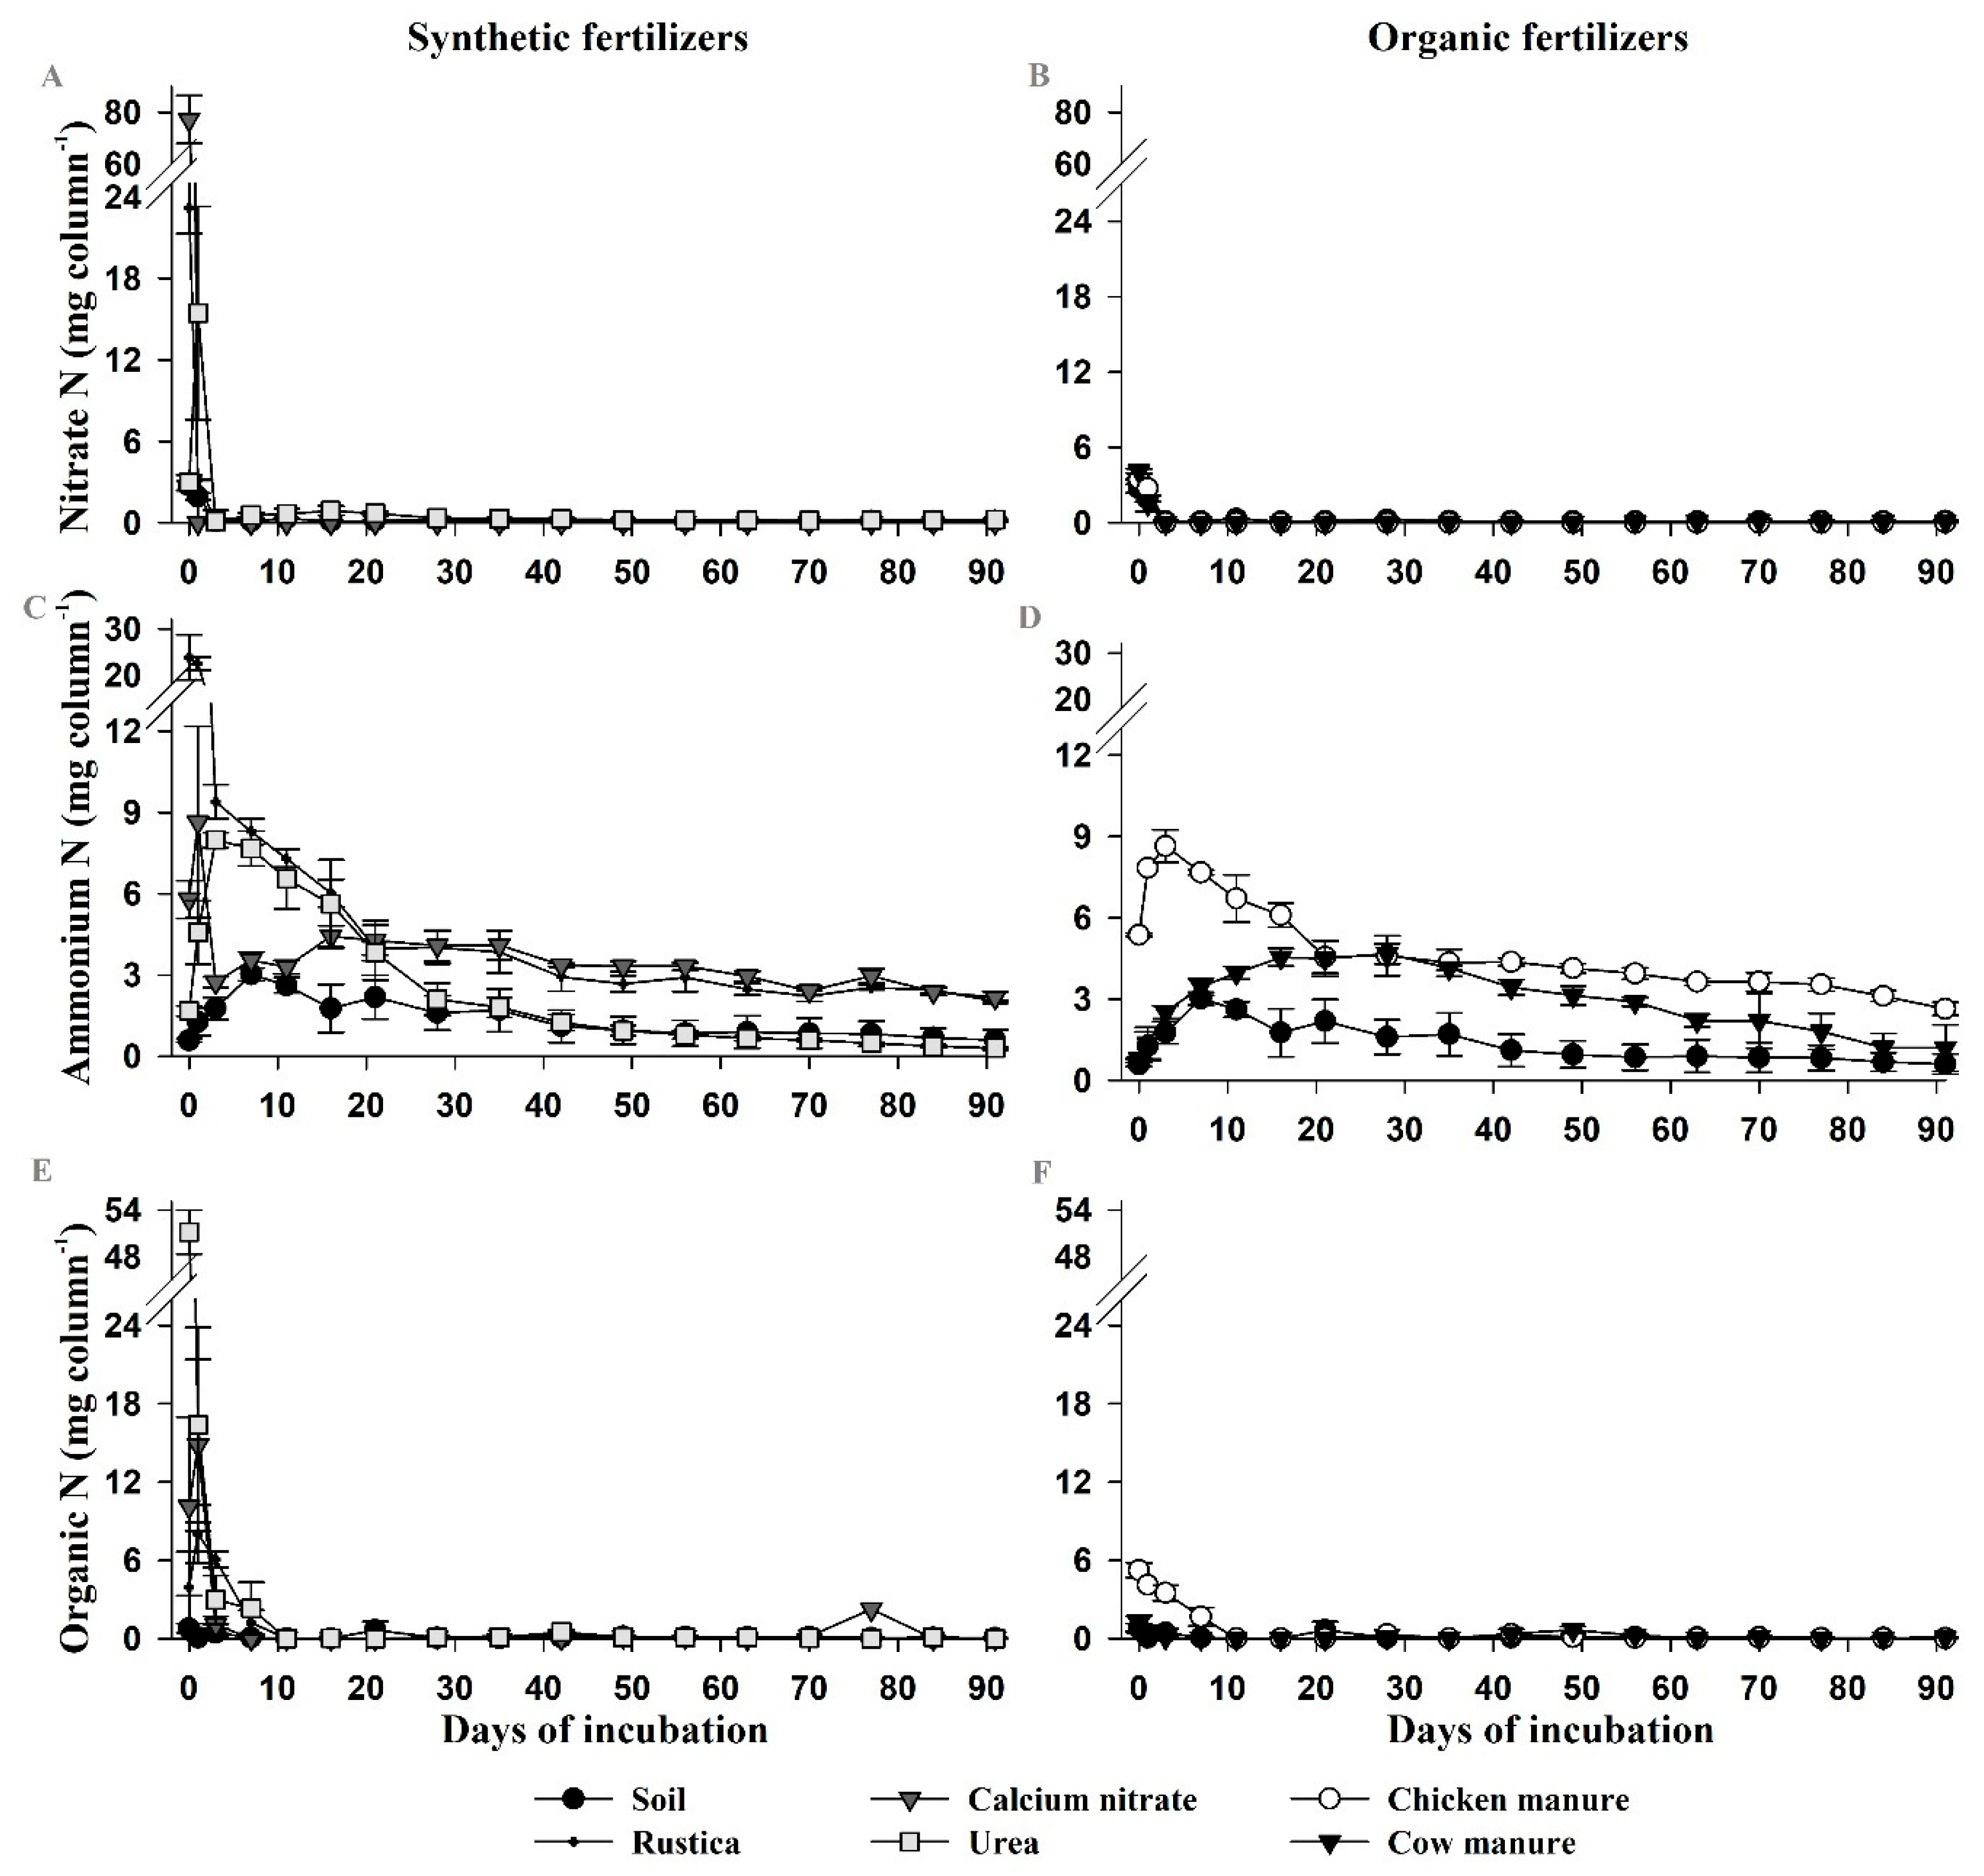
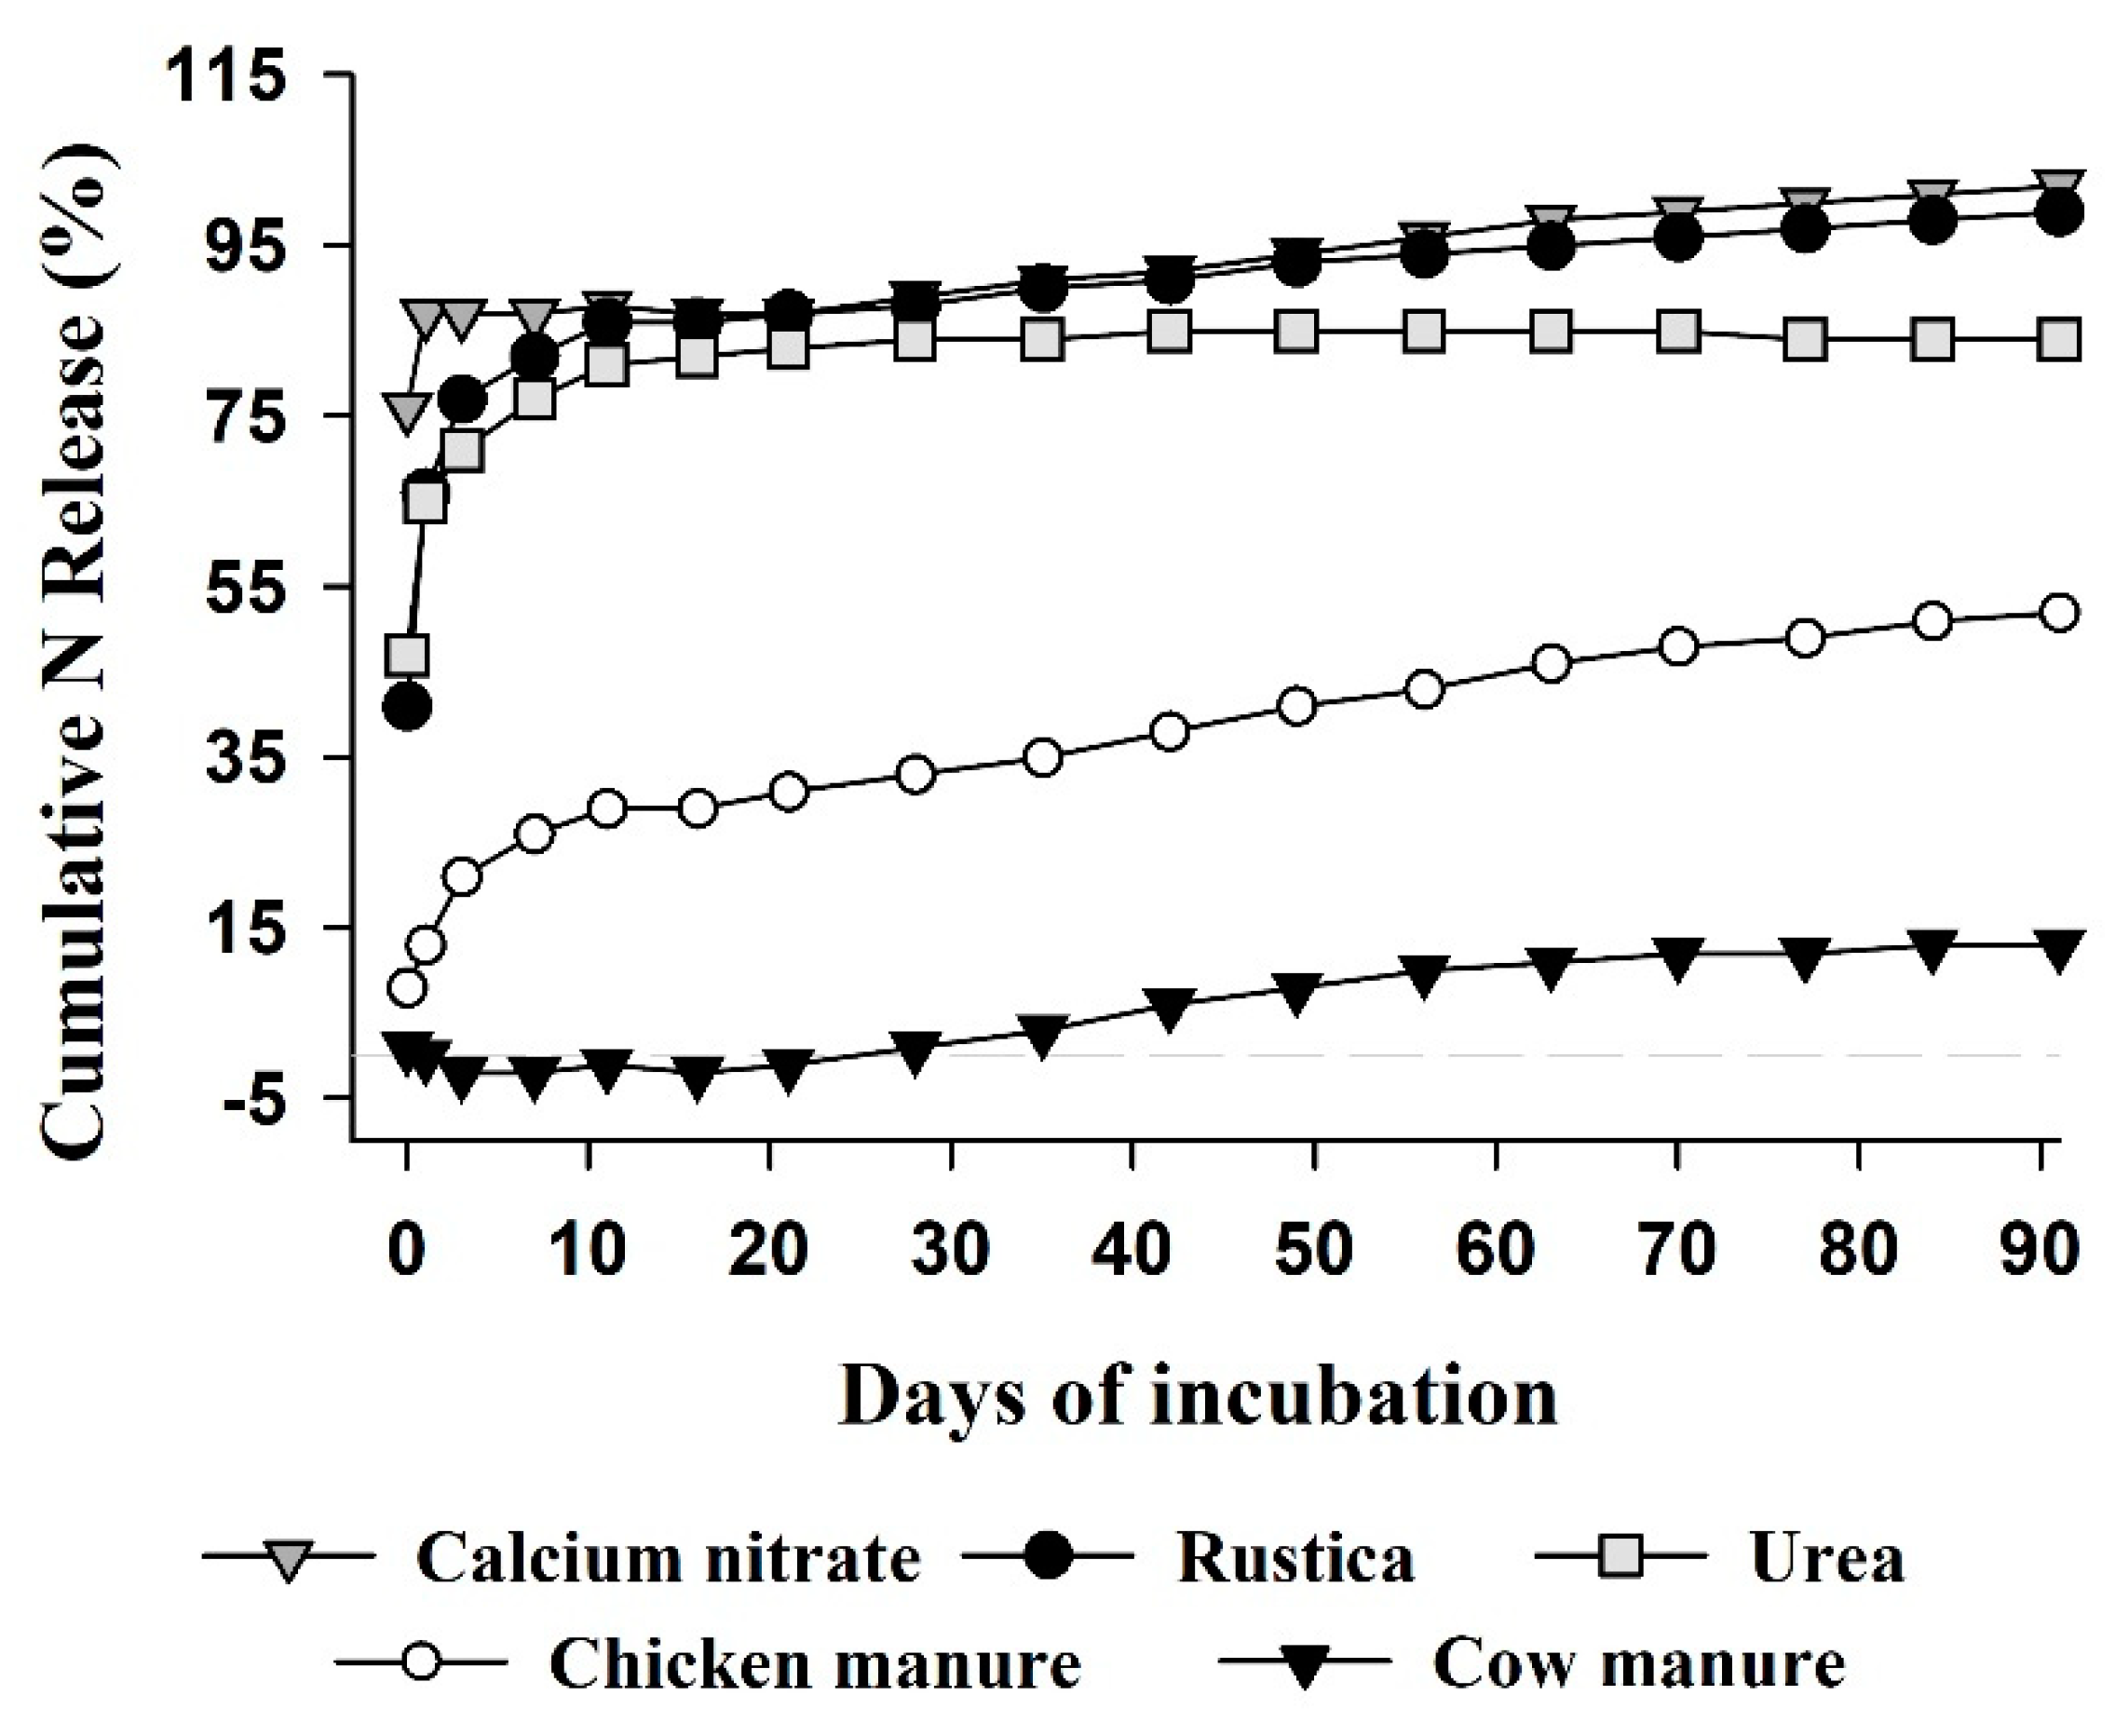
2.1. Experiment 1—Nitrogen Release Patterns from Organic and Mineral Fertilizers
2.2. Experiment 2—Yields and Glucosinolate Concentrations in Broccoli Grown with Organic and Mineral N Sources
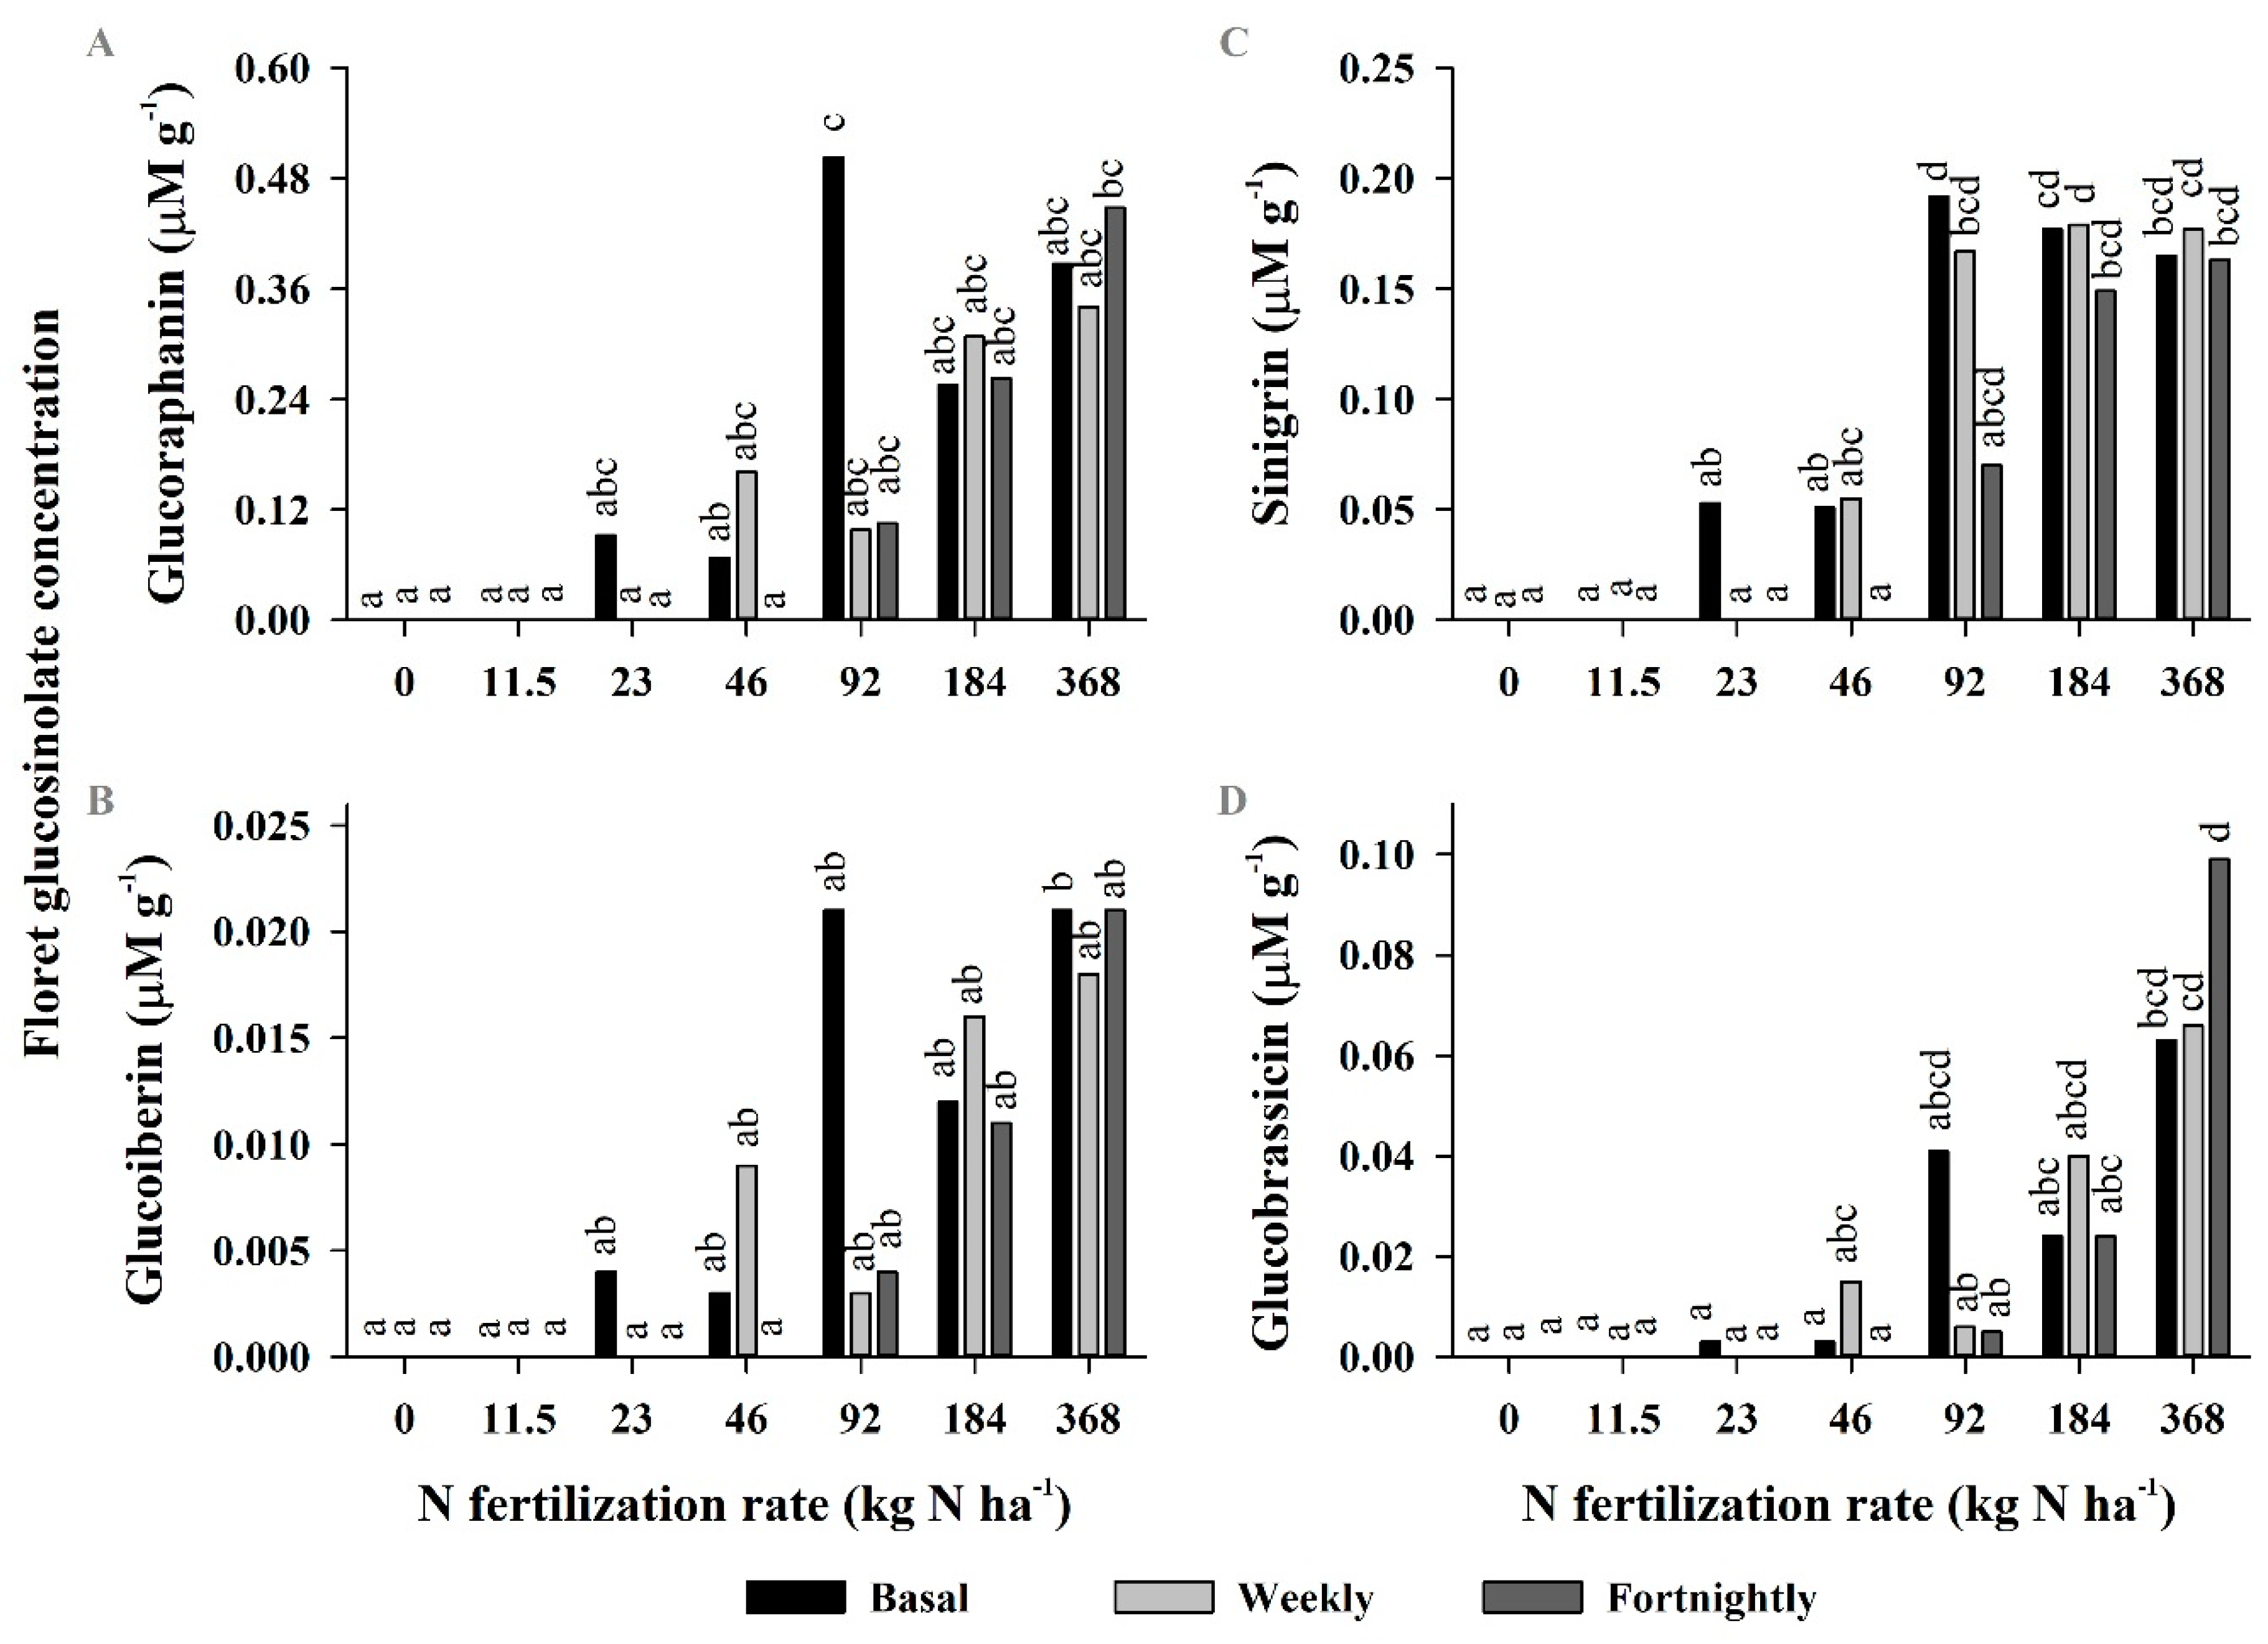
2.3. Experiment 3—Yields and Glucosinolate Concentrations in Broccoli Grown with Mineral N Applied Weekly, Fortnightly, or as Industry Practice (Three Split Applications)
2.4. Experiments 2 and 3—Broccoli Cultivation and Measurements
2.5. Statistical Analyses
3. Results
3.1. Experiment 1
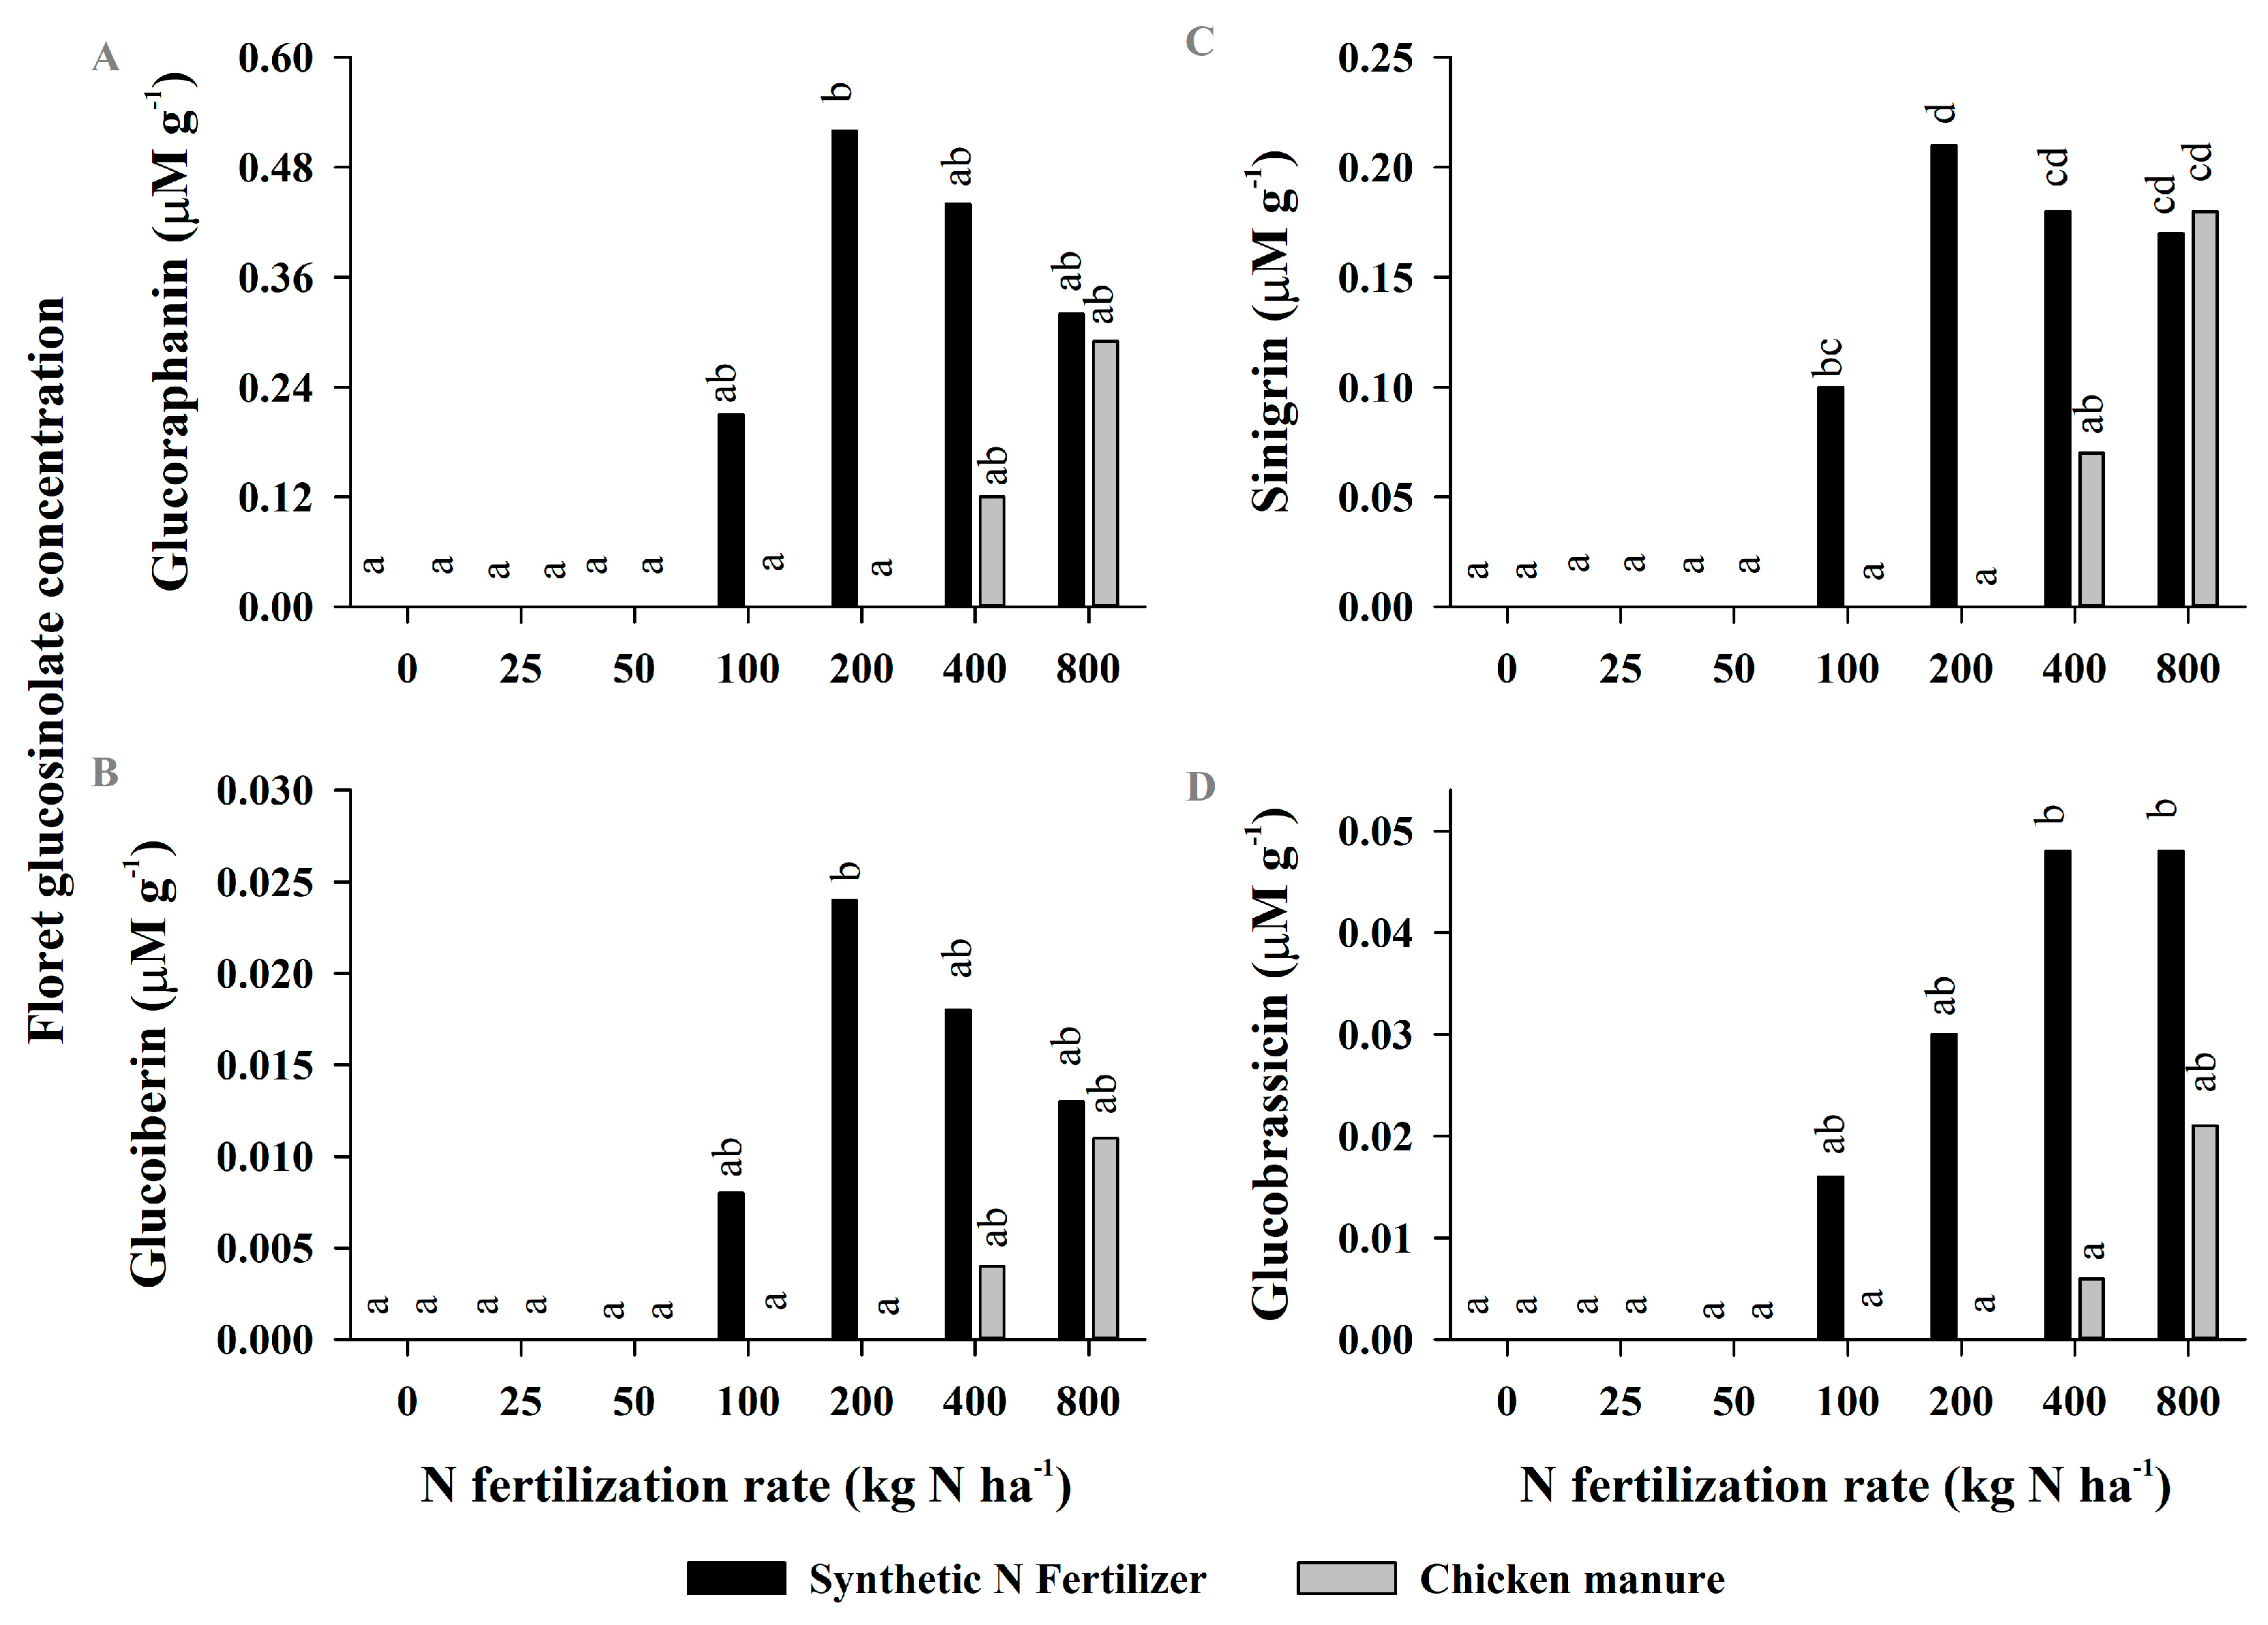
3.2. Experiment 2
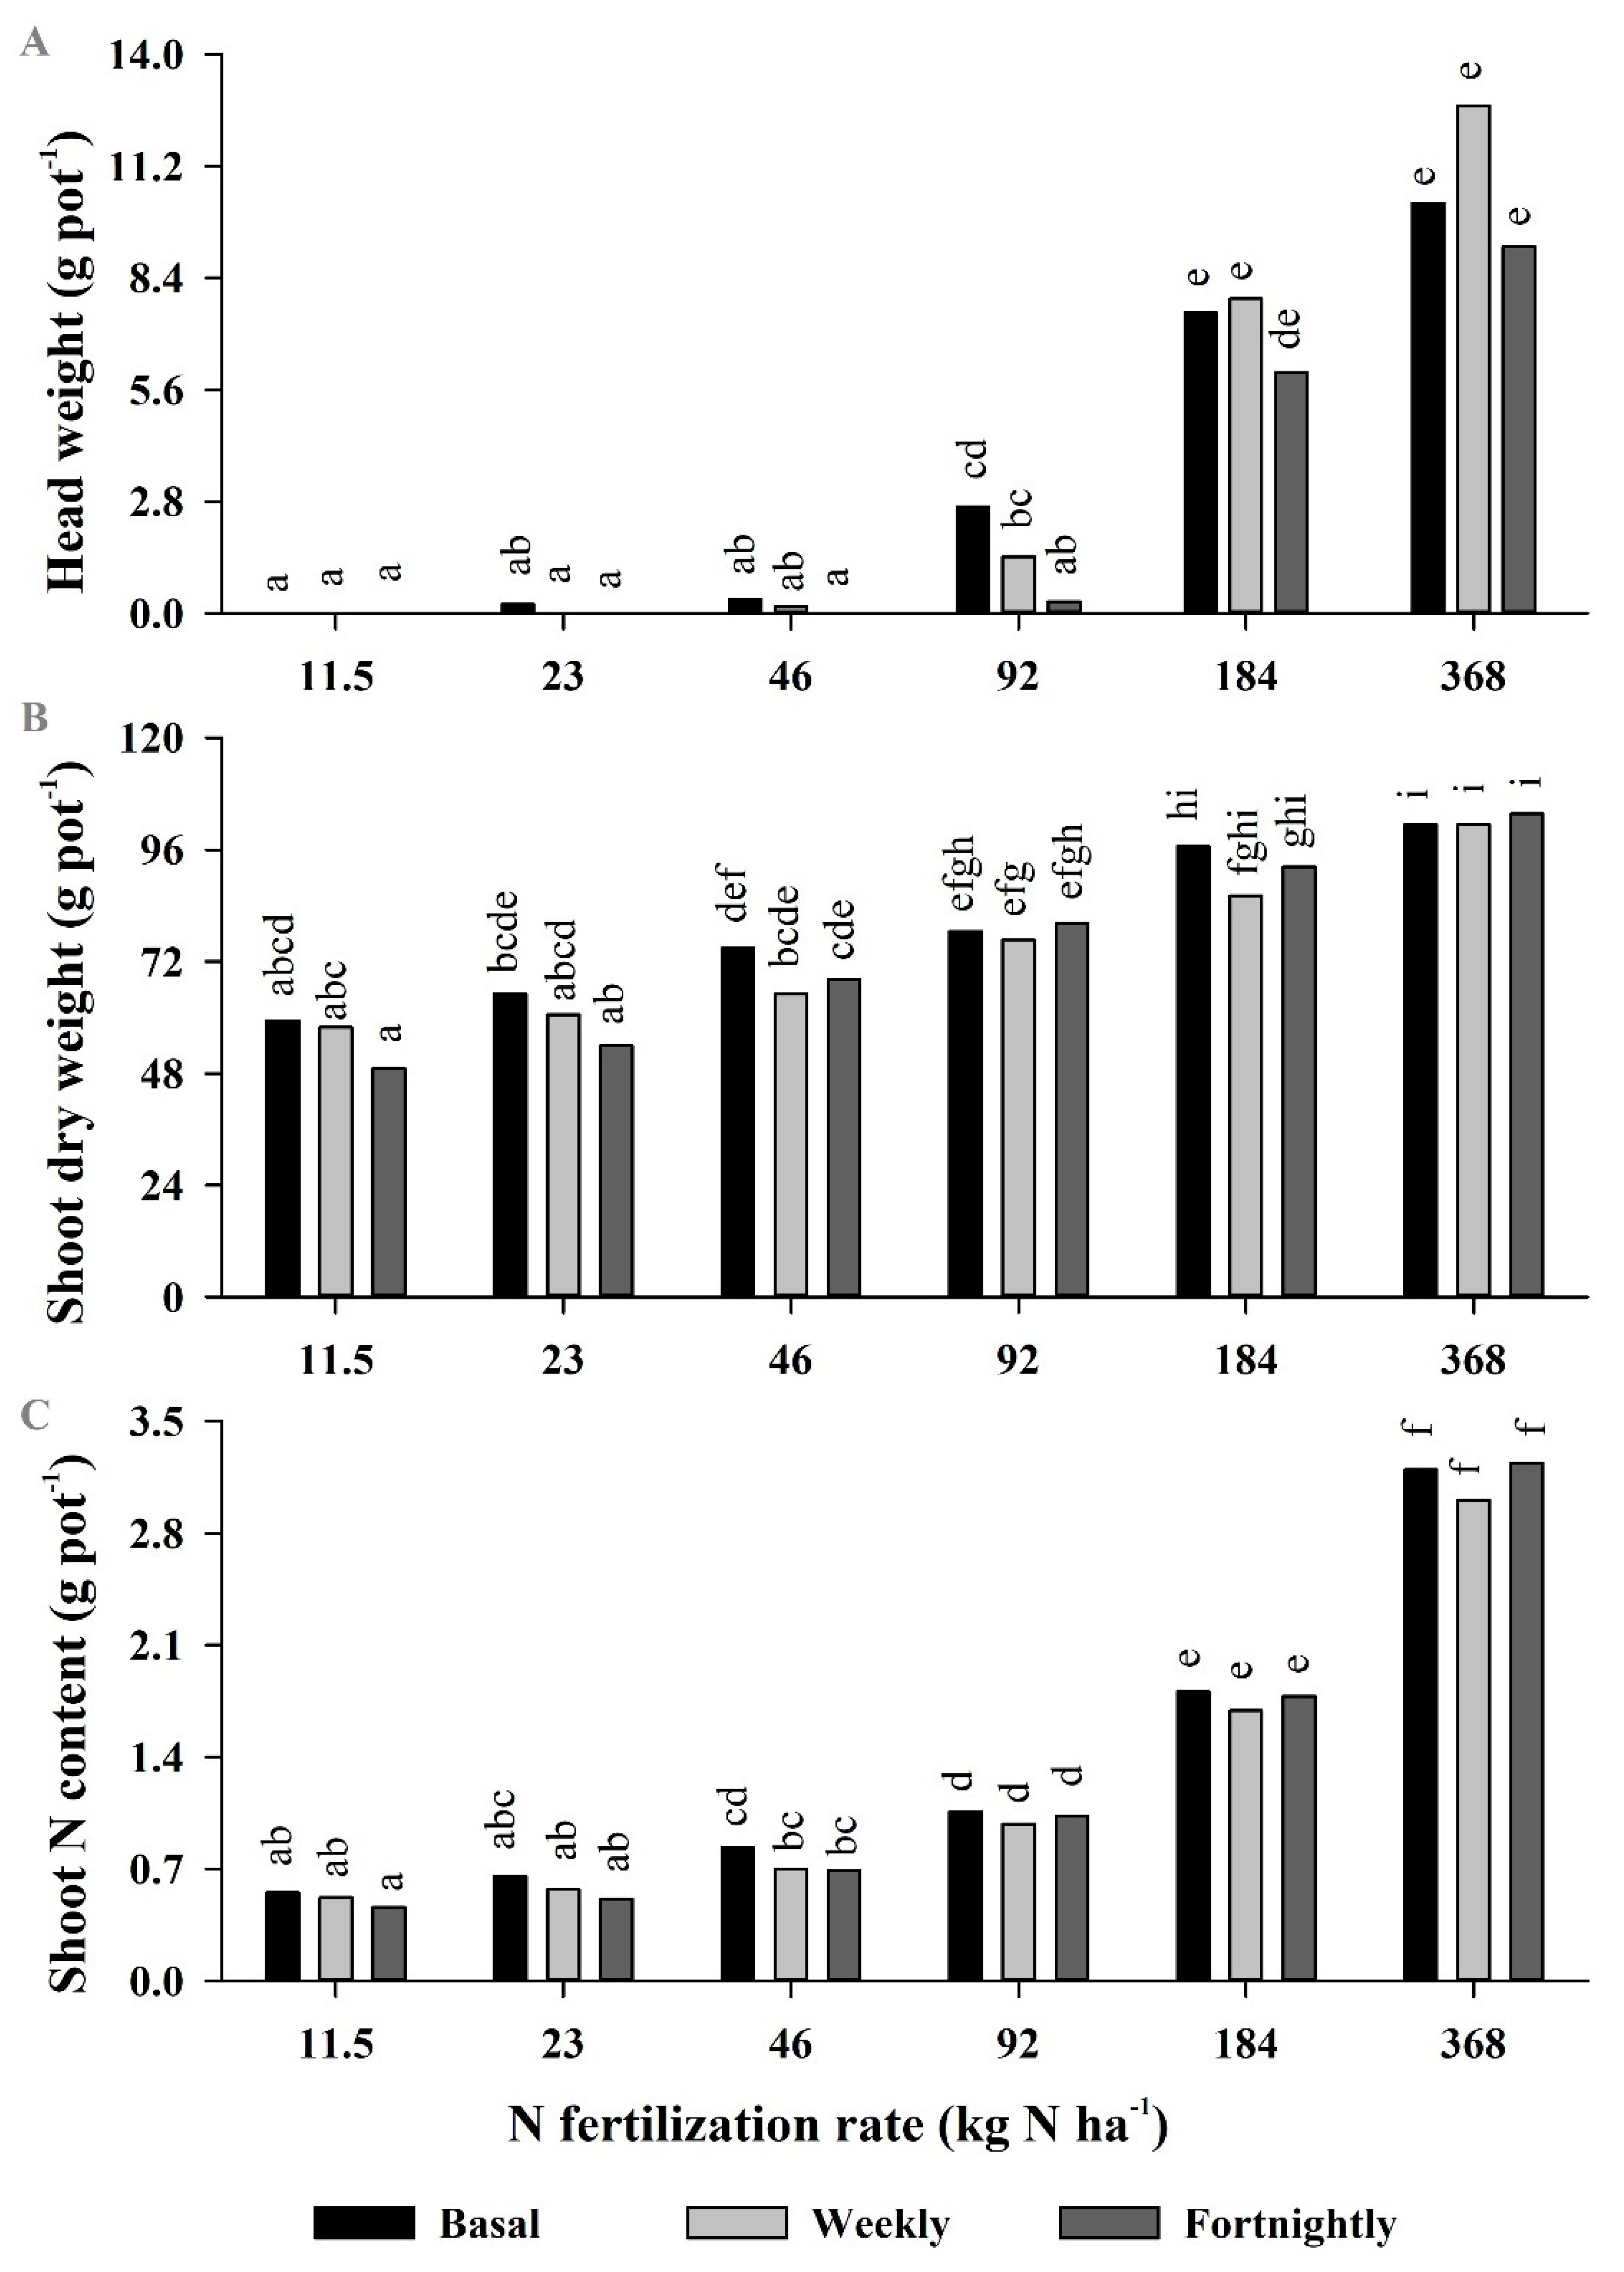
3.3. Experiment 3
4. Discussion
5. Conclusions
Author Contributions
Funding
Data Availability Statement
Acknowledgments
Conflicts of Interest
References
- Willer, H.; Trávníček, J.; Meier, C.; Schlatter, B. The World of Organic Agriculture 2021-Statistics and Emerging Trends; Research Institute of Organic Agriculture FiBL: Frick, Switzerland, 2021. [Google Scholar]
- Murphy, B.; Martini, M.; Fedi, A.; Loera, B.L.; Elliott, C.T.; Dean, M. Consumer trust in organic food and organic certifications in four European countries. Food Control 2022, 133, 108484. [Google Scholar] [CrossRef]
- Brandt, K.; Leifert, C.; Sanderson, R.; Seal, C.J. Agroecosystem Management and Nutritional Quality of Plant Foods: The Case of Organic Fruits and Vegetables. CRC Crit. Rev. Plant Sci. 2011, 30, 177–197. [Google Scholar] [CrossRef]
- Seufert, V.; Ramankutty, N.; Foley, J.A. Comparing the yields of organic and conventional agriculture. Nature 2012, 485, 229–232. [Google Scholar] [CrossRef] [PubMed]
- Ditlevsen, K.; Sandøe, P.; Lassen, J. Healthy food is nutritious, but organic food is healthy because it is pure: The negotiation of healthy food choices by Danish consumers of organic food. Food Qual. Prefer. 2019, 71, 46–53. [Google Scholar] [CrossRef]
- Baranski, M.; Srednicka-Tober, D.; Volakakis, N.; Seal, C.; Sanderson, R.; Stewart, G.B.; Benbrook, C.; Biavati, B.; Markellou, E.; Giotis, C.; et al. Higher antioxidant and lower cadmium concentrations and lower incidence of pesticide residues in organically grown crops: A systematic literature review and meta-analyses. Br. J. Nutr. 2014, 112, 794–811. [Google Scholar] [CrossRef]
- Rempelos, L.; Almuayrifi, A.M.; Baranski, M.; Tetard-Jones, C.; Eyre, M.; Shotton, P.; Cakmak, I.; Ozturk, L.; Cooper, J.; Volakakis, N.; et al. Effects of Agronomic Management and Climate on Leaf Phenolic Profiles, Disease Severity, and Grain Yield in Organic and Conventional Wheat Production Systems. J. Agric. Food Chem. 2018, 66, 10369–10379. [Google Scholar] [CrossRef]
- Zhao, X.; Nechols, J.R.; Williams, K.A.; Wang, W.; Carey, E.E. Comparison of phenolic acids in organically and conventionally grown pac choi (Brassica rapa L. chinensis). J. Sci. Food Agric. 2009, 89, 940–946. [Google Scholar] [CrossRef]
- Schmidt, L.; Zinkernagel, J. Opportunities of Reduced Nitrogen Supply for Productivity, Taste, Valuable Compounds and Storage Life of Cocktail Tomato. J. Hortic. 2021, 7, 48. [Google Scholar] [CrossRef]
- Smoleń, S.; Sady, W. The effect of various nitrogen fertilization and foliar nutrition regimes on the concentrations of sugars, carotenoids and phenolic compounds in carrot (Daucus carota L.). Sci. Hortic. 2009, 120, 315–324. [Google Scholar] [CrossRef]
- Boskovic-Rakocevic, L.; Pavlovic, R.; Zdravković, J.; Zdravkovic, M.; Pavlović, N.; Djuric, M. Effect of nitrogen fertilization on carrot quality. Afr. J. Agric. Res. 2012, 7, 2884–2900. [Google Scholar] [CrossRef]
- Barbieri, P.; Pellerin, S.; Seufert, V.; Smith, L.; Ramankutty, N.; Nesme, T. Global option space for organic agriculture is delimited by nitrogen availability. Nat. Food. 2021, 2, 363–372. [Google Scholar] [CrossRef] [PubMed]
- Connolly, E.L.; Sim, M.; Travica, N.; Marx, W.; Beasy, G.; Lynch, G.S.; Bondonno, C.P.; Lewis, J.R.; Hodgson, J.M.; Blekkenhorst, L.C. Glucosinolates from Cruciferous Vegetables and Their Potential Role in Chronic Disease: Investigating the Preclinical and Clinical Evidence. Front. Pharmacol. 2021, 12, 767975. [Google Scholar] [CrossRef] [PubMed]
- Borpatragohain, P.; Rose, T.J.; Liu, L.; Barkla, B.J.; Raymond, C.A.; King, G.J. Remobilization and fate of sulphur in mustard. Ann. Bot. 2019, 124, 471–480. [Google Scholar] [CrossRef]
- Ishida, M.; Hara, M.; Fukino, N.; Kakizaki, T.; Morimitsu, Y. Glucosinolate metabolism, functionality and breeding for the improvement of Brassicaceae vegetables. Breed. Sci. 2014, 64, 48–59. [Google Scholar] [CrossRef]
- Zhang, Y.; Tang, L. Discovery and development of sulforaphane as a cancer chemopreventive phytochemical. Acta Pharmacol. Sin. 2007, 28, 1343–1354. [Google Scholar] [CrossRef]
- Brown, A.F.; Yousef, G.G.; Reid, R.W.; Chebrolu, K.K.; Thomas, A.; Krueger, C.; Jeffery, E.; Jackson, E.; Juvik, J.A. Genetic analysis of glucosinolate variability in broccoli florets using genome-anchored single nucleotide polymorphisms. Theor. Appl. Genet. 2015, 128, 1431–1447. [Google Scholar] [CrossRef]
- Ben Ammar, H.; Sdouda, D.; Di Bella, M.C.; Treccarichi, S.; Cali, R.; Rosa, E.; de Castro, I.; Branca, F.; Marghali, S. Detection of glucosinolate metabolite pathway using SSR markers of Brassica oleracea complex species (n=9) core collection. Acta Hort. 2022, 1354, 105–110. [Google Scholar] [CrossRef]
- Schreiner, M. Vegetable crop management strategies to increase the quantity of phytochemicals. Eur. J. Nutr. 2005, 44, 85–94. [Google Scholar] [CrossRef] [PubMed]
- Schonhof, I.; Blankenburg, D.; Müller, S.; Krumbein, A. Sulfur and nitrogen supply influence growth, product appearance, and glucosinolate concentration of broccoli. J. Plant Nutr. Soil. Sci. 2007, 170, 65–72. [Google Scholar] [CrossRef]
- Jones, R.B.; Imsic, M.; Franz, P.; Hale, G.; Tomkins, R.B. High nitrogen during growth reduced glucoraphanin and flavonol content in broccoli (Brassica oleracea var. italica) heads. Aust. J. Exp. Agric. 2007, 47, 1498–1505. [Google Scholar] [CrossRef]
- Scheer, C.; Rowlings, D.W.; Firrel, M.; Deuter, P.; Morris, S.; Grace, P.R. Impact of nitrification inhibitor (DMPP) on soil nitrous oxide emissions from an intensive broccoli production system in sub-tropical Australia. Soil Biol. Biochem. 2014, 77, 243–251. [Google Scholar] [CrossRef]
- Chang, H.-S.C. Labelling issues of organic and GM foods in Australia. In Proceedings of the Australasian Agricultural and Resource Economics Society (AARES) > AARES Conferences > 2004 Conference (48th), Melbourne, Australia, 11–13 February 2004. [Google Scholar]
- Weng, Z.; Van Zwieten, L.; Singh, B.P.; Kimber, S.; Morris, S.; Cowie, A.; Macdonald, L.M. Plant-biochar interactions drive the negative priming of soil organic carbon in an annual ryegrass field system. Soil Biol. Biochem. 2015, 90, 111–121. [Google Scholar] [CrossRef]
- Eldridge, S.M.; Chen, C.; Xu, Z.; Chan, K.Y.; Boyd, S.E.; Collins, D.; Meszaros, I. Plant available N supply and recalcitrant C from organic soil amendments applied to a clay loam soil have correlations with amendment chemical composition. Geoderma 2017, 294, 50–62. [Google Scholar] [CrossRef]
- Bernzen, A.; Braun, B. Conventions in Cross-Border Trade Coordination: The Case of Organic Food Imports to Germany and Australia. Environ. Plan. A. 2014, 46, 1244–1262. [Google Scholar] [CrossRef]
- Yoshida, S.; Forno, D.A.; Cock, J. Laboratory Manual for Physiological Studies of Rice; CAB International: Wallingford, UK, 1971. [Google Scholar]
- Rayment, G.E.; Lyons, D.J. New, comprehensive soil chemical methods book for Australasia. Commun. Soil Sci. Plant Anal. 2012, 43, 412–418. [Google Scholar] [CrossRef]
- Lenth, R.; Lenth, M.R. Package ‘lsmeans’. Am. Stat. 2018, 34, 216–221. [Google Scholar]
- Hothorn, T.; Bretz, F.; Westfall, P. Simultaneous inference in general parametric models. Biom. J. 2008, 50, 346–363. [Google Scholar] [CrossRef]
- Valverde, J.; Reilly, K.; Villacreces, S.; Gaffney, M.; Grant, J.; Brunton, N. Variation in bioactive content in broccoli (Brassica oleracea var. italica) grown under conventional and organic production systems. J. Sci. Food Agric. 2015, 95, 1163–1171. [Google Scholar] [CrossRef]
- Meyer, M.; Adam, S.T. Comparison of glucosinolate levels in commercial broccoli and red cabbage from conventional and ecological farming. Eur. Food Res. Technol. 2008, 226, 1429–1437. [Google Scholar] [CrossRef]
- Niedziński, T.; Sierra, M.J.; Łabętowicz, J.; Noras, K.; Cabrales, C.; Millán, R. Release of Nitrogen from Granulate Mineral and Organic Fertilizers and Its Effect on Selected Chemical Parameters of Soil. Agronomy 2021, 11, 1981. [Google Scholar] [CrossRef]
- Weng, Z.; Liu, X.; Eldridge, S.; Wang, H.; Rose, T.; Rose, M.; Rust, J.; Singh, B.P.; Tavakkoli, E.; Tang, C.; et al. Priming of soil organic carbon induced by sugarcane residues and its biochar control the source of nitrogen for plant uptake: A dual 13C and 15N isotope three-source-partitioning study. Soil Biol. Biochem. 2020, 146, 107792. [Google Scholar] [CrossRef]
- Geisseler, D.; Smith, R.; Cahn, M.; Muramoto, J. Nitrogen mineralization from organic fertilizers and composts: Literature survey and model fitting. J. Environ. Qual. 2021, 50, 1325–1338. [Google Scholar] [CrossRef] [PubMed]
- Chrystal, J.M.; Smith, L.C.; Monaghan, R.M.; Hedley, M.; Horne, D. Effects of applying dairy wintering barn manure of differing C:N ratios directly to pasture on N mineralisation and forage growth. New Zealand J. Agric. Res. 2016, 59, 324–331. [Google Scholar] [CrossRef]
- Hsu, C.-M.; Lai, H.-Y. Comprehensive Assessment of the Influence of Applying Two Kinds of Chicken-Manure-Processed Organic Fertilizers on Soil Properties, Mineralization of Nitrogen, and Yields of Three Crops. Agronomy 2022, 12, 2355. [Google Scholar] [CrossRef]
- Omirou, M.D.; Papadopoulou, K.K.; Papastylianou, I.; Constantinou, M.; Karpouzas, D.G.; Asimakopoulos, I.; Ehaliotis, C. Impact of nitrogen and sulfur fertilization on the composition of glucosinolates in relation to sulfur assimilation in different plant organs of broccoli. J. Agric. Food Chem. 2009, 57, 9408–9417. [Google Scholar] [CrossRef]
- Renaud, E.N.C.; Lammerts van Bueren, E.T.; Myers, J.R.; Paulo, M.J.; van Eeuwijk, F.A.; Zhu, N.; Juvik, J.A. Variation in Broccoli Cultivar Phytochemical Content under Organic and Conventional Management Systems: Implications in Breeding for Nutrition. PLoS ONE 2014, 9, e95683. [Google Scholar] [CrossRef]
- Ilahy, R.; Tlili, I.; Pék, Z.; Montefusco, A.; Siddiqui, M.W.; Homa, F.; Hdider, C.; R’Him, T.; Lajos, H.; Lenucci, M.S. Pre- and Post-harvest Factors Affecting Glucosinolate Content in Broccoli. Front. Nutr. 2020, 7, 147. [Google Scholar] [CrossRef]
- Wang, J.; Yu, H.; Zhao, Z.; Sheng, X.; Shen, Y.; Gu, H. Natural Variation of Glucosinolates and Their Breakdown Products in Broccoli (Brassica oleracea var. italica) Seeds. J. Agric. Food Chem. 2019, 67, 12528–12537. [Google Scholar] [CrossRef]
- Eugui, D.; Velasco, P.; Abril-Urías, P.; Escobar, C.; Gómez-Torres, Ó.; Caballero, S.; Poveda, J. Glucosinolate-extracts from residues of conventional and organic cultivated broccoli leaves (Brassica oleracea var. italica) as potential industrially-scalable efficient biopesticides against fungi, oomycetes and plant parasitic nematodes. Ind. Crops Prod. 2023, 200, 116841. [Google Scholar] [CrossRef]
- Edmeades, D.C. The long-term effects of manures and fertilisers on soil productivity and quality: A review. Nutr. Cycling Agroecosyst. 2003, 66, 165–180. [Google Scholar] [CrossRef]
- Kim, S.-Y.; Yang, J.; Dang, Y.-M.; Ha, J.-H. Effect of fermentation stages on glucosinolate profiles in kimchi: Quantification of 14 intact glucosinolates using ultra-performance liquid chromatography-tandem mass spectrometry. Food Chem X 2022, 15, 100417. [Google Scholar] [CrossRef] [PubMed]
- Borpatragohain, P.; Rose, T.J.; Liu, L.; Raymond, C.A.; Barkla, B.J.; King, G.J. Seed glucosinolate yield is maximized by higher rates of sulfur nutrition than required for seed yield in condiment mustard (Brassica juncea L.). PLoS ONE 2019, 14, e0213429. [Google Scholar] [CrossRef] [PubMed]


| Property | Ferralsol | Chicken Manure Pellets | Composted Cow Manure |
|---|---|---|---|
| pH (1:5 water) | 5.5 ± 0.0 | 6.5 ± 0.0 | 7.8 ± 0.0 |
| Electrolytic Conductivity (dS m−1) | 0.0 ± 0.0 | 15 ± 0.3 | 2.7 ± 0.1 |
| Bray 1 Phosphorus (mg kg−1) | 4.4 ± 0.1 | ||
| Colwell Phosphorus (mg kg−1) | 39 ± 1.4 | ||
| Nitrate-N (mg kg−1) | 7.1 ± 0.1 | ||
| Ammonium-N (mg kg−1) | 11 ± 0.0 | ||
| Exchangeable Calcium (cmol kg−1) | 3.3 ± 0.0 | ||
| Exchangeable Magnesium (cmol kg−1) | 0.7 ± 0.0 | ||
| Exchangeable Potassium (cmol kg−1) | 0.5 ± 0.0 | ||
| Exchangeable Sodium (cmol kg−1) | 0.1 ± 0.0 | ||
| Exchangeable Aluminum (cmol kg−1) | 0.3 ± 0.0 | ||
| Effective CEC (cmol kg−1) | 5.2 ± 0.1 | ||
| DTPA-extractable Zinc (mg kg−1) | 1.5 ± 0.1 | ||
| DTPA-extractable Manganese (mg kg−1) | 13 ± 0.0 | ||
| DTPA-extractable Iron (mg kg−1) | 93 ± 23 | ||
| DTPA-extractable Copper (mg kg−1) | 0.6 ± 0.0 | ||
| Total Carbon% | 3.9 | 36 ± 0.1 | 7.3 ± 0.1 |
| Total Nitrogen% | 0.3 | 3.7 ± 0.0 | 0.6 ± 0.0 |
| Total Calcium% | 3.6 ± 0.1 | 1.8 ± 0.1 | |
| Total Magnesium% | 0.8 ± 0.0 | 0.3 ± 0.0 | |
| Total Potassium% | 2.6 ± 0.2 | 0.6 ± 0.0 | |
| Total Sodium% | 0.6 ± 0.0 | 0.1 ± 0.0 | |
| Total Sulphur% | 1.3 ± 0.0 | 0.2 ± 0.0 | |
| Total Phosphorus% | 1.6 ± 0.1 | 0.4 ± 0.0 | |
| Total Zinc (mg kg−1) | 479 ± 8.5 | 145 ± 6.4 | |
| Total Manganese (mg kg−1) | 512 ± 8.5 | 614 ± 41 | |
| Total Iron (mg kg−1) | 6348 ± 450 | 21,705 ± 1571 | |
| Total Copper (mg kg−1) | 208 ± 2.1 | 38 ± 1.3 | |
| Total Boron (mg kg−1) | 45.6 ± 2.7 | 20 ± 0.3 |
| Experiment 2 | Fert. Source | Fert. Rate | Interaction |
| Head weight | ** | *** | * |
| Shoot dry weight | ns | * | ns |
| Shoot N content | *** | *** | *** |
| Glucoraphanin | ** | *** | * |
| Glucoiberin | ** | * | ns |
| Sinigrin | *** | *** | *** |
| Glucobrassicin | *** | *** | ns |
| Experiment 3 | Fert. timing | Fert. rate | Interaction |
| Head weight | ** | *** | ns |
| Shoot dry weight | ** | *** | * |
| Shoot N content | ** | *** | ns |
| Glucoraphanin | ns | *** | ns |
| Glucoiberin | ns | *** | ns |
| Sinigrin | ** | *** | ns |
| Glucobrassicin | ns | *** | ns |
Disclaimer/Publisher’s Note: The statements, opinions and data contained in all publications are solely those of the individual author(s) and contributor(s) and not of MDPI and/or the editor(s). MDPI and/or the editor(s) disclaim responsibility for any injury to people or property resulting from any ideas, methods, instructions or products referred to in the content. |
© 2024 by the authors. Licensee MDPI, Basel, Switzerland. This article is an open access article distributed under the terms and conditions of the Creative Commons Attribution (CC BY) license (https://creativecommons.org/licenses/by/4.0/).
Share and Cite
Willson, A.K.; Rose, M.T.; Reading, M.J.; Borpatragohain, P.; Rose, T.J. Organic Nitrogen Nutrition Does Not Increase Glucosinolate Concentrations in Broccoli (Brassica oleracea L. var. italica). Horticulturae 2024, 10, 1122. https://doi.org/10.3390/horticulturae10101122
Willson AK, Rose MT, Reading MJ, Borpatragohain P, Rose TJ. Organic Nitrogen Nutrition Does Not Increase Glucosinolate Concentrations in Broccoli (Brassica oleracea L. var. italica). Horticulturae. 2024; 10(10):1122. https://doi.org/10.3390/horticulturae10101122
Chicago/Turabian StyleWillson, Adam K., Mick T. Rose, Michael J. Reading, Priyakshee Borpatragohain, and Terry J. Rose. 2024. "Organic Nitrogen Nutrition Does Not Increase Glucosinolate Concentrations in Broccoli (Brassica oleracea L. var. italica)" Horticulturae 10, no. 10: 1122. https://doi.org/10.3390/horticulturae10101122
APA StyleWillson, A. K., Rose, M. T., Reading, M. J., Borpatragohain, P., & Rose, T. J. (2024). Organic Nitrogen Nutrition Does Not Increase Glucosinolate Concentrations in Broccoli (Brassica oleracea L. var. italica). Horticulturae, 10(10), 1122. https://doi.org/10.3390/horticulturae10101122