Article

Extending Raspberry Shelf Life and Maintaining Postharvest Quality with CO2 Atmospheres

by
Mohd Rezaul Islam
* and
Elizabeth Mitcham
*
Department of Plant Sciences, University of California, Davis, CA 95616, USA
*
Authors to whom correspondence should be addressed.
Horticulturae 2024, 10(10), 1092; https://doi.org/10.3390/horticulturae10101092
Submission received: 21 August 2024 / Revised: 30 September 2024 / Accepted: 9 October 2024 / Published: 12 October 2024
(This article belongs to the Section Postharvest Biology, Quality, Safety, and Technology)

Abstract

:
Raspberry (Rubus idaeus L.) fruit are known for their extremely short shelf life. Decay, leakiness, and loss of firmness are the most common limiting factors contributing to their short storage life. However, storage in elevated CO2 and reduced O2 atmospheres can delay senescence in fruit by reducing softening, respiration and ethylene production rates, and pathogen growth. In this study, raspberries were exposed to four different CO2 atmospheres—15 kPa CO2 and 6 kPa O2 (15 kPa); 8 kPa CO2 and 13 kPa O2 (8 kPa); 5 kPa CO2 and 16 kPa O2 (5 kPa); or 0.03 kPa CO2 and 21 kPa O2 (0.03 kPa)—and were evaluated for their postharvest quality periodically during two weeks of storage in 2020 and 2021. Raspberry fruits kept in a 15 kPa CO2 atmosphere followed by 8 kPa CO2 had higher firmness, brighter red color, and the least fungal decay or leakiness. In all atmospheres, the total anthocyanin content increased over time, although the rate of increase was slowed by high CO2. The raspberries’ visual attributes deteriorated over time in all atmospheres, but high CO2 atmospheres slowed the rate of deterioration. After five days, the quality of air-stored raspberries was significantly degraded, while the raspberries stored in elevated CO2 maintained good quality for up to ten days.

1. Introduction

The raspberry (Rubus idaeus L.) is a high-value fruit, but its shelf life is impacted by high perishability. In 2020, the United States produced 111,000 tons of raspberries at a value of USD 469 million, and California alone contributed fresh raspberries worth USD 395 million [1]. Raspberry’s delicate morphology coupled with high respiration and transpiration rates make the fruit vulnerable to rapid deterioration after harvest. The typical shelf life of a raspberry ranges from 3 to 5 d [2]. Decay, leakiness, loss of firmness, darkening of the red color, and off-flavors are common limiting factors contributing to the short storage life of raspberries [3]. It is well established that cooling is by far the best technology for increasing the shelf life of horticultural produce. Low temperatures slow pathogen growth and reduce the rate of deterioration of freshly harvested commodities, thus extending their shelf life and the marketing period [4]. The recommended temperature for raspberry storage is 0 to 1 °C [3], but it is challenging to maintain this recommended temperature during transportation and marketing. Although low storage temperatures can slow the development of Botrytis cinerea infections, they do not provide adequate control when the inoculum loads are high [5]. Atmospheres enriched in CO2 can create fungistatic conditions and, therefore, inhibit the growth of fungi. Raspberries exposed to CO2 levels of 20 kPa or higher showed delayed gray mold decay and an extended shelf life [6]. Nine red raspberry genotypes were stored in controlled atmospheres (CA) with 12.5 kPa CO2 and 7.5 kPa O2 for 50 d at 1 °C, and decay development was strongly suppressed across all genotypes [7]. Our objective was to determine the optimum atmosphere to extend the raspberry’s shelf life and maximize its quality during transit or storage by assessing the fruit’s response to a range of CO2 atmospheres. We also developed a novel method to assess raspberry leakiness.

2. Materials and Methods

Freshly harvested, non-organic, ready-to-eat red raspberries (Rubus idaeus L., cv. Maravilla) were obtained immediately after harvest from a commercial grower in Watsonville, CA, in the fall of 2020 and 2021. The raspberries were field packed into clamshells (170 g) and precooled at 1 °C at a commercial facility in Watsonville, California. The cooled fruits were transported on the same day in an air-conditioned vehicle to the UC Davis postharvest laboratory within three hours. The raspberries were held at 5 °C overnight, and the next day, the baseline quality of a sample of fruit was analyzed before randomly assigning the remaining clamshells to different atmosphere treatments at 5 °C. The fruit was removed from the atmosphere treatments after 6, 10, and 14 d in 2020 and 5, 10, and 13 d in 2021 and immediately evaluated to assess the changes in the fruit’s physical quality over time in storage. The performance of the fruit in each treatment atmosphere was evaluated from the perspective of the raspberry’s shelf life and quality.

2.1. Treatment Atmospheres and Experimental Setup

In both years, the raspberries packed in clamshells were stored at 5 °C for up to 14 or 13 d in 2020 or 2021, respectively, in one of four atmosphere treatments: 15 kPa CO2 and 6 kPa O2 (15 kPa); 8 kPa CO2 and 13 kPa O2 (8 kPa); 5 kPa CO2 and 16 kPa O2 (5 kPa); or 0.03 kPa CO2 and 21 kPa O2 (0.03 kPa). These atmospheric treatments simulate the mixture of O2 and CO2 concentrations that would be present in a modified-atmosphere package aiming for 15, 8, and 5 kPa CO2 as well as an unmodified-atmosphere package (air). The gas concentrations were measured during set up and periodically with a CO2/O2 gas analyzer (Systec Gas Advance Micro-GS3, Boston, MA, USA). The four atmospheres were humidified by bubbling through water prior to fruit exposure in a continuous flow-through system at a rate of 100 mL/min (Supplementary Figure S5), similar to the system described by Carmelo et al. [8]. The raspberry fruit remained in the clamshells during treatment. For each atmospheric condition, there were nine plastic bags (0.127 mm thick transparent bag; 50.8 × 61.0 cm) with six clamshells inside each. There were three plastic bags for each assessment day (3 assessment time points). The bags were modified with an inlet and outlet port and connected to a separate gas flow board for each atmosphere.

2.2. Quality Evaluations

The respiration rate and ethylene production were measured at 5 °C on each evaluation date. Fruit for the 0 d evaluation was cooled overnight before measurement. After removing the stored raspberries from the different atmospheres, the fruit was held at 5 °C in air for 18 to 20 h to off-gas before being sealed inside a 10 L container for 1 h at 5 °C prior to gas sampling. Headspace gas samples were collected and analyzed for CO2 (Horiba infrared gas analyzer, Irvine, CA, USA) and ethylene (Carle gas chromatograph, Tulsa, OK, USA) concentrations. The respiration and ethylene production rates were calculated and expressed as mL CO2·kg−1·h−1 and µL·ethylene·kg−1·h−1, respectively.
One clamshell per treatment and replication was weighed before being sealed in the plastic bags. The percent weight loss was calculated by deducting the measured final weight from the initial weight, dividing the resulting value by the initial weight, and multiplying it by 100. Leakiness was assessed subjectively on one clamshell per treatment and replication. In 2020, a single layer of paper towel was laid on a tray. The whole clamshell of raspberries was gently poured onto the tray, and then the tray was shaken five times back and forth, gently, but enough to move the berries. The tissue paper was evaluated for the juice marks resulting from the berries’ leaking and ranked based on their intensity, where 1 = none, 2 = very slight, 3 = slight, 4 = moderate, and 5 = severe. In 2021, an improved method was developed. The raspberries from one clamshell were arranged on a white paper divided into 40 square blocks; an individual raspberry was placed horizontally on each block for leakiness evaluation. A similar paper (with printed square blocks) was used to cover the raspberries and pressed very gently onto the fruit for 1 s. The top paper and the fruit were removed, and the papers’ printed square blocks (bottom and top) were evaluated and scored for liquid stains resulting from berry leakage. The scores for each fruit (block) were assigned based on the intensity, where 1 = none, 2 = very slight, 3 = slight, 4 = moderate, and 5 = severe (Supplementary Figure S1). The number of berries with a score of 2 or higher were divided by the total number of berries to determine the percentage of affected fruit. The leakiness severity was calculated by summing up the severity scores of the fruit with a score of 2 or higher (leaky fruit) and dividing by the total number of leaky berries.
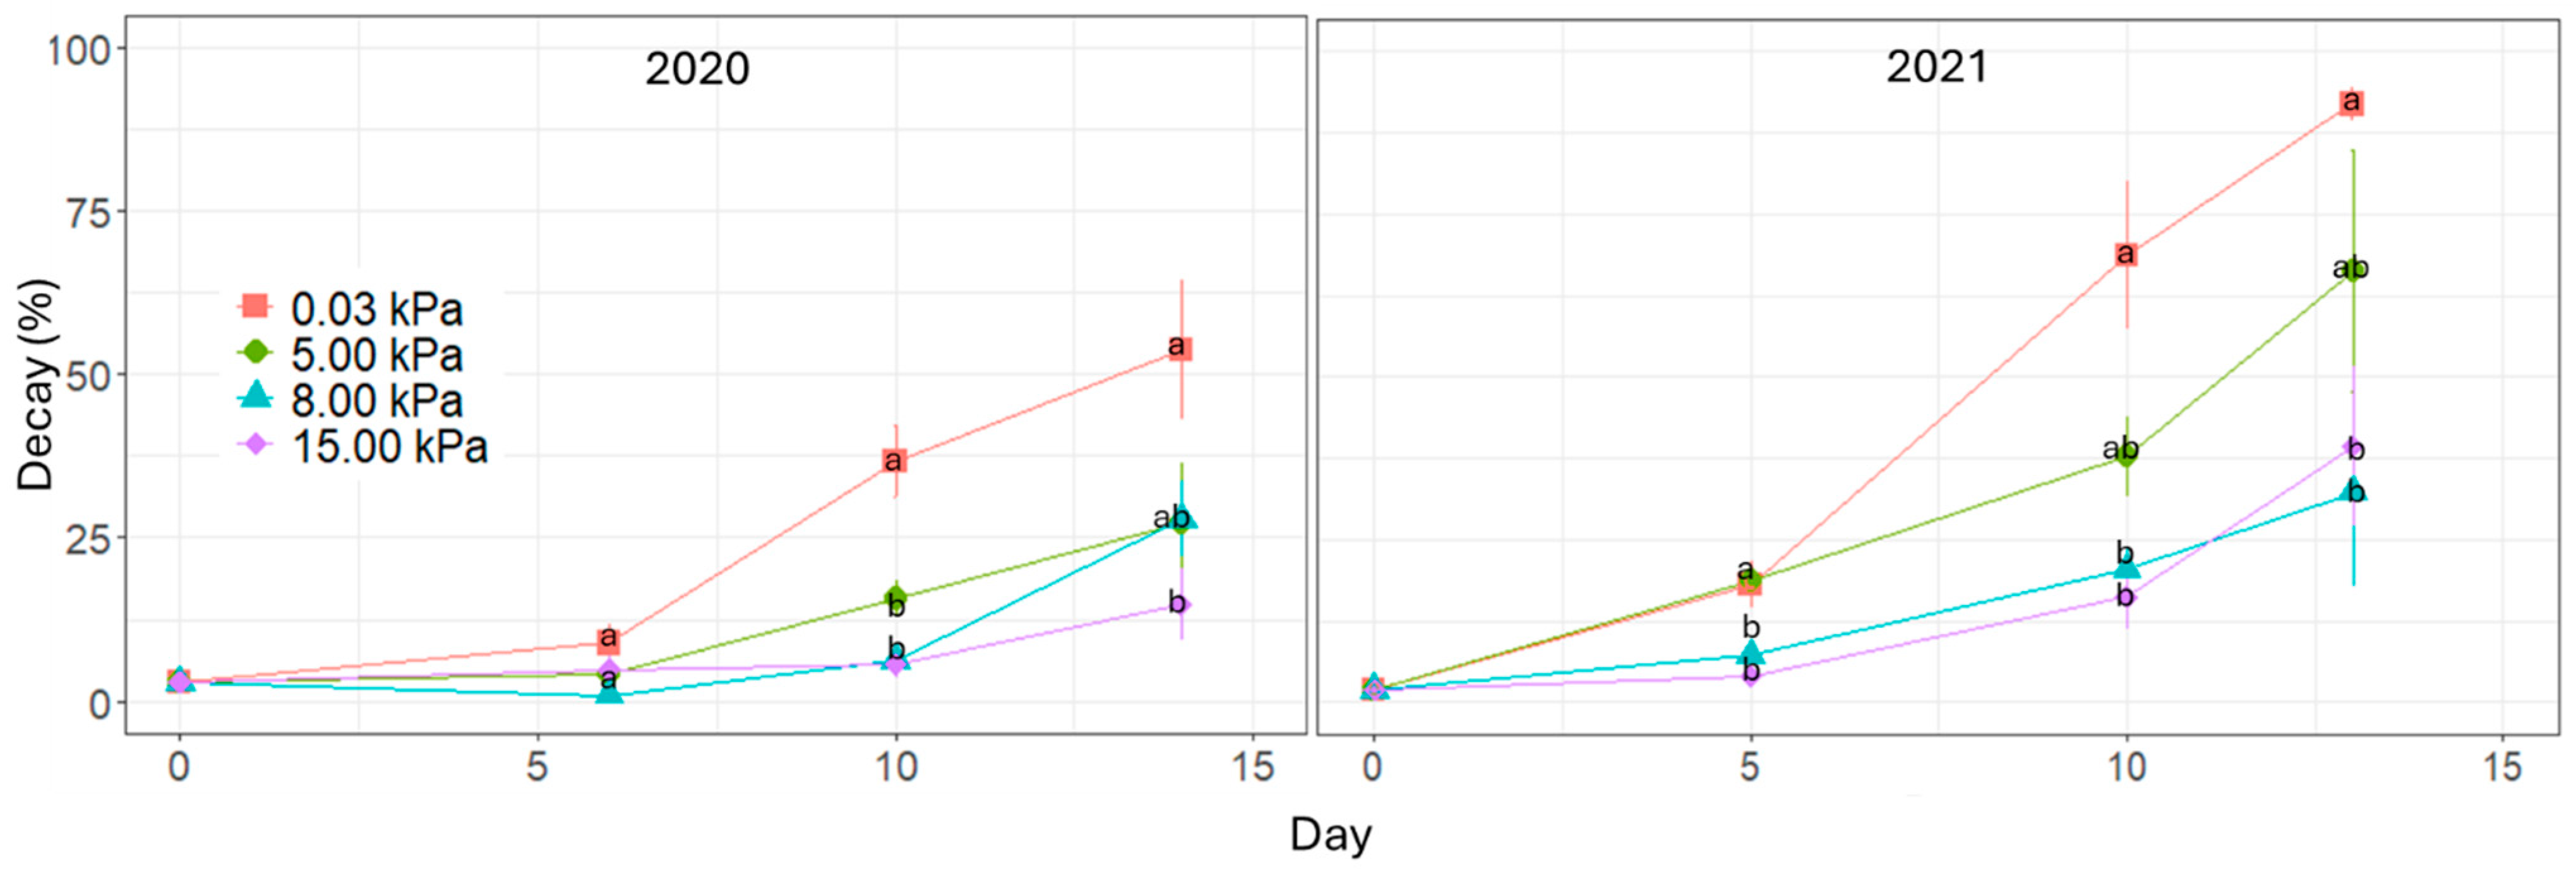
Decay was evaluated visually on the fruit from the same clamshell as leakiness. The severity of infection on each fruit was scored using a scale of 1 to 5, where 1 = none; 2 = very slight, 1–3 decayed drupelets; 3 = slight, 4–6 decayed drupelets; 4 = moderate, 7–9 decayed drupelets; and 5 = severe, >9 decayed drupelets (Supplementary Figure S2). The number of berries with a score of 2 or higher was divided by the total number of berries and multiplied by 100 to determine the percentage of decayed fruit. The decay severity was calculated by summing up the severity scores of the fruit with a score of 2 or higher (decayed fruit) and dividing by the total number of decayed berries.
Ten raspberries were randomly selected from one clamshell per treatment and replication to evaluate their color using a chroma meter (Konica Minolta Sensing Americas, Inc., Ramsey, NJ, USA) with the CIELAB color space. The color of the external surface of the raspberries was measured and expressed as L* C* h color coordinates, indicating the lightness, chroma, and hue angle, respectively. Only one side, close to the apex of the fruit, was measured.
The same fruit was evaluated for glossiness, which refers to the light reflection intensity of the fruit. The fruit was visually inspected and subjectively scored from 1 to 3, where 1 = dull, 2 = moderately glossy, and 3 = glossy (Supplementary Figure S3). The same ten berries were used to evaluate the degree of discoloration based on the number of discolored (whitish/pale) drupelets and scored on a 1 to 5 scale, where 1 = none; 2 = very slight, 1–3 discolored drupelets; 3 = slight, 4–7 discolored drupelets; 4 = moderate, 8–11 discolored drupelets; and 5 = severe, >11 discolored drupelets (Supplementary Figure S4).
The fruit’s firmness was also assessed subjectively using the same raspberries that were used to evaluate glossiness and discoloration. Each raspberry was pressed slightly with the thumb and middle fingers. Based on the palpability, the berries were scored from 1 to 5, where 1 = very firm, rebounds from compression, high resistance; 2 = firm, partial rebound; 3 = soft, partial rebound; 4 = very soft, partial rebound; and 5 = no resistance.
A second clamshell of raspberries from each treatment and replication was frozen with liquid N2 and immediately broken into drupelets with a mortar and pestle. The drupelets were mixed among the fruit from each clamshell and stored in a −80 °C freezer until analysis. These frozen raspberries were used to measure the total anthocyanin content (TAC). The TAC was measured using a microvolume UV-Vis spectrophotometer (Nanodrop, Thermo Fisher Scientific, Waltham, MA, USA) by adapting a method from Abdel-Aal and Hucl [9]. Liquid N2 was added to the frozen raspberry drupelets and then immediately ground with a blender (Osterizer 12 speed blender, Mexico) for 1 min and turned into a fine powder. An aliquot (400 mg) of raspberry powder was added to 10 mL of acidified ethanol solution (96% ethanol and 1 N HCL 85:15 v/v) and vortexed for 1 min. The solution was incubated for 30 min at 50 °C and then filtered through a 0.45 micron polytetrafluorethylene filter (Agilent Technologies, Santa Clara, CA, USA). The supernatant was collected and held in a −20 °C freezer until it was evaluated using spectrophotometry. The absorbance (A) was measured at 530 and 700 nm on cyanidin 3-glucoside equivalents. The acidified ethanol solution was used as a blank. The total anthocyanin content per sample (mg·kg−1) was calculated as the cyanidin 3-glucoside equivalent, the most dominant anthocyanin in raspberry:
C = (A/ε) × (vol/1000) × MW × (1/sample wt.) × 106
where C is the concentration of total anthocyanin (mg·kg−1), A is the difference (530–700 nm) between the absorbance readings, ε is the molar absorptivity (cyanidin 3-glucoside = 25,965 cm−1 M−1), vol is the total volume of anthocyanin extract, and MW is the molecular weight of cyanidin 3-glucoside = 449 [9].
The data were statistically analyzed using R statistical program [10]. In addition to base statistical analysis, ggplot2 and dplyr packages were used. A total of 4 atmospheres (treatments) and 3 replications across the 4 evaluation dates were analyzed for the quality characteristics of raspberry fruit. The data were assessed through ANOVA followed by the Honestly Significant Difference (HSD) Tukey test to reveal significant differences (p < 0.05) among treatments and evaluation days.

3. Results

3.1. Firmness

Holding raspberry fruit after harvest in high CO2 atmospheres reduced softening in a concentration-dependent manner (Figure 1; Table 1). Raspberry firmness showed a similar trend for both years of the experiment (Figure 1).
Raspberries stored in 15 kPa CO2 atmospheres were significantly higher in firmness than raspberries stored in lower CO2 atmospheres and in air in both years and had the highest firmness among all the atmospheres throughout storage in both years, followed by raspberries stored in 8 kPa and 5 kPa CO2. Air (0.03 kPa CO2)-stored raspberries lost firmness most quickly during storage and had the lowest firmness among all treatments on each evaluation day (Figure 1).

3.2. Decay

The storage of raspberry fruit under high CO2 atmospheres reduced decay development (Figure 2; Table 1). However, decay increased over time during storage in all atmospheres, and there was more decay in 2021 than 2020. In 2021, decay control was similar in the fruit stored in 15 kPa and 8 kPa CO2 (Figure 2; Table 1), while fruit stored in 5 kPa CO2 was intermediate between the fruit stored in 0.03 kPa and 8 kPa or 15 kPa CO2 (Table 1). In both years, the raspberries stored in 0.03 kPa CO2 had significantly higher decay incidence compared with other CO2-stored raspberries. Air-stored fruit also had the highest decay severity along with raspberries stored in 5 kPa CO2 in 2021 (Table 1).

3.3. Weight Loss

Overall, weight loss was low (<1.5%) during raspberry storage in both years; however, all the stored raspberries lost weight over time (Figure 3). After 5 days, weight loss slowed in the raspberries held in 15 kPa CO2. Weight loss was lower in the raspberries stored in 8 kPa and 15 kPa CO2 compared with the raspberries stored in 0.03 kPa CO2 (Figure 3).

3.4. Discoloration

There was an increase in raspberry discoloration during storage, particularly after 5 days of storage; however, storage in elevated CO2 atmospheres slowed and reduced the increase in discoloration, especially in 8 and 15 kPa CO2 (Figure 4). All raspberries showed an increase in discoloration between 10 and 13 days except for the raspberries stored in 15 kPa CO2 (Figure 4). The raspberries stored in 0.03 kPa and 5 kPa CO2 had the highest discoloration scores.

3.5. Glossiness

The raspberries stored in 15 kPa CO2 maintained similar glossiness scores to the values at harvest across all evaluation dates, while the glossiness score of the other raspberries decreased during storage (Figure 5). The glossiness score of the raspberries stored in 15 kPa CO2 was highest, while the glossiness scores of the raspberries stored in 8 kPa or 5 kPa CO2 were similar and lower than those in 15 kPa CO2 (Table 1). The raspberries stored in air (0.03 kPa CO2) had the lowest glossiness scores throughout storage, and the raspberries stored in air (0.03 kPa) or 5 kPa CO2 exhibited an immediate decrease in glossiness (Figure 5).

3.6. Leakiness

There was a steady increase in the percentage of raspberry fruit showing leakiness throughout the storage period for all atmospheres (Figure 6). The increase was significantly slower for the raspberries stored in 15 kPa CO2 and was higher for the raspberries stored in air and 5 kPa CO2; the raspberries stored in 8 kPa CO2 were intermediate between the two. Leakiness severity scores were also reduced by storage in CO2; the fruit in the 15 kPa CO2 atmosphere had the lowest leakiness scores, and the fruit stored in 0.03 kPa CO2 had the highest scores.

3.7. Color

The raspberry’s color tone (hue angle) decreased (indicating darker red color) rapidly and then stabilized during storage (Figure 7). The hue angle values were concentration dependent, showing higher hue angle values with higher CO2 concentrations (Figure 7). In 2021, the L* value and chroma decreased with time in storage, and while there was no impact of CO2 concentration on the L* value, the chroma was maintained at higher levels in raspberry stored in 15 kPa CO2 (Table 1).

3.8. Anthocyanins

The total anthocyanin content increased during air storage, particularly up to 10 d (Figure 8); however, the raspberries stored in elevated CO2 atmospheres experienced a slower rate of increase compared with air-stored raspberries. The higher the CO2 concentration, the stronger the reduction in anthocyanin accumulation (Figure 8).

3.9. Soluble Solids and Titratable Acidity

Raspberry’s SS showed a declining trend over the storage period, regardless of the CO2 concentration. Raspberry’s TA did not change during storage, but the raspberries stored in 5 kPa had a significantly higher TA than the raspberries stored in air (0.03 kPa).

3.10. Respiration and Ethylene

The respiration rate and ethylene production of stored raspberries increased over time (Table 1). However, high CO2 atmospheres reduced both the respiration rate and ethylene production. The raspberries held in 15 kPa CO2 had the lowest respiration rates, which were similar to those of the raspberries stored in 8 kPa CO2 but significantly different from those of the raspberries stored in 5 or 0.03 kPa CO2 (Table 1). The ethylene production rate of the raspberries stored in 15 kPa CO2 was the lowest, while the raspberries stored in 5 and 8 kPa CO2 were intermediate, and air-stored raspberries had the highest ethylene production (Table 1).

4. Discussion

Firmness is an important indicator of quality in raspberry fruit, as well as many other fruits. The decrease in raspberry firmness after harvest was inhibited or slowed by storage under increasing CO2 concentrations, and the fruit had significantly higher firmness than air-stored raspberries. In accordance with our findings, Alamar et al. [11] reported that strawberries held in high CO2 atmosphere (15 kPa CO2 and 5 KPa O2) at 5 °C for 14 days were significantly firmer than air-stored fruit. The effect of CO2 in delaying further ripening, as evidenced by other quality parameters such as color, may be one reason why firmness was maintained.
In addition to delayed ripening, CO2 has other effects on fruit physiology: reduced respiration and altered metabolism of ethylene and other volatile compounds [12]. CO2 influences ethylene biosynthesis by regulating 1-aminocyclopropane-1-carboxylic acid (ACC) synthesis and oxidization. ACC synthase is inhibited by high (5–20 kPa) CO2. ACC oxidase activity is stimulated by low levels (<5 kPa) of CO2 and inhibited by higher CO2 [13]. The association of high CO2 atmospheres with and maintenance of raspberry fruit firmness was further supported by Gonzalez et al. [14], who found that raspberries stored in a continuous flow of CO2 (15 or 10 kPa CO2) for 14 days had higher firmness than berries exposed to CO2 for 3 days or an intermittent CO2 treatment. In strawberries, elevated CO2 has also been shown to enhance firmness [15]. Strawberry fruit exposed to high CO2 atmospheres exhibited changes in apoplastic pH levels and, in turn, may have increased cell-to-cell adhesion via the precipitation of soluble pectin [16]. The solubilization of CO2 produces H+ and HCO3, which could influence the pH [17]. The increase in firmness following exposure to high CO2 atmospheres, as related to pectin polymerization, is mediated by calcium. In strawberries, the modification of pectic polymers decreased the amount of water-soluble pectin (WSP) and increased the chelator-soluble pectin (CSP), which is a major factor in the firmness increase [18]. However, in our study, we did not find any increases in raspberry firmness as a result of exposure to up to 15% CO2 for 14 days, although the rate of softening was reduced. However, Forney et al. [7] found that CA (12.5 KPa CO2 with 7.5 KPa O2) did not maintain raspberry firmness during 2–3 days of storage at 1 °C and resulted in the fruit softening compared with air-stored raspberry.
In our study, we observed an increase in leakiness and a decrease in glossiness during storage. Leakiness is initiated in a raspberry via the physiological breakdown (PB) of the cells, a typical symptom of plant tissue senescence [19]. Physiological breakdown is evidenced as juice leakage and softening and contributes to the fast deterioration of the raspberry fruit’s quality [20]. We observed a significant increase in leakiness over time after harvest; however, the rate of increase was slower, with less leaky raspberries, when the fruit was stored in 15 KPa CO2. The effect of high CO2 in slowing further ripening and over-ripening likely contributed to the slower rate of leakiness development. When evaluating different raspberry cultivars, Harshman et al. [21] did not detect a clear association between fruit firmness and PB resistance, indicating that initial fruit firmness is not related to PB incidence. Forney et al. [7] reported that storage in 12.5 KPa CO2 and 7.5 KPa O2 was less effective in delaying PB than delaying decay. Perhaps their fruit had already begun senescence prior to CA exposure.
Visible decay on the fruit surface significantly reduces raspberry fruit’s quality and marketability. In our study, decay incidence was reduced by storage under high CO2 concentrations, with the maximum effect achieved at 8 kPa CO2. In agreement with our study, Haffner et al. [3] found significant inhibition of raspberry decay by using high CO2 atmospheres (10–30 kPa CO2 in combination with 10 kPa O2) as compared with air-stored fruit. High CO2 concentrations create a fungistatic effect that slows the activity of fungi as well as the metabolic activity of the fruit. The fungistatic effect of high CO2 is due to its solubility in the aqueous phase of produce and fungi. CO2 in the intercellular environment lowers the pH, which inhibits enzyme-catalyzed processes and enzyme production, interacts with cell membranes, and affects the physicochemical characteristics of proteins [22]. The altered expression of proteins in both fungi and fruit tissues can therefore alter decay development [23]. In addition, maintaining cellular integrity as a result of the firming effect of CO2 may have also inhibited fungal activity. Petrasch et al. [24] also reported that mycelium developed faster on softer strawberry fruit than firmer fruit. Modified atmospheres reduce the respiration rates and delay the ripening of fruit [12], which is also in agreement with our findings. In addition, higher firmness can reduce fruit damage and stronger cell walls resist cell wall-degrading enzymes produced by pathogens, hindering a microbe’s capacity to infect the fruit.
Anthocyanins play a vital role in raspberry’s color expression. Maintaining a bright red color is an important postharvest quality attribute for raspberries, as a dark red color is associated with over-ripe fruit [25]. The visual appeal of raspberry fruit decreases with time after harvest, along with increased levels of certain anthocyanins [26]. High hue angle values indicate more orange-red color, and low values indicate more blue-red color. Our results showed that raspberry fruit stored in 15 kPa CO2 maintained a stable hue angle after 5 d, but the hue angle declined over time in the raspberries stored in air or lower CO2 concentrations. Strawberries held in 15 kPa CO2 and 5 kPa O2 had decreased ethylene biosynthesis and a lighter, brighter hue [11]. This finding is also aligned with our finding of a significantly lower ethylene production rate in the raspberries stored in high CO2 compared with air storage.
CO2 in the intercellular environment lowers the cellular pH [22]. The hydration of CO2 and production of HCO3 and H+ may reduce the intracellular pH [17], and the pH plays a crucial role in raspberry’s fruit color. In the strawberry, reducing the pH from 3.81 to 3.21 resulted in a 37 to 13 percent shift in flavylium formation and also increased the stability of the fruit’s color more than any other factors [27]. The red flavylium cation (AH+) remains stable only in acidic conditions [28].
In our study, the total anthocyanins increased over time, except in the raspberries stored in 15 kPa CO2; storing raspberries in 15 kPa CO2 maintained the anthocyanin content (as well as hue angle) close to the levels at harvest. In agreement with our findings, Gil et al. [29] found that high CO2 concentrations inhibited the increase in anthocyanin content after harvest by affecting its biosynthesis, degradation, or both. These results indicate the ability of high CO2 atmospheres to maintain raspberry fruit’s color tone, even after 2 weeks of storage. Palonen et al. [30] found a significant correlation between anthocyanin concentration and color values, as the darkest raspberries had a higher anthocyanin content. In our study, we also found a higher anthocyanin content and lower hue angle in the raspberries stored in air or low CO2 atmospheres. Moore [31] showed that raspberry’s anthocyanin content could be predicted by the hue angle or a*/b*.
We observed an increase in raspberry discoloration after harvest, which has not been reported previously to our knowledge. Discoloration occurred when the raspberry drupelets changed color from red to light pink. In blackberries, a similar phenomenon, red drupelet reversion (RDR), occurs, which is a type of physiological disorder [32]. Edgley et al. [33] reported that RDR was associated with a decrease in the anthocyanin content and was primarily caused by mechanical damage during harvest, which causes membrane integrity loss and a decrease in cellular structural integrity. There may also be some change in the pH from membrane leakiness, leading to color changes in the anthocyanins. Slight changes in the pH have a significant impact on anthocyanins, as the acidity of the solution impacts the ratio between different forms (colors) of the pigments [34]. In our study, discoloration increased with time in storage but was inhibited by high CO2; the anthocyanin content was also maintained close to harvest levels with high CO2. Also, high CO2 atmospheres maintained fruit firmness and the integrity of the cell wall and reduced senescence. These results suggest that discoloration in raspberries is related to the loss of membrane integrity and/or a decrease in cellular structural integrity, and the incidence is reduced by storage in high CO2 atmospheres.

Supplementary Materials

The following supporting information can be downloaded at: https://www.mdpi.com/article/10.3390/horticulturae10101092/s1, Figure S1: Pattern of leakiness created by placing a single fruit within a 12.21 cm2 block on a sheet of white paper and applying slight pressure with a second sheet of paper above. Leakiness scale (2021): 1 = none, 2 = very slight, 3 = slight; 4 = moderate and 5 = severe; Figure S2: Decay severity scale: 1 = none; 2 = very slight, 1–3 decayed drupelets; 3 = slight, 4–8 decayed drupelets; 4 = moderate, 9–13 decayed drupelets; and 5 = severe, >13 decayed drupelets; Figure S3: Glossiness scale: 3 = glossy, 2 = moderately glossy, and 1 = dull; Figure S4: Discoloration scale: 1 = None, 2 = Very slight; 1–3 discolored drupelets, 3 = Slight; 4–8 discolored, 4 = Moderate; 9–13 discolored drupelets and 5 = Severe; >13 discolored drupelets; Figure S5: Raspberries were exposed to 0.03 kPa (0.03 kPa CO2, 21 kPa O2); 5 kPa (5 kPa CO2, 16 kPa O2); 8 kPa (8 kPa CO2, 13 kPa CO2) or 15 kPa (15 kPa CO2, 6 kPa O2) atmospheres at 5 °C. The atmospheres were humidified by bubbling through in a continuous flow-through system.

Author Contributions

Conceptualization and methodology: M.R.I. and E.M.; investigation: M.R.I.; formal analysis: M.R.I.; data curation: M.R.I.; writing—original draft preparation: M.R.I.; writing—reviewing and editing: M.R.I. and E.M. All authors have read and agreed to the published version of the manuscript.

Funding

This research received no external funding.

Data Availability Statement

Data is contained within the article or supplementary material.

Conflicts of Interest

The authors declare no conflicts of interest.

References

  1. USDA National Agricultural Statistics Service. Noncitrus Fruits and Nuts 2015 Summary; USDA National Agricultural Statistics Service: Washington, DC, USA, 2021.
  2. Adobati, A.; Uboldi, E.; Franzetti, L.; Limbo, S. Shelf life extension of raspberry: Passive and active modified atmosphere inside master bag solutions. Chem. Eng. Trans. 2015, 44, 337–342. [Google Scholar] [CrossRef]
  3. Haffner, K.; Rosenfeld, H.J.; Skrede, G.; Wang, L. Quality of red raspberry “Rubus idaeus L.” cultivars after storage in controlled and normal atmospheres. Postharvest Biol. Technol. 2002, 24, 279–289. [Google Scholar] [CrossRef]
  4. Sommer, N.F.; Fortlage, R.J.; Mitchell, F.G.; Maxie, E.C. Reduction of postharvest losses of strawberry fruits from gray mold. J. Am. Soc. Hortic. Sci. 1973, 98, 285–288. [Google Scholar] [CrossRef]
  5. Maude, R.B. Disease Control. In The Biology of Botrytis; Coley-Smith, J.R., Verhoeff, K., Jarvis, W.R., Eds.; Academic Press: London, UK, 1980; pp. 275–308. [Google Scholar]
  6. Goulart, B.L.; Hammer, P.E.; Evensen, K.B.; Janisiewicz, W.; Takeda, F. Pyrrolnitrin, captan + benomyl, and high CO2 enhance raspberry shelf life at 0 or 18C. J. Am. Soc. Hortic. Sci. 2019, 117, 265–270. [Google Scholar] [CrossRef]
  7. Forney, C.F.; Jamieson, A.R.; Munro Pennell, K.D.; Jordan, M.A.; Fillmore, S.A.E. Relationships between fruit composition and storage life in air or controlled atmosphere of red raspberry. Postharvest Biol. Technol. 2015, 110, 121–130. [Google Scholar] [CrossRef]
  8. Carmelo, L.G.P.; Becaro, A.A.; Ferreira, M.D.; Calbo, A.G. Portable flow board for storage of fruits and vegetables in mini-chambers with controlled atmosphere. Eng. Agríc. 2015, 35, 1105–1116. [Google Scholar] [CrossRef]
  9. Abdel-Aal, E.S.M.; Hucl, P. A rapid method for quantifying total anthocyanins in blue aleurone and purple pericarp wheats. Cereal Chem. 1999, 76, 350–354. [Google Scholar] [CrossRef]
  10. Core Team. R: A Language and Environment for Statistical Computing; R Foundation for Statistical Computing: Vienna, Austria, 2013; Available online: http://www.R-project.org/ (accessed on 30 October 2020).
  11. Alamar, M.C.; Collings, E.; Cools, K.; Terry, L.A. Impact of controlled atmosphere scheduling on strawberry and imported avocado fruit. Postharvest Biol. Technol. 2017, 134, 76–86. [Google Scholar] [CrossRef]
  12. Watkins, C.B.; Zhang, J. Metabolic responses of fruit to carbon dioxide. Acta Hortic. 1998, 464, 345–350. [Google Scholar] [CrossRef]
  13. Mathooko, F.M. Regulation of ethylene biosynthesis in higher plants by carbon dioxide. Postharvest Biol. Technol. 1996, 7, 1–26. [Google Scholar] [CrossRef]
  14. González-Orozco, B.D.; Mercado-Silva, E.M.; Castaño-Tostado, E.; Vázquez-Barrios, M.E.; Rivera-Pastrana, D.M. Effect of short-term controlled atmospheres on the postharvest quality and sensory shelf life of red raspberry (Rubus idaeus L.). CyTA-J. Food 2020, 18, 352–358. [Google Scholar] [CrossRef]
  15. Smith, R.B. Controlled atmosphere storage of ‘redcoat’ strawberry fruit. J. Am. Soc. Hortic. Sci 1992, 117, 260–264. [Google Scholar] [CrossRef]
  16. Harker, F.R.; Elgar, H.J.; Watkins, C.B.; Jackson, P.J.; Hallett, I.C. Physical and mechanical changes in strawberry fruit after high carbon dioxide treatments. Postharvest Biol.Technol. 2000, 19, 139–146. [Google Scholar] [CrossRef]
  17. Bown, A.W. CO2 and intracellular pH. Plant Cell Environ. 1985, 8, 459–465. [Google Scholar] [CrossRef]
  18. Hwang, Y.S.; Min, J.H.; Kim, D.Y.; Kim, J.G.; Huber, D.J. Potential mechanisms associated with strawberry fruit firmness increases mediated by elevated pCO2. Hortic. Environ. Biotechnol. 2012, 53, 41–48. [Google Scholar] [CrossRef]
  19. Bhattacharjee, S. Reactive oxygen species and oxidative burst: Roles in stress, senescence and signal transduction in plants. Curr. Sci. 2005, 89, 1113–1121. [Google Scholar]
  20. Perkins-Veazie, P. Postharvest handling and storage of blackberries and raspberries. Small Fruit News 2010, 10, 5–7. [Google Scholar]
  21. Harshman, J.M.; Jurick, W.M.; Lewers, K.S.; Wang, S.Y.; Walsh, C.S. Resistance to Botrytis cinerea and quality characteristics during storage of raspberry genotypes. HortScience 2014, 49, 311–319. [Google Scholar] [CrossRef]
  22. Farber, J.M. Microbiological aspects of modified-atmosphere packaging technology—A Review. J. Food Prot. 1991, 54, 58–70. [Google Scholar] [CrossRef]
  23. Chan, Z. Proteomic responses of fruits to environmental stresses. Front. Plant Sci. 2013, 3, 311. [Google Scholar] [CrossRef]
  24. Petrasch, S.; Mesquida-Pesci, S.D.; Pincot, D.D.A.; Feldmann, M.J.; López, C.M.; Famula, R.; Hardigan, M.A.; Cole, G.S.; Knapp, S.J.; Blanco-Ulate, B. Genomic prediction of strawberry resistance to postharvest fruit decay caused by the fungal pathogen Botrytis cinerea. G3 Genes Genomes Genet. 2022, 12, jkab378. [Google Scholar] [CrossRef]
  25. Madrid, M.; Beaudry, R. Chapter 16.2—Small fruits: Raspberries, blackberries, blueberries. In Controlled and Modified Atmospheres for Fresh and Fresh-Cut Produce; Gil, M.I., Beaudry, R., Eds.; Academic Press: Cambridge, MA, USA, 2020; pp. 335–346. ISBN 978-0-12-804599-2. [Google Scholar]
  26. Stavang, J.A.; Freitag, S.; Foito, A.; Verrall, S.; Heide, O.M.; Stewart, D.; Sønsteby, A. Raspberry fruit quality changes during ripening and storage as assessed by colour, sensory evaluation and chemical analyses. Sci. Hortic. 2015, 195, 216–225. [Google Scholar] [CrossRef]
  27. Wrolstad, R.E.; Putnam, T.P.; Varseveld, G.W. Color quality of frozen strawberries: Effect of anthocyanin, pH, total acidity and ascorbic acid variability. J. Food Sci. 1970, 35, 448–452. [Google Scholar] [CrossRef]
  28. Brouillard, R. Chemical Structure of Anthocyanins. In Anthocyanins as Food Colors; Markakis, P., Ed.; Academic Press: New York, NY, USA, 1982; pp. 1–40. [Google Scholar]
  29. Gil, M.I.; Holcroft, D.M.; Kader, A.A. Changes in strawberry anthocyanins and other polyphenols in response to carbon dioxide treatments. J. Agric. Food Chem. 1997, 45, 1662–1667. [Google Scholar] [CrossRef]
  30. Palonen, P.; Weber, C. Fruit color stability, anthocyanin content, and shelf life were not correlated with ethylene production rate in five primocane raspberry genotypes. Sci. Hortic. 2019, 247, 9–16. [Google Scholar] [CrossRef]
  31. Moore, P.P. Estimation of anthocyanin concentration from color meter measurements of red raspberry fruit. HortScience 1997, 32, 1–135. [Google Scholar] [CrossRef]
  32. Morris, J.R.; Cawthon, D.L.; Nelson, G.S.; Cooper, P.E. Effects of preharvest calcium sprays and postharvest holding on firmness and quality of machine-harvested blackberries. HortScience 1980, 15, 33–34. [Google Scholar] [CrossRef]
  33. Edgley, M.; Close, D.C.; Measham, P.F. Red drupelet reversion in blackberries: A complex of genetic and environmental factors. Sci. Hortic. 2020, 272, 109555. [Google Scholar] [CrossRef]
  34. Holcroft, D.M.; Kader, A.A. Controlled atmosphere-induced changes in pH and organic acid metabolism may affect color of stored strawberry fruit. Postharvest Biol. Technol. 1999, 17, 19–32. [Google Scholar] [CrossRef]
Figure 1. Changes in raspberry firmness scores following exposure to 0.03 kPa (0.03 kPa CO2 and 21 kPa O2); 5 kPa (5 kPa CO2 and 16 kPa O2); 8 kPa (8 kPa CO2 and 13 kPa CO2); or 15 kPa (15 kPa CO2 and 6 kPa O2) atmospheres at 5 °C for 14 d (2020) or 13 d (2021). Firmness scale: 1 = very firm, 2 = firm, 3 = soft, 4 = very soft, and 5 = no resistance. Data were assessed through ANOVA followed by Honestly Significant Difference (HSD) Tukey test to reveal significant differences (p < 0.05). Different letters indicate significant differences, while the same letters represent no significant differences.
Horticulturae 10 01092 g001
Figure 2. Changes in raspberry fungal decay (%) following exposure to 0.03 kPa (0.03 kPa CO2 and 21 kPa O2); 5 kPa (5 kPa CO2 and 16 kPa O2); 8 kPa (8 kPa CO2 and 13 kPa CO2); or 15 kPa (15 kPa CO2 and 6 kPa O2) atmospheres at 5 °C for 14 d (2020) or 13 d (2021). Data were assessed through ANOVA followed by Honestly Significant Difference (HSD) Tukey test to reveal significant differences (p < 0.05). Different letters indicate significant differences, while the same letters represent no significant differences.
Horticulturae 10 01092 g002
Figure 3. Changes in raspberry weight loss (%) following exposure to 0.03 kPa (0.03 kPa CO2 and 21 kPa O2); 5 kPa (5 kPa CO2 and 16 kPa O2); 8 kPa (8 kPa CO2 and 13 kPa CO2); or 15 kPa (15 kPa CO2 and 6 kPa O2) atmospheres at 5 °C for 14 d (2020) or 13 d (2021). Data were assessed through ANOVA followed by Honestly Significant Difference (HSD) Tukey test to reveal significant differences (p < 0.05). Different letters indicate significant differences, while the same letters represent no significant differences.
Horticulturae 10 01092 g003
Figure 4. Changes in raspberry discoloration scores following exposure to 0.03 kPa (0.03 kPa CO2 and 21 kPa O2); 5 kPa (5 kPa CO2 and 16 kPa O2); 8 kPa (8 kPa CO2 and 13 kPa CO2); or 15 kPa (15 kPa CO2 and 6 kPa O2) atmospheres at 5 °C for 13 d in 2021. Discoloration score scale: 1 = none, 2 = very slight, 3 = slight, 4 = moderate, and 5 = severe. Data were assessed through ANOVA followed by Honestly Significant Difference (HSD) Tukey test to reveal significant differences (p < 0.05). Different letters indicate significant differences, while the same letters represent no significant differences.
Horticulturae 10 01092 g004
Figure 5. Changes in raspberry glossiness scores following exposure to 0.03 kPa (0.03 kPa CO2 and 21 kPa O2); 5 kPa (5 kPa CO2 and 16 kPa O2); 8 kPa (8 kPa CO2 and 13 kPa CO2); or 15 kPa (15 kPa CO2 and 6 kPa O2) atmospheres at 5 °C for 13 d in 2021. Glossiness score scale: 1 = dull, 2 = moderate glossy, and 3 = glossy. Data were assessed through ANOVA followed by Honestly Significant Difference (HSD) Tukey test to reveal significant differences (p < 0.05). Different letters indicate significant differences, while the same letters represent no significant differences.
Horticulturae 10 01092 g005
Figure 6. Changes in raspberry leakiness (%) following exposure to 0.03 kPa (0.03 kPa CO2 and 21 kPa O2); 5 kPa (5 kPa CO2 and 16 kPa O2); 8 kPa (8 kPa CO2 and 13 kPa CO2); or 15 kPa (15 kPa CO2 and 6 kPa O2) atmospheres at 5 °C for 13 d in 2021. Data were assessed through ANOVA followed by Honestly Significant Difference (HSD) Tukey test to reveal significant differences (p < 0.05). Different letters indicate significant differences, while the same letters represent no significant differences.
Horticulturae 10 01092 g006
Figure 7. Changes in raspberry color (hue angle) following exposure to 0.03 kPa (0.03 kPa CO2 and 21 kPa O2); 5 kPa (5 kPa CO2 and 16 kPa O2); 8 kPa (8 kPa CO2 and 13 kPa CO2); or 15 kPa (15 kPa CO2 and 6 kPa O2) atmospheres at 5 °C for 14 d (2020) or 13 d (2021). Data were assessed through ANOVA followed by Honestly Significant Difference (HSD) Tukey test to reveal significant differences (p < 0.05). Different letters indicate significant differences, while the same letters represent no significant differences.
Horticulturae 10 01092 g007
Figure 8. Changes in raspberry total anthocyanin content (mg cyanidin-3-glucoside/kg) following exposure to 0.03 kPa (0.03 kPa CO2 and 21 kPa O2); 5 kPa (5 kPa CO2 and 16 kPa O2); 8 kPa (8 kPa CO2 and 13 kPa CO2); or 15 kPa (15 kPa CO2 and 6 kPa O2) atmospheres at 5 °C for 13 d in 2021. Data were assessed through ANOVA followed by Honestly Significant Difference (HSD) Tukey test to reveal significant differences (p < 0.05). Different letters indicate significant differences, while the same letters represent no significant differences.
Horticulturae 10 01092 g008
Table 1. Some quality attribute means and mean separation by treatment and evaluation day for raspberry fruit stored under different atmospheres in 2021.
Decay Severity
Score
Leakiness
Score
L*
Value
ChromaRespiration
(mL·kg−1·h−1)
Ethylene
(µL·kg−1·h−1)
kPa CO2 (T)
0.032.372 a3.31 a30.39 a31.70 b18.89 a7.79 a
 52.14 ab3.01 ab30.55 a32.14 b18.24 a5.29 b
 81.97 b2.66 bc31.05 a32.96 ab16.81 ab4.43 b
151.89 b2.40 c31.14 a33.73 a13.18 b3.10 c
*****NS*******
Day
 01.33 c1.33 d34.34 a35.38 a16.09 ab1.72 c
 52.09 b2.82 c30.80 b33.10 b14.82 b4.39 b
102.25 b3.44 b29.50 c31.52 c17.38 ab5.28 b
132.77 a3.91 a28.25 d30.24 c19.35 a9.78 a
****************
T × Day****NSNS****
Data were assessed through ANOVA followed by Honestly Significant Difference (HSD) Tukey test to reveal significant differences (p < 0.05). Means followed by different letters are significantly different, whereas the same letters indicate no significant differences among the treatments. Significance level of each attribute by treatment (T) or day: *** = 0.001, ** = 0.01, and * = 0.05 based on their p values. NS = not significant. For leakiness and decay severity score scales: 1 = none, 2 = very slight, 3 = slight, 4 = moderate, and 5 = severe.
Disclaimer/Publisher’s Note: The statements, opinions and data contained in all publications are solely those of the individual author(s) and contributor(s) and not of MDPI and/or the editor(s). MDPI and/or the editor(s) disclaim responsibility for any injury to people or property resulting from any ideas, methods, instructions or products referred to in the content.

