Article

The Influence of Trctf1 Gene Knockout by CRISPR–Cas9 on Cellulase Synthesis by Trichoderma reesei with Various Soluble Inducers

School of Chemistry and Chemical Engineering, Chongqing University of Science and Technology, Chongqing 401331, China
*
Author to whom correspondence should be addressed.
Fermentation 2023, 9(8), 746; https://doi.org/10.3390/fermentation9080746
Submission received: 20 July 2023 / Revised: 6 August 2023 / Accepted: 7 August 2023 / Published: 10 August 2023
(This article belongs to the Special Issue Enzymes in Biorefinery)

Abstract

:
Knockout of the transcriptional repressor Trctf1 is known to enhance the yield of cellulose-induced cellulase synthesis in Trichoderma reesei. However, different inducers possess distinct induction mechanisms, and the effect of Trctf1 on cellulase synthesis with soluble inducers remains unknown. To evaluate the effect of the Trctf1 gene on cellulase synthesis and develop a high-yielding cellulase strain, we established a CRISPR–Cas9 genome editing system in T. reesei Rut C30 using codon-optimized Cas9 protein and in vitro transcribed RNA. This study demonstrated that T. reesei ΔTrctf1 with the Trctf1 gene knocked out showed no statistically significant differences in cellulase, cellobiohydrolase, endoglucanase, and β−glucosidase production when induced with MGD (the mixture of glucose and sophorose). However, when induced with lactose, the activities of these enzymes increased by 20.2%, 12.4%, and 12.9%, respectively, with no statistically significant differences in β−glucosidase activity. The hydrolysis efficiency on corn stover of cellulases produced by T. reesei ΔTrctf1 under different inducers was not significantly different from that of wild-type cellulases, indicating that Trctf1 gene deletion has little effect on the cellulase cocktail. These findings contribute to a better understanding of the molecular mechanisms underlying the regulation of T. reesei cellulase synthesis by different soluble inducers, as well as the construction of high-yield cellulase gene−engineered strains.

1. Introduction

Due to the excessive exploitation and utilization of fossil fuels, such as petroleum, coal, and natural gas, greenhouse gas emissions have continued to increase on a global scale, consequently posing a serious threat to economic and social sustainability. According to research, cellulose ethanol has the potential to reduce emissions by 151% relative to gasoline, and each ton of ethanol produced can reduce CO2-eq emissions by 3.47 metric tons [1,2]. However, the heterogeneous and complex components of lignocellulosic biomass demand an efficient cellulase for complete degradation [3,4]. The high cost of cellulase production has therefore become a major obstacle to the development of biorefining technologies for lignocellulosic biomass.
T. reesei is one of the most important industrial cellulase-producing strains and can secrete the entire necessary cellulase cocktail for complete cellulose degradation into glucose, including cellobiohydrolase, endoglucanase, β−glucosidase, and cellulose degradation auxiliary proteins. However, their biosynthesis requires induction [5,6]. Different inducers can lead to variations in the cellulase cocktail, affecting the efficiency of lignocellulose degradation [7,8]. Although cellulose is a natural inducer, it is insoluble in water and needs the low-level cellulase of the strain to slowly hydrolyze it under nonoptimal reaction conditions and nonhomogeneous catalysis before the real inducer, mainly composed of β−disaccharide, is released to induce cellulase synthesis [9,10]. This delay significantly prolongs fermentation time and reduces productivity. Additionally, T. reesei cellulase fermentation produces high-viscosity and non-Newtonian fluids, causing extremely high energy costs for ventilation and mixing [11]. Furthermore, pure cellulose, particularly the most efficient inducer microcrystalline cellulose, is expensive [12]. Hence, low-cost and efficient soluble inducers are an effective strategy to solve these problems.
Currently, lactose is the most commonly used soluble inducer, but it remains relatively expensive, particularly in China [13]. This expense limits the productivity of cellulase, as lactose is not a true inducer and needs to be hydrolyzed and converted into sophorose by β−galactosidase or β−glucosidase before inducing cellulase production [14]. Sophorose, which has induction abilities over 200 times that of lactose, has been demonstrated to be the most efficient inducer for T. reesei to synthesize cellulase [15,16]. Despite its efficiency, sophorose is too costly to be deployable in the industrial production of cellulase. MGD (The mixture of glucose and sophorose) was prepared using commercial β−glucosidase via enzymatic catalysis acting as an inducer, with a cellulase yield and productivity of 90.3 FPU/mL (Filter Paper Unit) and 627.1 FPU/L/h, respectively [17]. By proteomic analysis, it was demonstrated that the secretion level of the major cellulases induced by MGD was higher than that induced by cellulose-based solid inducers [18], and overexpression of the Trcip1 gene in T. reesei using MGD as the inducer resulted in highly efficient breakdown of corn stover to glucose by cellulases [19]. Furthermore, the kinetic parameters for the enzymatic synthesis of sophorose using β−glucosidase were determined, confirming that sophorose production in T. reesei cells was derived from the transglycosidation of β−glucosidase and that the substrate used for this reaction was primarily cellobiose rather than glucose [20]. Using self-produced β−glucosidase to catalyze the production of this inducer resulted in cellulase activity of 95.23 FPU/mL in T. reesei [21], reducing the cost of the inducer. Meanwhile, using MGD as an inducer to stimulate high-density fermentation of genetically engineered T. reesei, cellulase activity reached 102.63 FPU/mL [22]. Although this inducer has shown promising prospects in its application, many intricate details of the transcriptional regulation mechanism of cellulase synthesis induced by T. reesei remain unclear.
It has been reported that transcription factors, including xyr1 [23], ace2 [24], vib1 [25], and ace3 [22], can activate cellulase gene transcription, whereas ace1 [26], cre1 [27], rce2 [28], ctf1 [29], and rce1 [30] can inhibit it. Nonetheless, the transcription factors responsible for the high inducibility of cellulase secretion by MGD in T. reesei remain unclear. Transcriptome data from GSE66982, GSE53629, and PRJNA714230 (SRA-NCBI) indicated that the expression of the Trctf1 gene (jgi|Trire2: 103230 or jgi|TrireRUTC30:10530) was significantly lower under sophorose induction than under cellulose or lactose induction [31,32,33]. Thus, it is speculated that MGD induces cellulase synthesis mainly by downregulating Trctf1. Some studies have shown that CTF1 regulates cellulase gene transcription by inhibiting the expression of the transcriptional activators ACE3 and VIB1 while activating the transcriptional repressor RCE1. Knocking out Trctf1 in T. reesei increased cellulase production by 36.9% under cellulose induction [29]. However, to date, no research has examined the effect of the transcriptional repressor Trctf1 on cellulase synthesis in T. reesei under cultivation with the soluble inducer MGD or lactose.
In this study, we used a strong constitutive promoter, pyruvate decarboxylase 1 (PDC1) to overexpress codon-optimized Cas9 in T. reesei Rut C30. Then, the gRNA generated from in vitro transcription was transformed into protoplasts to create a Trura5 gene knockout strain, thus establishing a CRISPR–Cas9 genome editing system in T. reesei Rut C30. Next, the Poura5 gene expression cassette from Penicillium oxalate was inserted into the Trctf1 gene to knock out this gene, aiming to validate the impact of Trctf1 gene deletion on cellulase production induced by either MGD or lactose. Finally, we utilized cellulases produced by different inducers to hydrolyze alkaline-pretreated corn stover, thereby examining the effect of Trctf1 gene knockout on the cellulase cocktail. The results provide insights into the molecular mechanisms underlying cellulase synthesis by T. reesei under different inducer conditions.

2. Materials and Methods

2.1. Materials and Strains

Trichoderma reesei Rut C30 (NRRL 11460) was graciously provided by the USDA ARS Culture Collection. Spores were stored in 50% glycerol at −80 °C. Escherichia coli DH5α and Agrobacterium tumefaciens AGL1 competent cells were obtained from Shanghai Weidi Biotechnology Co., Ltd. (Shanghai, China), whereas the pPTPDC1 expression vector containing the T. reesei pyruvate decarboxylase 1 (PDC1) gene promoter and terminator was maintained in our laboratory [18,19]. The plasmid pTrgRNA, which comprises a tracrRNA sequence, was synthesized by Tsingke Biotechnology Co., Ltd. (Beijing, China).
MGD (the mixture of glucose and sophorose) are produced from high glucose concentrations through the transglycosylation activity of β−glucosidase. To create MGD, 600 g/L glucose substrate was treated with 20 IU/g (glucose) (international unit) commercial β−glucosidase at 65 °C and pH 4.8 for 72 h. The solution was subsequently inactivated by boiling for 5 min. The final composition of MGD was 439.64 g/L glucose, 11.34 g/L lichenose, 7.66 g/L cellobiose, and 58.72 g/L gentiobiose [20,34].

2.2. Cellulase Production by Shake Culture

T. reesei Rut C30 or T. reesei ΔTrctf1 were induced to produce cellulase using the soluble inducers MGD or lactose in shaking flasks. The cultivated T. reesei were incubated on PDA plates at 28 °C for 7 d. Spores were stored at 4 °C and used within one week. Potato dextrose agar (PDA) consisted of 200 g/L potato water and 20 g/L glucose. The spores were seeded into a medium for 24 h at 28 °C and 150 r/min, transferred to 50 mL of fermentation medium at a ratio of 10% (v/v) and cultured at 28 °C and 150 r/min to produce cellulase. The seed medium comprised 10 g/L corn steep, 4 g/L glucose, while the fermentation medium contained 10 g/L carbon source (MGD or lactose), 1 g/L peptone, 0.3 g/L urea, 1.4 g/L (NH4)2SO4, 2 g/L KH2PO4, 0.3 g/L MgSO4·7H2O, 0.4 g/L CaCl2, 5 mg/L FeSO4·7H2O, 1.7 mg/L MnSO4·H2O, 1.4 mg/L ZnSO4·7H2O, 2 mg/L CoCl2, and 500 mL/L of 0.2 mol/L Na2HPO4-citric acid (pH 5.0) [35].

2.3. Expression of the Codon-Optimized Cas9 Gene in T. reesei Rut C30

Based on the codon preference of T. reesei, we synthesized and amplified the Cas9 gene with Cas9-F/R primers [36,37], which included a 20 bp pPTPDC1 homologous fragment. The expression vector pPTPDC1 was linearized using the restriction endonuclease BsiWI, and the Cas9 gene was then inserted into linearized pPTPDC1 via a seamless cloning method. The ligated product was transformed into E. coli DH5α using the heat shock method, thereby successfully constructing and naming the overexpressed Cas9 gene plasmid pPTPDC1–Cas9. To ensure that the expression cassette had no base mutations, the DNA sequencing was conducted and verified.
The T-DNA, containing the Cas9 gene expression cassette and hygromycin B screening marker in pPTPDC1–Cas9, was integrated into the T. reesei Rut C30 genome through Agrobacterium-mediated genetic transformation. Transformants were initially screened on PDA plates that contained 300 μg/mL hygromycin B. Following that, genomic DNA from the transformants was extracted for PCR verification. Finally, the expression of the Cas9 gene in T. reesei was analyzed using qPCR (Real−time quantitative PCR).

2.4. Gene Deletion Using the CRISPR–Cas9 System

We utilized the online tool CHOPCHOP (http://chopchop.cbu.uib.no/, accessed on 20 May 2023) to design the knockout gene for the CRISPR–Cas target sites of T. reesei ura5 (5′-GGCGAGGGCGGCAACATCGTcgg-3′) [38] and Trctf1 (5′-TGGGCTACATCGCAACCCTGagg-3′). URA5-F/R and CTF1-F/R containing crRNA sequence served as primers, and the complete DNA sequences of gRNAs for knocking out the Trura5 and Trctf1 genes, respectively, were obtained through PCR using plasmid pTrgRNA with tracrRNA sequences as a template. Following this, using the above PCR products as templates, the T7−URA5−F/R and T7CTF1−F/R containing the T7 promoter (5′-TAATACGACTCACTATAGGG-3′) sequences as primers were further amplified by PCR to obtain the in vitro transcript gRNA expression cassettes (Table S1) for knocking out the Trura5 and Trctf1 genes, respectively. These cassettes were used as the transcription template and transcribed into RNA using T7 RNA polymerase (Beyotime Biotechnology, Shanghai, China). Finally, the RNA was purified by an RNA purification kit for transformation into T. reesei.
The gRNA of Trura5 gene knockout was transformed into T. reesei expressing intracellular Cas9 protein through PEG-mediated protoplast transformation. Positive transformants were screened using PDA plates containing 3 mg/mL 5−Fluoroorotic Acid (5−FOA) and 15 mM uridine. The Poura5 gene expression cassette of Penicillium oxalicum [39], which served as a screening marker for uracil-deficient strains, was synthesized by Tsingke Biotechnology Co., Ltd. (Beijing, China). CTF1−URA5H−F/R, which included a 20 bp homologous fragment before and after the start and stop codons of Trctf1, was utilized as a primer to amplify the Poura5 gene expression cassette through PCR. Next, the Poura5 gene expression cassette and gRNA were co-transformed into T. reesei ΔTrura5-1 through PEG-mediated protoplast transformation and screened by uridine-free MM medium, which consisted of 4 g/L Na2HPO4, 1.5 g/L KH2PO4, 1 g/L (NH4)2SO4, 0.2 g/L MgSO4·7H2O, 0.02 g/L CaCl2, 1 g/L NaNO3, 5 mg/L FeSO4·7H2O, 1.7 mg/L MnSO4·H2O, 1.4 mg/L ZnSO4·7H2O, 2 mg/L CoCl2, 20 g/L agar, and 10 g/L glucose.
The protoplast transformation process began by inoculating 1 × 10⁷ T. reesei spores into liquid PDA medium, and then cultivating them at 28 °C and 150 r/min for 15 h. Once spores had germinated and the resulting mycelium reached twice the spore’s size, the germinated spores were digested overnight with 3 mg/mL Lywallzyme (ptsrti, Chongqing, China) and 2 mg/mL Yatalase (Takara, Tokyo, Japan) at 28 °C and 80 r/min to remove the spore cell wall [40]. The protoplasts were observed under a microscope and transferred to a 1.5 mL centrifuge tube, where 100 µL was sub-packed. After the addition of 2.2 µg/µL gRNA, the mixture was placed on ice for 30 min, and 600 µL PEG4000 solution was added. After 30 min at room temperature, the mixture was coated onto the medium, and positive transformants were screened after three days.

2.5. Cellulase Hydrolysis of Alkali-Treated Corn Stover (APCS)

To prepare alkali-treated corn stover (APCS), corn stover was added to a 2% NaOH solution at a solid–liquid ratio of 10% (w/v), and then reacted at 121 °C for 90 min [41]. The resulting product was washed with distilled water until neutral and then dried. The dried APCS was added to 0.2 mol/L HAC−NaAC buffer (pH = 4.8) at a solid–liquid ratio of 5% (w/v), and cellulase produced by T. reesei-induced by either lactose or MGD-was added to the enzymatic hydrolysis reaction system supplemented with 5 FPU/g(Filter Paper Unit) APCS and 20 CBU β−glucosidase (2370.3 IU/mL) (Yinchuan, China).The hydrolysis reaction was carried out at 50 °C and 150 r/min, with samples taken every 12 h intervals until the glucose yield no longer improved, stopping the hydrolysis reaction. Each experiment was repeated three times.

2.6. Analysis Method

qPCR (Real−time quantitative PCR): At 36 h of fermentation, T. reesei mycelia were harvested (prepared in accordance with Section 2.2), and total RNA was extracted using the fungal total RNA isolation kit (Tsingke, Beijing, China). The RNA was reverse transcribed into cDNA using the PrimeScript RT kit (Takara, Tokyo, Japan) for qPCR analysis. Quantitative PCR was carried out using a CFX Connect fluorescence quantitative PCR instrument (Bio−Rad, Richmond, CA, USA). The relative gene expression was determined by qPCR using the instructions with 2 × TSINGKE® Master qPCR Mi (SYBR Green 1 with UDG) (Tsingke, Beijing, China), with the sar1 gene selected as the housekeeping gene. The relative expression of the target gene was calculated using the 2−ΔCt method. The primers used in this experiment are listed in Table S2, and three biological replicates were conducted [42].
SDS−PAGE: A mixture of 5 µL 5 × SDS-PAGE loading buffer (Tsingke, Beijing, China) and 20 µL T. reesei fermentation broth was boiled for 10 min to denature the protein. The denatured sample was then added to a 10% SDS−polyacrylamide separation gel, along with PageRulerTM pre-stained protein marker (10–170 kDa) (Thermo Fisher Scientific, Waltham, MA, USA). The resulting gel was run using Tris-glycine buffer, pre-run at 80 V for 30 min and then at 100 V for 90 min. Clear bands were obtained by staining with Coomassie Brilliant Blue solution for 2 h, followed by decolorization with decolorization solution.
The cellulase, cellobiohydrolase, endoglucanase, and β−glucosidase activities were determined by standard methods [43].
Cellulase activity was assessed by using Whatman No. 1 filter paper as a substrate. The enzyme solution was appropriately diluted and added to a test tube containing 1.0 mL of 0.2 mol/L sodium acetate buffer (pH 4.8) and 1.0 × 6.0 cm filter paper, which was fully immersed in the solution. The reaction was incubated in a water bath at 50 °C for 60 min, followed by the addition of 2 mL of 3,5−dinitrosalicylic acid (DNS) to stop the reaction. After boiling the solution for 10 min, 9 mL of distilled water was mixed in. Finally, the total amount of reducing sugars was calculated by measuring the absorbance at 540 nm.
Cellobiohydrolase activity was determined using 1 g/L p−nitrophenol−D−cellobioside (pNPC) as substrate [44]. A volume of 100 µL diluted enzyme solution was mixed with 50 µL of substrate, the reaction was carried out in a water bath at 50 °C for 30 min, 150 µL of 10% Na2CO3 was added to terminate the reaction, and the absorbance at 415 nm was measured. The amount of enzyme required to release 1 μmol pNP per minute was determined to be 1 IU (international unit) cellobiohydrolase.
Endoglucanase activity was evaluated by using 2% carboxymethyl cellulose (CMC) as a substrate. A total of 500 µL of appropriately diluted enzyme solution and 1 mL of CMC solution were mixed in a test tube and reacted in a 50 °C water bath for 30 min. The reaction was stopped by adding DNS reagent immediately. The resulting mixture was boiled in a boiling water bath for 10 min, followed by the addition of 9 mL of distilled water and thorough mixing. The amount of enzyme required to release 1 μmol reducing sugar per minute was determined and defined as 1 IU of endoglucanase.
The β−glucosidase activity was measured by using 15 mM cellobiose as the substrate. A total of 200 µL of appropriately diluted enzyme solution and 200 µL of cellobiose were added to a 1.5 mL centrifuge tube and incubated in a 50 °C water bath for 30 min. The reaction was stopped by boiling the sample in a water bath for 2 min. The glucose content was quantified using a biosensor analyzer.
Protein concentration was determined for T. reesei Rut C30 and ΔTrctf1−1 using the BCA protein concentration assay kit (Beyotime Biotechnology, Shanghai, China), with lactose and MGD as inducers, respectively. To determine protein concentration, 20 µL of appropriately diluted fermentation broth was mixed with 200 µL of the working solution (BCA Reagent A: BCA Reagent B = 50:1) in a 96−well plate. The plate was then incubated at 60 °C for 30 min, and the absorbance at 595 nm was measured to calculate the protein concentration.
All results are presented as the mean of three independent experimental replicates, and statistical significance was set at p < 0.05. Differences that were determined to be statistically significant are denoted as * for p < 0.05. t−test analysis performed using unpaired Students t−test.

3. Results

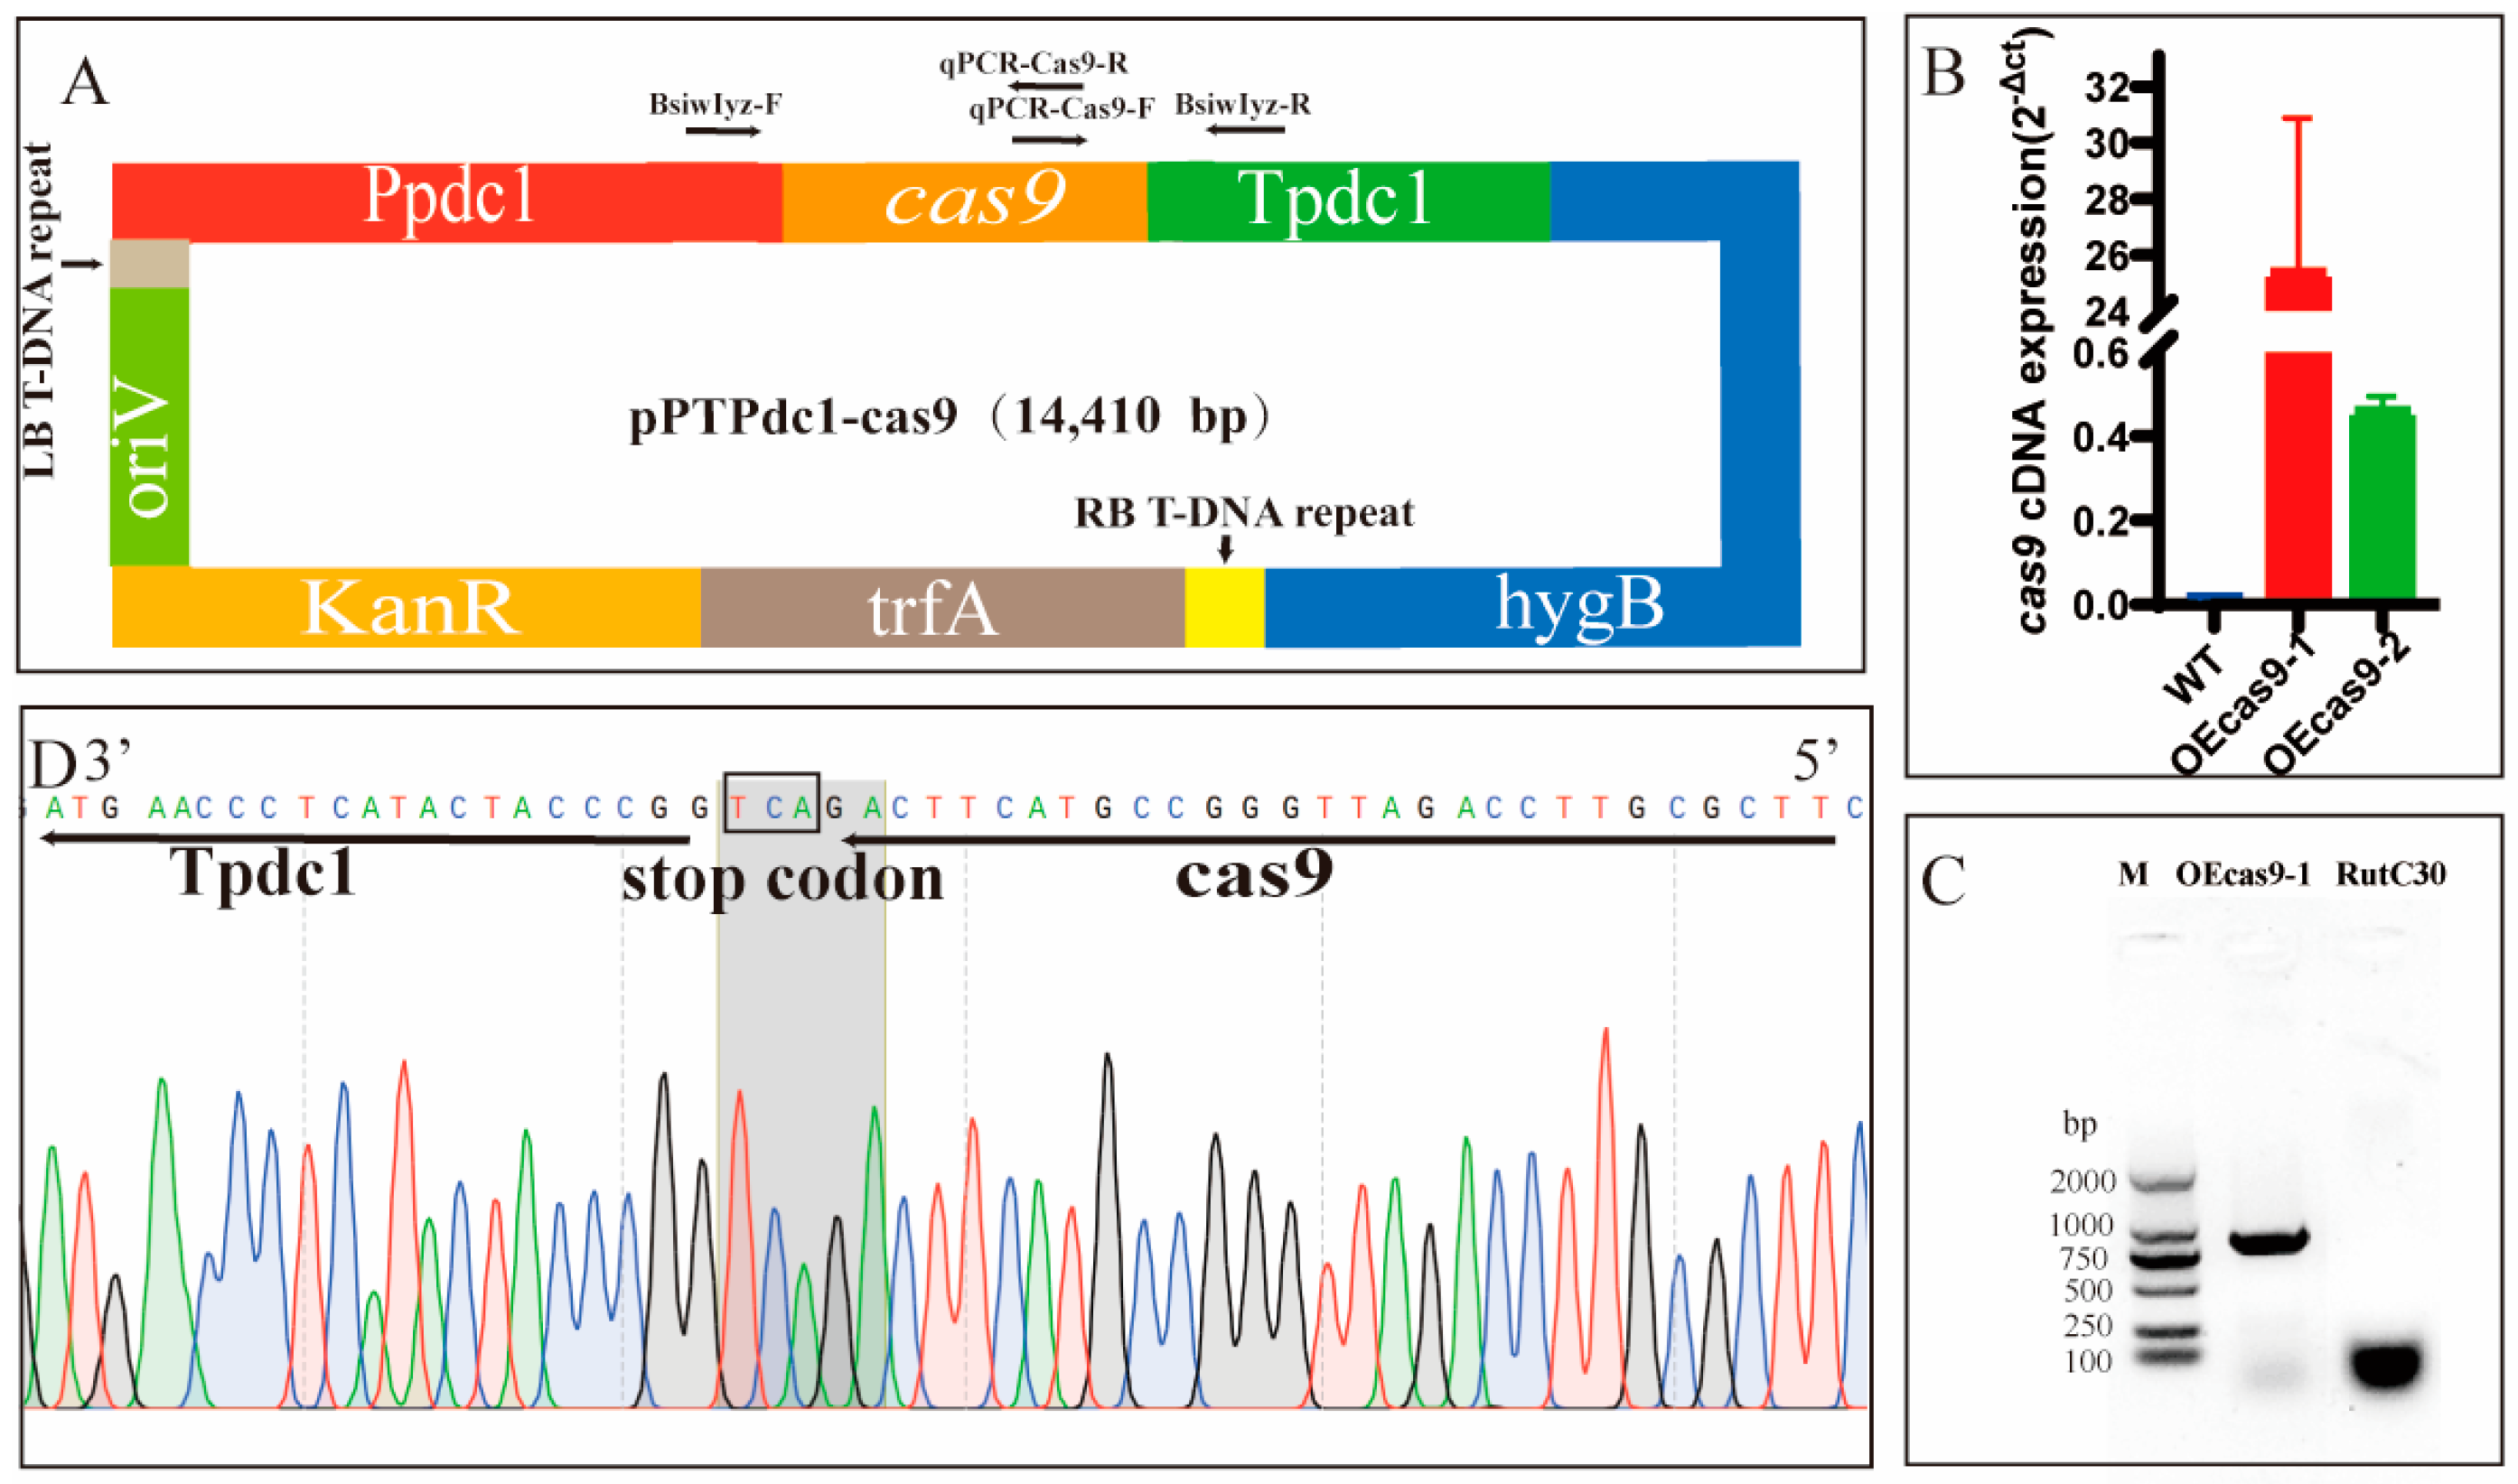
3.1. Development of a CRISPR–Cas9 Genome Editing System for Trichoderma reesei Rut C30

The CRISPR–Cas9 system was established in T. reesei by codon−optimizing the Cas9 gene and transcribing the RNA in vitro. A vector named pPTPDC1−cas9, which expresses the Cas9 gene using the pyruvate decarboxylase 1 promoter (PDC1), was utilized for the integration of T−DNA containing the Cas9 gene and the hygromycin B resistance cassette into the T. reesei genome via Agrobacterium-mediated transformation (Figure 1A). Two transformants, OECas9−1 and OECas9−2, were selected and cultured for 36 h in fermentation medium. Notably, Cas9 gene expression in OECas9−1 was remarkably higher than that in OECas9−2 (Figure 1B), indicating that it is best suited for further experimentation. Verification of T. reesei OECas9−1 genome extraction was conducted via PCR using Bsiw1yz-R/qPCR-F primers specific to the Cas9 expression cassette, which generated a DNA band size of 887 bp relative to T. reesei Rut C30, consistent with the anticipated size (Figure 1C). Subsequent verification of DNA sequencing of the Cas9 expression cassette confirmed the absence of base mutations (Figure 1D).
The Cas9 gene was successfully expressed in T. reesei Rut C30. To obtain the uracil nutrient-deficient phenotype of T. reesei, a gRNA for knockout of the Trura5 gene was obtained through in vitro transcription using T7-RNA polymerase (Target sites: 5′-GGCGAGGGCGGCAACATCGT-3′) (Figure 2A). This gRNA can be introduced into cells using protoplast transformation methods, directing the Cas9 protein to mutate the Trura5 gene. Using PDA medium containing 5-FOA and uridine, four potential positive transformants were screened (Figure 2B) and named T. reesei ΔTrura5−1, ΔTrura5−2, ΔTrura5−3, and ΔTrura5−4. The growth failure of these transformants in MM medium without uridine and the normal growth of T. reesei Rut C30 (Figure 2B) indicated a correct phenotype. To ensure knockout of the Trura5 gene in transformants, DNA sequencing of the Trura5 gene was performed. The Trura5 gene in T. reesei ΔTrura5−1 showed a deletion of 111 bp located close to the PAM sequence, whereas a single base mutation, an off-target effect, was present in the Trura5 genes of T. reesei ΔTrura5−2, ΔTrura5−3, and ΔTrura5−4 with the mutation site located 124 bp upstream of the PAM sequence (Figure 2C,D). In summary, the CRISPR–Cas9 genome editing system was successfully established in T. reesei Rut C30, yielding uracil-auxotrophic T. reesei. The transformant T. reesei ΔTrura5−1, exhibiting no off-target effects, was selected for further experimentation.

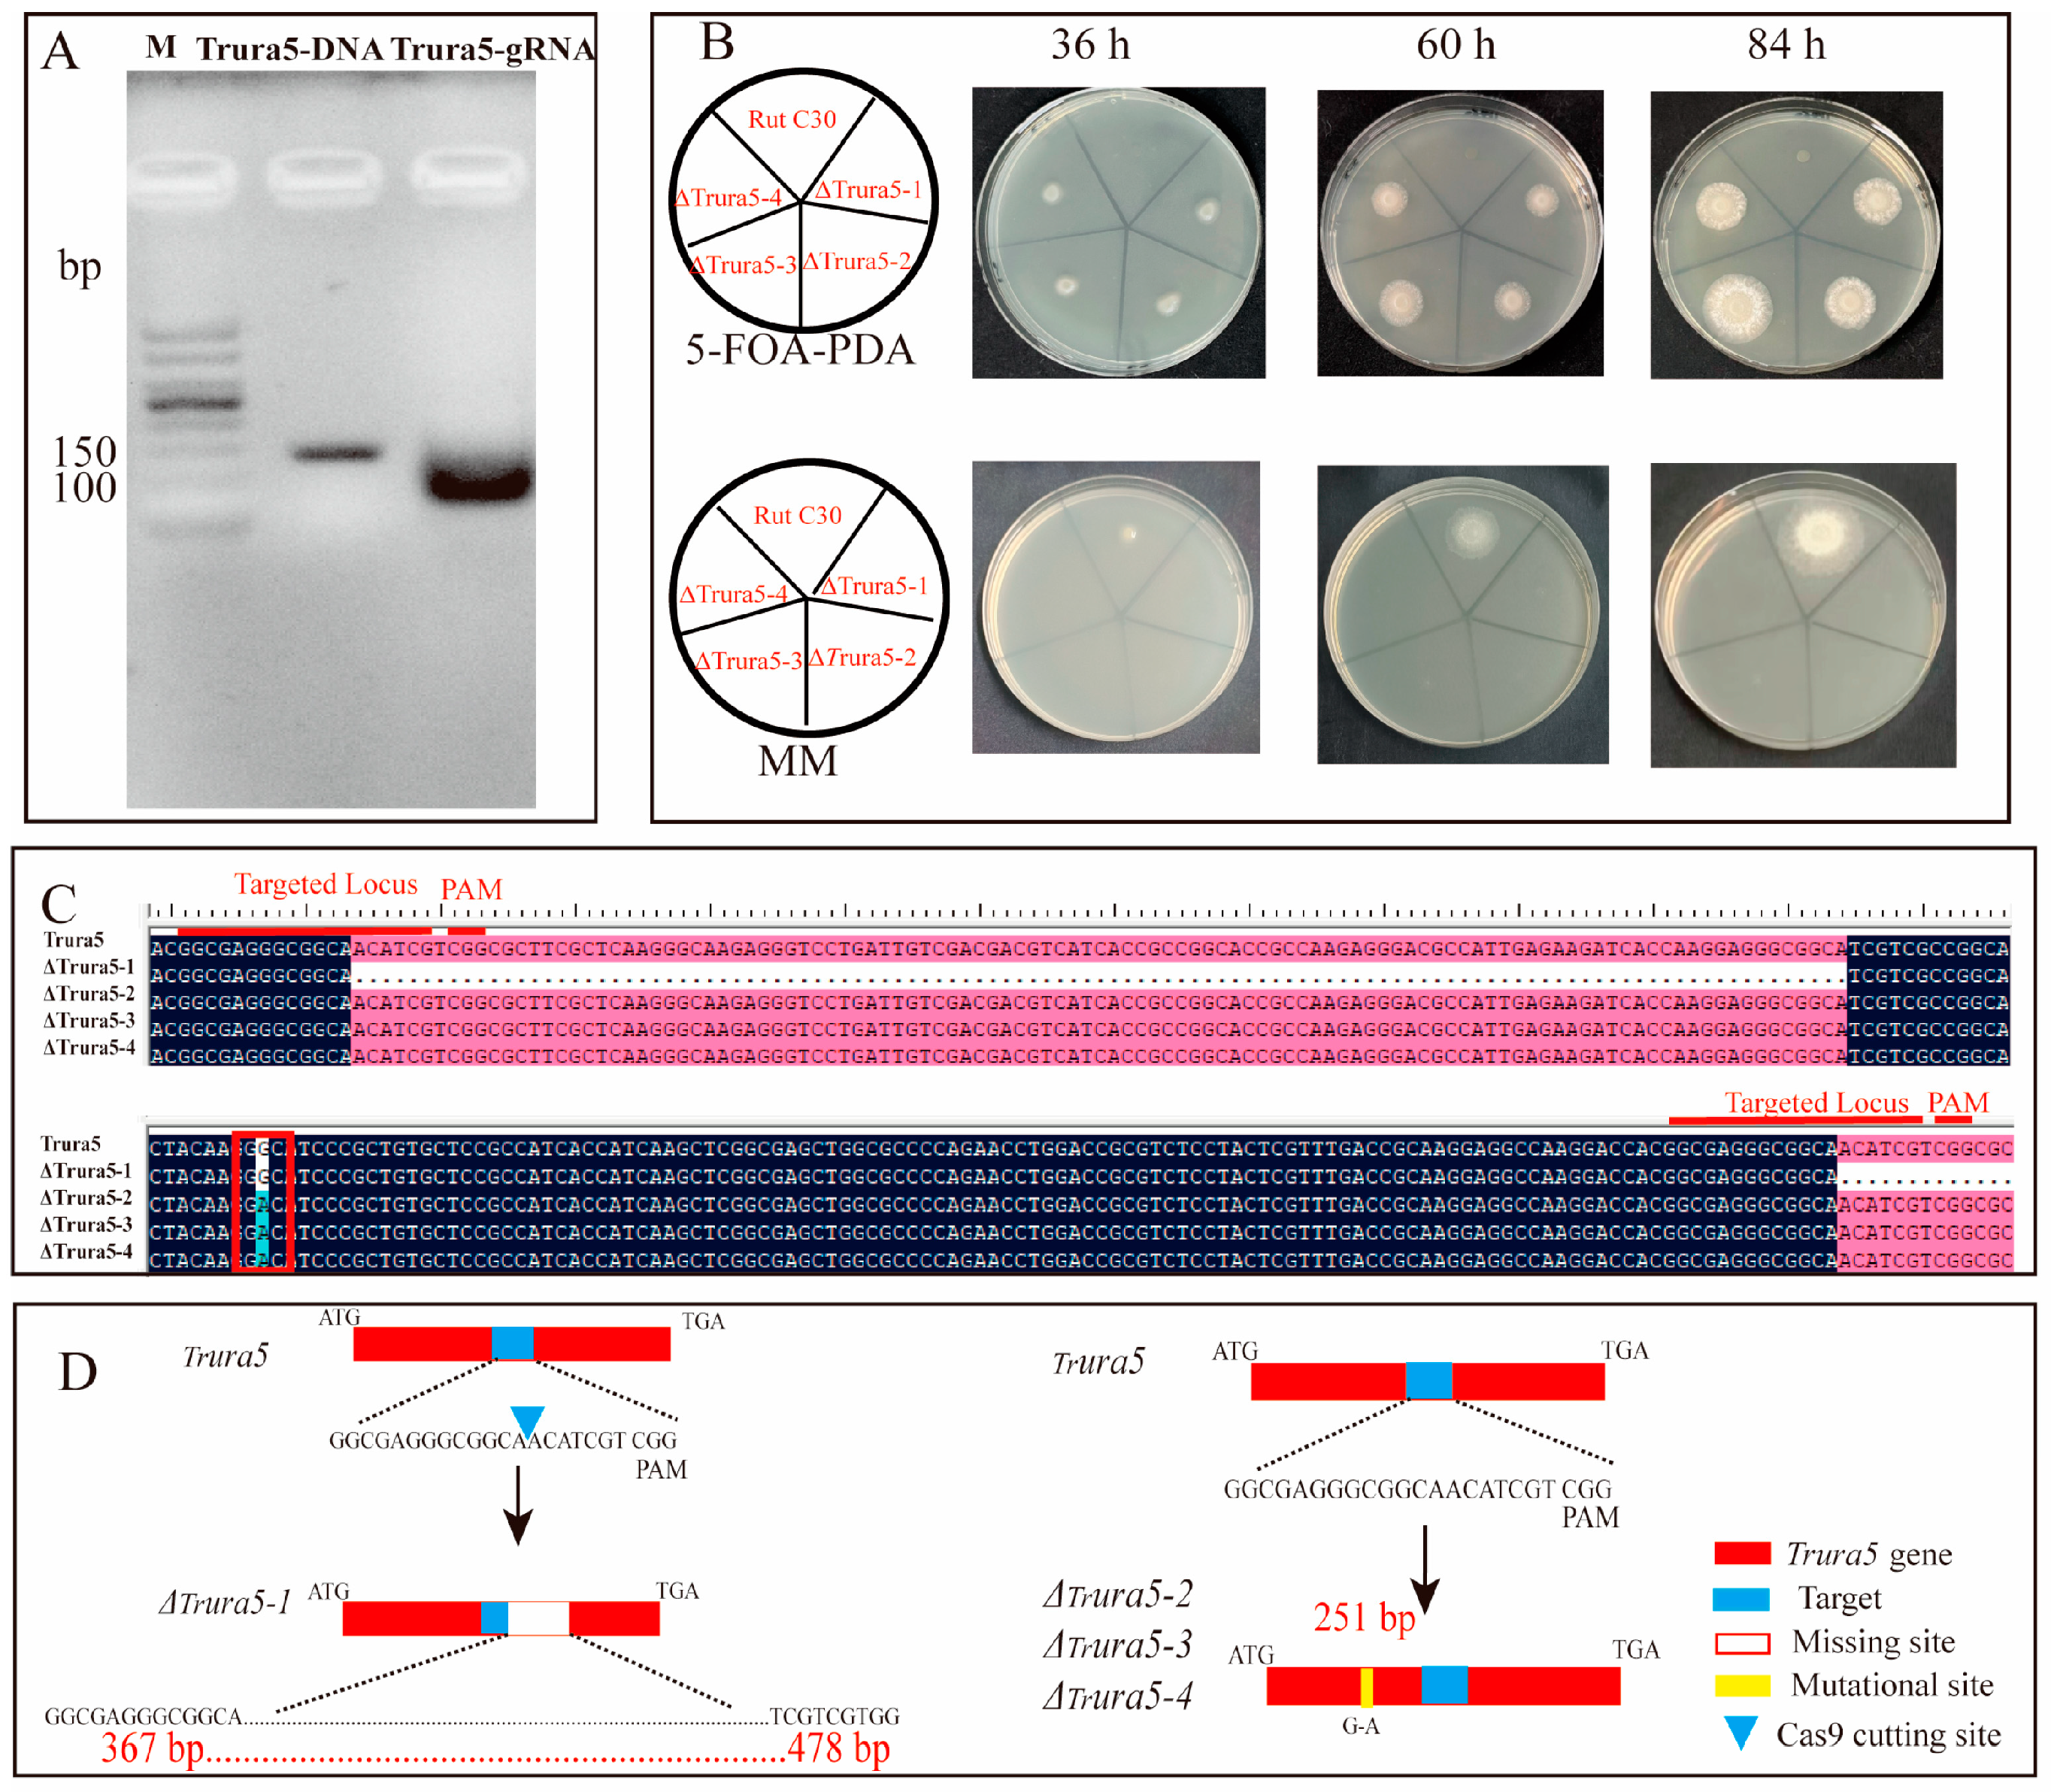
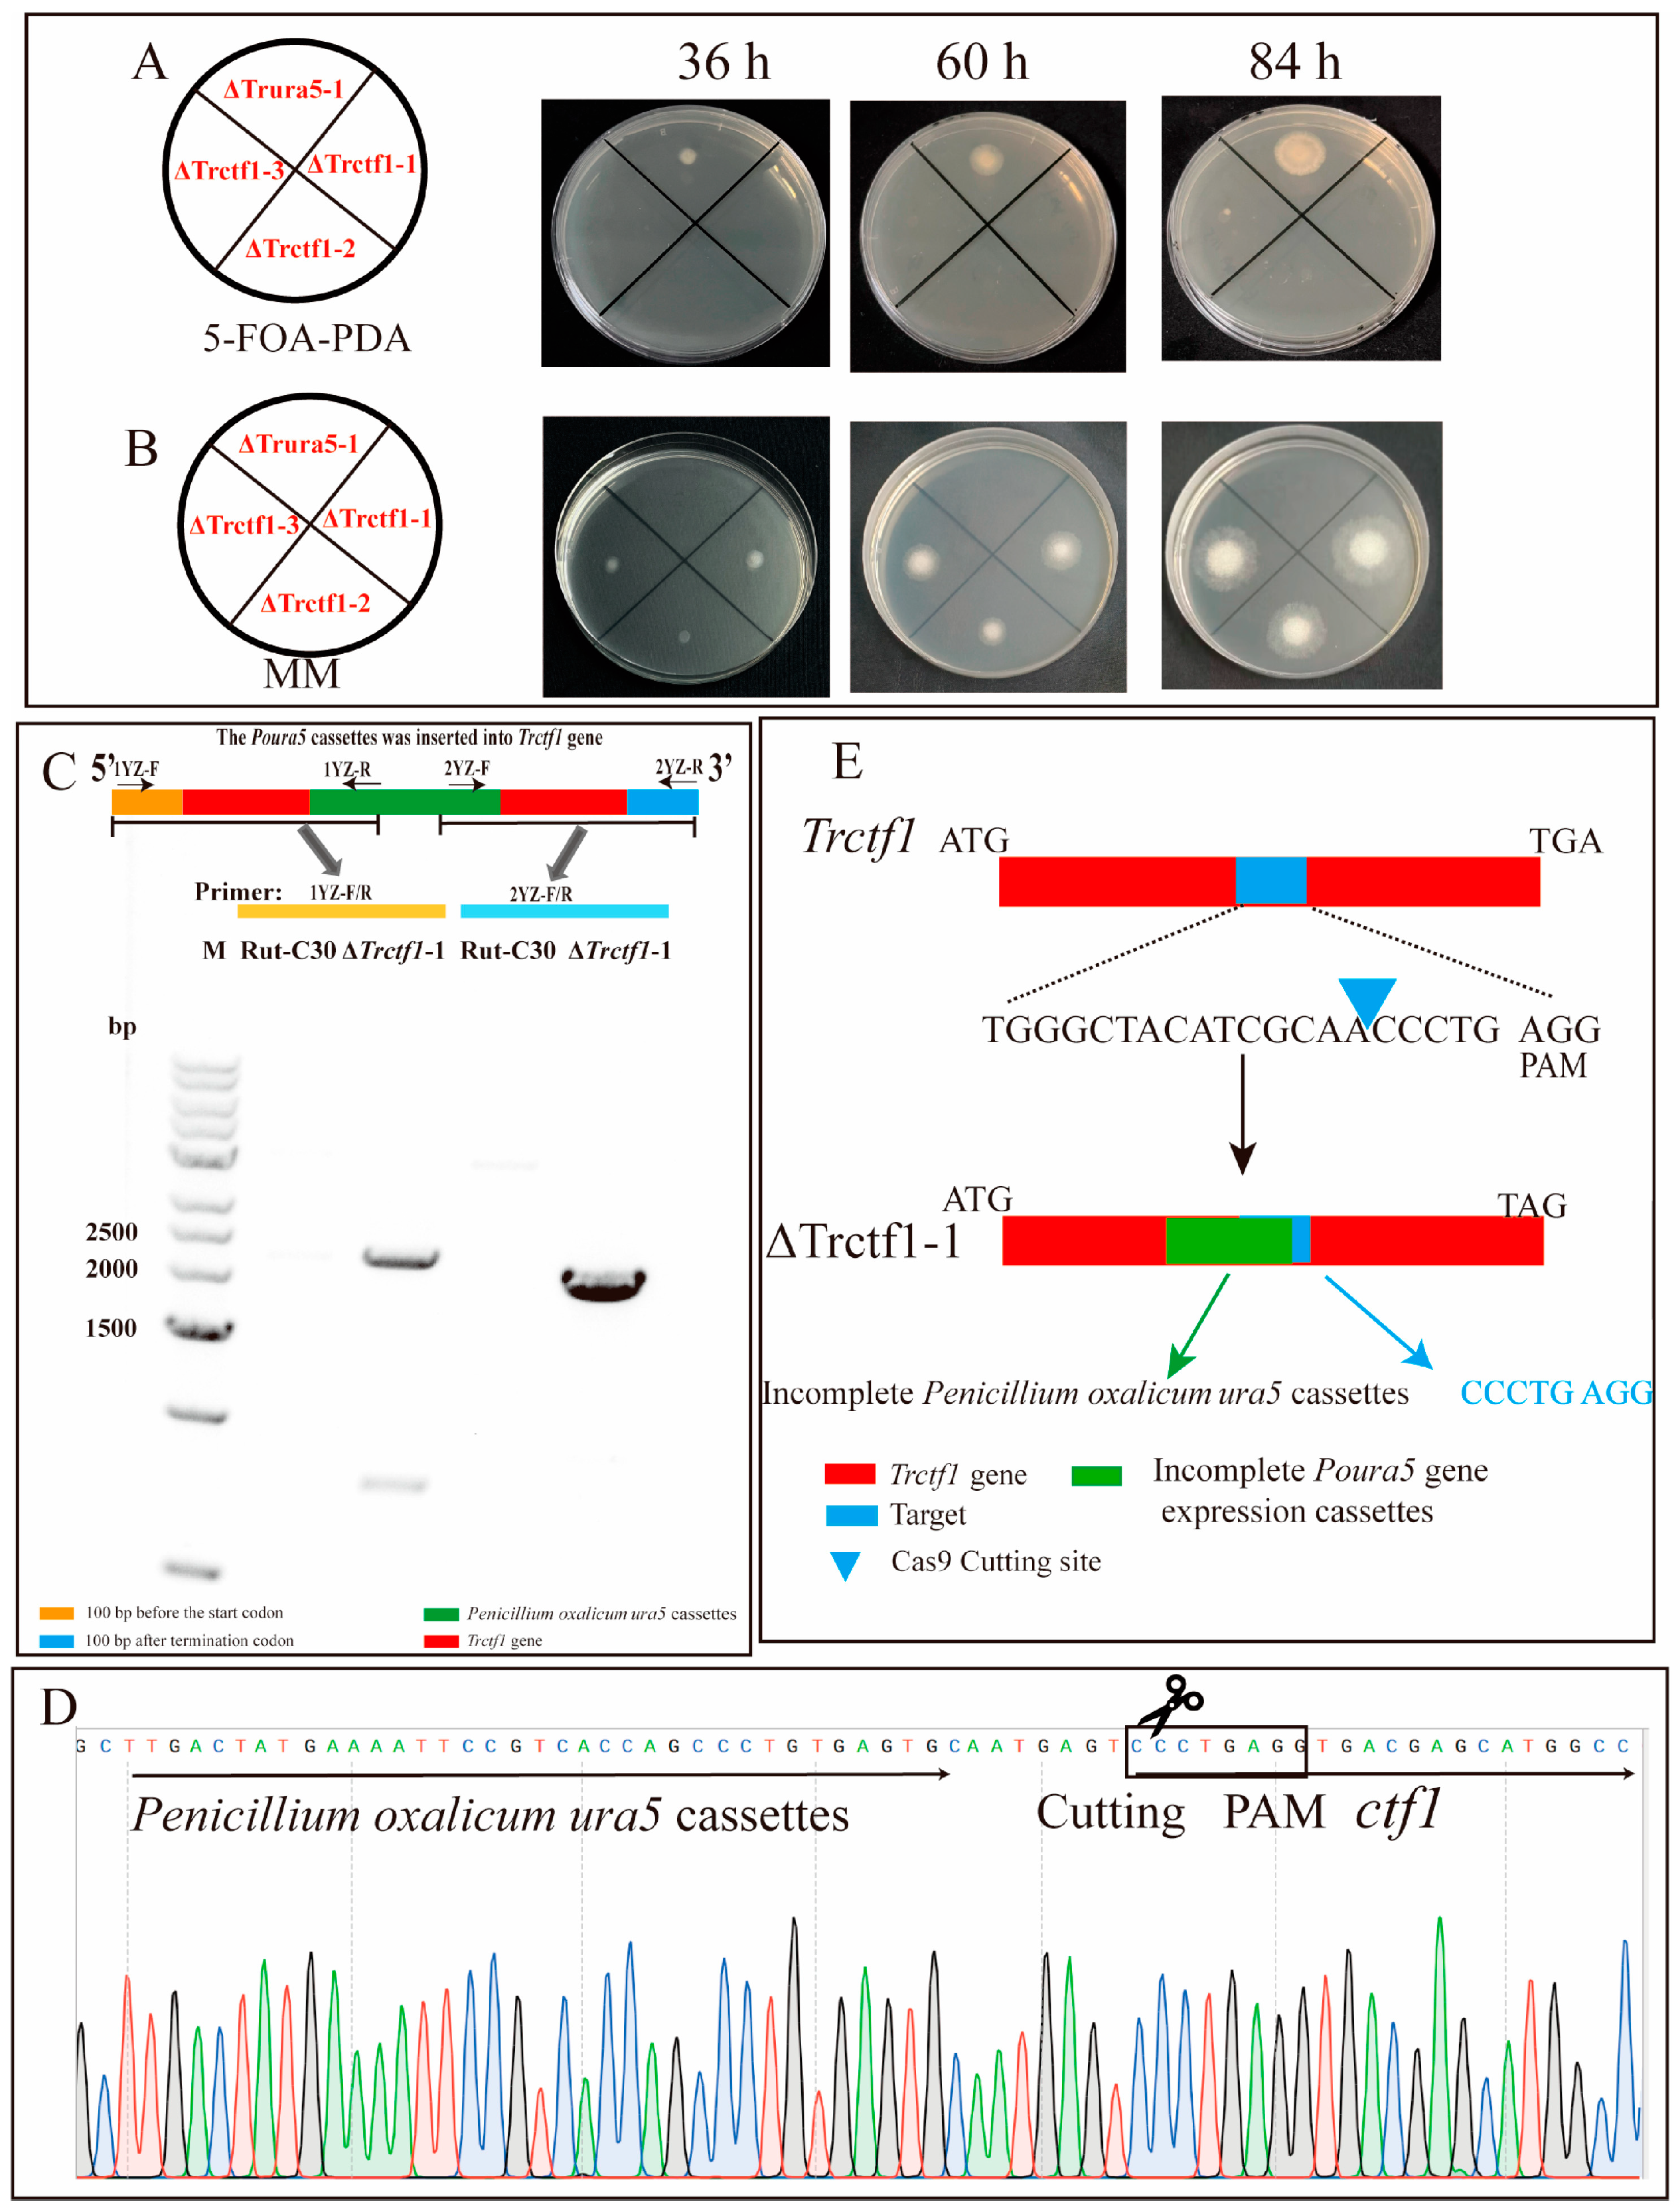
3.2. CRISPR–Cas9 System Directed Trctf1 Gene Mutagenesis in T. reesei

T. reesei ΔTrura5−1 was utilized as the microbial chassis for knocking out the transcriptional repressor Trctf1 gene to investigate its effect on cellulase activity under various soluble inducers. The Poura5 gene expression cassette from Penicillium oxalicum was employed as a screening marker to facilitate the insertion of this exogenous DNA into the Trctf1 gene via the CRISPR–Cas9 system [37], thereby achieving gene inactivation. The resulting transformants were designated T. reesei ΔTrctf1−1, ΔTrctf1−2 and ΔTrctf1−3. Figure 3A depicts the growth of the three transformants and T. reesei ΔTrura5−1 on PDA medium containing 5−FOA and uridine, indicating that only T. reesei ΔTrura5−1 could grow normally. Conversely, in uridine-free MM medium, all three transformants exhibited normal growth, while T. reesei ΔTrura5−1 failed to grow (Figure 3B). These results imply that the Poura5 gene expression cassette was integrated into the genomes of all three transformants.
The three transformants were cultured using MGD (the mixture of glucose and sophorose) was prepared using commercial β−glucosidase via enzymatic catalysis acting as an inducer) as the inducer separately, and no significant difference was observed in cellulase yield (Figure S1). T. reesei ΔTrctf1−1 was therefore utilized as the experimental strain for subsequent experiments. The genomes of T. reesei ΔTrctf1−1 and ΔTrura5−1 served as the templates for PCR experiments using two pairs of primers, 1YZ−F/1YZ−R and 2YZ−F/2YZ−R, to initially determine the position of the Poura5 gene expression cassette inserted into the Trctf1 gene. The results are depicted in Figure 3C. No DNA bands were generated using the T. reesei ΔTrura5−1 genome as the template, indicating that the Poura5 gene expression cassette was absent within the Trctf1 gene of this T. reesei strain, which is consistent with reality. In contrast, DNA bands of sizes 2194 bp and 1917 bp were obtained using the T. reesei ΔTrctf1−1 genome as the template. Combined with the DNA sequencing results (Figure 3D), it was revealed that the Poura5 gene expression cassette was inserted 5 bp upstream from the PAM sequences, rather than integrating into the T. reesei genome through homologous recombination, which may be due to segments of insufficient homology (Figure 3E). Moreover, the DNA sequencing results reveal a 254 bp deletion at the 5′ ends of the Poura5 gene expression cassette, which is integrated between the Trctf1 genes. Additionally, the attachment illustrating the Poura5 gene expression cassette visually highlights the deleted region of 254 bp in red (Data. S1). In conclusion, Trctf1 knockout T. reesei was successfully produced and can be employed for additional cellulase production.

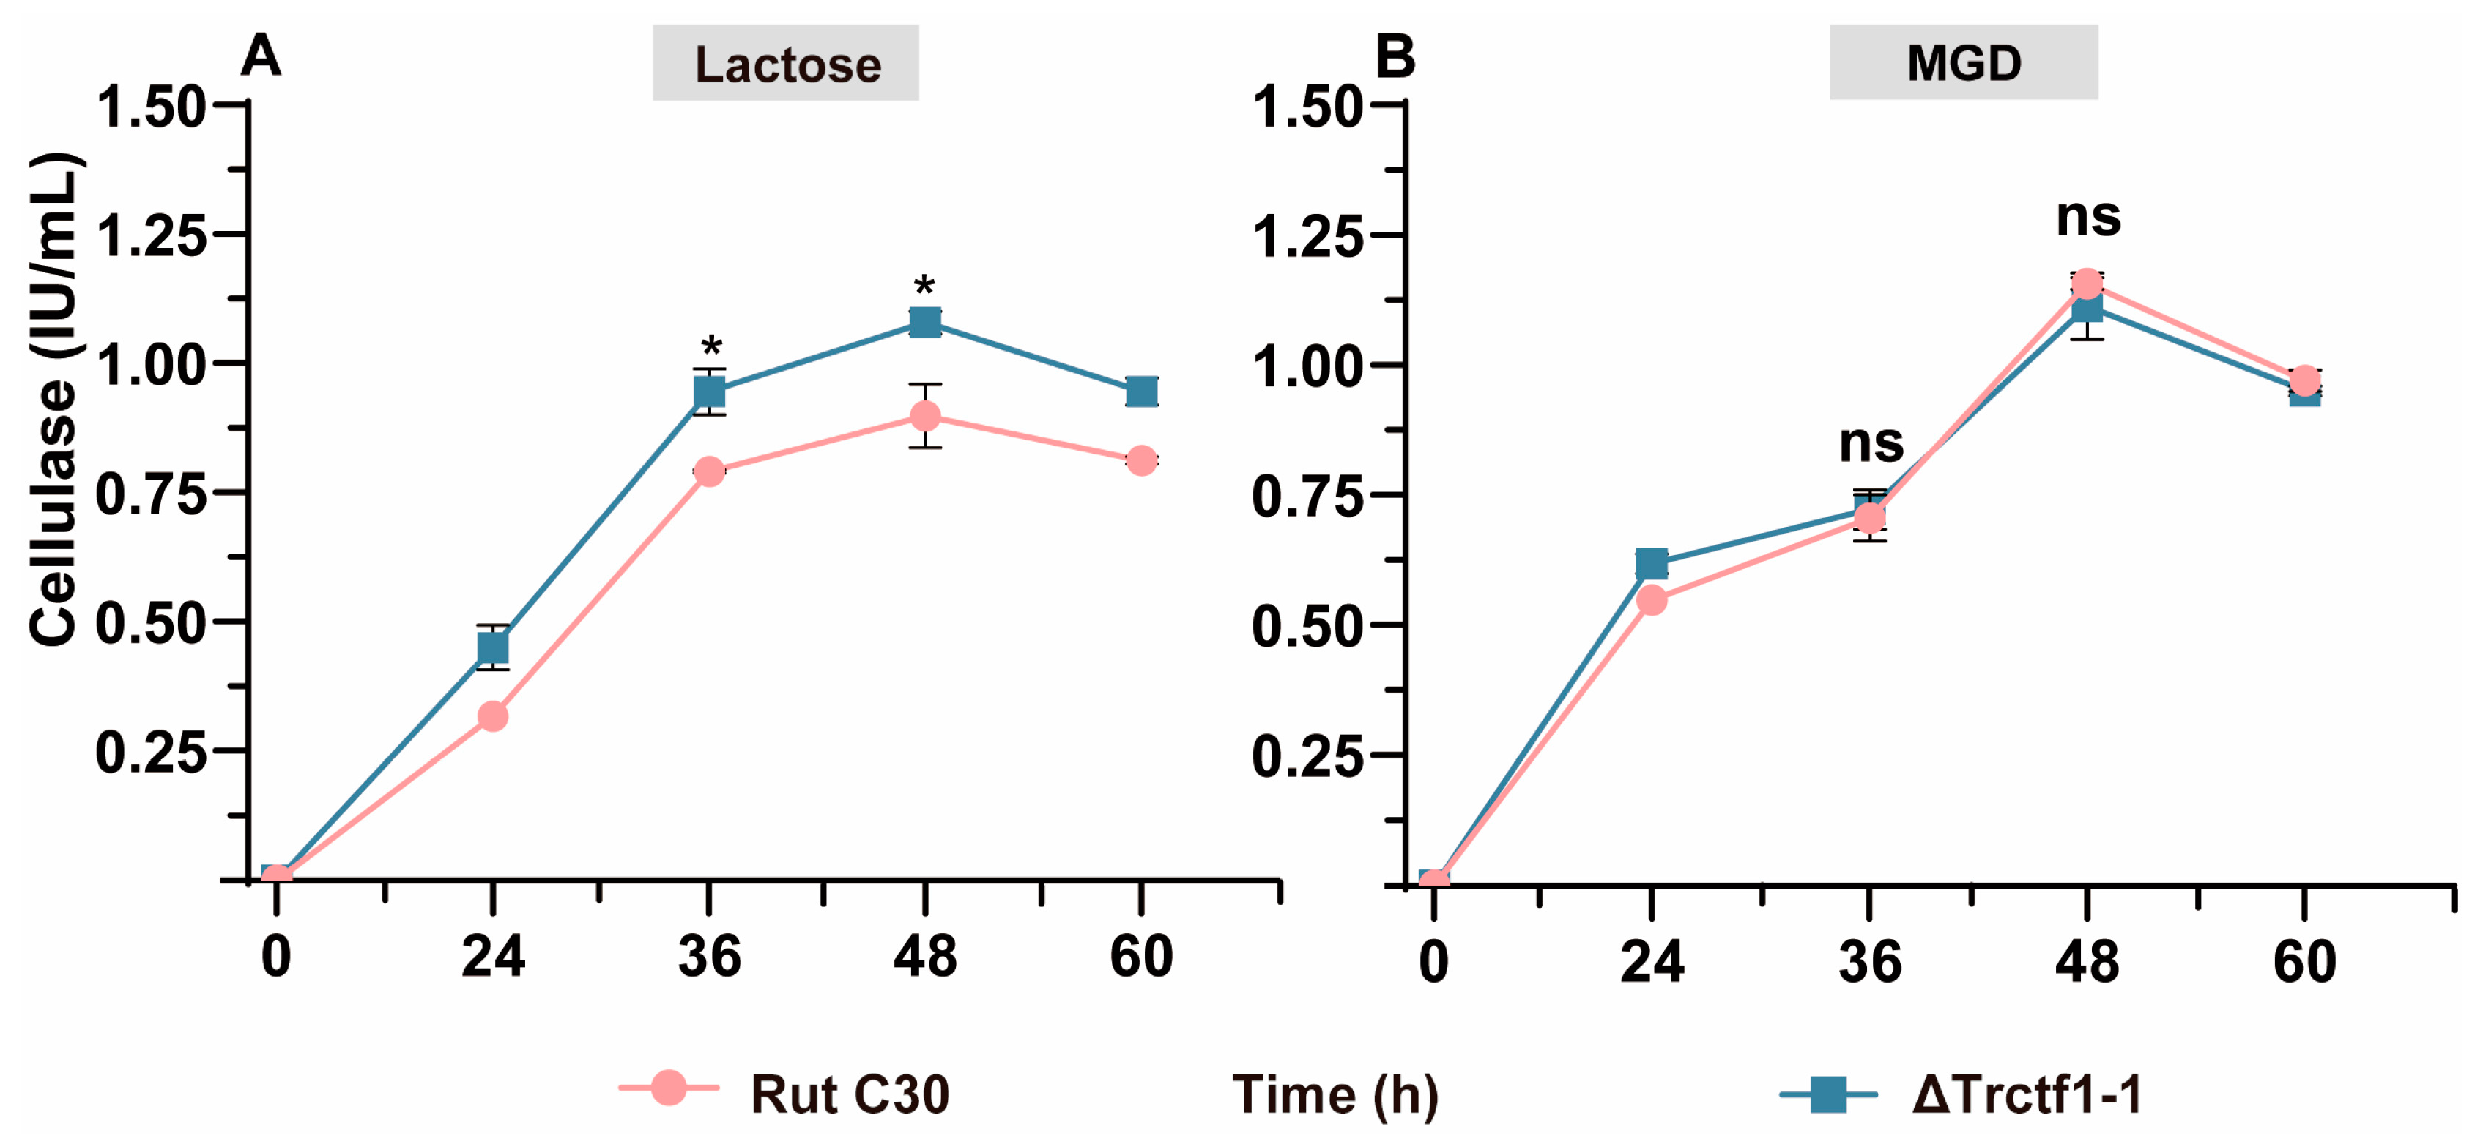
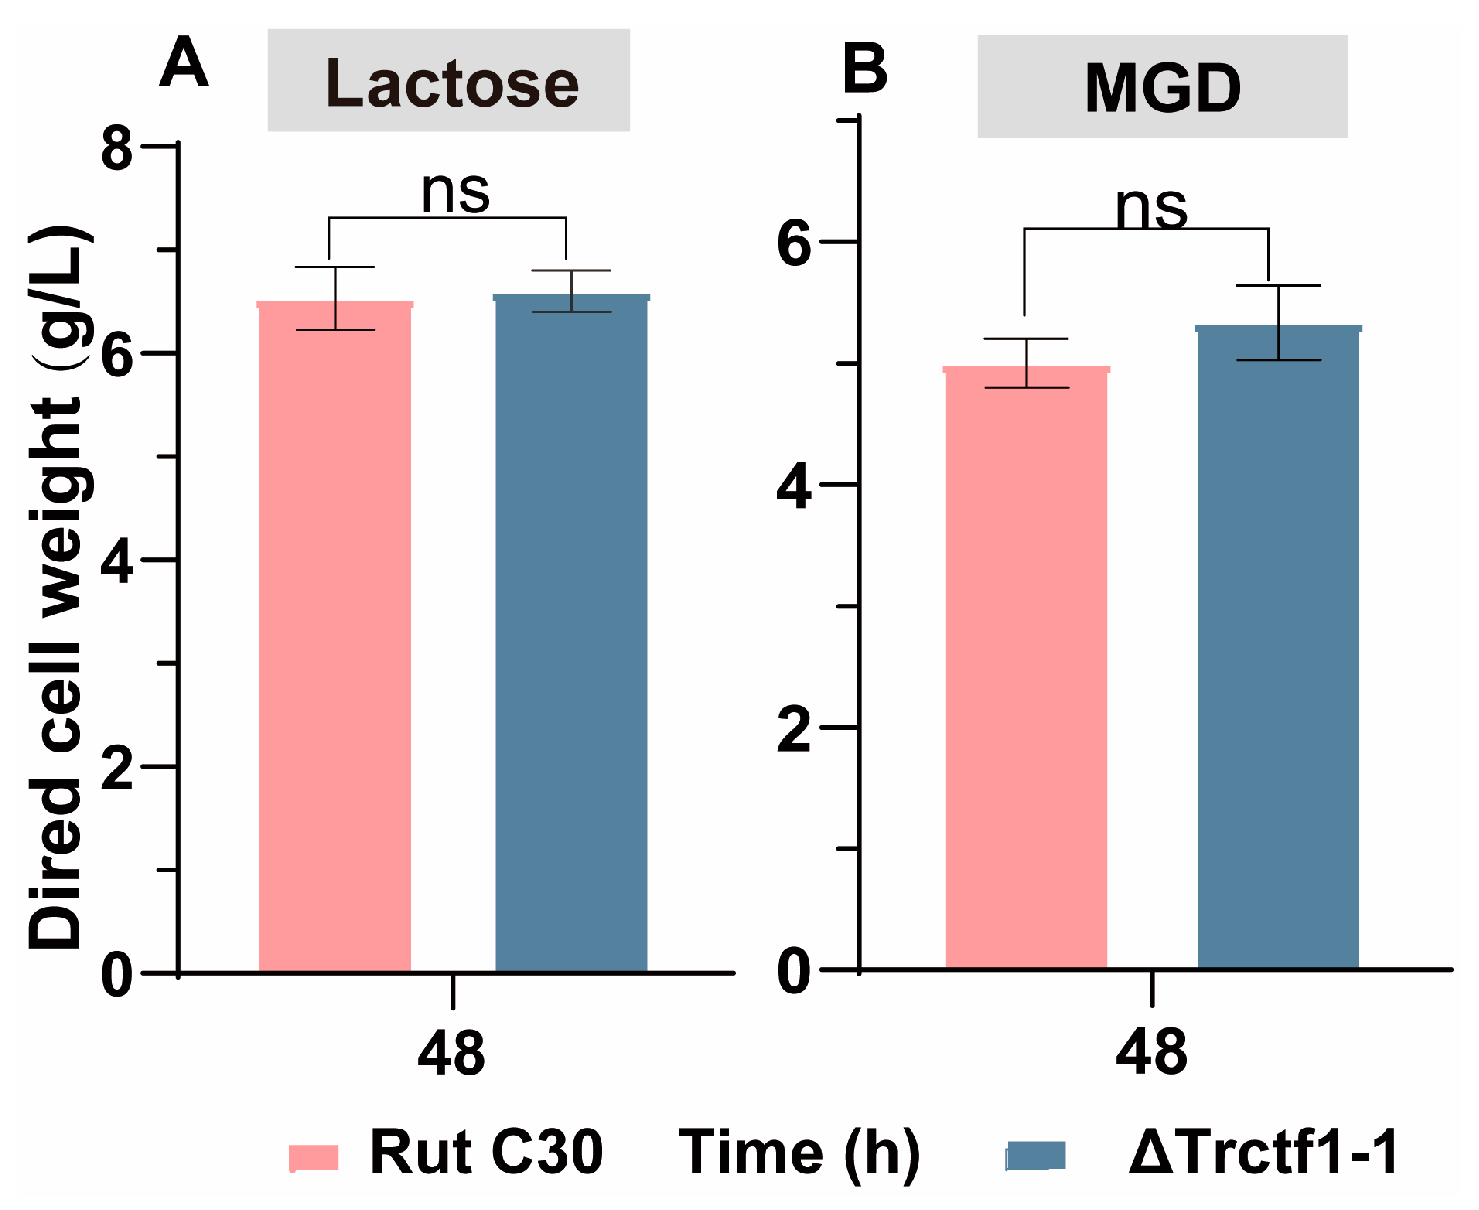
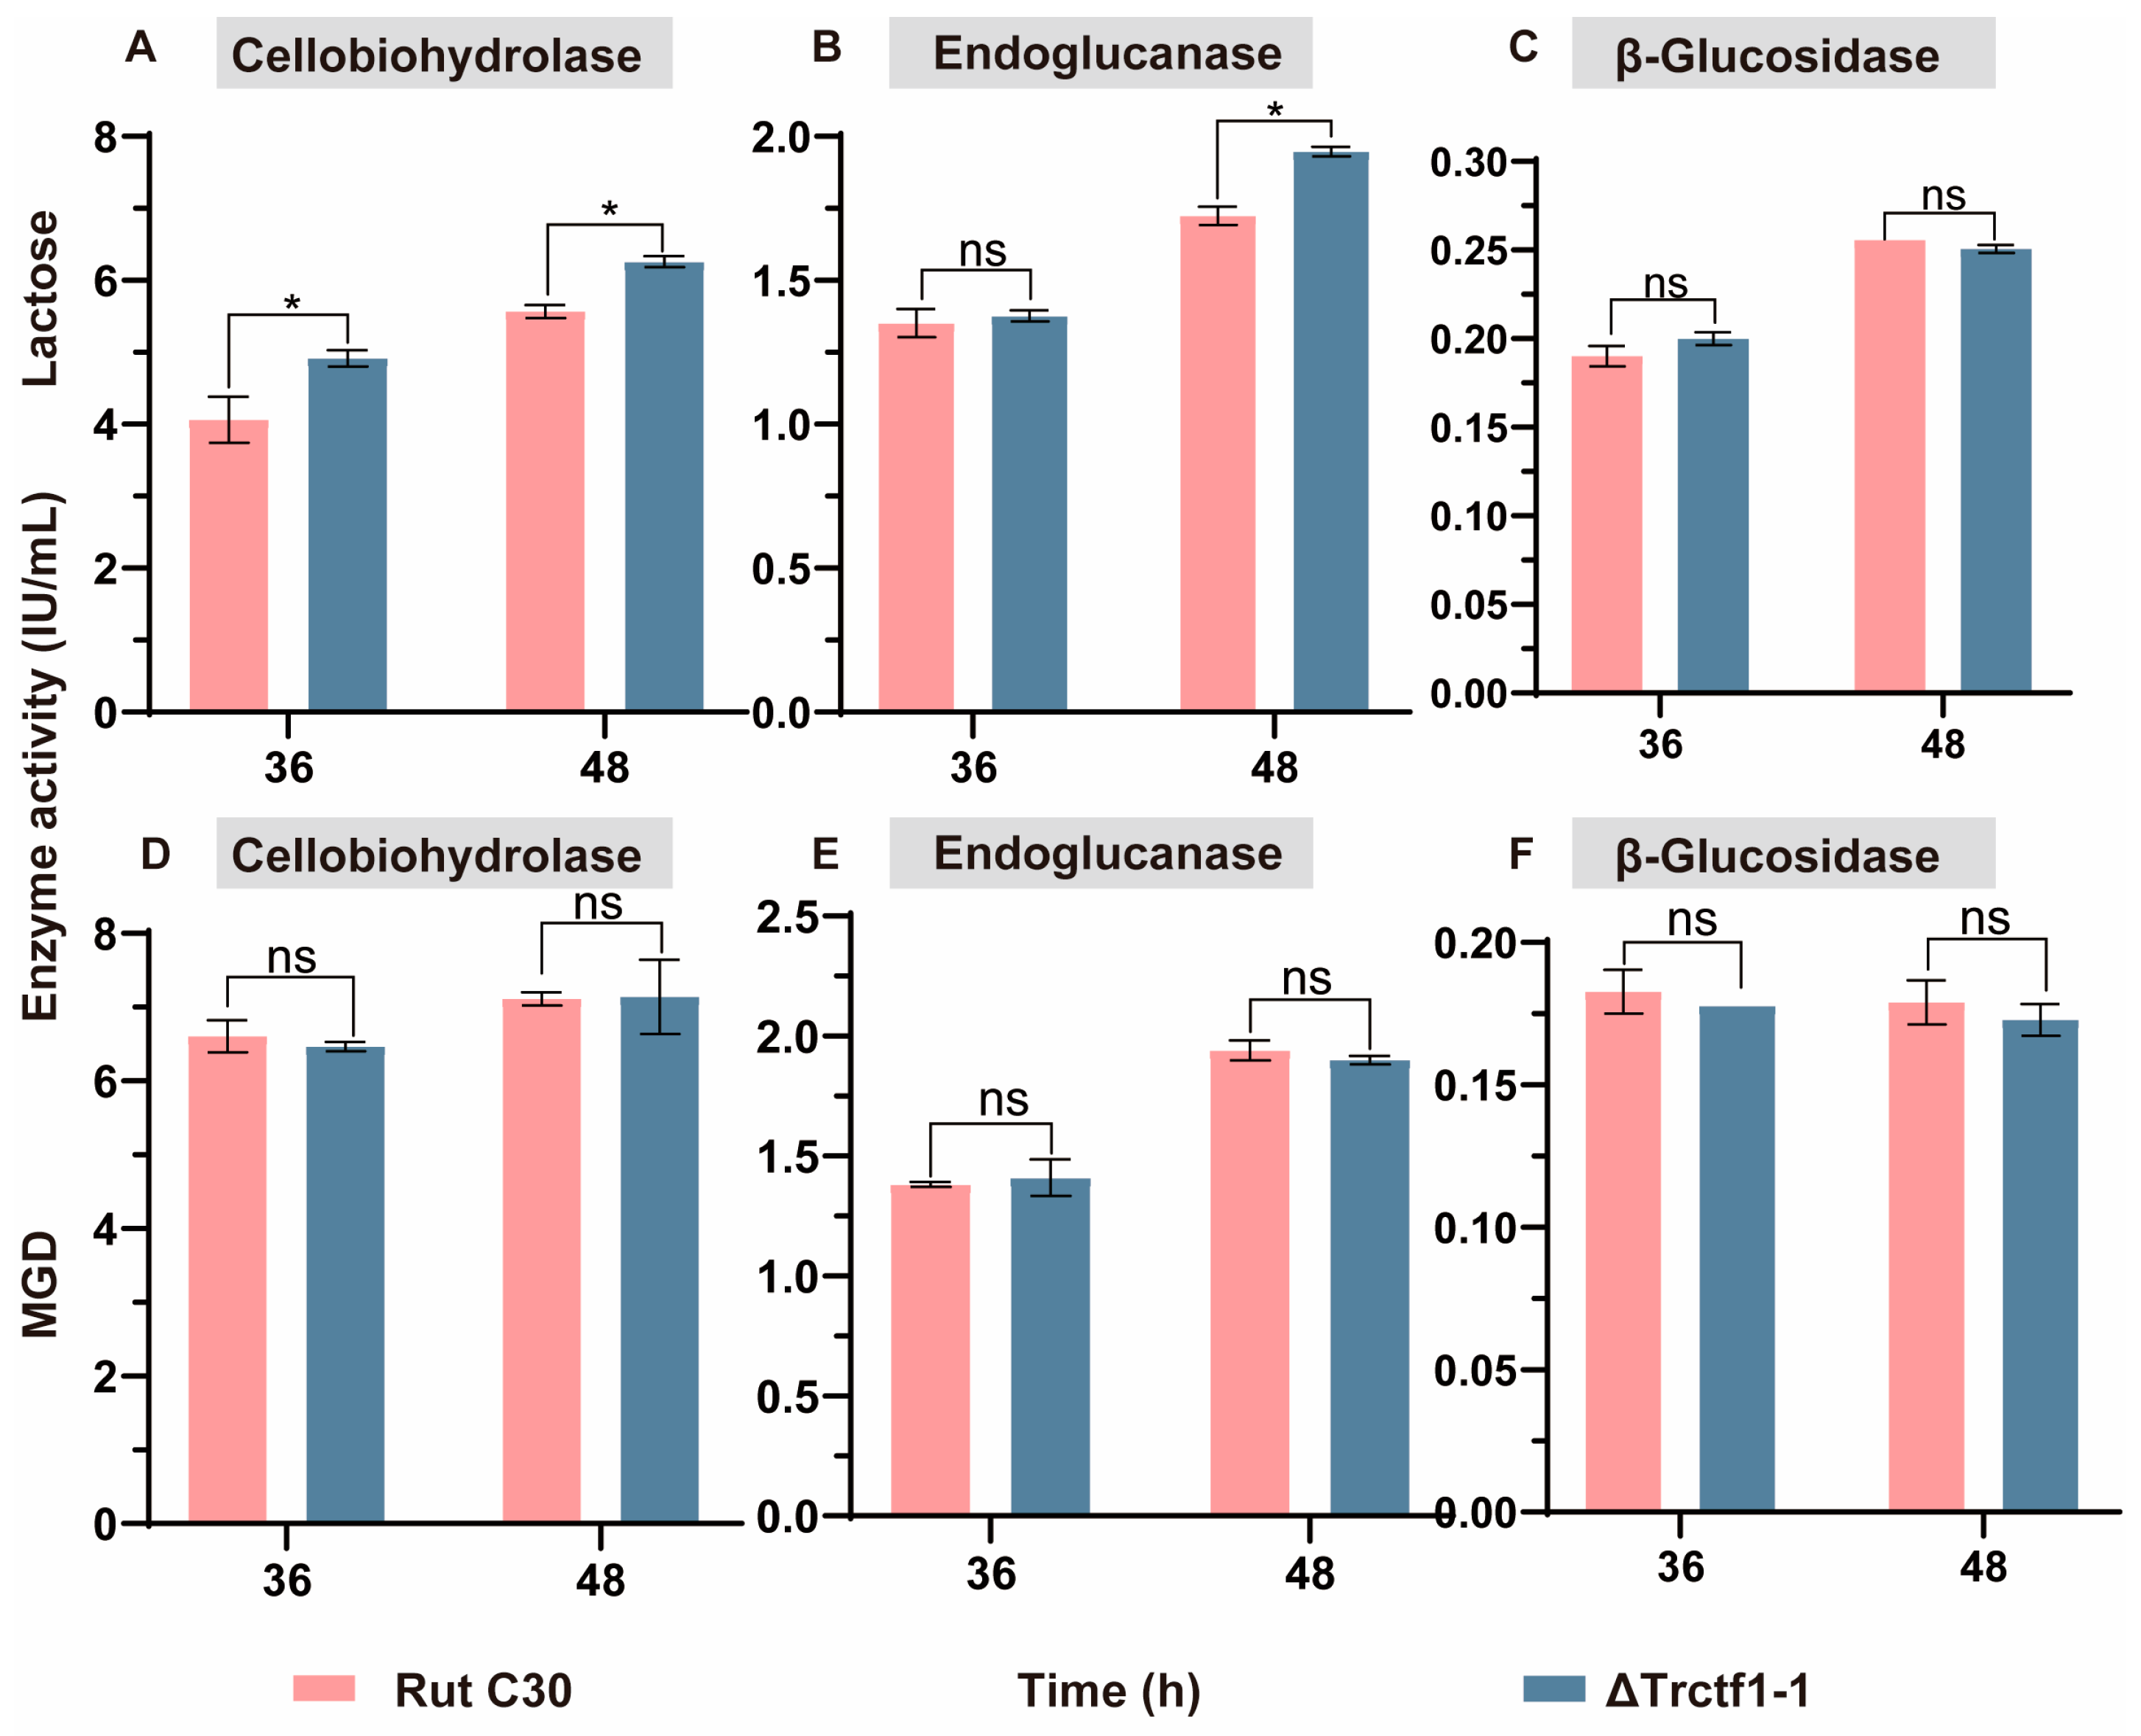
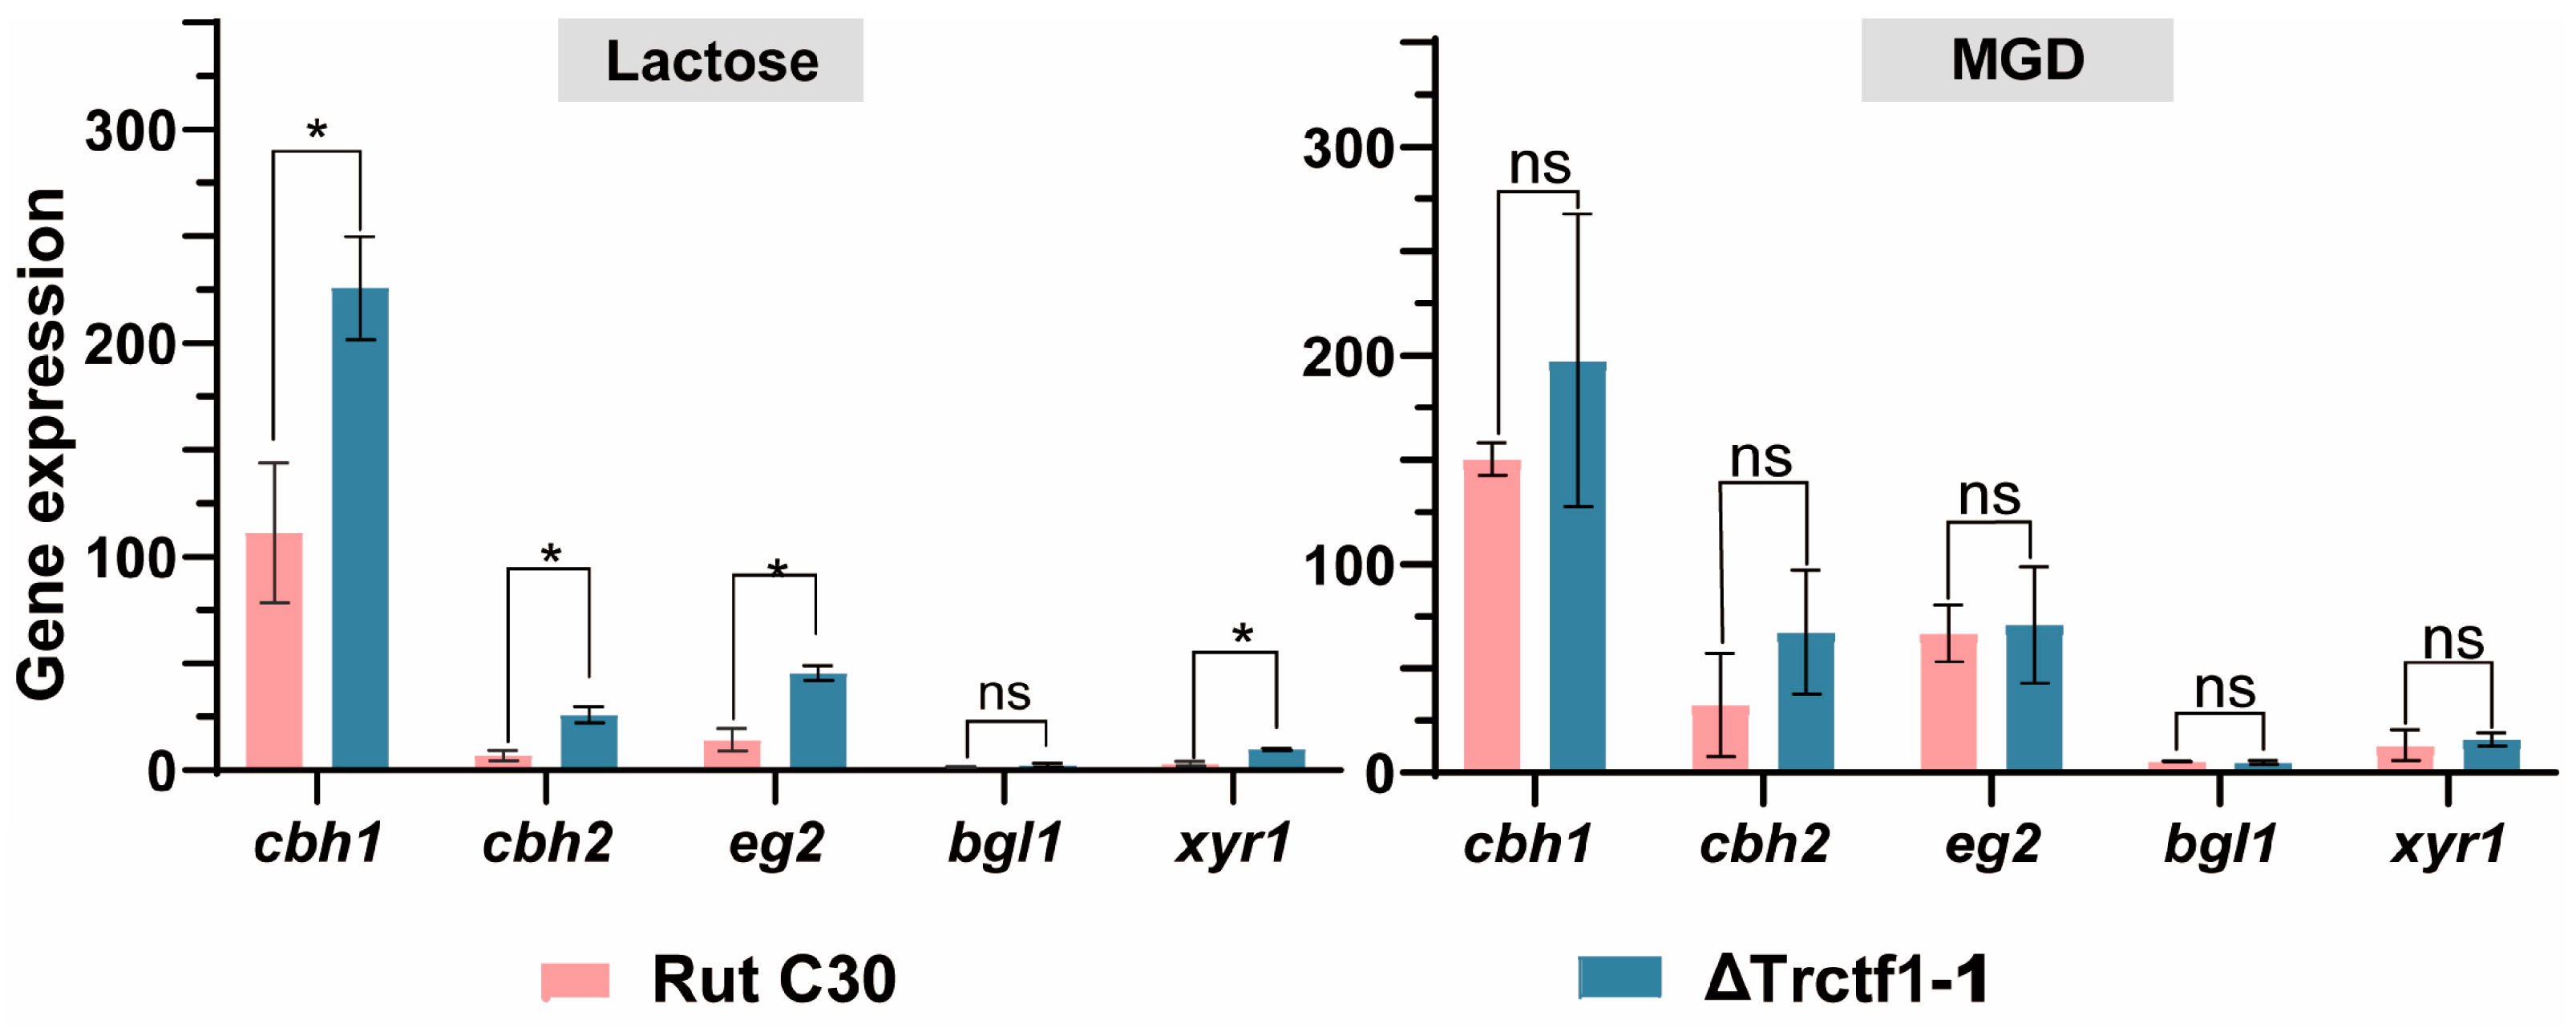
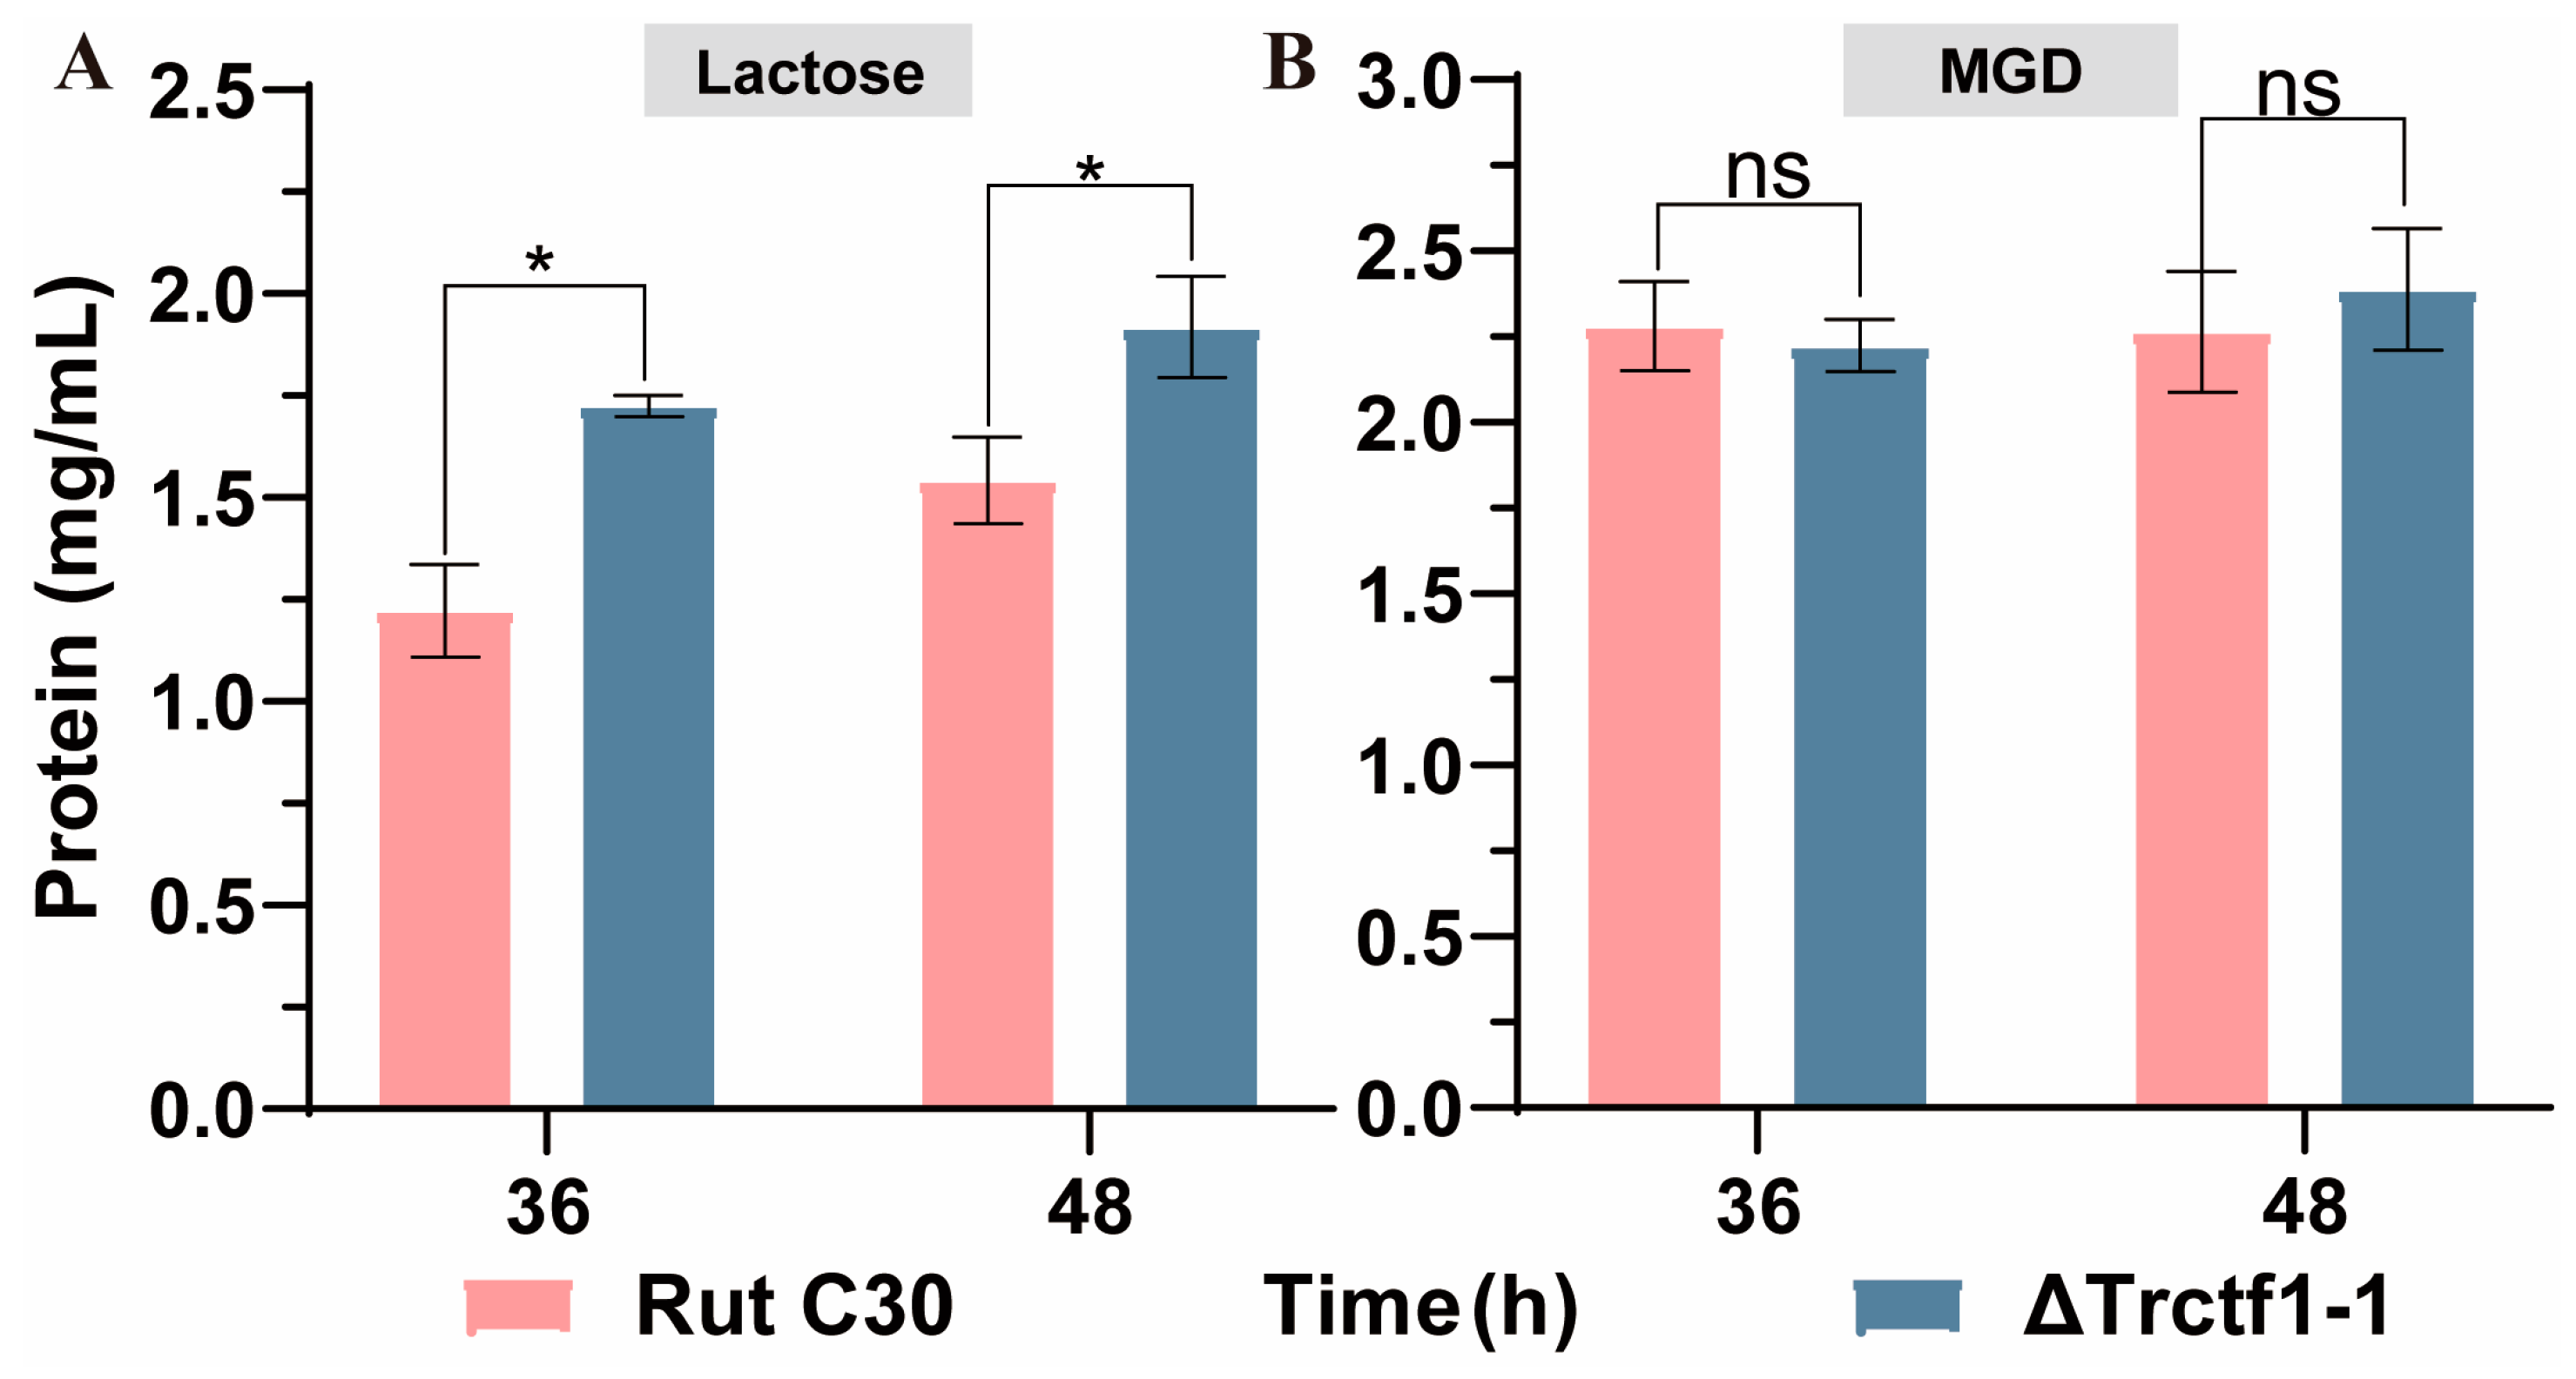
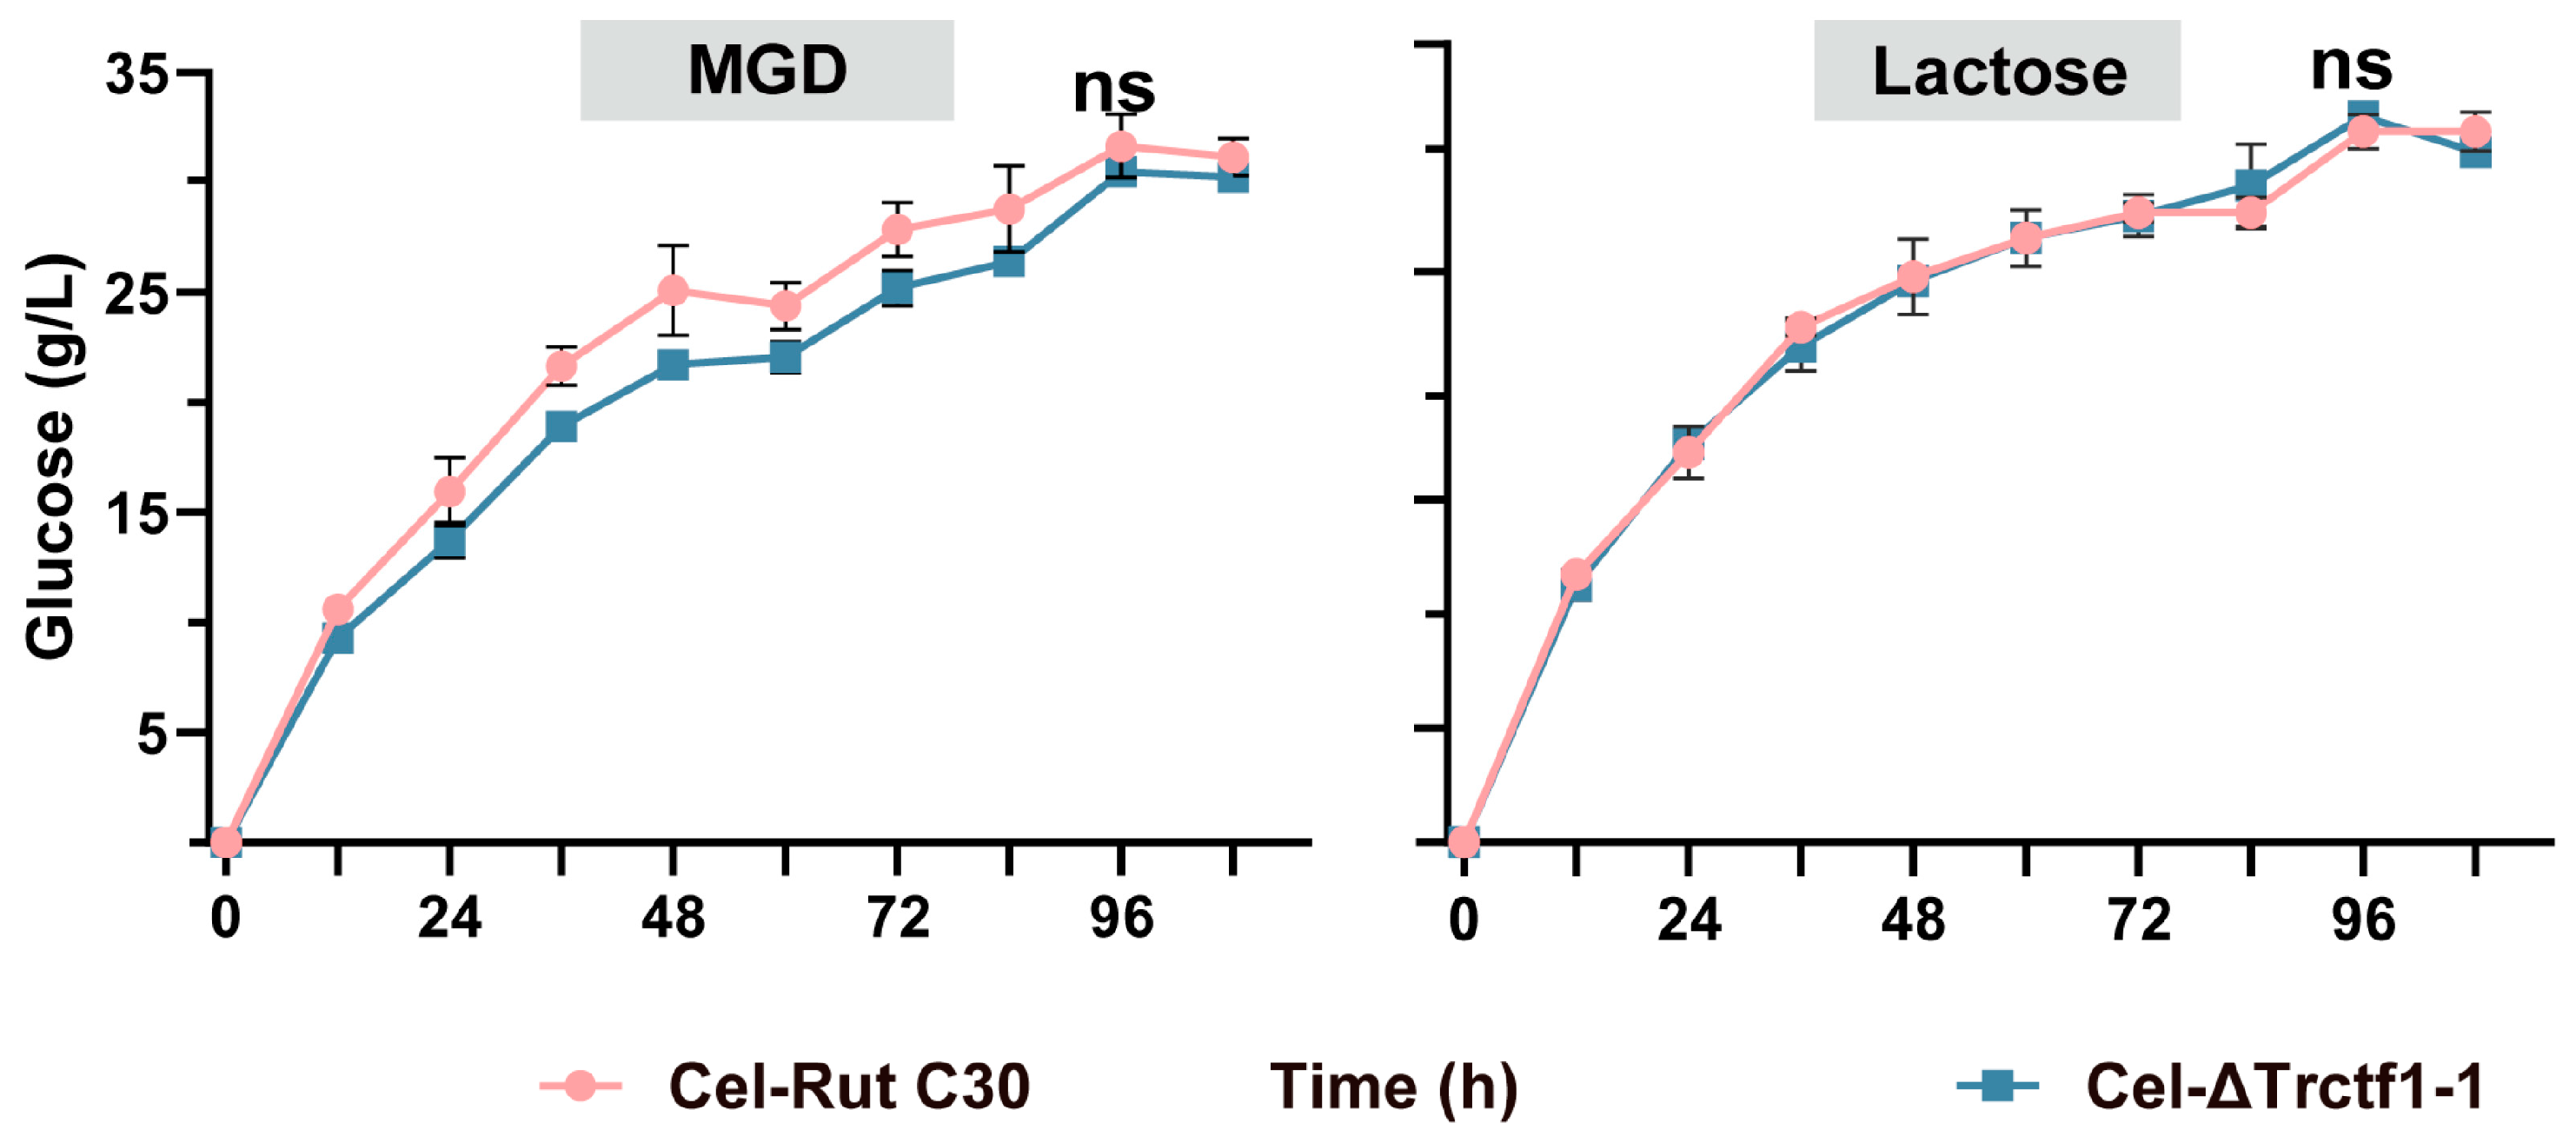
3.3. Impact of the Trctf1 Gene on Cellulase Production with Various Soluble Inducers

A prominent cre1-deficient mutant strain of T. reesei Rut C30 is highly efficient at producing cellulase, a process that requires induction. Sophorose is the most effective inducer, but it is also costly. MGD, prepared through β−glucosidase catalyzed glucose, contains sophorose and is highly inducible. Lactose, a commonly used inducer, has been shown to be less potent than MGD [18]. Transcriptomics analysis revealed that MGD induction resulted in a lower expression level of the transcriptional repressor Trctf1, which is likely a significant reason why Trctf1 gene expression was lower under the high-induction power of MGD [31,45]. Therefore, to test this hypothesis, exploring the Trctf1 gene under both MGD and lactose induction is necessary to obtain conclusive results.
Cellulase production from the wild-type strain and the T. reesei ΔTrctf1 strain with the Trctf1 gene knocked out was induced using 10 g/L MGD or lactose as inducers and carbon sources. The results in Figure 4 indicate that the highest cellulase production was achieved after 48 h of fermentation, and T. reesei ΔTrctf1−1 had significantly increased cellulase titers by 10.4% and 20.2% at 36 and 48 h, respectively, under lactose induction (p < 0.05). On the other hand, using MGD as an inducer, no significant difference in cellulase production was found at 36 and 48 h (p > 0.05). At the peak time point of cellulase production (48 h), all mycelia cells were collected and the dry weight was determined. The results, as shown in Figure 5, showed no significant difference, whether induced by lactose or MGD. An in-depth analysis showed that lactose induction led to 12.4% and 12.9% higher secretion of cellobiohydrolase and endoglucanase, respectively (Figure 6A,B), compared to the control strain (p < 0.05), which was a significant reason behind the augmented cellulase activity of T. reesei ΔTrctf1. Previous research reported that overexpression of the cellobiohydrolase gene cbh2 significantly increased cellulase activity, confirming the findings of this study [34,46,47]. However, β−glucosidase activity did not show significant differences (p > 0.05) (Figure 6C), indicating that the cellulase transcriptional repressor Trctf1 was not responsible for the regulation of the β−glucosidase gene of T. reesei. Moreover, the production levels of cellobiohydrolase, endoglucanase, and β−glucosidase were similar under MGD induction and were not significantly different (p > 0.05) (Figure 6D–F). As mentioned earlier, T. reesei Rut C30 bears a mutation in the cre1 gene, which encodes a sequence-specific DNA-binding protein that mediates carbon catabolite repression (CCR) of cellulase genes by glucose in T. reesei. Therefore, it is crucial to conduct further analysis to determine whether the knockout of the Trctf1 gene has any impact on cellulase production in cellulase-producing strains that possess unmutated cre1 genes, such as QM9414 [48].
Figure 7 depicts the expression of genes encoding major cellobiohydrolases (cbh1 and cbh2), endoglucanase (eg2), β−glucosidase (bgl1), and the transcriptional activator xyr1 which is regulated by Trctf1. This analysis serves to investigate the molecular mechanism that underlies the induction effect of MGD and lactose on cellulase production by T. reesei RUT C30 and ΔTrctf1.
All selected genes were induced in the presence of various inducers (Figure 7). It is very clear that lactose induced cbh1, cbh2, and eg2 more efficiently in T. reesei ΔTrctf1−1 than T. reesei Rut C30, while there were no significant differences in the transcript levels of all cellulase genes under MGD induction, which were in accordance with the production profiles of cellulase illustrated in Figure 4. Xyr1 exerts control over the transcription of nearly all cellulase genes and dicatholds the distinction of being the most pivotal transcriptional activator. The results showed that knock-out of the Trctf1 gene leads to enhanced expression of the xyr1 gene under lactose-induced conditions, aligning with the findings observed with cellulose induction.
The results obtained from lactose and cellulose induction exhibited similarities, in contrast to the effects of sophorose induction. These findings imply that the transcriptional regulation of cellulase genes differs under the influence of sophorose compared to lactose and cellulose. Additionally, prior transcriptomics studies indicate that the transcript level of the Trctf1 gene is notably lower under the induction conditions of sophorose when compared to lactose, which could potentially contribute to the robust inducibility observed with sophorose [31,32,33].
Extracellular protein levels were consistent with the cellulase activity (Figure 8). When lactose was utilized as the inducer, the extracellular protein concentration secreted by T. reesei ΔTrctf1 was 24.3% higher than that of the wild-type strain, while there was no significant difference in extracellular protein concentration under MGD induction. Furthermore, knockout of the Trctf1 gene did not affect the cellulase cocktail as analyzed by SDS-PAGE (Figure S2). This finding was validated by the hydrolysis of corn stover.

3.4. Hydrolysis of Corn Stover by Recombinant Cellulases

The complex structure of lignocellulose necessitates the coordinated actions of multiple cellulases and auxiliary proteins for effective degradation of the material. The expression of these enzymes is controlled by various transcription factors, and the cellulase cocktail produced by T. reesei is known to vary under different inducer cultures [18,49]. Therefore, it is essential to investigate the impact of Trctf1 gene knockout on the synthesis of cellulase cocktail in T. reesei under different inducers. Notably, the deficiency of β−glucosidase in T. reesei cellulase has been documented to cause cellobiose accumulation during hydrolysis, resulting in reduced activity of endoglucanase and cellobiohydrolase, and decreased efficiency of lignocellulose hydrolysis [50,51,52]. Consequently, β-glucosidase is generally supplemented [53], and commercialized β−glucosidase was sufficiently added to the hydrolysis system in this study. The efficiency of degradation was assessed by measuring the glucose concentration released from alkali-pretreated corn stover (APCS), which comprised 62.6%, 21.4%, and 8.2% of cellulose, hemicellulose, and lignin in terms of dry matter, respectively [54,55].
The cellulases produced by T. reesei Rut C30 (Cel−WT) and T. reesei ΔTrctf1 (Cel−ΔTrctf1) were evaluated for hydrolysis on 5% APCS substrate. The results are presented in Figure 9. Cel−WT and Cel−ΔTrctf1 both hydrolyzed APCS under MGD induction, yielding 31.6 g/L and 30.5 g/L glucose, respectively, with no significant difference observed (p > 0.05). Cellulase hydrolysis experiments using lactose as an inducer yielded results consistent with those obtained under MGD induction, indicating that the knockout of Trctf1, a transcriptional repressor that acts as a crucial regulator of cellulase gene, does not significantly impact the synthesis of the cellulase cocktail when soluble inducers are used.

4. Conclusions

In this study, we established a functional CRISPR–Cas9 genome editing system for T. reesei Rut C30 by intracellular expression of a codon-optimized Cas9 protein and performed in vitro RNA transcription. This technique resulted in the efficient knockout of the transcriptional repressor Trctf1 gene in T. reesei ΔTrctf1. Our results showed that T. reesei ΔTrctf1 yielded cellulase production is similar to that of the wild-type strain in response to glucose-sophorose mixture induction but was significantly increased using lactose as an inducer. Furthermore, we confirmed that Trctf1 knockout did not significantly alter the cellulase cocktail, and that hydrolysis of corn stover remained unaffected. These findings contribute to the understanding of the molecular mechanisms driving cellulase synthesis by T. reesei under different soluble inducers and the construction of high cellulase producing strains.

Supplementary Materials

The following supporting information can be downloaded at: https://www.mdpi.com/article/10.3390/fermentation9080746/s1, Figure S1: Shake flask fermentation of T. reesei ΔTrctf1−1, ΔTrctf1−2, ΔTrctf1−3, and wild-type strain with 10 g/L MGD as an inducer for cellulase production. The “ns” represents no significant difference (p > 0.05); Figure S2: knockout of the Trctf1 analyzed by SDS-PAGE; Table S1: gRNA sequences for knockout of Trctf1 and Trura5 genes and target sequence are underlined; Table S2: All primers used in this study; Data S1: Penicillium oxalicum ura5 expression cassette sequence.

Author Contributions

Conceptualization, Y.L.; methodology, Y.L. and Y.C.; software, Y.G.; validation, Y.C., Y.G., and Z.W.; formal analysis, X.R.; investigation, N.P.; data curation, Z.W. and T.C.; writing—original draft preparation, Y.L. and Y.C.; writing—review and editing, Y.L.; supervision, L.L.; funding acquisition, Y.L. All authors have read and agreed to the published version of the manuscript.

Funding

This research was financially funded by the National Natural Science Foundation of China with the grant reference numbers of 21808022, the Natural Science Foundation Project of Chongqing, the Chongqing Science and Technology Commission (CN) (CSTB2022NSCQ-MSX0544), the foundation of Chongqing University of Science and Technology (ckrc2021070), and also supported by Postgraduate Research and Innovation Project of Chongqing University of Science and Technology (YKJCX2220503).

Institutional Review Board Statement

Not applicable.

Informed Consent Statement

Not applicable.

Data Availability Statement

Not applicable.

Acknowledgments

The authors appreciate the helpful discussion with Ruimeng Gu at the Tianjin Institute of Industrial Biotechnology, Chinese Academy of Sciences.

Conflicts of Interest

The authors declare no conflict of interest.

References

  1. Phillips, S.D.; Jones, S.B.; Meyer, P.A.; Snowden-Swan, L.J. Techno-economic analysis of cellulosic ethanol conversion to fuel and chemicals. Biofuels Bioprod. Biorefining 2022, 16, 640–652. [Google Scholar] [CrossRef]
  2. Tse, T.J.; Wiens, D.J.; Reaney, M.J.T. Production of bioethanol—A review of factors affecting ethanol yield. Fermentation 2021, 7, 268. [Google Scholar] [CrossRef]
  3. Sperandio, G.B.; Filho, E. An overview of Trichoderma reesei co-cultures for the production of lignocellulolytic enzymes. Appl. Microbiol. Biotechnol. 2021, 105, 3019–3025. [Google Scholar] [CrossRef] [PubMed]
  4. Chen, Y.; Peng, N.; Gao, Y.; Li, Q.; Wang, Z.; Yao, B.; Li, Y. Two-stage pretreatment of jerusalem artichoke stalks with wastewater recycling and lignin recovery for the biorefinery of lignocellulosic biomass. Processes 2023, 11, 127. [Google Scholar] [CrossRef]
  5. Fang, H.; Li, C.; Zhao, J.; Zhao, C. Biotechnological advances and trends in engineering Trichoderma reesei towards cellulase hyperproducer. Biotechnol. Bioprocess Eng. 2021, 26, 517–528. [Google Scholar] [CrossRef]
  6. Yao, C.; Sun, N.; Gao, W.; Sun, Y.; Zhang, J.; Liu, H.; Zhong, Y. Overexpression of a Novel Vacuolar Serine Protease-Encoding Gene (spt1) to Enhance Cellulase Production in Trichoderma reesei. Fermentation 2023, 9, 191. [Google Scholar] [CrossRef]
  7. Knapp, J.S.; Legg, M. The effect of different cellulosic growth substrates and pH on the production of cellulolytic enzymes by Trichoderma reesei. J. Appl. Microbiol. 2010, 61, 319–329. [Google Scholar] [CrossRef]
  8. Chen, Y.; Wu, C.; Shen, Y.; Ma, Y.; Wei, D.; Wang, W. N,N-dimethylformamide induces cellulase production in the filamentous fungus Trichoderma reesei. Biotechnol. Biofuels 2019, 12, 36. [Google Scholar] [CrossRef] [Green Version]
  9. Carle-Urioste, J.C.; Escobar-Vera, J.; El-Gogary, S.; Henrique-Silva, F.; Torigoi, E.; Crivellaro, O.; Herrera-Estrella, A.; El-Dorry, H. Cellulase induction in Trichoderma reesei by cellulose requires its own basal expression. J. Biol. Chem. 1997, 272, 10169–10174. [Google Scholar] [CrossRef] [Green Version]
  10. Gao, L.; Xia, C.; Xu, J.; Li, Z.; Yu, L.; Liu, G.; Song, X.; Qu, Y. Constitutive expression of chimeric transcription factors enables cellulase synthesis under non-Inducing conditions in Penicillium oxalicum. Biotechnol. J. 2017, 12, 1700297. [Google Scholar] [CrossRef]
  11. Yu, L.; Chao, Y.; Wensel, P.C.; Chen, S. Hydrodynamic and kinetic study of cellulase production by Trichoderma reesei with pellet morphology. Biotechnol. Bioeng. 2012, 109, 1755–1768. [Google Scholar] [CrossRef] [PubMed]
  12. Adsul, M.G.; Dixit, P.; Saini, J.K.; Gupta, R.P.; Ramakumar, S.S.V.; Mathur, A.S. Morphologically favorable mutant of Trichoderma reesei for low viscosity cellulase production. Biotechnol. Bioeng. 2022, 119, 2167–2181. [Google Scholar] [CrossRef] [PubMed]
  13. Ivanova, C.; BååTH, J.A.; Seiboth, B.; Kubicek, C.P. Systems analysis of lactose metabolism in Trichoderma reesei identifies a lactose permease that is essential for cellulase induction. PLoS ONE 2013, 8, e62631. [Google Scholar] [CrossRef] [PubMed] [Green Version]
  14. Kalathinathan, P.; Sain, A.; Pulicherla, K.; Muthukaliannan, G.K. A review on the various sources of β-galactosidase and its lactose hydrolysis property. Curr. Microbiol. 2023, 80, 122. [Google Scholar] [CrossRef]
  15. Zhang, P.; Li, Q.; Chen, Y.; Peng, N.; Liu, W.; Wang, X.; Li, Y. Induction of cellulase production in Trichoderma reesei by a glucose-sophorose mixture as an inducer prepared using stevioside. RSC Adv. 2022, 12, 17392–17400. [Google Scholar] [CrossRef]
  16. Mandels, M.; Parrish, F.W.; Reese, E.T. Sophprpse as an inducer of cellulase in Trichoderma viride. J. Bacteriol. 1962, 83, 400–408. [Google Scholar] [CrossRef]
  17. Li, Y.; Liu, C.; Bai, F.; Zhao, X. Overproduction of cellulase by Trichoderma reesei RUT C30 through batch-feeding of synthesized low-cost sugar mixture. Bioresour. Technol. 2016, 216, 503–510. [Google Scholar] [CrossRef]
  18. Li, Y.; Zhang, X.; Zhang, F.; Peng, L.-C.; Zhang, D.-B.; Kondo, A.; Bai, F.-W.; Zhao, X.-Q. Optimization of cellulolytic enzyme components through engineering Trichoderma reesei and on-site fermentation using the soluble inducer for cellulosic ethanol production from corn stover. Biotechnol. Biofuels 2018, 11, 49. [Google Scholar] [CrossRef] [Green Version]
  19. Li, J.; Chen, Y.; Gao, Y.; Mo, Y.; Long, T.; Yao, B.; Li, Y. Engineering Trichoderma reesei for the hyperproduction of cellulose induced protein 1 (Cip1) on a sophorose-containing inducer to efficiently saccharify alkali-pretreated corn stover. Prep. Biochem. Biotechnol. 2022, 23, 880–890. [Google Scholar] [CrossRef]
  20. Li, Y.; Zhang, P.; Zhu, D.; Yao, B.; Hasunuma, T.; Kondo, A.; Zhao, X. Efficient preparation of soluble inducer for cellulase production and saccharification of corn stover using in-house generated crude enzymes. Biochem. Eng. J. 2022, 178, 108296. [Google Scholar] [CrossRef]
  21. Xia, Y.; Yang, L.; Xia, L. High-level production of a fungal β-glucosidase with application potentials in the cost-effective production of Trichoderma reesei cellulase. Process Biochem. 2018, 70, 55–60. [Google Scholar] [CrossRef]
  22. Chen, Y.; Wu, C.; Fan, X.; Zhao, X.; Zhao, X.; Shen, T.; Wei, D.; Wang, W. Engineering of Trichoderma reesei for enhanced degradation of lignocellulosic biomass by truncation of the cellulase activator ACE3. Biotechnol. Biofuels 2020, 13, 62. [Google Scholar] [CrossRef] [PubMed]
  23. Daranagama, N.D.; Suzuki, Y.; Shida, Y.; Ogasawara, W. Involvement of xyr1 and are1 for Trichodermapepsin gene expression in response to cellulose and galactose in Trichoderma reesei. Curr. Microbiol. 2020, 77, 1506–1517. [Google Scholar] [CrossRef] [PubMed]
  24. Portnoy, T.; Margeot, A.; Seidl-Seiboth, V.; Le, C.S.; Ben, C.F.; Linke, R.; Seiboth, B.; Kubicek, C.P. Differential regulation of the cellulase transcription factors Xyr1, Ace2, and Ace1 in Trichoderma reesei strains producing high and low levels of cellulase. Eukaryot. Cell 2011, 10, 262–271. [Google Scholar] [CrossRef] [Green Version]
  25. Ivanova, C.; Ramoni, J.; Aouam, T.; Frischmann, A.; Seiboth, B.; Baker, S.E.; Le, C.S.; Lemoine, S.; Margeot, A.; Bidard, F. Genome sequencing and transcriptome analysis of Trichoderma reesei QM9978 strain reveals a distal chromosome translocation to be responsible for loss of vib1 expression and loss of cellulase induction. Biotechnol. Biofuels 2017, 10, 209. [Google Scholar] [CrossRef] [PubMed] [Green Version]
  26. Sun, X.; Zhang, X.; Huang, H.; Wang, Y.; Tu, T.; Bai, Y.; Wang, Y.; Zhang, J.; Luo, H.; Yao, B.; et al. Engineering the cbh1 promoter of Trichoderma reesei for enhanced protein production by replacing the binding sites of a transcription repressor ace1 to those of the activators. J. Agric. Food Chem. 2020, 68, 1337–1346. [Google Scholar] [CrossRef]
  27. Antoniêto, A.C.; de Paula, R.G.; Castro, L.S.; Silva-Rocha, R.; Persinoti, G.F.; Silva, R.N. Trichoderma reesei CRE1-mediated carbon catabolite repression in re-sponse to sophorose through RNA sequencing analysis. Curr. Genom. 2016, 17, 119–131. [Google Scholar] [CrossRef] [Green Version]
  28. Chen, Y.; Wang, W.; Liu, P.; Lin, A.; Fan, X.; Wu, C.; Li, N.; Wei, L.; Wei, D. The novel repressor Rce2 competes with Ace3 to regulate cellulase gene expression in the filamentous fungus Trichoderma reesei. Mol. Microbiol. 2021, 116, 1298–1314. [Google Scholar] [CrossRef]
  29. Meng, Q.; Zhang, F.; Liu, C.; Zhao, X.; Bai, F. Identification of a novel repressor encoded by the putative gene ctf1 for cellulase biosynthesis in Trichoderma reesei through artificial zinc finger engineering. Biotechnol. Bioeng. 2020, 117, 1747–1760. [Google Scholar] [CrossRef] [Green Version]
  30. Cao, Y.; Zheng, F.; Wang, L.; Zhao, G.; Chen, G.; Zhang, W.; Liu, W. Rce1, a novel transcriptional repressor, regulates cellulase gene expression by antagonizing the transactivator Xyr1 in Trichoderma reesei. Mol. Microbiol. 2017, 105, 65–83. [Google Scholar] [CrossRef] [Green Version]
  31. Li, Y.; Yu, J.; Zhang, P.; Long, T.; Mo, Y.; Li, J.; Li, Q. Comparative transcriptome analysis of Trichoderma reesei reveals different gene regulatory networks induced by synthetic mixtures of glucose and β-disaccharide. Bioresour. Bioprocess. 2021, 8, 57. [Google Scholar] [CrossRef]
  32. Dos Santos Castro, L.; de Paula, R.G.; Antoniêto, A.C.; Persinoti, G.F.; Silva-Rocha, R.; Silva, R.N. Understanding the Role of the Master Regulator XYR1 in Trichoderma reesei by Global Transcriptional Analysis. Front. Microbiol. 2016, 7, 175. [Google Scholar] [CrossRef] [PubMed] [Green Version]
  33. Dos Santos Castro, L.; Pedersoli, W.R.; Antoniêto, A.C.C.; Steindorff, A.S.; Silva-Rocha, R.; Martinez-Rossi, N.M.; Rossi, A.; Brown, N.A.; Goldman, G.H.; Faça, V.M.; et al. Comparative metabolism of cellulose, sophorose and glucose in Trichoderma reesei using high-throughput genomic and proteomic analyses. Biotechnol. Biofuels 2014, 7, 41. [Google Scholar] [CrossRef] [PubMed] [Green Version]
  34. Li, Y.; Zhang, X.; Xiong, L.; Mehmood, M.A.; Zhao, X.; Bai, F. On-Site cellulase production and efficient saccharification of corn stover employing cbh2 overexpressing Trichoderma reesei with novel induction system. Bioresour. Technol. 2017, 238, 643–649. [Google Scholar] [CrossRef] [PubMed]
  35. Peláez, R.D.R.; Wischral, D.; Cunha, J.R.B.; Mendes, T.D.; Pacheco, T.F.; Siqueira, F.G.D.; Almeida, J.R.M.D. Production of enzymatic extract with high cellulolytic and oxidative activities by co-culture of Trichoderma reesei and Panus lecomtei. Fermentation 2022, 8, 522. [Google Scholar] [CrossRef]
  36. Liu, R.; Chen, L.; Jiang, Y.; Zhou, Z.; Zou, G. Efficient genome editing in filamentous fungus Trichoderma reesei using the CRISPR/Cas9 system. Cell Discov. 2015, 1, 15007. [Google Scholar] [CrossRef] [Green Version]
  37. Zou, G.; Xiao, M.; Chai, S.; Zhu, Z.; Wang, Y.; Zhou, Z. Efficient genome editing in filamentous fungi via an improved CRISPR-Cas9 ribonucleoprotein method facilitated by chemical reagents. Microb. Biotechnol. 2021, 14, 2343–2355. [Google Scholar] [CrossRef]
  38. Zou, G.; Zhou, Z. CRISPR/Cas9-Mediated Genome editing of Trichoderma reesei. Methods Mol. Biol. 2021, 2234, 87–98. [Google Scholar] [CrossRef]
  39. Chai, S.; Zhu, Z.; Tian, E.; Xiao, M.; Wang, Y.; Zou, G.; Zhou, Z. Building a versatile protein production platform using engineered Trichoderma reesei. ACS Synth. Biol. 2022, 11, 486–496. [Google Scholar] [CrossRef]
  40. Dai, P.; Liang, X.; Zhang, R.; Sun, G. Construction of Trichothecium roseum GFP tagged strains based on PEG-mediated protoplast transformation. Mycosystema 2019, 38, 90–97. [Google Scholar] [CrossRef]
  41. McIntosh, S.; Vancov, T. Enhanced enzyme saccharification of sorghum bicolor straw using dilute alkali pretreatment. Bioresour. Technol. 2010, 101, 6718–6727. [Google Scholar] [CrossRef]
  42. Zhang, F.; Zhao, X.; Bai, F. Improvement of cellulase production in Trichoderma reesei Rut-C30 by overexpression of a novel regulatory gene Trvib-1. Bioresour. Technol. 2018, 247, 676–683. [Google Scholar] [CrossRef] [PubMed]
  43. Ghose, T.K. Measurement of cellulase activities. Pure Appl. Chem. 1987, 59, 257–268. [Google Scholar] [CrossRef]
  44. Jalak, J.; Väljamäe, P. Mechanism of initial rapid rate retardation in cellobiohydrolase catalyzed cellulose hydrolysis. Biotechnol. Bioeng. 2010, 106, 871–883. [Google Scholar] [CrossRef] [PubMed]
  45. Bischof, R.; Fourtis, L.; Limbeck, A.; Gamauf, C.; Seiboth, B.; Kubicek, C.P. Comparative analysis of the Trichoderma reesei transcriptome during growth on the cellulase inducing substrates wheat straw and lactose. Biotechnol. Biofuels. 2013, 6, 127. [Google Scholar] [CrossRef] [PubMed] [Green Version]
  46. Fang, H.; Xia, L. High activity cellulase production by recombinant Trichoderma reesei ZU-02 with the enhanced cellobiohydrolase production. Bioresour. Technol. 2013, 144, 693–697. [Google Scholar] [CrossRef] [PubMed]
  47. Ren, M.; Wang, Y.; Liu, G.; Zuo, B.; Zhang, Y.; Wang, Y.; Liu, W.; Liu, X.; Zhong, Y. The effects of deletion of cellobiohydrolase genes on carbon source-dependent growth and enzymatic lignocellulose hydrolysis in Trichoderma reesei. J. Microbiol. 2020, 58, 687–695. [Google Scholar] [CrossRef]
  48. Xiong, L.; Kameshwar, A.K.; Chen, X.; Guo, Z.; Mao, C.; Chen, S.; Qin, W. The ACEII recombinant Trichoderma reesei QM9414 strains with enhanced xylanase production and its applications in production of xylitol from tree barks. Microb. Cell Factories 2016, 15, 215. [Google Scholar] [CrossRef] [Green Version]
  49. Liu, G.; Qu, Y. Integrated engineering of enzymes and microorganisms for improving the efficiency of industrial lignocellulose deconstruction. Eng. Microbiol. 2021, 1, 100005. [Google Scholar] [CrossRef]
  50. Zheng, F.; Yang, R.; Cao, Y.; Zhang, W.; Lv, X.; Meng, X.; Zhong, Y.; Chen, G.; Zhou, Q.; Liu, W. Engineering Trichoderma reesei for hyperproduction of cellulases on glucose to efficiently saccharify pretreated corncobs. J. Agric. Food Chem. 2020, 68, 12671–12682. [Google Scholar] [CrossRef]
  51. Fonseca, L.M.; Parreiras, L.S.; Murakami, M.T. Rational engineering of the Trichoderma reesei RUT-C30 strain into an industrially relevant platform for cellulase production. Biotechnol. Biofuels 2020, 13, 93. [Google Scholar] [CrossRef] [PubMed]
  52. Wang, C.; Lu, X.; Gao, J.; Li, X. Xylo-oligosaccharides inhibit enzymatic hydrolysis by influencing enzymatic activity of cellulase from Penicillium oxalicum. Energy Fuels 2018, 32, 9427–9437. [Google Scholar] [CrossRef]
  53. Long, T.; Zhang, P.; Yu, J.; Gao, Y.; Ran, X.; Li, Y. Regulation of β-Disaccharide accumulation by β-Glucosidase inhibitors to enhance cellulase production in Trichoderma reesei. Fermentation 2022, 8, 232. [Google Scholar] [CrossRef]
  54. She, L.; Su, Y.; Sun, Y.; Wang, G.; Chen, H.; Yu, X.; Zhang, S.; Chen, G. Establishment of a highly efficient and low cost mixed cellulase system for bioconversion of corn stover by Trichoderma reesei and Aspergillus niger. Biocatal. Agric. Biotechnol. 2021, 32, 101849. [Google Scholar] [CrossRef]
  55. Yuan, Y.; Jiang, B.; Chen, H.; Wu, W.; Wu, S.; Jin, Y.; Xiao, H. Recent advances in understanding the effects of lignin structural characteristics on enzymatic hydrolysis. Biotechnol. Biofuels 2021, 14, 205. [Google Scholar] [CrossRef] [PubMed]
Figure 1. Construction of the expression vector pPTPdc1−cas9 and verification diagram of the transformant. (A) The pdc1 promoter and terminator were used to express the cas9 gene in the expression vector. (B) Verification of gene expression was determined in the transformant using qPCR (Real −time quantitative PCR), and the integration of the T. reesei OEcas9−1 transformant gene was verified by PCR (C) and sequencing (D).
Fermentation 09 00746 g001
Figure 2. The disruption of Trura5 in T. reesei Rut C30 via direct transformation of gRNA is presented. In vitro transcription was conducted to obtain gRNA for knockout of the Trura5 gene (A). The mutants and controls were grown on potato dextrose agar plates containing 5−FOA and MM plates without uridine (B). A sequencing map of the Trura5 gene of the T. reesei ΔTrura5−1 transformant was obtained (The red is the DNA sequence of ΔTrura5−1 deletion, and the blue is the mutant base of ΔTrura5−2, ΔTrura5−3, ΔTrura5−4.) (C). A schematic diagram that illustrates the Trura5 gene mutation is presented (D).
Fermentation 09 00746 g002
Figure 3. Disruption of Trctf1 in T. reesei ΔTrura5−1 through direct transformation of gRNA and a DNA that contains the Poura5 gene expression cassette selection marker. The mutants and controls were grown on potato dextrose agar plates containing 5−FOA (A) and MM plates without uridine (B). PCR analysis was conducted to verify the T. reesei ΔTrctf1−1 transformant gene (C). The sequencing map of the Trctf1 gene of the T. reesei ΔTrctf1−1 transformant was obtained (D). A schematic diagram illustrating the inserted DNA fragments in the edited Trctf1 locus is also presented (E).
Fermentation 09 00746 g003
Figure 4. The time-course of the batch culture for T. reesei ΔTrctf1-1 and wild-type strains is represented. Lactose (10 g/L) (A) or MGD (10 g/L) (B) was used as the inducer and carbon source, respectively. The data represent the means of triplicates, which also includes standard deviations (SDs). Statistical significance was set at * p < 0.05, and p > 0.05 is denoted as nonsignificant (ns).
Fermentation 09 00746 g004
Figure 5. Mycelial biomass of the T. reesei Rut C30 and ΔTrctf1−1 at the peak time of cellulase production. Lactose (10 g/L) (A) MGD (10 g/L) (B). The data represent the means of triplicates, which also includes standard deviations (SDs). Statistical significance was set at p > 0.05 is denoted as nonsignificant (ns).
Fermentation 09 00746 g005
Figure 6. The enzyme activities of cellobiohydrolase (A), endoglucanase (B), and β−glucosidase (C), were determined for T. reesei ΔTrctf1−1 and the control strain using 10 g/L lactose as the inducer at 36 and 48 h. The enzyme activities of cellobiohydrolase (D), endoglucanase (E), and β−glucosidase (F) were similarly evaluated after using 10 g/L MGD as the inducer at 36 and 48 h. The data represent the means of triplicates, which also includes standard deviations (SDs). The statistical significance level was set at * p < 0.05, and p > 0.05 denotes nonsignificant (ns).
Fermentation 09 00746 g006
Figure 7. Transcription of genes encoding cellulase (cbh1, cbh2, eg2, and bgl1) and transcriptional factors (xyr1). The value is the mean of triplicate with standard deviation, which was calibrated by the 2−ΔCt method. The data represent the means of triplicates, which also includes standard deviations (SDs). Statistical significance was set at * p < 0.05, and p > 0.05 is denoted as nonsignificant (ns).
Fermentation 09 00746 g007
Figure 8. T. reesei ΔTrctf1−1 and the control strains were cultured with lactose (A) or MGD (B) as an inducer, and their extracellular protein levels were analyzed at 36 and 48 h. The data represent the means of triplicates, which also includes standard deviations (SDs). Statistical significance was set at * p < 0.05, and p > 0.05 is denoted as nonsignificant (ns).
Fermentation 09 00746 g008
Figure 9. The time course of enzymatic hydrolysis for glucose concentration was evaluated using cellulase produced by T. reesei ΔTrctf1−1 and the control strain. Cellulase was induced using MGD and lactose as inducers. The data represent the means of triplicates, which also includes standard deviations (SDs). Statistical significance was set at p > 0.05 is denoted as nonsignificant (ns).
Fermentation 09 00746 g009
Disclaimer/Publisher’s Note: The statements, opinions and data contained in all publications are solely those of the individual author(s) and contributor(s) and not of MDPI and/or the editor(s). MDPI and/or the editor(s) disclaim responsibility for any injury to people or property resulting from any ideas, methods, instructions or products referred to in the content.

