Abstract
Understanding how Aspergillus oryzae responds to light is critical for developing efficient light regulation strategies in the brewing and waste treatment industries. Although continuous light is known to restrict A. oryzae, little is known about A. oryzae’s sensitivity to light with photoperiod. In this study, we used pulse wave modulation (PWM) to generate nine pulsed blue light (PBL) treatments with varying peak light intensities and frequencies. The effect of PBL on A. oryzae was then compared to that of continuous blue light (CBL). Our findings showed that A. oryzae GDMCC 3.31 mycelium developed faster and produced more conidia under PBL with specific peak intensities and frequencies than under CBL treatment when the light dose and average light intensity were held constant. The colony diameter and conidia count under the two PBL treatments (PL-20_40%_1 Hz and PL-400_20%_10 kHz) were 1.13 and 1.22 times greater than under the CBL treatments, respectively. This different response may be mainly attributed to A. oryzae’s adaptation to the light–dark cycles in nature. Furthermore, an interactive effect was found between peak light intensity and frequency. This work includes pulsed wave modulation as a new factor that influences the A. oryzae photoresponse and recommends it in the development of light regulation methods for fermentation.
1. Introduction
A strain of Aspergillus oryzae that is safe to use and widely used in the brewing [1,2], enzyme [3,4], and waste treatment [5,6] industries is photoresponsive to different light wavelengths and intensities [7,8,9,10]. Our earlier investigation demonstrated that A. oryzae GDMCC 3.31 is more sensitive to CBL (475 nm) than to red light (630 nm) [11]. CBL, whose intensity is higher than the threshold, significantly inhibited A. oryzae GDMCC 3.31. The threshold of blue light intensity for mycelium development and conidia generation were respectively 60 and 40 μmol·m−2·s−1 [11]. Similar light responses have been reported in other A. oryzae strains [12]. Red light slowed the mycelial development of A. oryzae RIB40 (a Japanese industrial strain). Meanwhile, CBL also resulted in significant germination failure in A. oryzae RIB40 [13]. In addition to continuous light (CL), some investigations revealed that A. oryzae could be regulated by light with a photoperiod. A circular colony of A. oryzae RIB40 was established under a pulsed light (PL) treatment with a frequency of 1 min/day and an intensity of 94.2 μmol·m−2·s−1 [13]. Even when the photoperiod was increased to 12 h, A. oryzae RIB40′s mycelium developed in a ring colony under white light [14]. However, under CL treatment, A. oryzae RIB40 grew without a ring, regardless of light wavelength. These qualitative phenotypic findings suggested that A. oryzae treats light with a light–dark cycle differently from CL. Despite this, quantitative research in this field is limited, and the effect of pulsed light on A. oryzae remains unclear.
Until now, it has been reported that several fungi are responsive to pulsed light [15,16,17,18,19]. Entrainment in Neurospora crassa’s circadian rhythm was stimulated by PL [20,21,22,23]. The RNA expression level of the negative circadian regulator VIVID was undetectable in the dark but increased in response to light pulses. When the mycelia were exposed to light at an intensity of 5 μmol·m−2·s−1, RNA levels immediately increased, peaked after 20 min, and then progressively decreased to a lower steady-state level [24]. Monilinia spp. also has a light response to PL [25,26]. Monilinia laxa infected nectarines and produced the highest pathogen sporulation under white light (58 W, 165.55 W·m−2 or 36 W, 123.65 W·m−2) with a photoperiod of 12 h [27]. Despite the fact that the light intensity increased to 130 μmol·m−2·s−1, the trend of change in RNA levels was identical and resulted in a greater steady-state level. The steady-state level depended on the light intensity. In the realm of circadian rhythm, the photoperiod is generally adjusted from 4 to 20 h and, when combined with dark periods, is a total of 24 h to replicate the change of day and night [28,29,30]. Colletotrichum acutatum responds to both continuous and pulsed light [16,31,32]. Its recovery rate was lowest following a PBL treatment with a frequency of 32 Hz and an intensity of 20 μmol·m−2·s−1 [16]. The development and secondary metabolism of Fusarium fujikuroi were regulated by continuous and pulsed light [33,34,35]. Pulsed white light with a frequency of 1 Hz and an illuminance of 25,000 lux had no effect on the development of F. fujikuroi, but the fumonisin yield under PL was half that reported during dark incubation [36]. The stimulus on the linear growth of Ganoderma lucidum under PL with a frequency of 500 Hz was more pronounced than under CL treatment with an equivalent light dose [37]. Many fungi’s activities are affected by PL, including circadian rhythm, growth, and secondary metabolic activities [38,39,40,41,42]. The fungi mentioned above respond to both continuous and pulsed light. Given that A. oryzae responds to CL and the phenomenon generated by PL, A. oryzae may possibly respond to PL, which has aroused our curiosity.
Due to the maturity of semiconductor technology, pulsed light can easily be made by applying pulse wave modulation (PWM) technology [43,44,45] to blue LED (light-emitting diode) light sources. Furthermore, the frequency of PL fell within the range of 1000 to 0.001 Hz, which is often used in the study of photobiomodulation and the light response of microorganisms [46,47,48,49].
In order to further explore the response of A. oryzae to PL and promote the development of light regulation methods in A. oryzae, this study generated various types of PBL by PWM technology and investigated the effect of PBL on the mycelium growth and asexual reproduction in A. oryzae GDMCC 3.31. The CBL treatment was set as the control.
2. Materials and Methods
2.1. Fungal Species
A. oryzae GDMCC 3.31 was bought from the China Guangdong Microbial Culture Collection Center (Guangzhou, China). The strain had an original code number of 3.042, given by the Shanghai Brewing Research Institute (Shanghai, China). Samples were incubated on potato dextrose agar (PDA; CM123, Beijing Land Bridge Company, Beijing, China) slant, at 28 °C, for 4 days. The third generation was obtained after two subcultures. The spores were suspended in sterile water containing 0.002% (v/v) Tween-80 and 0.5% (w/v) NaCl, and then stored at 4 °C.
2.2. Culture Conditions
The spore suspension mentioned above was diluted to a concentration of 1 × 10⁷ spores/mL for use as a conidial inoculum. Ten microliters of the inoculum solution was inoculated into each PDA plate, and the plates were cultured for 72 h, at 30 °C, in light incubators (Spectracell-MU250L, LightEngin Technology, Shanghai, China). During the incubation, the strains were irradiated by PL or CL.
2.3. Light Conditions and Apparatus
PBL and CBL were generated by setting the light incubators. Blue LED (XP-E series, CreeLED, Durham, NC, USA) was chosen as the light source in this study. In detail, the central light wavelength and full width at half maximum of the blue LED were 475 nm and 25 nm, respectively.
To investigate the light response of A. oryzae GDMCC 3.31 to pulsed light, we first generated nine PBL treatments with various peak light intensities and frequencies and compared them to one CBL treatment. First, we utilized a photosynthetic active radiation detector (PQS1, BLH Technology Company, Newton, NJ, USA) to measure the light intensity at the geometric center of the culture dish. Then, we fine-tuned the medium location and the distance between samples and light sources to achieve a light intensity of 80 μmol·m−2·s−1. The PWM module’s parameters were then adjusted so that the blue LED emitted PBL. The average light intensity was then measured using the photosynthetic active radiation detector and a spectral irradiance colorimeter (SPIC-300, Everfine Photo-E-Info Co., Ltd., Hangzhou, China) to guarantee that all treatments had the same average light intensity.
Although the peak light intensity of PBL was higher than that of CBL (Figure 1), the average light intensity and light dose were the same in both treatments. In this study, we used photosynthetic photon flux density (PPFD) to describe the light intensity with the unit of μmol·m−2·s−1 rather than the standard unit of W·cm−2 [50].
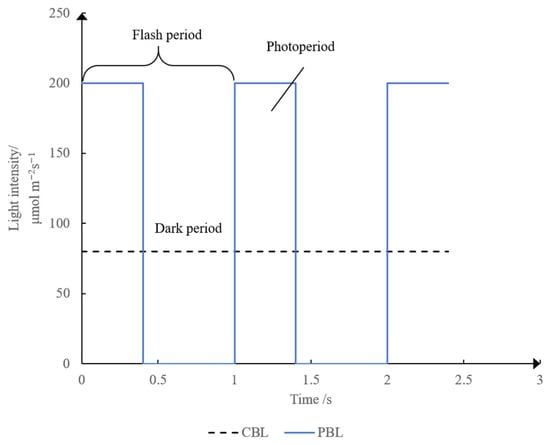
Figure 1.
Difference between PBL and CBL. The instantaneous light intensity of PBL was much higher than that of CBL treatment. The average intensity of CBL treatment was 80 μmol·m−2·s−1. The frequency, peak intensity, and duty ratio of PBL treatment were 1 Hz, 200 μmol·m−2·s−1, and 40%, respectively.
Light intensities in all treatments are recorded in Table 1. A total of nine PBL treatments were generated. Peak light intensities and frequencies of PBL ranged from 100 to 400 μmol·m−2·s−1 and from 1 to 10,000 Hz, respectively, and the light intensity of CBL was 80 μmol·m−2·s−1. CBL was set as the control. All light treatments maintained at the same average light intensity of 80 μmol·m−2·s−1 (19.8 ± 0.17 W·m−2 in standard units) (SPIC-300, Everfine Photo-E-Info Co., Ltd., Hangzhou, China). During the culture, A. oryzae GDMCC 3.31 was treated under a specific PBL or CBL for 72 h. Hence, all the light treatments shared the same photon flux of 2.07 × 10⁷ μmol·m−2·s−1.

Table 1.
Parameters of PBL and CBL with an average intensity of 80 μmol·m−2·s−1.
To investigate whether the different photoresponse was related to the threshold of light intensity (60 and 40 μmol·m−2·s−1) established in our previous study [11], we generated five lower-level PBL with various peak light intensities and frequencies, and compared them to one CBL treatment with average light intensity of 20 μmol·m−2·s−1. As recorded in Table 2, the peak light intensities were ranged from 40 to 400 μmol·m−2·s−1, and frequency was maintained at 100 Hz. CBL was set as the control. All light treatments had the same average light intensity of 20 μmol·m−2·s−1 (4.59 ± 0.15 W·m−2 in standard units). This average light intensity was lower than the threshold. During the incubation, A. oryzae GDMCC 3.31 was irradiated by a specific PBL or CBL for 72 h. Hence, all light treatments shared the same photon flux of 5.18 × 10⁶ μmol·m−2·s−1.
Table 2.
Parameters of PBL and CBL with a lower average intensity.
We use abbreviations to denote each PBL treatment throughout the article to reduce the length of the treatment descriptions and improve readability. A PBL treatment with a peak light intensity of 100 μmol·m−2·s−1, a duty ratio of 80%, and a frequency of 1 Hz, for example, is denoted by the abbreviation ‘PL-100_80%_1 Hz’. Other PBL treatments generated in Table 1 and Table 2 are all represented in the same way.
2.4. The Determination of Colony Diameter
The colony diameter was used to evaluate the mycelial development in A. oryzae GDMCC 3.31. We used a Vernier caliper to measure the colony diameter on each plate after light treatment for 72 h. Four random directions were chosen to measure the diameter, the average of which was considered the value of the colony diameter of the sample. The unit of average diameter was mm.
2.5. The Measurement of Conidiation
The number of conidia was used to evaluate the asexual sporulation of A. oryzae GDMCC 3.31. After light treatment, the conidia grown on each plate were washed with 5 mL of sterile water containing Tween-80. The solution was then filtered to obtain spore suspensions (Whatman No. 4, GE Medical Systems Ltd., Buckinghamshire, UK), which were counted using a hemocytometer and a microscope to obtain the number of conidia.
2.6. Statistical Analyses
All light treatments were repeated at least in triplicate, and the samples under each light treatment had three parallels. Results were presented as the mean ± standard deviation. GraphPad Prism (v9.4.1) software was used to perform all statistical analyses. A two-way ANOVA was performed to analyze the interaction effect between peak light intensity and frequency. A one-way ANOVA or Kruskal–Wallis test was conducted to analyze the differences in colony diameter and conidia count under CBL and PBL treatments.
3. Results
3.1. The Appearance of Mycelium under PL
After culture, only slight changes were observed in the colony morphology of A. oryzae GDMCC 3.31 under PBL and CBL treatments (Figure 2). Mycelia of A. oryzae developed upon all PBL treatments developed normal hyphae and a round colony, followed by conidia formation.
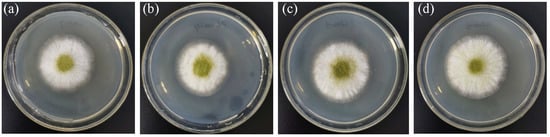
Figure 2.
Colony of A. oryzae under PBL and CBL: (a) mycelium grown under CBL; (b) colony developed upon PBL treatment (PL-100_80%_100 Hz); (c,d) colony developed after PBL treatments (PL-200_40%_100 Hz and PL-400_20%_100 Hz).
3.2. Mycelial Growth Responded to Pulsed Blue Light
This section investigates the effect of PBL with varying peak light intensities and frequencies on the mycelium growth of A. oryzae GDMCC 3.31 compared to CBL treatment. The result of a two-way ANOVA analysis on colony diameter revealed a significant difference (p-value = 0.0164), demonstrating an interaction between peak light intensity and frequency. As a result, the influence of peak light intensity and frequency on mycelium growth was studied separately.
Firstly, variations in peak light intensities of PBL alone were observed to have a significant impact on mycelial development of A. oryzae GDMCC 3.31 when the frequency remained constant. Figure 3a showed that, when the frequency was held constant at 1 Hz and the peak light intensities increased, A. oryzae developed under PBL treatments differently than under the CBL treatment (p-value < 0.0001). The colony diameter peaked at the PBL treatment with a peak light intensity of 200 μmol·m−2·s−1 (abbreviated as PL-200_40%_1 Hz). It was 1.13 times that of the CBL treatment. Figure 3b shows that, when the frequency was maintained at 100 Hz and the peak light intensities increased, only one PBL treatment with a peak light intensity of 400 μmol·m−2·s−1 (abbreviated as PL-400_20%_100 Hz) significantly differed from the CBL treatment (p-value = 0.011). The colony diameter under this PBL was 1.11-fold that of the control. When the frequency increased to a high level of 10 kHz and the peak light intensities increased, all colonies expanded under three kinds of PBL were significantly greater than those under CBL (Figure 3c). The colony diameter reached maximum under the PBL treatment (PL-100_80%_10 kHz) and was 1.12-fold that of the colony under CBL. These findings suggest that the A. oryzae GDMCC 3.31 mycelium was susceptible to pulsed blue light with varying peak light intensities compared to continuous blue light.
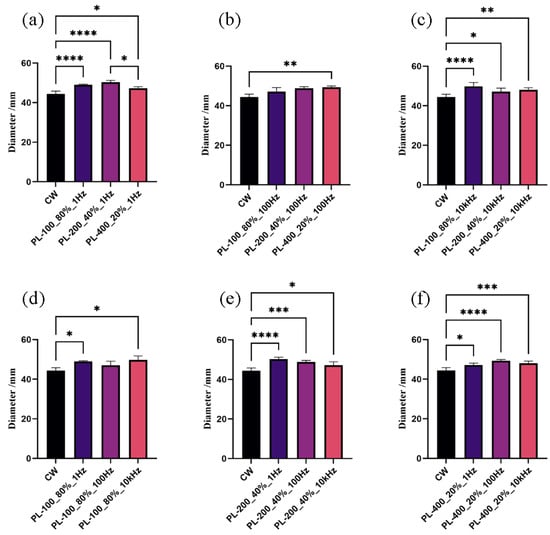
Figure 3.
Colony diameters upon PBL and CBL treatments: (a–c) results of the mycelium growth under PBL with different peak intensities when the frequency was held constant; (d–f) results of the mycelium growth under PBL with different frequencies when the peak intensity was kept unchanged. * p < 0.05, ** p < 0.01, *** p < 0.001, and **** p < 0.0001.
Secondly, compared to the CBL treatment, the mycelium development of A. oryzae GDMCC 3.31 was sensitive to PBL with various frequencies when the peak light intensity held constant. As shown in Figure 3d–f, almost A. oryzae GDMCC 3.31 grew faster under PBL with various frequencies than under CBL, even though the frequencies varied within four orders of magnitude. Aside from the PBL treatment (PL-100_80%_100 Hz), the differences between PBL and CBL treatments were significant (p-value < 0.05). However, no significant difference between PBL treatments was found.
In conclusion, the mycelium growth in A. oryzae GDMCC 3.31 was photoresponsive to various light modulation modes. With the same average light intensity of 80 μmol·m−2·s−1 and the same light dose, A. oryzae grew better under PBL than under CBL. In other words, the influence of light on A. oryzae mycelia development could be adjusted by switching the modulation mode from continuous light to pulsed light.
3.3. Conidia Formation Responded to Pulsed Blue Light
This section investigates the effect of PBL with varying peak light intensities and frequencies on A. oryzae GDMCC 3.31 conidiation as compared to CBL treatment. A two-way ANOVA analysis of conidia count under PBL and CBL revealed that peak light intensity and frequency had a significant interaction (p-value = 0.0278). As a result, the effect of peak light intensity and frequency was analyzed independently.
Firstly, the conidia formation of A. oryzae GDMCC 3.31 was sensitive to PBL with particular peak intensities when the frequency held constant. In detail, when the frequency was fixed at 1 Hz and the peak light intensities increased, no significant difference in the number of conidia was identified between PBL and CBL treatment (Figure 4a). When the frequencies increased to 100 Hz and 10 kHz, the conidia produced in A. oryzae GDMCC 3.31 under three PBL treatments (PL-100_80%_100 Hz, PL-400_20%_100 Hz, and PL-400_20%_10 kHz) were greater than under CBL treatments (Figure 4b,c), with p-values of 0.0334, 0.0294, and 0.0190, respectively. The conidia count on these three PBL treatments were 1.87-, 2.05-, and 2.22-fold higher than the CBL treatment, respectively. Furthermore, the 2.22-fold increase under the PBL treatment (PL-400_20%_10 kHz) was close to the ratio observed in our earlier study comparing the dark treatment to continuous blue light treatment [11]. These results suggest that the development of conidia in A. oryzae GDMCC 3.31 had a photoresponse distinct from CBL in terms of PBL with specific levels of peak light intensities.
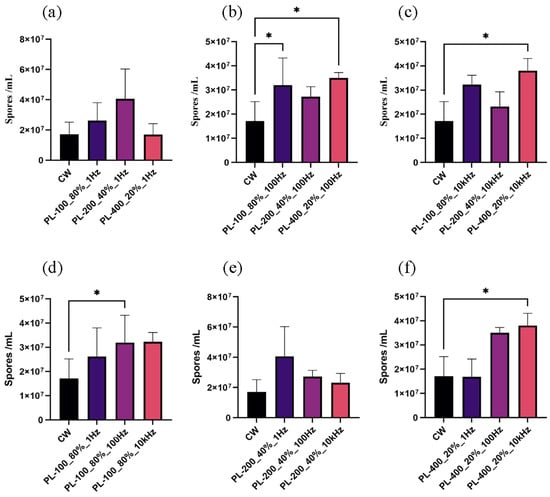
Figure 4.
The conidia count upon PBL and CBL treatments: (a–c) results of the conidia formed under PL with different peak intensities when the frequency was held constant; (d–f) results of the conidia formed under PL with different frequencies when the peak intensity was kept unchanged. * p < 0.05.
Secondly, when the peak light intensity was held constant and the frequencies increased, a similar effect of PBL with various frequencies on the conidiation was observed. When compared to CBL, the conidia produced in A. oryzae GDMCC 3.31 were photosensitive to pulsed blue light at specific frequencies. Only two PBL treatments (PL-100_80%_100 Hz and PL-400_20%_10 kHz) showed significant differences in the conidia count (Figure 4d,f), with p-values of 0.0393 and 0.0396, respectively. These results revealed that the conidial formation in A. oryzae GDMCC 3.31 was photoresponsive to PBL at certain frequencies, as compared to CBL.
In conclusion, the asexual reproduction of A. oryzae GDMCC 3.31 was photosensitive to light modulation mode. Conidia count was higher under specific PBL treatment than under CBL treatment with the same average light intensity of 80 μmol·m−2·s−1 and the same light dose. In other words, the influence of light on the production of A. oryzae conidia could be adjusted by switching from continuous light to pulsed light.
3.4. Threshold Was Applicable to Pulsed Light
The aforesaid findings were explored under PBL with an average light intensity of 80 μmol·m−2·s−1, which satisfied the previously established thresholds of 60 and 40 μmol·m−2·s−1 for mycelium development and conidium generation [11]. Here, we were interested in whether or if a threshold exists for the effect of PBL. PBL had no effect on mycelium development in A. oryzae GDMCC 3.31 when the average light intensity was reduced to 20 μmol·m−2·s−1, as shown in Figure 5. Considering the results in Section 3.2, it is possible that an average light intensity threshold existed in A. oryzae GDMCC 3.31’s photoresponse to PBL in an aspect of mycelial development. Despite an increase in peak light intensity to 400 μmol·m−2 s−1, colony diameters upon the PBL treatments were comparable to those under the CBL treatment.
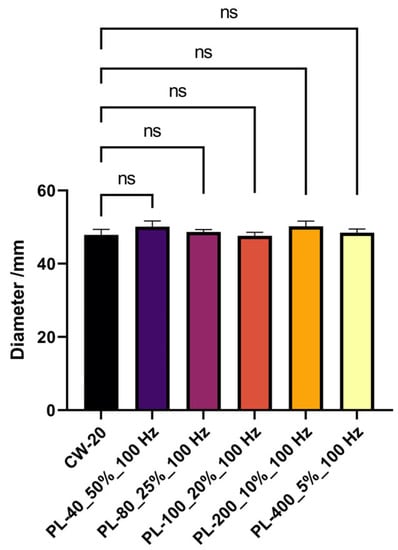
Figure 5.
The mycelium growth under PBL and CBL with an average intensity of 20 μmol·m−2·s−1. The symbol ns in the figure represents no significance.
In terms of conidia production, Figure 6 shows that the conidia count under most PBL treatments was comparable to that under CBL treatment, with the exception of one PBL treatment (PL-80_25%_100 Hz). Conidia produced by A. oryzae GDMCC 3.31 under this PBL treatment were substantially larger than those produced under the CBL treatment (p-value = 0.0131). The number of conidia produced under this treatment was 1.35-fold greater than under the CBL treatment. These results suggest that the effect of PBL on the conidia production in A. oryzae compared to CBL had no relation to the threshold of average light intensity.
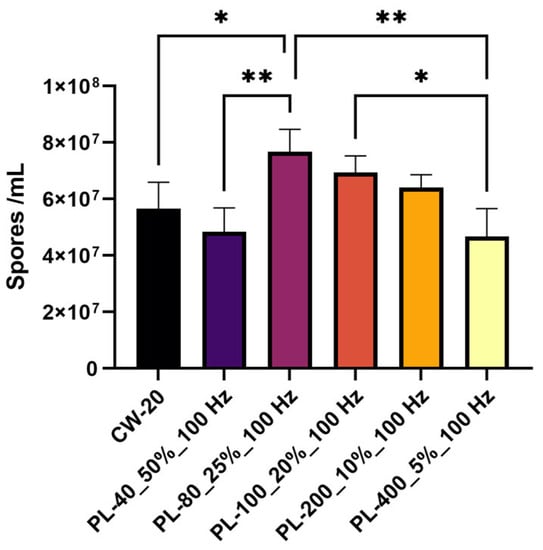
Figure 6.
Conidia number upon PBL treatments with an average intensity of 20 μmol·m−2·s−1. * p < 0.05 and ** p < 0.01.
4. Discussion
This study demonstrated that A. oryzae GDMCC 3.31 exhibits a response to PBL in terms of mycelium development and conidial production that differs from the response to CBL with the same average light intensity and wavelength. The pulsed light made by pulse wave modulation may be a new factor in A. oryzae’s light response. Results demonstrated that A. oryzae GDMCC 3.31 mycelia developed faster and produced more conidia under PBL with specific peak intensities and frequencies than under CBL treatment when the light dose, light wavelength, and average light intensity were held constant (Figure 3 and Figure 4). A. oryzae exhibits active light sensing in nature to generate adaptive responses such as developmental and secondary metabolic regulation. Pulsed light varies from continuous light in that it has alternating photoperiods and dark periods.
Considering that A. oryzae has developed and adapted to natural light–dark cycles, it is more capable of adapting to pulsed light with photoperiods rather than a long-duration and high-intensity light exposure. When exposed to blue light, A. oryzae suffers growth and developmental pressure, while its vitality recovers to some extent during dark periods. Therefore, even with an equivalent light dose and average light intensity, PBL is advantageous for development and asexual reproduction in A. oryzae compared to CBL.
Moreover, our findings suggested that the mycelium growth of A. oryzae GDMCC 3.31 responded to PBL similarly to CBL when the average light intensity decreased to 20 μmol·m−2·s−1 (Figure 5). However, when the average light intensity increased to 80 μmol·m−2·s−1, A. oryzae GDMCC 3.31 responded to PBL differently from the CBL treatment (Figure 3). These results suggested that an average light intensity threshold existed in the A. oryzae GDMCC 3.31‘s photoresponse to PBL with respect to mycelial development. This threshold may be the critical point for A. oryzae to distinguish between PBL and CBL. In the future, we will focus on the light response threshold of A. oryzae growth during the development of light regulation methods.
The PWM utilized in this study enhances the factors of A. oryzae light response and has the potential to develop light regulation methods in A. oryzae. A. oryzae is commonly used in fermenting raw material in the brewing, enzyme, and waste treatment industries. Multiple microorganisms are often involved in fermentation processes rather than a single strain in actual manufacturing [51,52,53]. In the preparation of soy sauce, for example, A. oryzae is combined with Aspergillus niger in solid-state fermentation. Many studies have illustrated that soy sauce made through fermentation with mixed strains has a better taste and higher levels of bioactivity [2,54,55,56]. A. niger responds to light of various light wavelengths [54,57,58]. The amylase activity secreted by A. niger was 1.15 times higher under blue light at an intensity of 40 μmol·m−2·s−1 than in the dark control [58]. Furthermore, blue light stimulated the growth of A. niger and promoted the formation of conidial head. Among various light wavelengths, blue light (455 nm) with an illuminance of 1700 lux best stimulated the growth of A. niger [59]. However, it was found that the conidia produced by A. niger decreased by 40% after a blue light (455 nm) treatment with an illuminance of 200 lux. On the basis of the difference in the light response between A. oryzae and A. niger, using pulsed light in the fermentation process of mixed strains may contribute to achieving more regulatory goals.
For instance, the intensity thresholds of blue light for inhibiting the mycelial growth and conidia formation of A. oryzae are 60 and 40 μmol·m−2·s−1, respectively. In the fermentation process of soy sauce by A. oryzae and A. niger, if we used a PBL treatment (PL-100_20%_100 Hz) to replace the CBL with an average intensity of 20 μmol·m−2·s−1, it promoted the growth of A. niger, inhibited the growth of A. oryzae, and regulated conidial formation of A. oryzae. This allowed A. oryzae to undergo normal subculture and play its role in the whole fermentation process. Pulsed light has the potential to regulate multiple engineered strains, and we recommend conducting further research on the application of PL to promote the development of new light regulation methods for A. oryzae.
5. Conclusions
In this study, the effects of PBL on mycelium development and asexual reproduction in A. oryzae GDMCC 3.31 were compared to those of CBL. All of the results suggested that A. oryzae GDMCC 3.31 responded differently to PBL than to CBL, at the same average light intensity and wavelength. The peak light intensity and frequency of PBL ranged from 100 to 400 μmol·m−2·s−1 and from 10 to 10,000 Hz, respectively. Among all the PBL treatments, the colony diameter and conidia count were maximum under the two PBL treatments (PL-200_40%_1 Hz and PL-400_20%_10 kHz). The colony diameter and conidia under these two PBL treatments were 1.13- and 1.22-fold greater than under the CBL treatment, respectively. We believe that the different response of A. oryzae to PBL and CBL is mainly attributed to its adaptation to the light–dark cycles in nature. A. oryzae adjusts itself during the dark period to better adapt to light stress during the photoperiod. Additionally, peak light intensity and frequency have interactive effects on the regulation of A. oryzae. This study proposes the inclusion of pulse wave modulation as a new factor that influences the A. oryzae photoresponse. Further research is required to advance the development of light regulation methods for A. oryzae on the basis of these findings.
Author Contributions
Conceptualization, S.L. and H.J.; validation, S.H., Q.F. and A.L.; formal analysis, A.L.; investigation, S.L. and H.J.; writing—original draft preparation, S.L.; writing—review and editing, L.T. and Q.F.; project administration, M.L.; funding acquisition, M.L. All authors have read and agreed to the published version of the manuscript.
Funding
This research was funded by JiHua Laboratory Science Program, grant number X180041UZ180.
Institutional Review Board Statement
Not applicable.
Data Availability Statement
Data sharing is not applicable to this article as no new data were created or analyzed in this study.
Conflicts of Interest
The authors declare no conflict of interest.
References
- Fang, B.H.; Sun, J.A.; Dong, P.; Xue, C.H.; Mao, X.Z. Conversion of turbot skin wastes into valuable functional substances with an eco-friendly fermentation technology. J. Clean. Prod. 2017, 156, 367–377. [Google Scholar] [CrossRef]
- Hu, W.K.; Liu, Z.P.; Fu, B.; Zhang, X.L.; Qi, Y.G.; Hu, Y.; Wang, C.; Li, D.S.; Xu, N. Metabolites of the Soy Sauce Koji Making with Aspergillus niger and Aspergillus oryzae. Int. J. Food Sci. Technol. 2022, 57, 301–309. [Google Scholar] [CrossRef]
- Kovilein, A.; Aschmann, V.; Hohmann, S.; Ochsenreither, K. Immobilization of Aspergillus oryzae DSM 1863 for l-Malic Acid Production. Fermentation 2022, 8, 26. [Google Scholar] [CrossRef]
- Suzuki, S.; Ohmori, H.; Hayashida, S.; Nomura, M.; Kobayashi, M.; Hagi, T.; Narita, T.; Tomita, S.; Yamashita, H.; Arakawa, Y.; et al. Lipase and protease activities in Koji cheeses surface-ripened with Aspergillus strains. Food Sci. Technol. Res. 2021, 27, 543–549. [Google Scholar] [CrossRef]
- Mahboubi, A.; Ferreira, J.A.; Taherzadeh, M.J.; Lennartsson, P.R. Production of Fungal Biomass for Feed, Fatty Acids, and Glycerol by Aspergillus oryzae from Fat-Rich Dairy Substrates. Fermentation 2017, 3, 48. [Google Scholar] [CrossRef]
- Costa, S.; Summa, D.; Zappaterra, F.; Blo, R.; Tamburini, E. Aspergillus oryzae Grown on Rice Hulls Used as an Additive for Pretreatment of Starch-Containing Wastewater from the Pulp and Paper Industry. Fermentation 2021, 7, 317. [Google Scholar] [CrossRef]
- Ojima, Y.; Kusuda, A.; Nishioka, M.; Taya, M. Responses of Aspergillus oryzae to Stimuli from Near-UV Light Irradiation in the Presence or Absence of Titanium Dioxide. Biocontrol Sci. 2009, 14, 61–64. [Google Scholar] [CrossRef]
- Suzuki, S.; Kusumoto, K. Transcriptome Analysis of Two Strains of Aspergillus oryzae with Different Responses to Light. Jpn. Agric. Res. Q. JARQ 2020, 54, 13–20. [Google Scholar] [CrossRef]
- Zhao, S.; Niu, C.T.; Suo, J.Y.; Zan, Y.L.; Wei, Y.H.; Zheng, F.Y.; Liu, C.F.; Wang, J.J.; Li, Q. Unraveling the mystery of ‘bask in daytime and dewed at night’ technique in doubanjiang (broad bean paste) fermentation. LWT—Food Sci. Technol. 2021, 149, 111723. [Google Scholar] [CrossRef]
- Zhao, S.; Niu, C.T.; Wang, Y.H.; Li, X.Y.; Zheng, F.Y.; Liu, C.F.; Wang, J.J.; Li, Q. Revealing the contributions of sunlight-expose process and core-microbiota metabolism on improving the flavor profile during Doubanjiang fermentation. Food Biosci. 2023, 53, 102522. [Google Scholar] [CrossRef]
- Lin, S.; Qin, H.; Zhang, X.; Li, W.; Liu, M. Inhibition of Aspergillus oryzae Mycelium Growth and Conidium Production by Irradiation with Light at Different Wavelengths and Intensities. Microbiol. Spectr. 2021, 9, e00213-21. [Google Scholar] [CrossRef] [PubMed]
- Murthy, P.S.; Sano, M.; Hattori, R.; Kusumoto, K.; Suzuki, S. Aspergillus oryzae Strain with Improved Conidiation after Light Stimulation. Jpn. Agric. Res. Q. JARQ 2018, 52, 23–28. [Google Scholar] [CrossRef]
- Hatakeyama, R.; Nakahama, T.; Higuchi, Y.; Kitamoto, K. Light represses conidiation in koji mold Aspergillus oryzae. Biosci. Biotechnol. Biochem. 2007, 71, 1844–1849. [Google Scholar] [CrossRef] [PubMed]
- Murthy, P.S.; Suzuki, S.; Kusumoto, K.I. Effect of Light on the Growth and Acid Protease Production of Aspergillus oryzae. Food Sci. Technol. Res. 2015, 21, 631–635. [Google Scholar] [CrossRef]
- Dong, Y.T.; Ma, H.L.; Zhou, C.S.; Golly, M.K.; Wu, P.; Sun, L.; Yagoub, A.A.; He, R.H.; Ye, X.F. Enhanced Mycelium Production of Phellinus igniarius (Agaricomycetes) Using a He-Ne Laser with Pulsed Light. Int. J. Med. Mushrooms 2021, 23, 59–69. [Google Scholar] [CrossRef]
- Rasiukeviciute, N.; Brazaityte, A.; Valiuskaite, A.; Vastakaite-Kairiene, V. The inhibition of Colletotrichum acutatum by monochromic pulsed and non-pulsed radiation at different time durations. ISHS Acta Hortic. 2021, 1309, 711–717. [Google Scholar] [CrossRef]
- Cheong, K.K.; Strub, C.; Montet, D.; Durand, N.; Alter, P.; Meile, J.C.; Schorr Galindo, S.; Fontana, A. Effect of different light wavelengths on the growth and ochratoxin A production in Aspergillus carbonarius and Aspergillus westerdijkiae. Fungal Biol. 2016, 120, 745–751. [Google Scholar] [CrossRef]
- Pola-Sanchez, E.; Villalobos-Escobedo, J.M.; Carreras-Villasenor, N.; Martinez-Hernandez, P.; Beltran-Hernandez, E.B.; Esquivel-Naranjo, E.U.; Herrera-Estrella, A. A Global Analysis of Photoreceptor-Mediated Transcriptional Changes Reveals the Intricate Relationship Between Central Metabolism and DNA Repair in the Filamentous Fungus Trichoderma atroviride. Front. Microbiol. 2021, 12, 724676. [Google Scholar] [CrossRef]
- Wang, Y.; Zheng, Y.; Zhou, A.Y.; Neng, J.; Wu, D.; Shen, X.L.; Lou, X.Y.; Yang, K. Transcriptomic analysis reveals the inhibition mechanism of pulsed light on fungal growth and ochratoxin A biosynthesis in Aspergillus carbonarius. Food Res. Int. 2023, 165, 112501. [Google Scholar] [CrossRef]
- Burt, P.; Grabe, S.; Madeti, C.; Upadhyay, A.; Merrow, M.; Roenneberg, T.; Herzel, H.; Schmal, C. Principles underlying the complex dynamics of temperature entrainment by a circadian clock. Iscience 2021, 24, 103370. [Google Scholar] [CrossRef]
- Gooch, V.D.; Johnson, A.E.; Bourne, B.J.; Nix, B.T.; Maas, J.A.; Fox, J.A.; Loros, J.J.; Larrondo, L.F.; Dunlap, J.C. A Kinetic Study of the Effects of Light on Circadian Rhythmicity of the frq Promoter of Neurospora crassa. J. Biol. Rhythm. 2014, 29, 38–48. [Google Scholar] [CrossRef] [PubMed]
- Proietto, M.; Bianchi, M.M.; Ballario, P.; Brenna, A. Epigenetic and Posttranslational Modifications in Light Signal Transduction and the Circadian Clock in Neurospora crassa. Int. J. Mol. Sci. 2015, 16, 15347–15383. [Google Scholar] [CrossRef] [PubMed]
- Cockrell, A.L.; Pirlo, R.K.; Babson, D.M.; Cusick, K.D.; Soto, C.M.; Petersen, E.R.; Davis, M.J.; Hong, C.I.; Lee, K.; Fitzgerald, L.A.; et al. Suppressing the Neurospora crassa circadian clock while maintaining light responsiveness in continuous stirred tank reactors. Sci. Rep. 2015, 5, 10691. [Google Scholar] [CrossRef]
- Malzahn, E.; Ciprianidis, S.; Kaldi, K.; Schafmeier, T.; Brunner, M. Photoadaptation in Neurospora by Competitive Interaction of Activating and Inhibitory LOV Domains. Cell 2010, 142, 762–772. [Google Scholar] [CrossRef]
- Rodriguez-Pires, S.; Espeso, E.A.; Rasiukeviciute, N.; Melgarejo, P.; De Cal, A. Light-Photoreceptors and Proteins Related to Monilinia laxa Photoresponses. J. Fungi 2021, 7, 32. [Google Scholar] [CrossRef] [PubMed]
- Verde-Yanez, L.; Vall-llaura, N.; Usall, J.; Teixido, N.; Torres, R. Phenotypic plasticity of Monilinia spp. in response to light wavelengths: From in vitro development to virulence on nectarines. Int. J. Food Microbiol. 2022, 373, 109700. [Google Scholar] [CrossRef] [PubMed]
- Rodriguez-Pires, S.; Garcia-Companys, M.; Espeso, E.A.; Melgarejo, P.; de Cal, A. Influence of light on the Monilinia laxa-stone fruit interaction. Plant Pathol. 2021, 70, 326–335. [Google Scholar] [CrossRef]
- Tan, Y.; Dragovic, Z.; Roenneberg, T.; Merrow, M. Entrainment dissociates transcription and translation of a circadian clock gene in Neurospora. Curr. Biol. 2004, 14, 433–438. [Google Scholar] [CrossRef]
- Remi, J.; Merrow, M.; Roenneberg, T. A Circadian Surface of Entrainment: Varying T, tau, and Photoperiod in Neurospora crassa. J. Biol. Rhythm. 2010, 25, 318–328. [Google Scholar] [CrossRef]
- Diegmann, J.; Stuck, A.; Madeti, C.; Roenneberg, T. Entrainment elicits period aftereffects in Neurospora crassa. Chronobiol. Int. 2010, 27, 1335–1347. [Google Scholar] [CrossRef]
- Yu, S.M.; Ramkumar, G.; Lee, Y.H. Light quality influences the virulence and physiological responses of Colletotrichum acutatum causing anthracnose in pepper plants. J. Appl. Microbiol. 2013, 115, 509–516. [Google Scholar] [CrossRef]
- Costa, T.P.C.; Rodrigues, E.M.; Dias, L.P.; Pupin, B.; Ferreira, P.C.; Rangel, D.E.N. Different wavelengths of visible light influence the conidial production and tolerance to ultra-violet radiation of the plant pathogens Colletotrichum acutatum and Fusarium fujikuroi. Eur. J. Plant Pathol. 2021, 159, 105–115. [Google Scholar] [CrossRef]
- Matic, S.; Spadaro, D.; Prelle, A.; Gullino, M.L.; Garibaldi, A. Light affects fumonisin production in strains of Fusarium fujikuroi, Fusarium proliferatum, and Fusarium verticillioides isolated from rice. Int. J. Food Microbiol. 2013, 166, 515–523. [Google Scholar] [CrossRef]
- Fanelli, F.; Geisen, R.; Schmidt-Heydt, M.; Logrieco, A.F.; Mule, G. Light regulation of mycotoxin biosynthesis: New perspectives for food safety. World Mycotoxin J. 2016, 9, 129–145. [Google Scholar] [CrossRef]
- Pardo-Medina, J.; Limon, M.C.; Avalos, J. Fusarium Photoreceptors. J. Fungi 2023, 9, 319. [Google Scholar] [CrossRef]
- Fanelli, F.; Schmidt-Heydt, M.; Haidukowski, M.; Susca, A.; Geisen, R.; Logrieco, A.; Mule, G. Influence of light on growth, conidiation and fumonisin production by Fusarium uerticillioides. Fungal Biol. 2012, 116, 241–248. [Google Scholar] [CrossRef]
- Poyedinok, N.L.; Mykhailova, O.B.; Shcherba, V.V.; Buchalo, A.S.; Negriyko, A.M. Light Regulation of Growth and Biosynthetic Activity of Ling Zhi or Reishi Medicinal Mushroom, Ganoderma lucidum (W. Curt.: Fr.) P. Karst. (Aphyllophoromycetideae), in Pure Culture. Int. J. Med. Mushrooms 2008, 10, 369–378. [Google Scholar] [CrossRef]
- Rabbani, N.; Bajwa, R.; Javaid, A. Influence of culturing conditions on growth and sporulation of Drechslera hawaiiensis, the foliar blight pathogen of Marsilea minuta L. Afr. J. Biotechnol. 2011, 10, 1863–1872. [Google Scholar]
- Rasiukeviciute, N.; Brazaityte, A.; Vastakaite-Kairiene, V.; Kupcinskiene, A.; Duchovskis, P.; Samuoliene, G.; Valiuskaite, A. The Effect of Monochromatic LED Light Wavelengths and Photoperiods on Botrytis cinerea. J. Fungi 2021, 7, 970. [Google Scholar] [CrossRef]
- Zhao, E.M.; Zhang, Y.F.; Mehl, J.; Park, H.; Lalwani, M.A.; Toettcher, J.E.; Avalos, J.L. Optogenetic regulation of engineered cellular metabolism for microbial chemical production. Nature 2018, 555, 683. [Google Scholar] [CrossRef]
- Huang, H.; Lv, W.B.; Chen, Y.; Zheng, X.F.; Hu, Y.; Wang, R.H.; Huang, M.L.; Tang, H.F. The Role of NADPH Oxidase in the Inhibition of Trichophyton rubrum by 420-nm Intense Pulsed Light. Front. Microbiol. 2018, 8, 2636. [Google Scholar] [CrossRef]
- Bernal, A.R.R.; Contigiani, E.V.; Gonzalez, H.H.L.; Alzamora, S.M.; Gomez, P.L.; Raffellini, S. Botrytis cinerea response to pulsed light: Cultivability, physiological state, ultrastructure and growth ability on strawberry fruit. Int. J. Food Microbiol. 2019, 309, 108311. [Google Scholar] [CrossRef]
- Chen, F.Y.B.; Budgett, D.M.; Sun, Y.H.; Malpas, S.; McCormick, D.; Freestone, P.S. Pulse-Width Modulation of Optogenetic Photo-Stimulation Intensity for Application to Full-Implantable Light Sources. IEEE Trans. Biomed. Circuits Syst. 2017, 11, 28–34. [Google Scholar] [CrossRef]
- Hemmerich, M.; Klein, D.A.; Meyer, J.; Walther, F. Durability of the optical plastic polycarbonate under modulated blue LED irradiation at different duty cycles. Opt. Mater. 2022, 131, 11271310. [Google Scholar] [CrossRef]
- Senol, R.; Kilic, S.; Tasdelen, K. Pulse timing control for LED plant growth unit and effects on carnation. Comput. Electron. Agric. 2016, 123, 125–134. [Google Scholar] [CrossRef]
- Cho, H.; Jeon, H.J.; Park, S.; Park, C.S.; Chung, E. Neurite growth of trigeminal ganglion neurons in vitro with near-infrared light irradiation. J. Photochem. Photobiol. B-Biol. 2020, 210, 111959. [Google Scholar] [CrossRef]
- Zein, R.; Selting, W.; Hamblin, M.R. Review of light parameters and photobiomodulation efficacy: Dive into complexity. J. Biomed. Opt. 2018, 23, 120901. [Google Scholar] [CrossRef]
- Salehpour, F.; Mahmoudi, J.; Kamari, F.; Sadigh-Eteghad, S.; Rasta, S.H.; Hamblin, M.R. Brain Photobiomodulation Therapy: A Narrative Review. Mol. Neurobiol. 2018, 55, 6601–6636. [Google Scholar] [CrossRef] [PubMed]
- Tisch, D.; Schmoll, M. Light regulation of metabolic pathways in fungi. Appl. Microbiol. Biotechnol. 2010, 85, 1259–1277. [Google Scholar] [CrossRef] [PubMed]
- Suzuki, T. Light-Irradiation Wavelength and Intensity Changes Influence Aflatoxin Synthesis in Fungi. Toxins 2018, 10, 12. [Google Scholar] [CrossRef] [PubMed]
- Kitagaki, H.; Kitamoto, K. Breeding Research on Sake Yeasts in Japan: History, Recent Technological Advances, and Future Perspectives. Annu. Rev. Food Sci. Technol. 2013, 4, 215–235. [Google Scholar] [CrossRef] [PubMed]
- Gou, M.; Wang, H.Z.; Yuan, H.W.; Zhang, W.X.; Tang, Y.Q.; Kida, K. Characterization of the microbial community in three types of fermentation starters used for Chinese liquor production. J. Inst. Brew. 2015, 121, 620–627. [Google Scholar] [CrossRef]
- Du, H.; Wang, X.S.; Zhang, Y.H.; Xu, Y. Exploring the impacts of raw materials and environments on the microbiota in Chinese Daqu starter. Int. J. Food Microbiol. 2019, 297, 32–40. [Google Scholar] [CrossRef]
- Peng, M.Y.; Liu, J.Y.; Huang, Y.; Zhou, M.Z.; Hu, Y.; Fu, C.X.; Dai, J.; Wang, C.; Li, D.S.; Gao, B.; et al. Effects of a mixed koji culture of Aspergillus oryzae HG-26 and Aspergillus niger HG-35 on the levels of enzymes, antioxidants and phenolic compounds in soy sauce during the fermentation process. Int. J. Food Sci. Technol. 2017, 52, 1585–1593. [Google Scholar] [CrossRef]
- Tang, J.; Chen, T.T.; Hu, Q.; Lei, D.; Sun, Q.; Zhang, S.M.; Zeng, C.Y.; Zhang, Q. Improved protease activity of Pixian broad bean paste with cocultivation of Aspergillus oryzae QM-6 and Aspergillus niger QH-3. Electron. J. Biotechnol. 2020, 44, 33–40. [Google Scholar] [CrossRef]
- Chen, Z.Y.; Feng, Y.Z.; Cui, C.; Zhao, H.F.; Zhao, M.M. Effects of koji-making with mixed strains on physicochemical and sensory properties of Chinese-type soy sauce. J. Sci. Food Agric. 2015, 95, 2145–2154. [Google Scholar] [CrossRef]
- Leng, X.W.; Xu, Y. Improvement of acid protease production by a mixed culture of Aspergillus niger and Aspergillus oryzae using solid-state fermentation technique. Afr. J. Biotechnol. 2011, 10, 6824–6829. [Google Scholar]
- Zhu, J.-C.; Wang, X.-J. Effect of blue light on conidiation development and glucoamylase enhancement in Aspergillus niger. Weishengwu Xuebao 2005, 45, 275–278. [Google Scholar]
- Fanelli, F.; Schmidt-Heydt, M.; Haidukowski, M.; Geisen, R.; Logrieco, A.; Mule, G. Influence of light on growth, conidiation and the mutual regulation of fumonisin B-2 and ochratoxin A biosynthesis by Aspergillus niger. World Mycotoxin J. 2012, 5, 169–176. [Google Scholar] [CrossRef]
Disclaimer/Publisher’s Note: The statements, opinions and data contained in all publications are solely those of the individual author(s) and contributor(s) and not of MDPI and/or the editor(s). MDPI and/or the editor(s) disclaim responsibility for any injury to people or property resulting from any ideas, methods, instructions or products referred to in the content. |
© 2023 by the authors. Licensee MDPI, Basel, Switzerland. This article is an open access article distributed under the terms and conditions of the Creative Commons Attribution (CC BY) license (https://creativecommons.org/licenses/by/4.0/).