Article

Algal Hydrogen Production and Exopolysaccharide Patterns in ChlorellaBacillus Inter-Kingdom Co-Cultures

1
Institute of Plant Biology, Biological Research Center, Eötvös Loránd Research Network (ELKH), Temesvári Krt. 62., H-6726 Szeged, Hungary
2
Doctoral School in Biology, Faculty of Science and Informatics, University of Szeged, H-6726 Szeged, Hungary
3
Department of Water Sciences, University of Public Service, H-6500 Baja, Hungary
*
Author to whom correspondence should be addressed.
Fermentation 2023, 9(5), 424; https://doi.org/10.3390/fermentation9050424
Submission received: 28 March 2023 / Revised: 26 April 2023 / Accepted: 26 April 2023 / Published: 28 April 2023
(This article belongs to the Special Issue Algal Biomass: From Bioproducts to Biofuels)

Abstract

:
Biohydrogen production from wastewater using eukaryotic green algae can be facilitated by appropriately selected bacterial partners and cultivation conditions. Two Chlorella algal species were chosen for these experiments, based on their robust growth ability in synthetic wastewater. The applied three Bacillus bacterial partners showed active respiration and efficient biomass production in the same synthetic wastewater. Bacillus amyloliquefaciens, Bacillus mycoides, and Bacillus cereus as bacterial partners were shown to specifically promote algal biomass yield. Various inter-kingdom co-culture combinations were investigated for algal–bacterial biomass generation, for co-culture-specific exopolysaccharide patterns, and, primarily, for algal biohydrogen evolution. Chlorella sp. MACC-38 mono- and co-cultures generated significantly higher biomass compared with that of Chlorella sp. MACC-360 mono- and co-cultures, while in terms of hydrogen production, Chlorella sp. MACC-360 co-cultures clearly surpassed their Chlorella sp. MACC-38 counterparts. Imaging studies revealed tight physical interactions between the algal and bacterial partners and revealed the formation of co-culture-specific exopolysaccharides. Efficient bacterial respiration was in clear correlation with algal hydrogen production. Stable and sustainable algal hydrogen production was observed in synthetic wastewater for Chlorella sp. MACC-360 green algae in co-cultures with either Bacillus amyloliquefaciens or Bacillus cereus. The highest algal hydrogen yields (30 mL H2 L−1 d−1) were obtained when Chlorella sp. MACC-360 was co-cultured with Bacillus amyloliquefaciens. Further co-culture-specific algal biomolecules such as co-cultivation-specific exopolysaccharides increase the valorization potential of algal–bacterial co-cultures and might contribute to the feasibility of algal biohydrogen production technologies.

1. Introduction

Increasing environmental pollution and global warming have led to an increased focus on renewable, sustainable and environmentally friendly alternative energy sources, including algae biofuels [1]. Microalgae (including prokaryotic cyanobacteria and eukaryotic unicellular algae) are simple, chlorophyll-containing photosynthetic organisms with diverse biotechnological exploitation potential. Hydrogen is considered a promising clean alternative renewable energy carrier. Microalgae are capable of biohydrogen production through both photolytic and fermentation pathways; the algae cells use their hydrogenase enzymes for the disposal of excess electrons in the form of molecular hydrogen [2,3,4,5]. Eukaryotic green algae utilize Fe-Fe hydrogenases for converting the energy of sunlight or organic macromolecules into hydrogen gas [6,7,8,9]. The direct and indirect photolytic pathways take advantage of the photosynthetic system of the algae, linking water splitting or starch degradation to hydrogen production [10,11,12].
Sunlight has primary importance in algae physiology. Microalgae are capable of utilizing light for photosynthesis within the wavelength range of 400 nm to 700 nm [13]. The protein, carbohydrate, lipid, and pigment compositions of green algae are all highly dependent on light conditions. In their natural habitats, algae predominantly grow in diminished light and avoid direct sunlight, which can be harmful to algal cultures [14]. Chlamydomonas reinhardtii is the most studied and is a benchmark unicellular green algal strain capable of hydrogen production [10,15,16,17,18]. However, the Chlorella genus is another well-known robust, high-biomass-producing green algae taxon [19,20,21,22]. The Chlorella species have the capacity to rapidly accumulate high biomass and to produce phytohormones such as auxins, ethylene, brassinosteroids, cytokinin, and trehalose [23,24], as well as exopolysaccharides [25,26,27]. Thus, Chlorella strains are among the most popular eukaryotic green microalgae due to their versatility and exploitability in various biotechnological industries, including wastewater treatment and food and feed additive production, as well as the pharmaceutical industry [21].
Recently, the use of synthetic algal and microbial co-cultures and engineered consortia have attracted particular interest in the biohydrogen research [5,10,12,28,29]. A number of studies have investigated and compared the efficiency of algal biohydrogen production using either axenic algae or algal–bacterial co-cultures. Generally, microalgae produce oxygen during photosynthetic growth, which can be utilized by bacteria as an electron acceptor in the degradation of organic matter. The carbon dioxide released during bacterial mineralization is readily accessible to microalgae [30,31]. Moreover, bacteria supply the algae partners with fixed nitrogen, various types of vitamin B, and siderophores, while in exchange, the microalgae provide dissolved organic carbon (photosynthates) to bacteria [20,32,33]. Under well-adjusted conditions, the microalgae can produce hydrogen either in axenic mono- or bacterial co-culture systems (e.g., under nitrogen limitation CO2 fixation—the preferred electron sink—is blocked) [7,8,9]. Anaerobiosis is also essential for the induction of hydrogen production. Anaerobic conditions can be achieved by various approaches, nutrition depletion strategies are the most widely used strategies, however, the addition of actively respiring bacterial partner(s) was also shown to be an efficient and simple solution [5,10,12,16,21,30,34]. A number of studies describe consortial systems where ultimately the bacterial partners produce hydrogen, while the algae components are used to provide specific organic carbon sources to the hydrogen-producing bacteria [5,10,20]. Nevertheless, a few studies have investigated the specific algal hydrogen production in algae–Bacillus co-cultures [20,35,36]. Bacillus species are widely used in different commercial products utilizing their various direct and indirect plant growth promotion mechanisms. Bacillus spp. are often capable of nitrogen fixation, mineralization of phosphorus and other nutrients, phytohormone and siderophore production, generation of antimicrobial compounds and hydrolytic enzymes, and being an inducer of plant systemic resistance and tolerance to abiotic stressors [37,38,39].
Three different Bacillus species were investigated as eukaryotic green algae partners in this experiment. Bacillus amyloliquefaciens, Bacillus mycoides, and Bacillus cereus were all shown to promote the specific algal biomass yield of two Chlorella species in co-cultures compared with the yields of the axenic algae under the same growth conditions. B. amyloliquefaciens is a non-pathogenic, endospore-forming Bacillus, a free-living soil bacterium with a variety of traits, including plant growth promotion, production of antifungal and antibacterial metabolites, and production of industrially important enzymes [40]. B. mycoides is a non-motile, spore-forming bacterium able to create rhizoid colonies [41]. B. cereus is a common spore-forming and rod-shaped bacterium widely distributed in the environment [42]. Moreover, all three Bacillus species are able to produce polysaccharides, which are secreted from the bacterial cells (exopolysaccharides—EPSs). These bacteria are often embedded in their own EPS matrix, creating filament-like biofilm structures [41,43]. These Bacillus-based biofilms are widely defined as multicellular communities occurring at surfaces or interfaces [44].
The specific aim of the present study is to provide a comparative analysis of the biomass and hydrogen production capability of two selected Chlorella green algae in various combinations of bacterial co-cultivations. We have investigated the specific effects of three growth-promoting Bacillus bacteria on algal hydrogen, biomass, and EPS production.

2. Materials and Methods

2.1. Growth of Axenic Algal Strains and Pure Bacterial Strains

Chlorella sp. MACC-38 and Chlorella sp. MACC-360 (both received from the Mosonmagyaróvár Algal Culture Collection (MACC)) green algae were used for the experiments. Algae cultures were pre-grown on TAP (TRIS-Acetate-Phosphate) plates at 25 °C under illumination. Algae colonies were harvested from TAP plates and transferred into liquid Minimal Medium (MM). MM (1 L) was prepared in sterile filtered water by adding 1 mL MgSO4 (1 mM), 1 mL FeCl3·CaCl2 (1 µM), 10 mL glucose solution (0.4% w/v), 5 mL histidine solution (0.0015% w/v), 5 mL leucine solution (0.004% w/v), 10 mL yeast extract (0.01% w/v), and M9 minimal salts (232 g Na2HPO4, 120 g KH2PO4, 20 g NaCl, and 40 g NH4Cl, and the pH was set to 7.0). Microalgae were cultured for a period of 4 days in closed 150 mL Erlenmeyer flasks at 25 °C, shaken at 180 rpm, and incubated under 50 µmol m−2 s−1 light intensity using a light/dark photoperiod of 16 h/8 h. The number of living algal cells was counted with a Luna-FL instrument (Logos Biosystems, Anyang-si, Republic of Korea) using the Fluorescence Cell Counting mode. Bacillus amyloliquefaciens (DSM 1060), Bacillus mycoides (own isolate), and Bacillus cereus (own isolate) were selected to use in the algal–bacterial co-culture experiments. B. amyloliquefaciens was grown on LB plates (Luria-Bertani medium) supplemented with 10 g L−1 starch at 30 °C, while B. mycoides and B. cereus were grown on LB plates at 30 °C, then harvested and transferred into liquid MM medium for overnight growth. The number of living bacterial cells was counted with a Quantom TxTM Microbial Cell Counter (Logos Biosystems).

2.2. Algal and Bacterial Co-Cultures in Hypo-Vial Bottles

Algal suspensions were prepared from fresh algal cultures by adjusting the initial concentration of 107 algal cells/mL in fresh MM medium. Each partner bacterium was adjusted to an initial concentration of 105 cells/mL in MM medium. These axenic algal and pure bacterial suspensions were used to establish co-cultures in tightly closed Hypo-Vial serum bottles with a total volume of 40 mL. First, 0.5 mL algal and 50 µL bacterial suspensions were added into the bottles, then 19.45 mL freshly prepared Synthetic Wastewater (SWW) medium was added to the algal–bacterial mixtures to prepare a total of 20 mL co-culture solution in the 40 mL bottles [45]. SWW medium was prepared in 1 L of distilled water by adding the following components: 1.6 g peptone, 1.1 g meat extract, 0.425 g NaNO3 (5 mM), 0.07 g NaCl, 0.04 g CaCl2·2H2O, 0.02 g MgSO4·7H2O, and 0.28 g K2HPO4; the pH was set at 7.5. All mono- and co-cultures were incubated under 50 µmol m−2 s−1 light intensity at 25 °C and shaken at 180 rpm using a light/dark photoperiod of 16 h/8 h. All mono- and co-cultures were sampled and analyzed for hydrogen and oxygen levels as well as for the number of living algal cells and bacterial colony-forming units (CFU) every 24 h. All co-culture experiments were performed in three replicates. All calculations, and statistical analyses were performed using GraphPad Prism software version 8.0 for Windows PC (GraphPad Software, San Diego, CA, USA).

2.3. Gas Phase Analysis

The hydrogen and oxygen levels in the headspace of the Hypo-Vial bottles were routinely measured using gas chromatography. An Agilent 7890A gas chromatograph (Agilent, Santa Clara, CA, United States) equipped with a thermal conductivity detector and an HP-Molsieve column (length 30 m, diameter 0.320 mm, film 12.0 µm) was used for the hydrogen and oxygen measurements. The temperature of the injector, the TCD detector, and the column were kept at 170 °C, 190 °C, and 60/55 °C, respectively. Samples of 80 µL volumes were analyzed in split mode. Three biological replicates were used for each measurement. Hydrogen and oxygen calibration curves were used to determine accurate gas volumes. A hydrogen calibration curve was used to determine accurate hydrogen amounts. The following correct formula was used for the conversion of simple GC units: x = y/239.13 (x: volume of pure hydrogen gas in μL, y: measured GC unit). The measured yields were normalized for the production of 1 L algae culture: x = y/239.13 × 12 500. Hydrogen concentrations were measured every day before the gas phase was refreshed (5 min aeration was done by opening the bottles under a sterile hood). Total accumulated hydrogen concentrations were measured every day (without aeration).

2.4. Morphological Studies

Confocal Laser Scanning Microscopy (CLSM, Olympus Fluoview FV-300, Olympus Optical Co., Ltd., Tokyo, Japan) was used in this study. 50 μL cultures were collected to Eppendorf tubes and stained with Calcofluor White and/or with Concanavalin A using a final fluorescent dye concentration of 10 µg/μL. After 30 min incubation in dark, the samples (8 μL) were spotted on microscope slides and covered with 2% (w/v) agar slice and observed with an Olympus Fluoview FV 1000 confocal laser microscope with 40× magnification objective. Sequential scanning was used to avoid crosstalk of the fluorescent dyes and chlorophyll autofluorescence.
Scanning electron microscopy (SEM) was used to investigate the co-cultures and their EPS production in detail. Cells were fixed with 2.5% (v/v) glutaraldehyde and 0.05 M cacodylate buffer (pH 7.2) in PBS overnight at 4 °C. 5 µL of the algal and bacterial suspensions were spotted on a silicon disk coated with 0.01% Poly-L-Lysine. The disks were washed twice with PBS and dehydrated with a graded ethanol series (30%, 50%, 70%, 80%, and 100% ethanol, each for 1 h). Then, the samples were incubated in hexamethyldisilazane, a chemical drying reagent. Chemical-dried samples were coated with 12 nm gold and observed under a JEOL JSM-7100F/LV high-end field emission scanning electron microscope at 250×, 1500×, and 10,000× magnification.

2.5. Chlorophyll and Carbohydrates Measurements

Both Chlorella algae were grown in SWW medium in Hypo-Vial bottles for two and for four days. For chlorophyll extraction, 1 mL cultures were taken and centrifuged at 13,300 rpm for 10 min. The supernatant was discarded, and 0.5 mL methanol was added to the pellets, which were resuspended with pipetting. The tubes were kept in dark at 45 °C for half an hour, then the samples were centrifuged at 13,300 rpm for 10 min. Absorbance values were measured at 653 nm, 666 nm, and 470 nm using a Hidex microplate reader. Calculations for chlorophyll a, chlorophyll b, and carotenoids were done as described by Lichtenthaler and Wellburn [46].
Ca = 15.65A666 − 7.34A653
Cb = 27.05A653 − 11.21A666
Cx + c = 1000A470 − 2.86Ca − 129.2Cb/245
Where Ca, Cb, and Cx + c are concentrations of chlorophyll a, chlorophyll b, and total carotenoids in µg mL−1, respectively.
For total carbohydrate extraction, pellets obtained after pigment extraction were used. The pellets were washed with Milli-Q water and then further dissolved in 10 mL of Milli-Q water. 1 mL of each sample was taken into a fresh glass tube and 5 mL of anthrone reagent was added. Anthrone reagent was prepared freshly by dissolving 0.5 g of anthrone in 250 mL of concentrated sulfuric acid. After the addition of anthrone reagent, tubes were cooled down and then incubated at 90 °C for 17 min in the water bath. After incubation, tubes were cooled down at room temperature, and absorbance values were taken at 620 nm in a Hidex microplate reader.

3. Results

Two Chlorella green algae and three selected Bacillus species were co-cultured in gas-tight Hypo-Vial bottles to investigate the specific effects of the bacterial partners on algal growth, biomass yield, algal biohydrogen production, and biomolecule content, including co-culture-specific extracellular polysaccharides.

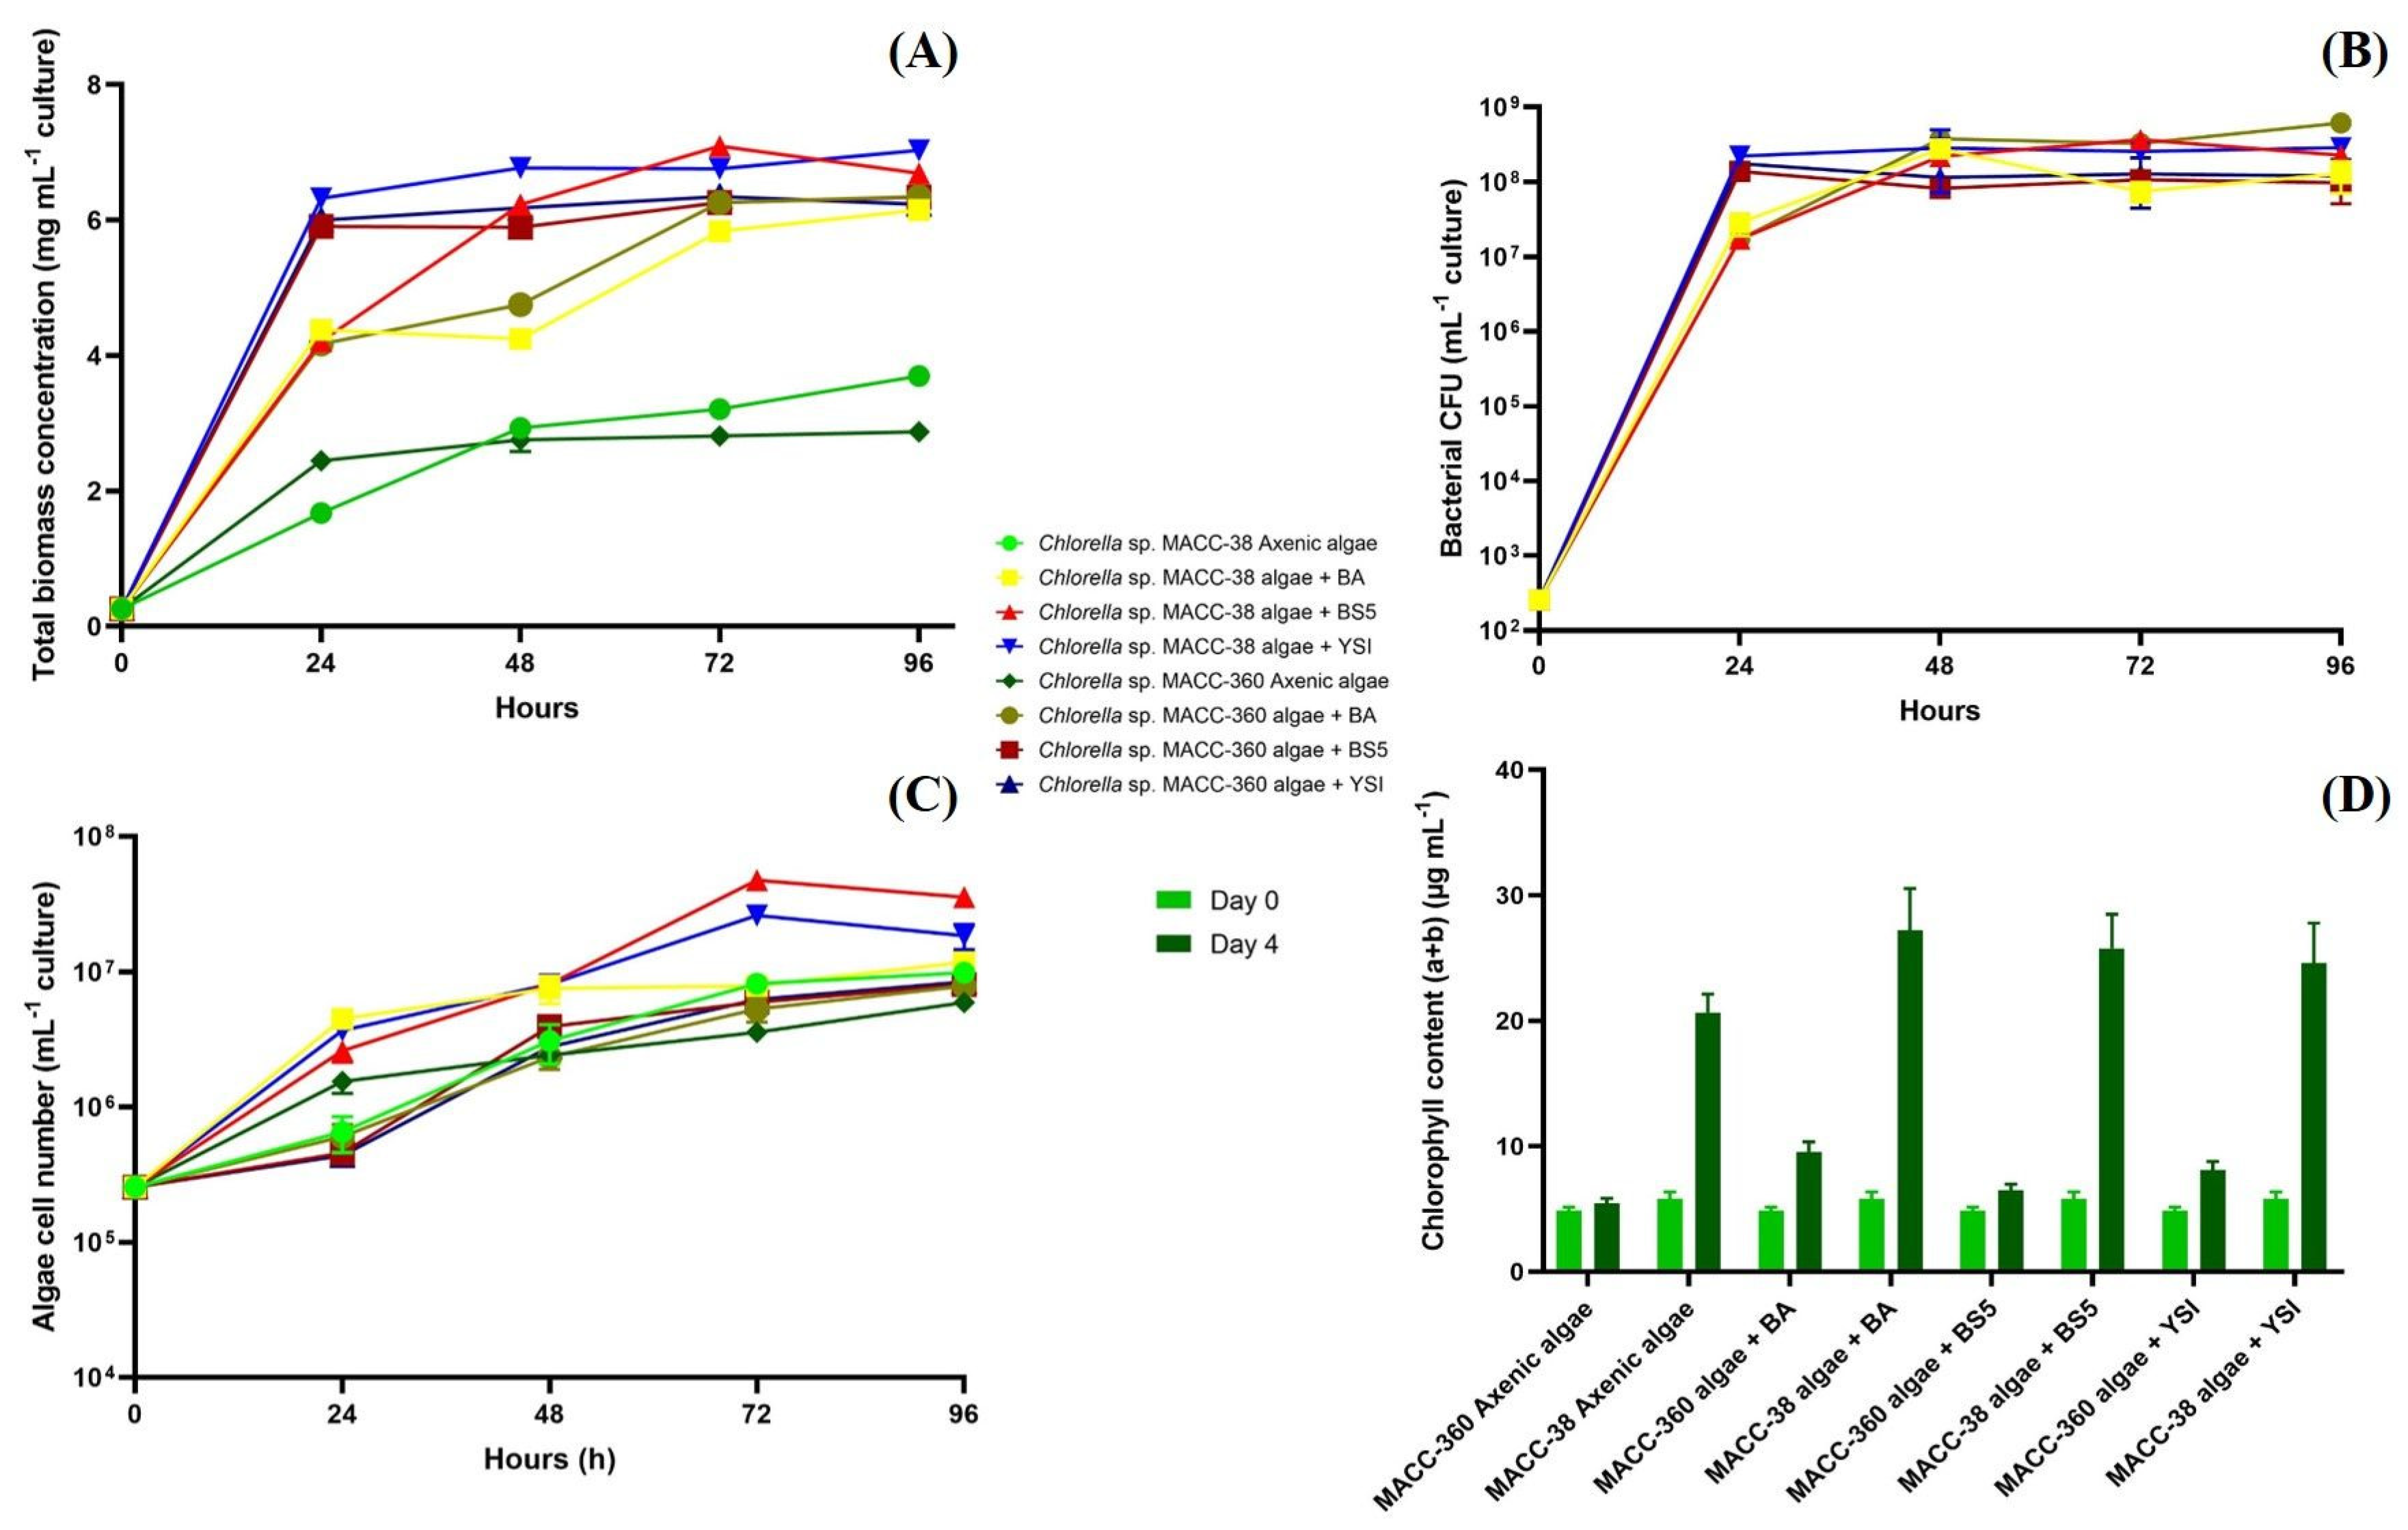
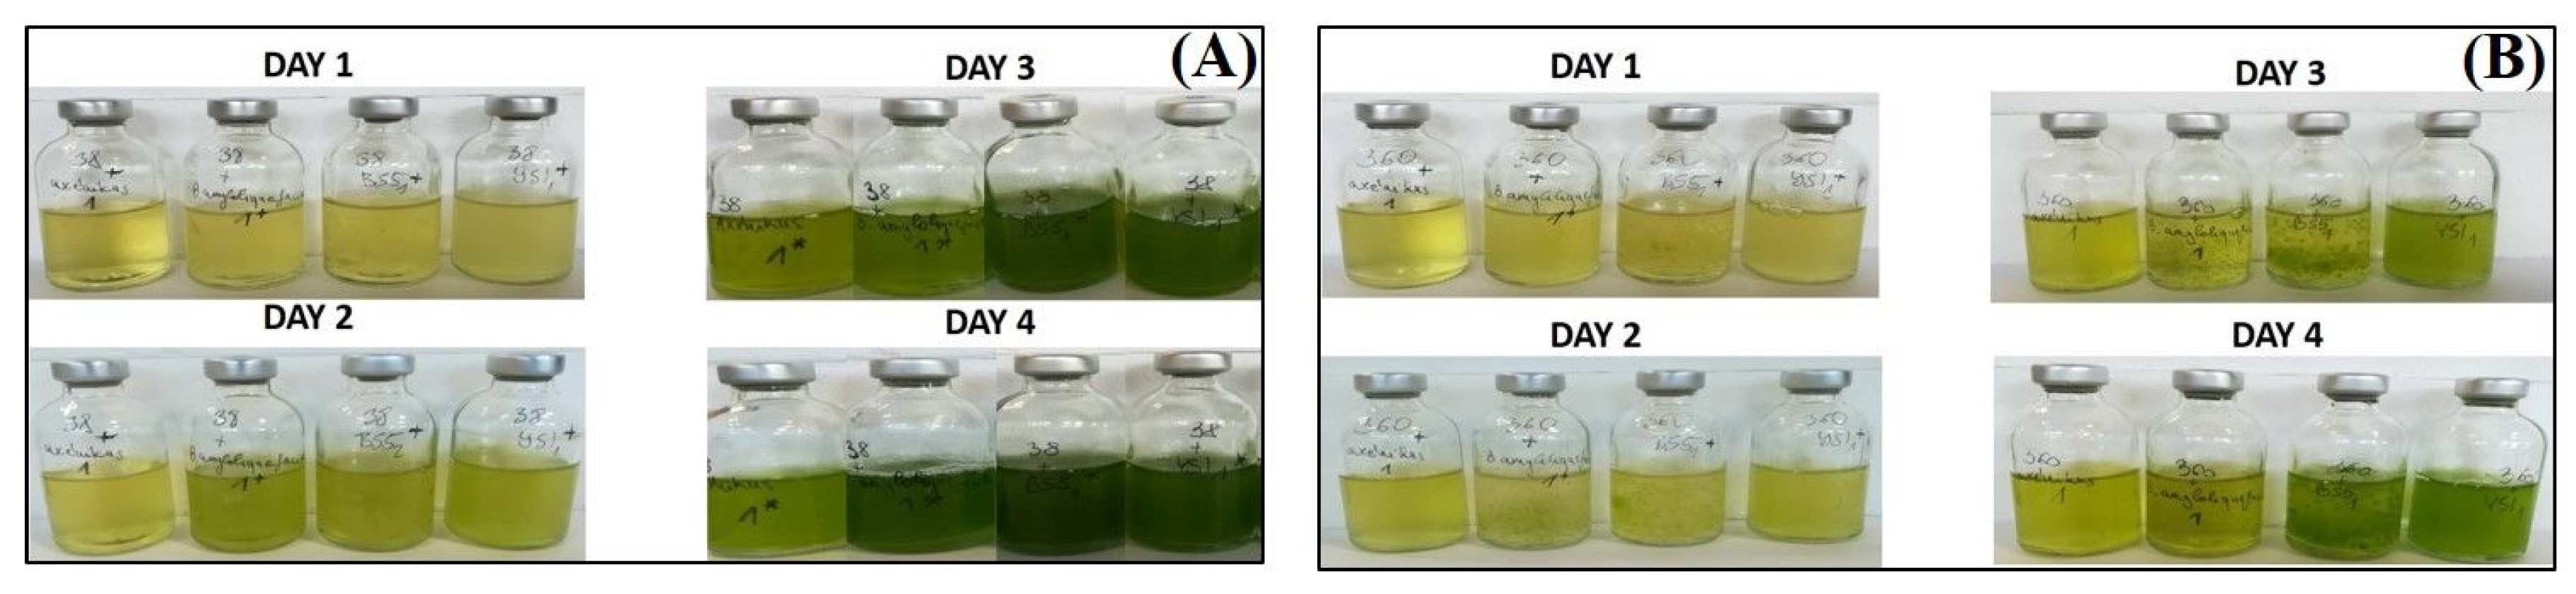
3.1. Algal Biomass Yield Is Facilitated by Bacterial Partners

All Chlorella sp. MACC-38 co-cultures (and also the axenic algal culture) were shown to generate significantly higher (about three times higher) total biomass (wet weight) by the 4th day of cultivation compared with those measured in Chlorella sp. MACC-360 algal mono- and algal–bacterial co-cultures (Figure 1A). The maximum total biomass values were reached on the 3rd day in the Chlorella sp. MACC-38 co-cultures, while the maximum was reached on the 4th day in the Chlorella sp. MACC-360 co-cultures. Counting of the bacterial colony-forming units (CFU) indicated that the partner Bacillus species had highly similar growth kinetics in all algal co-cultures irrespective of the specific Chlorella partner (Figure 1B). This indicated that the remarkable and differential changes in the total biomass of the algal–bacterial co-cultures were due to the different growth features of the two Chlorella species. Even the axenic Chlorella sp. MACC-38 had a higher growth rate compared with that of the axenic Chlorella sp. MACC-360, and this algal growth rate difference was further increased by the addition of the Bacillus partners (Figure 1A,C).
Chlorella sp. MACC-38 was shown to contain a significantly higher amount of chlorophyll (a + b) than Chlorella sp. MACC-360 either in axenic monocultures or in bacterial co-cultures (Figure 1D). This difference was observed both at the start of the experiment (day 0) and also at the end (on day 4). The highest amount of chlorophyll (a + b) was measured in the Chlorella sp. MACC-38–B. amyloliquefaciens algal–bacterial co-culture on day 4. The images of the culture bottles also confirmed the differences in the chlorophyll (a + b) content between the two Chlorella species, as Chlorella sp. MACC-38 co-cultures had a much stronger green color compared with Chlorella sp. MACC-360 co-cultures (Figure 2).

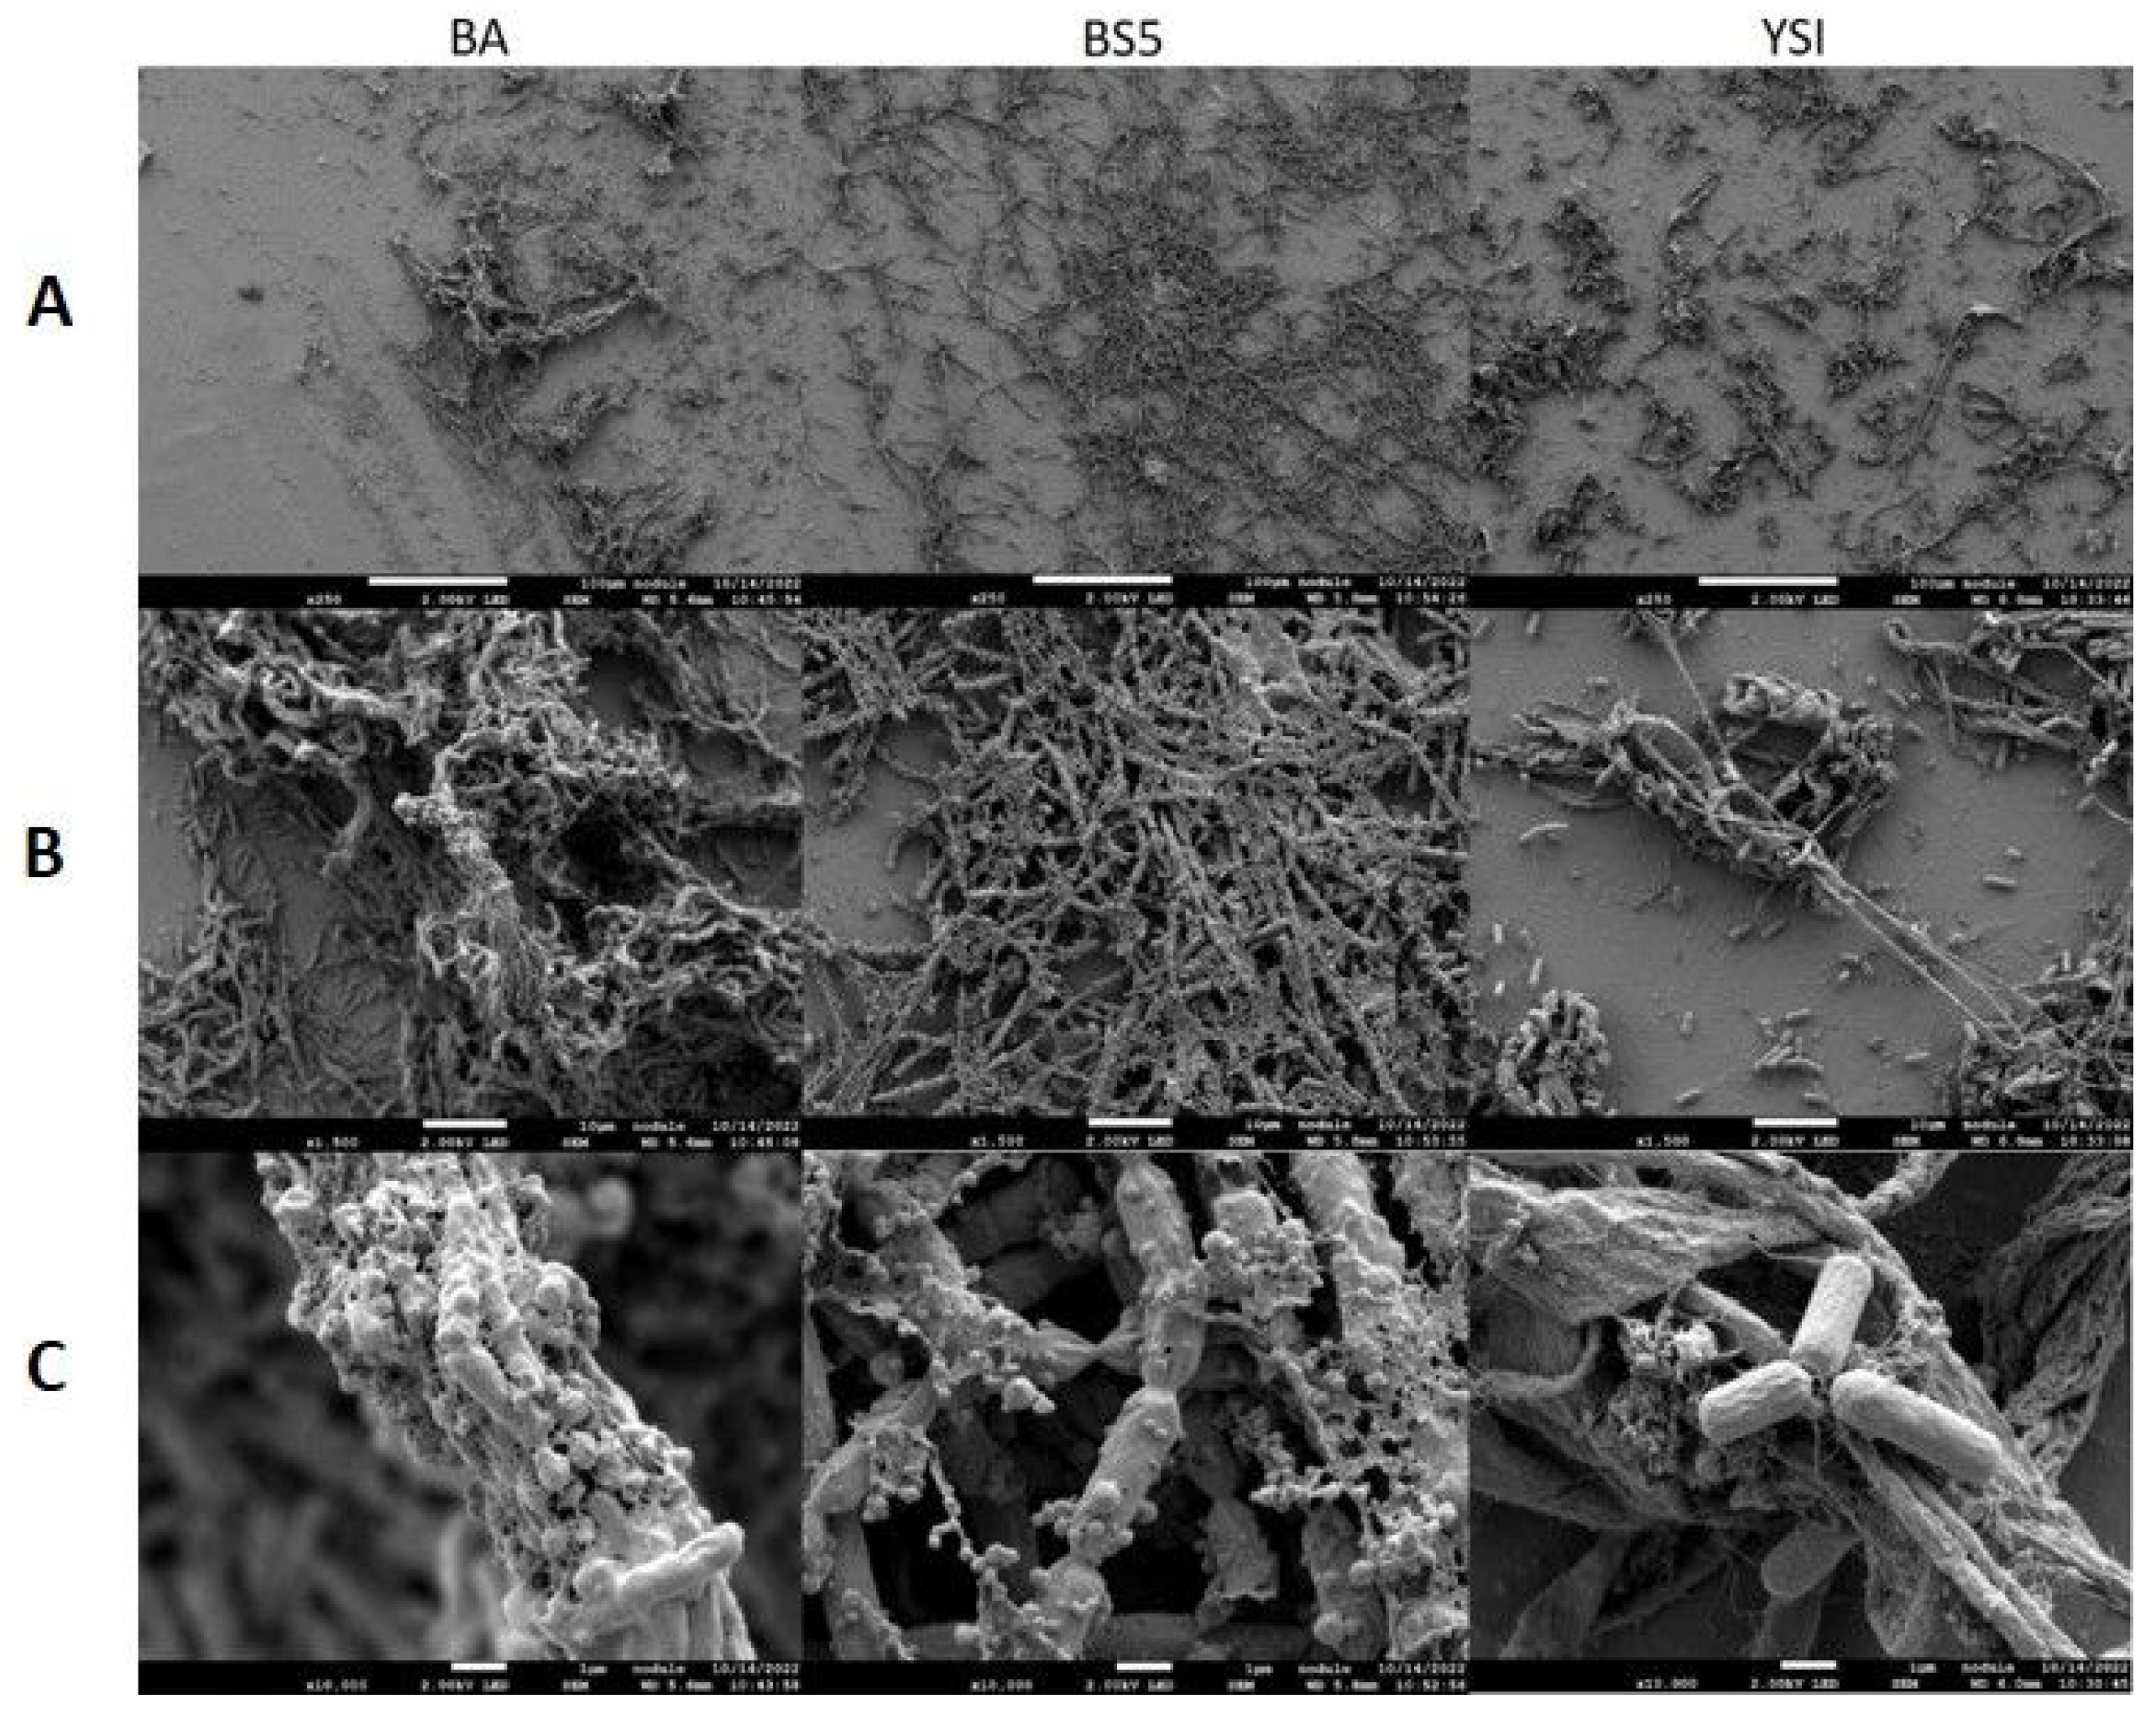
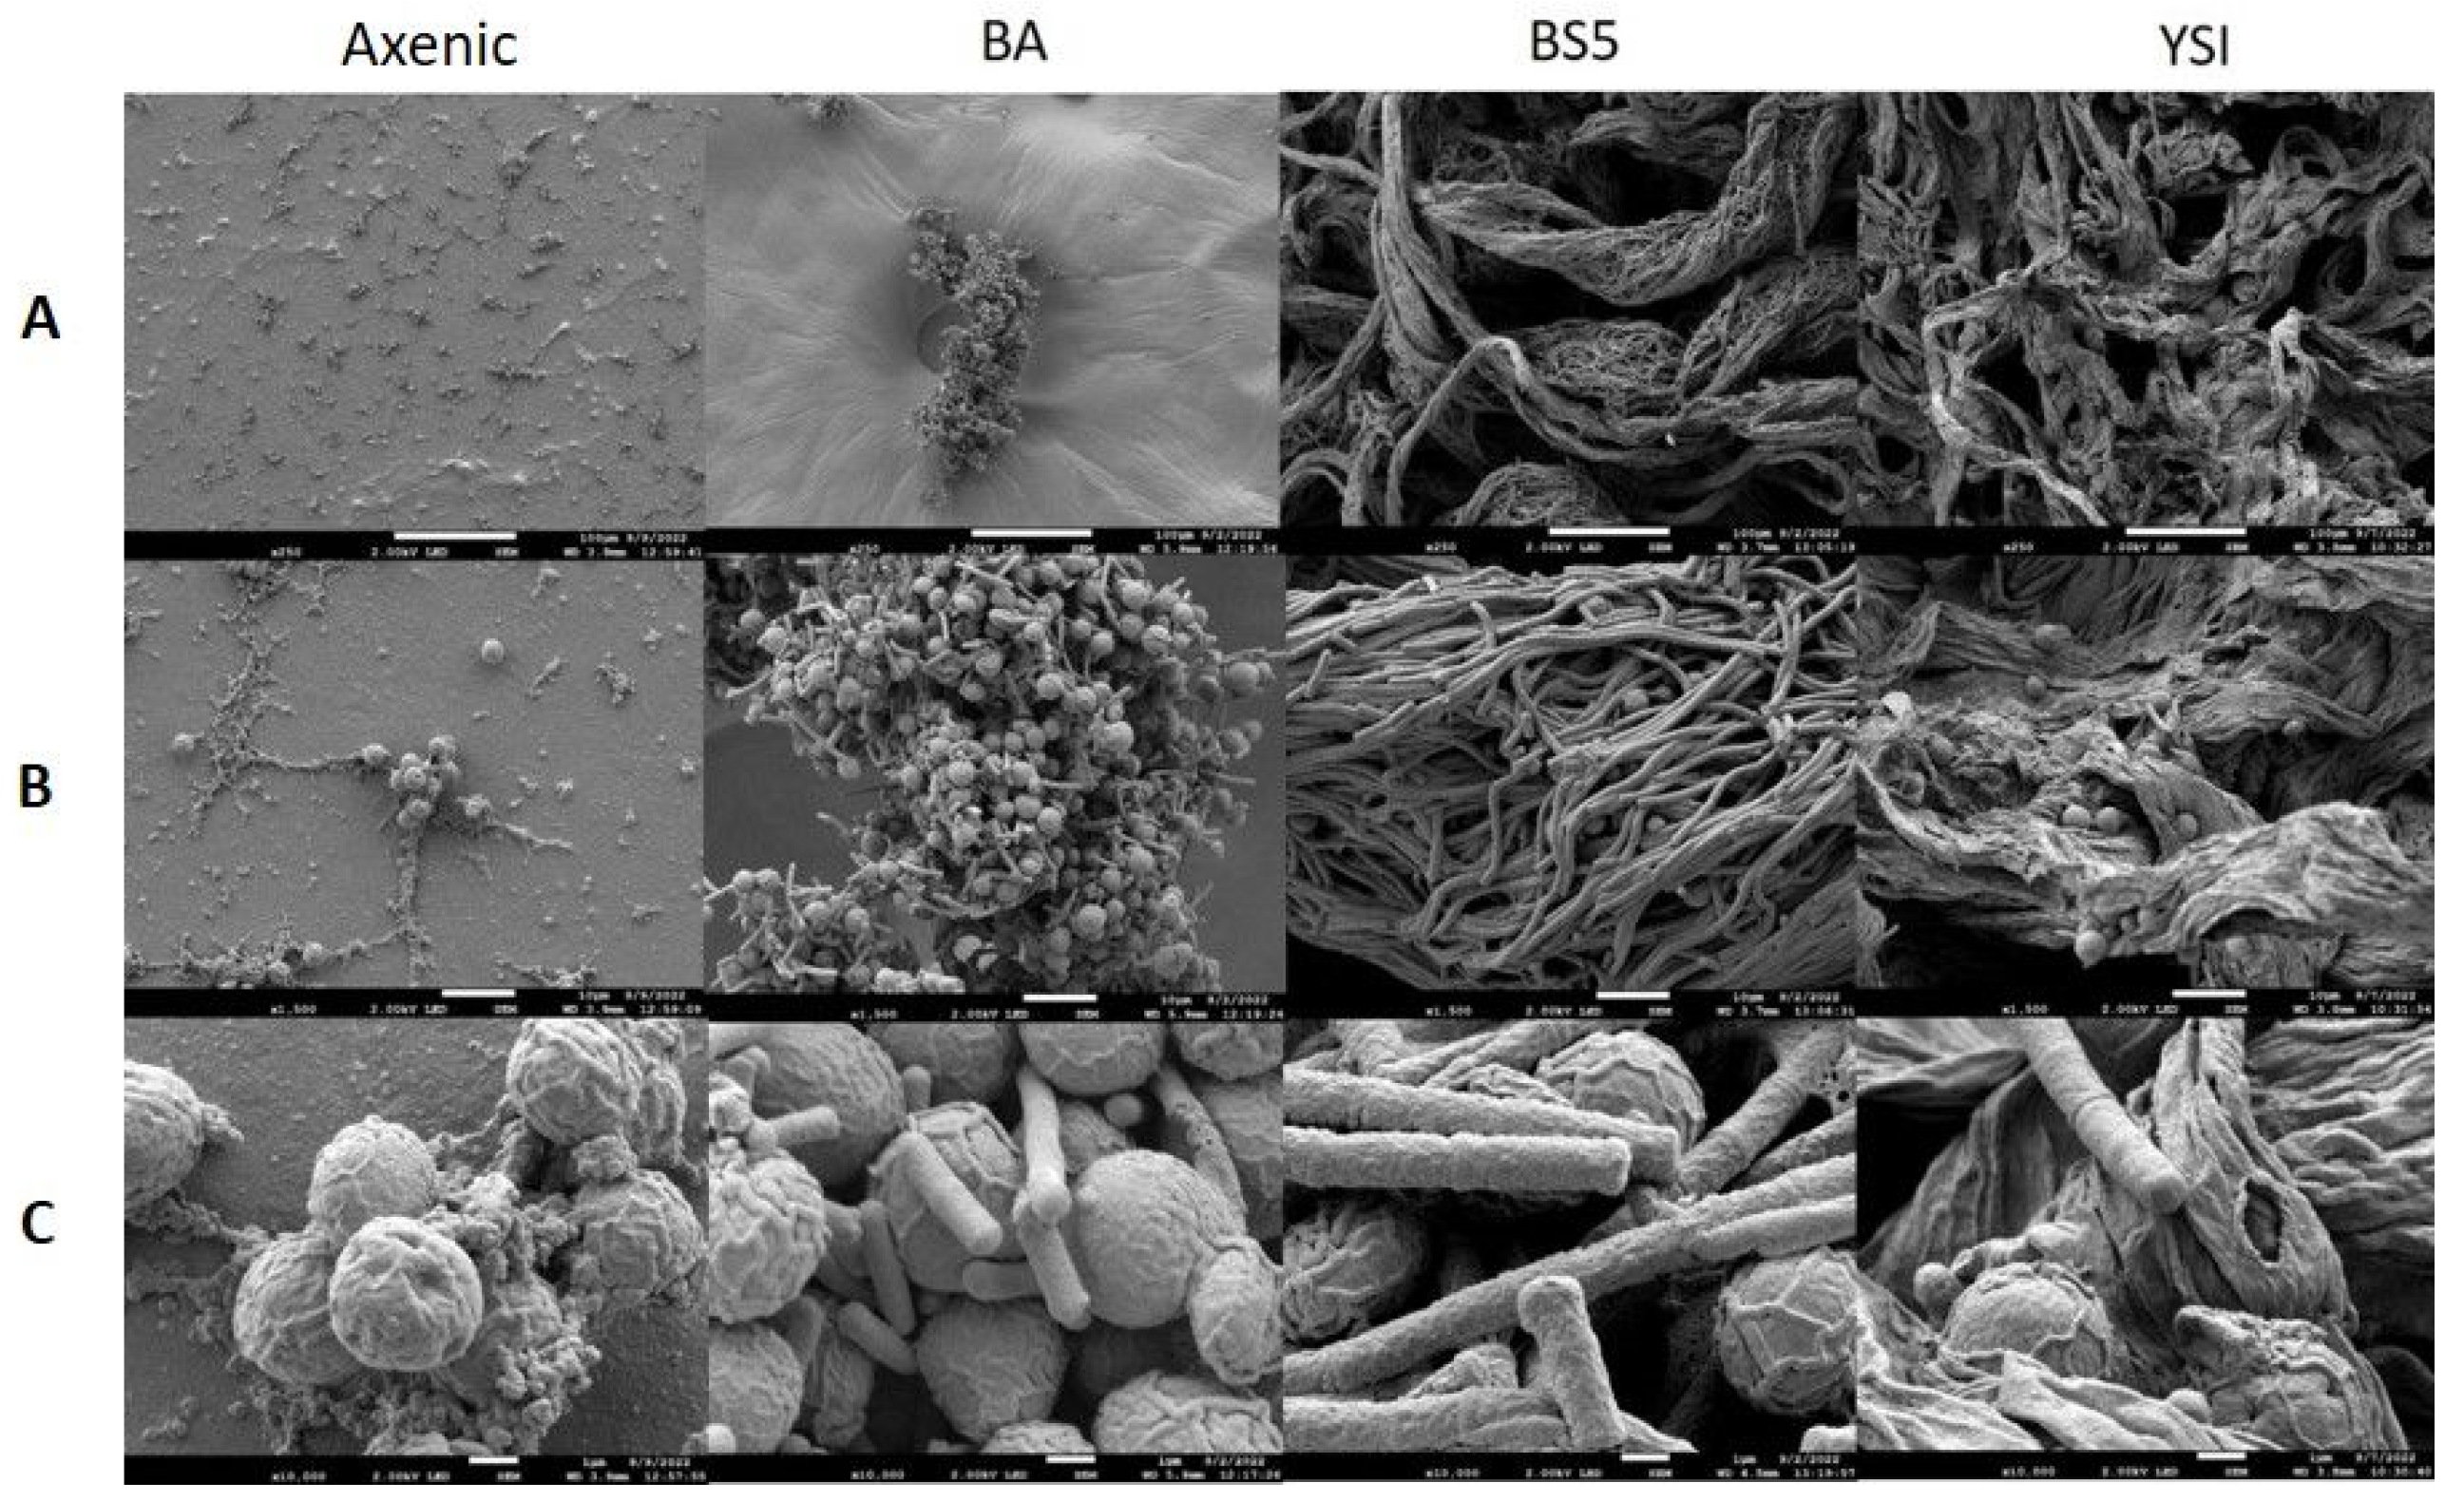
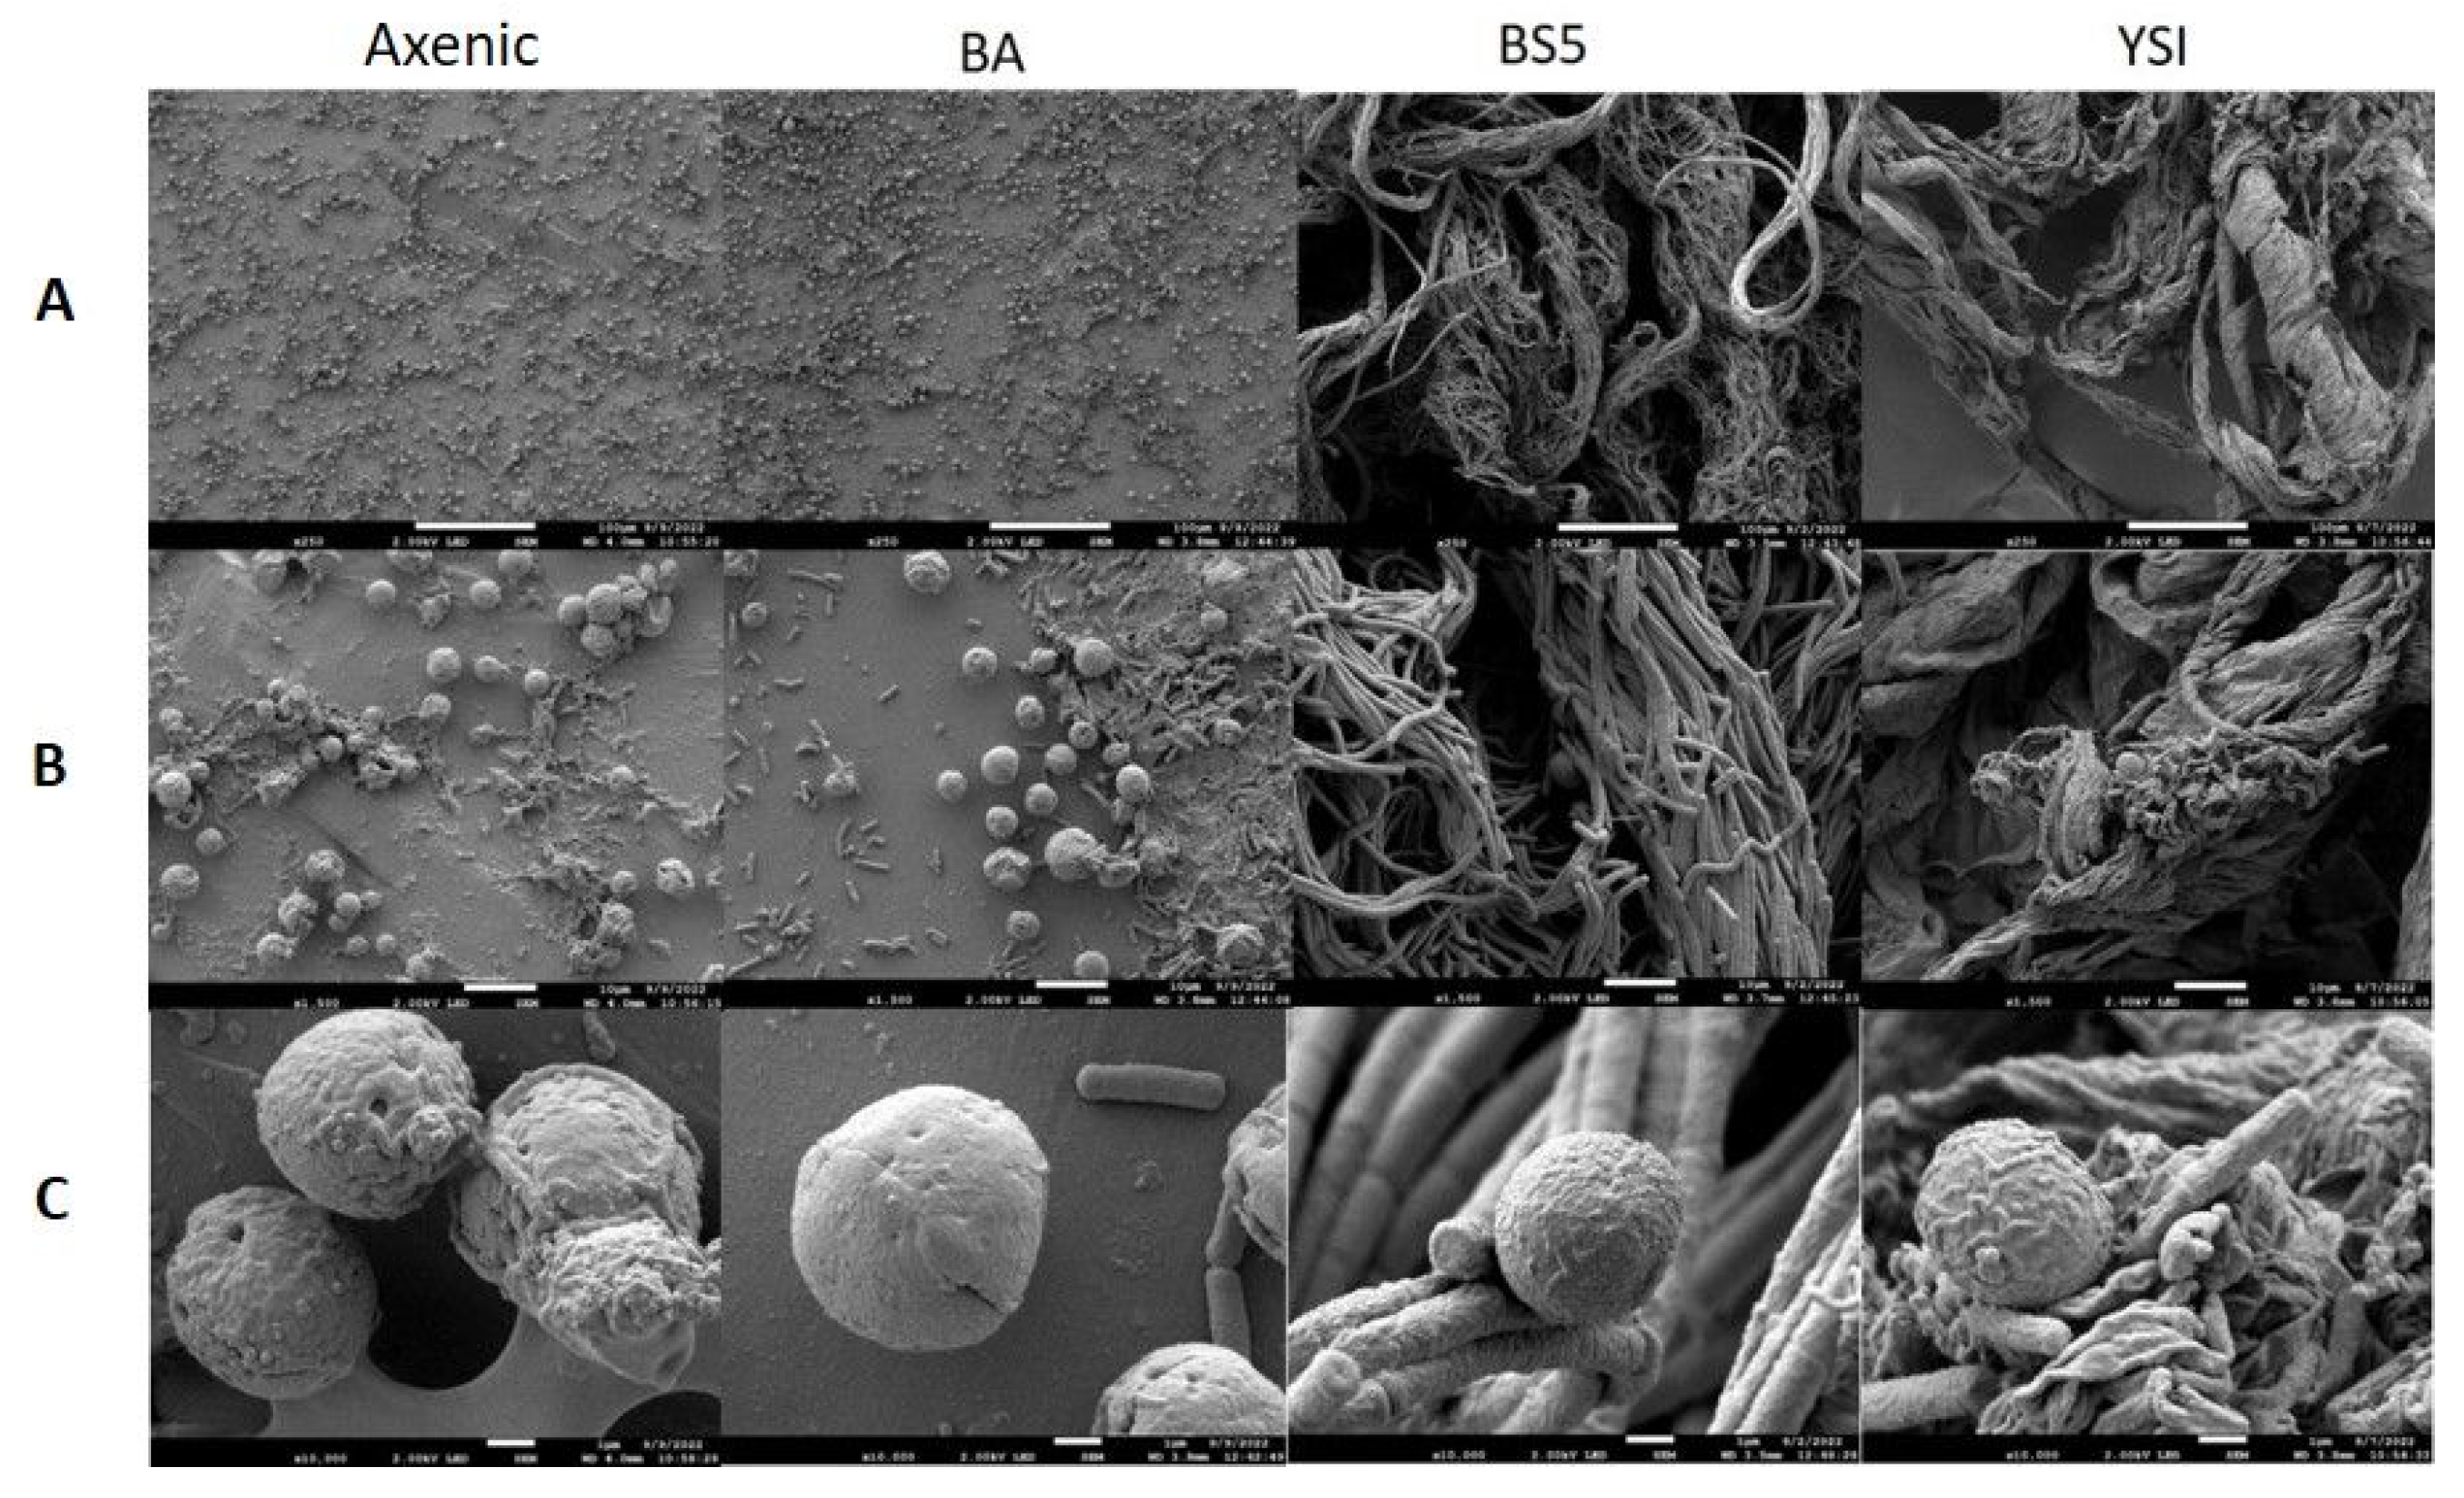
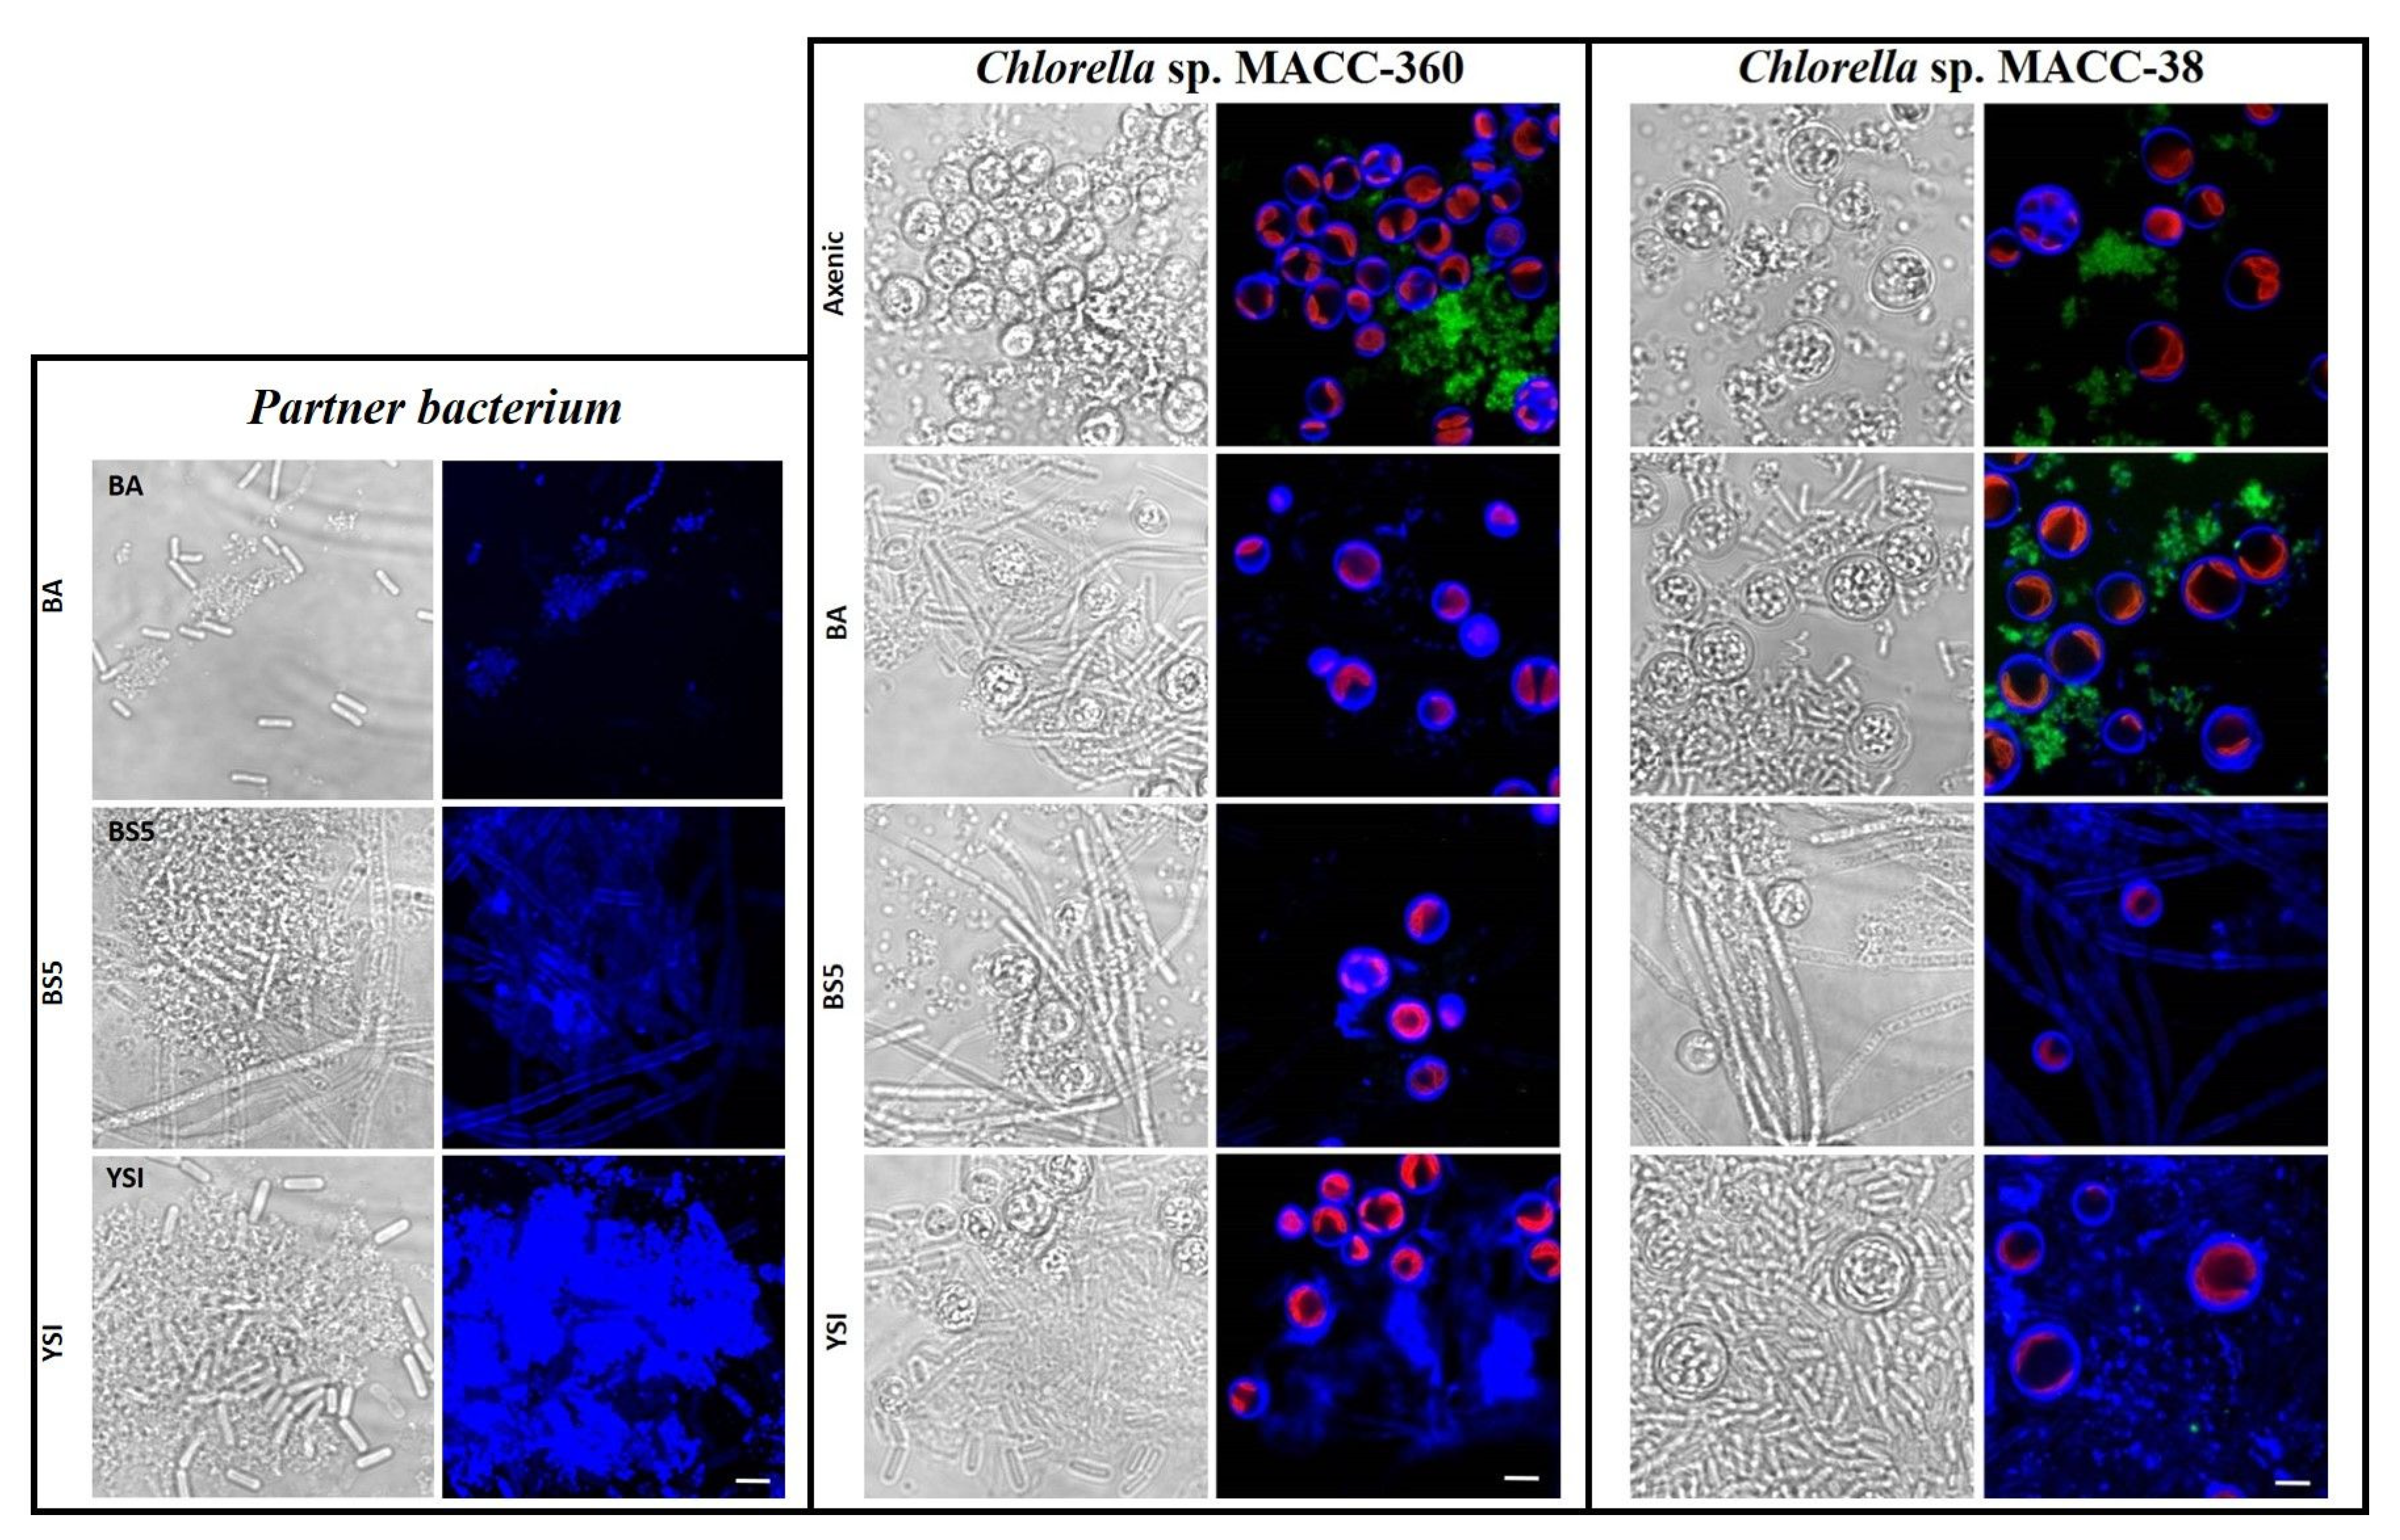
3.2. Co-Culture-Specific EPS Patterns

Scanning electron microscopy (SEM) was applied to investigate the morphology of microalgae and their bacterial partners in monocultures as well as in algal–bacterial co-cultures. SEM analysis revealed that bacterial cells were surrounded by an extracellular matrix in each pure bacterium culture (Figure 3). B. amyloliquefaciens, B. cereus, and B. mycoides bacterial partners all showed extensive cellular aggregation. The cells in the B. mycoides cultures especially exhibited thick filament-like structures, which is a known phenomenon [41,42,43,44]. All three bacterial partners secreted exopolysaccharides (although to different extents), as revealed by both SEM and confocal laser scanning microscopy (CLSM) (Figure 3 and Figure 6).
SEM analysis showed that the axenic algae (both Chlorella sp. MACC-360 and Chlorella sp. MACC-38) were also embedded in an extracellular matrix produced by the cells (Figure 4 and Figure 5). Chlorella sp. MACC-38 was observed to have a slightly larger cell size in axenic culture than Chlorella sp. MACC-360 [47]. CLSM analysis revealed that both axenic algae secreted EPSs that contained α-D glucose (or α-D mannose) sugar residues, as shown by Concanavalin A staining. Specific co-culture morphology patterns were observed when bacterial partners were added to the Chlorella species. When B. amyloliquefaciens (BA) was added as a bacterial partner, strong algae aggregation was detected in Chlorella sp. MACC-360 co-cultures (Figure 4). However, the Chlorella sp. MACC-38 cells did not show similar aggregation when co-cultured with B. amyloliquefaciens (Figure 5). CLSM analysis revealed another interesting difference between these ChlorellaB. amyloliquefaciens co-cultures, more specifically Chlorella sp. MACC-360 that algae cells stopped producing the α-D sugar residues in the extracellular matrix, while α-D sugars were detected in Chlorella sp. MACC-38–B. amyloliquefaciens co-cultures (Figure 6). Another interesting observation regarding the algal cell walls was revealed by CLSM. In co-culture with B. amyloliquefaciens, Chlorella sp. MACC-360 had a thicker cell wall compared with the axenic MACC-360 alga cells (Figure 6). This was shown by calcofluor white (CFW) staining, which specifically binds to β-D sugar residues. However, the same changes in cell wall thickness were not observed for Chlorella sp. MACC-38 co-cultured with the same B. amyloliquefaciens partner. When B. mycoides (BS5) or B. cereus (YSI) were added as bacterial partners to the Chlorella algal strains, long, thick multi-cellular filament bundles appeared in the respective co-cultures (Figure 4 and Figure 5).
Interestingly, the addition of either B. mycoides (BS5) or B. cereus (YSI) as bacterial partners stopped both Chlorella algal strains from producing α-D sugar residues in the extracellular matrix, as shown by the lack of green fluorescence in these ChlorellaBacillus co-cultures (Figure 6). However, the appearance of strong blue fluorescence (CFW) in the ChlorellaB. cereus co-cultures indicated the presence of β-D sugar residues in the extracellular matrices produced in large quantities by these algal–bacterial communities. Less extracellular CFW fluorescence was detected in the ChlorellaB. mycoides co-cultures, and clear differences were found between the Chlorella sp. MACC-360–B. mycoides and the Chlorella sp. MACC-38–B. mycoides co-cultures. More specifically, the bacterial filaments were clearly stained by CFW when Chlorella sp. MACC-38 was the alga partner, while no bacterial cell wall staining was observed when Chlorella sp. MACC-360 was co-cultured with B. mycoides (Figure 6).

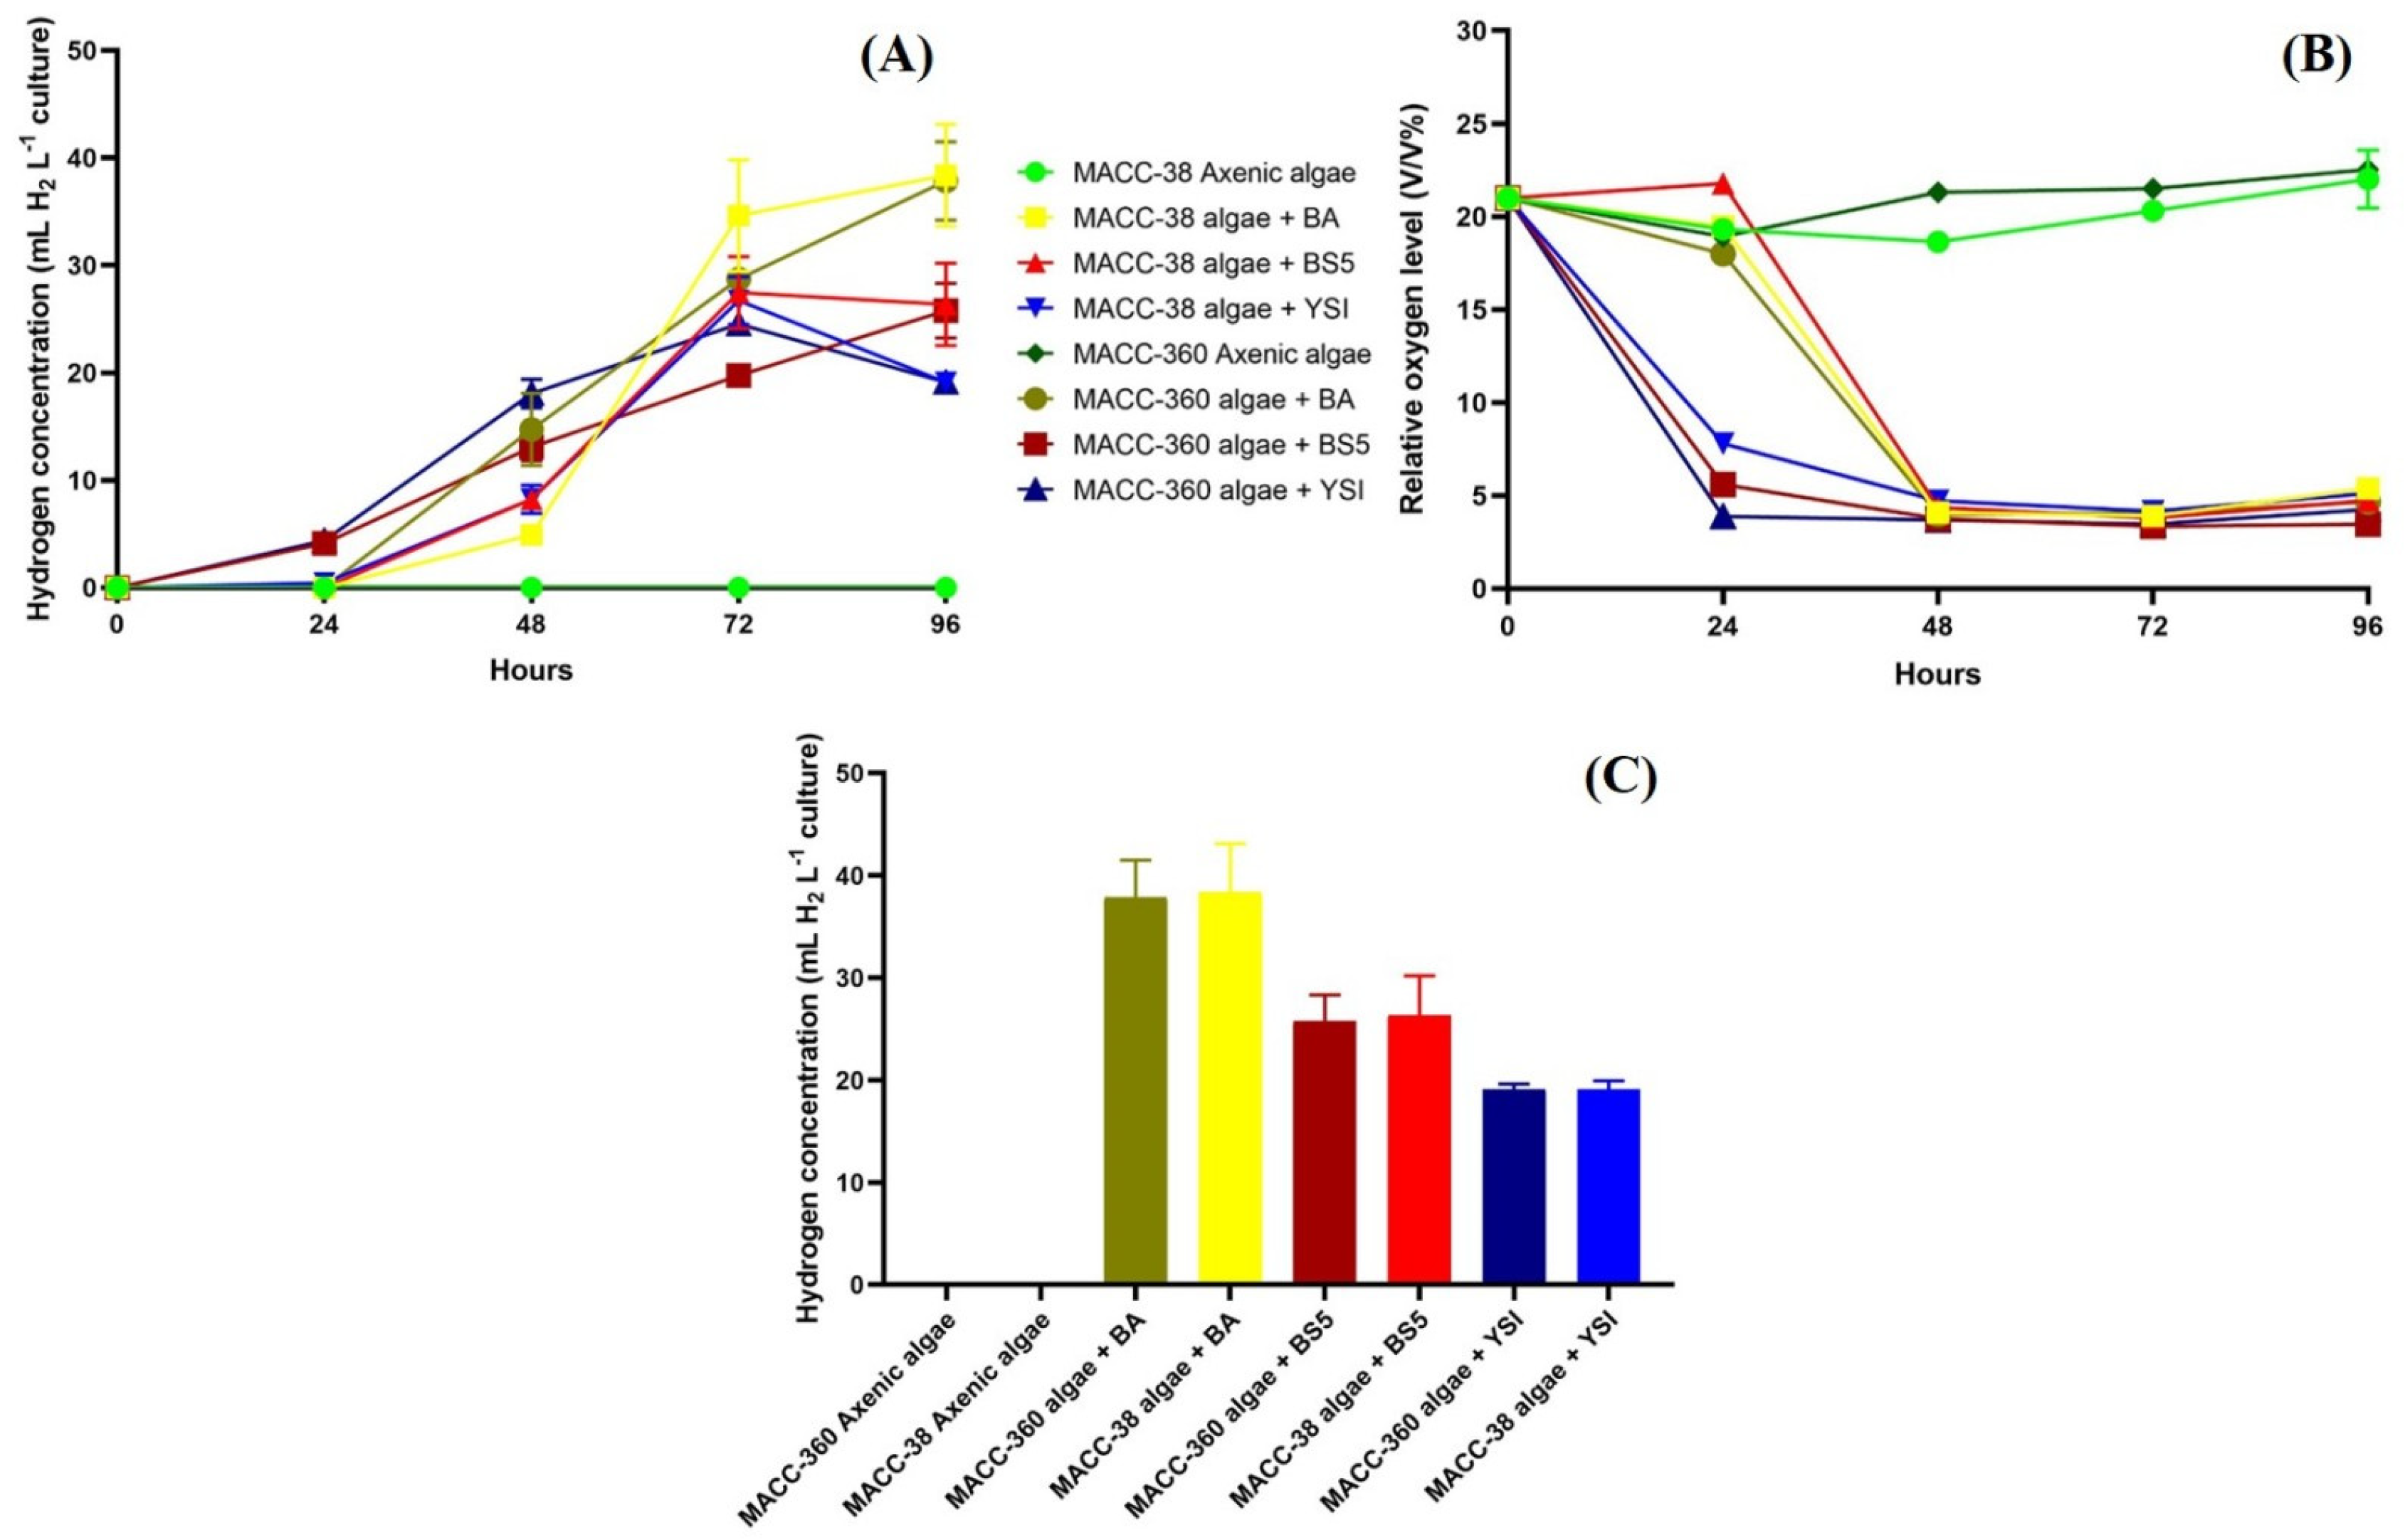
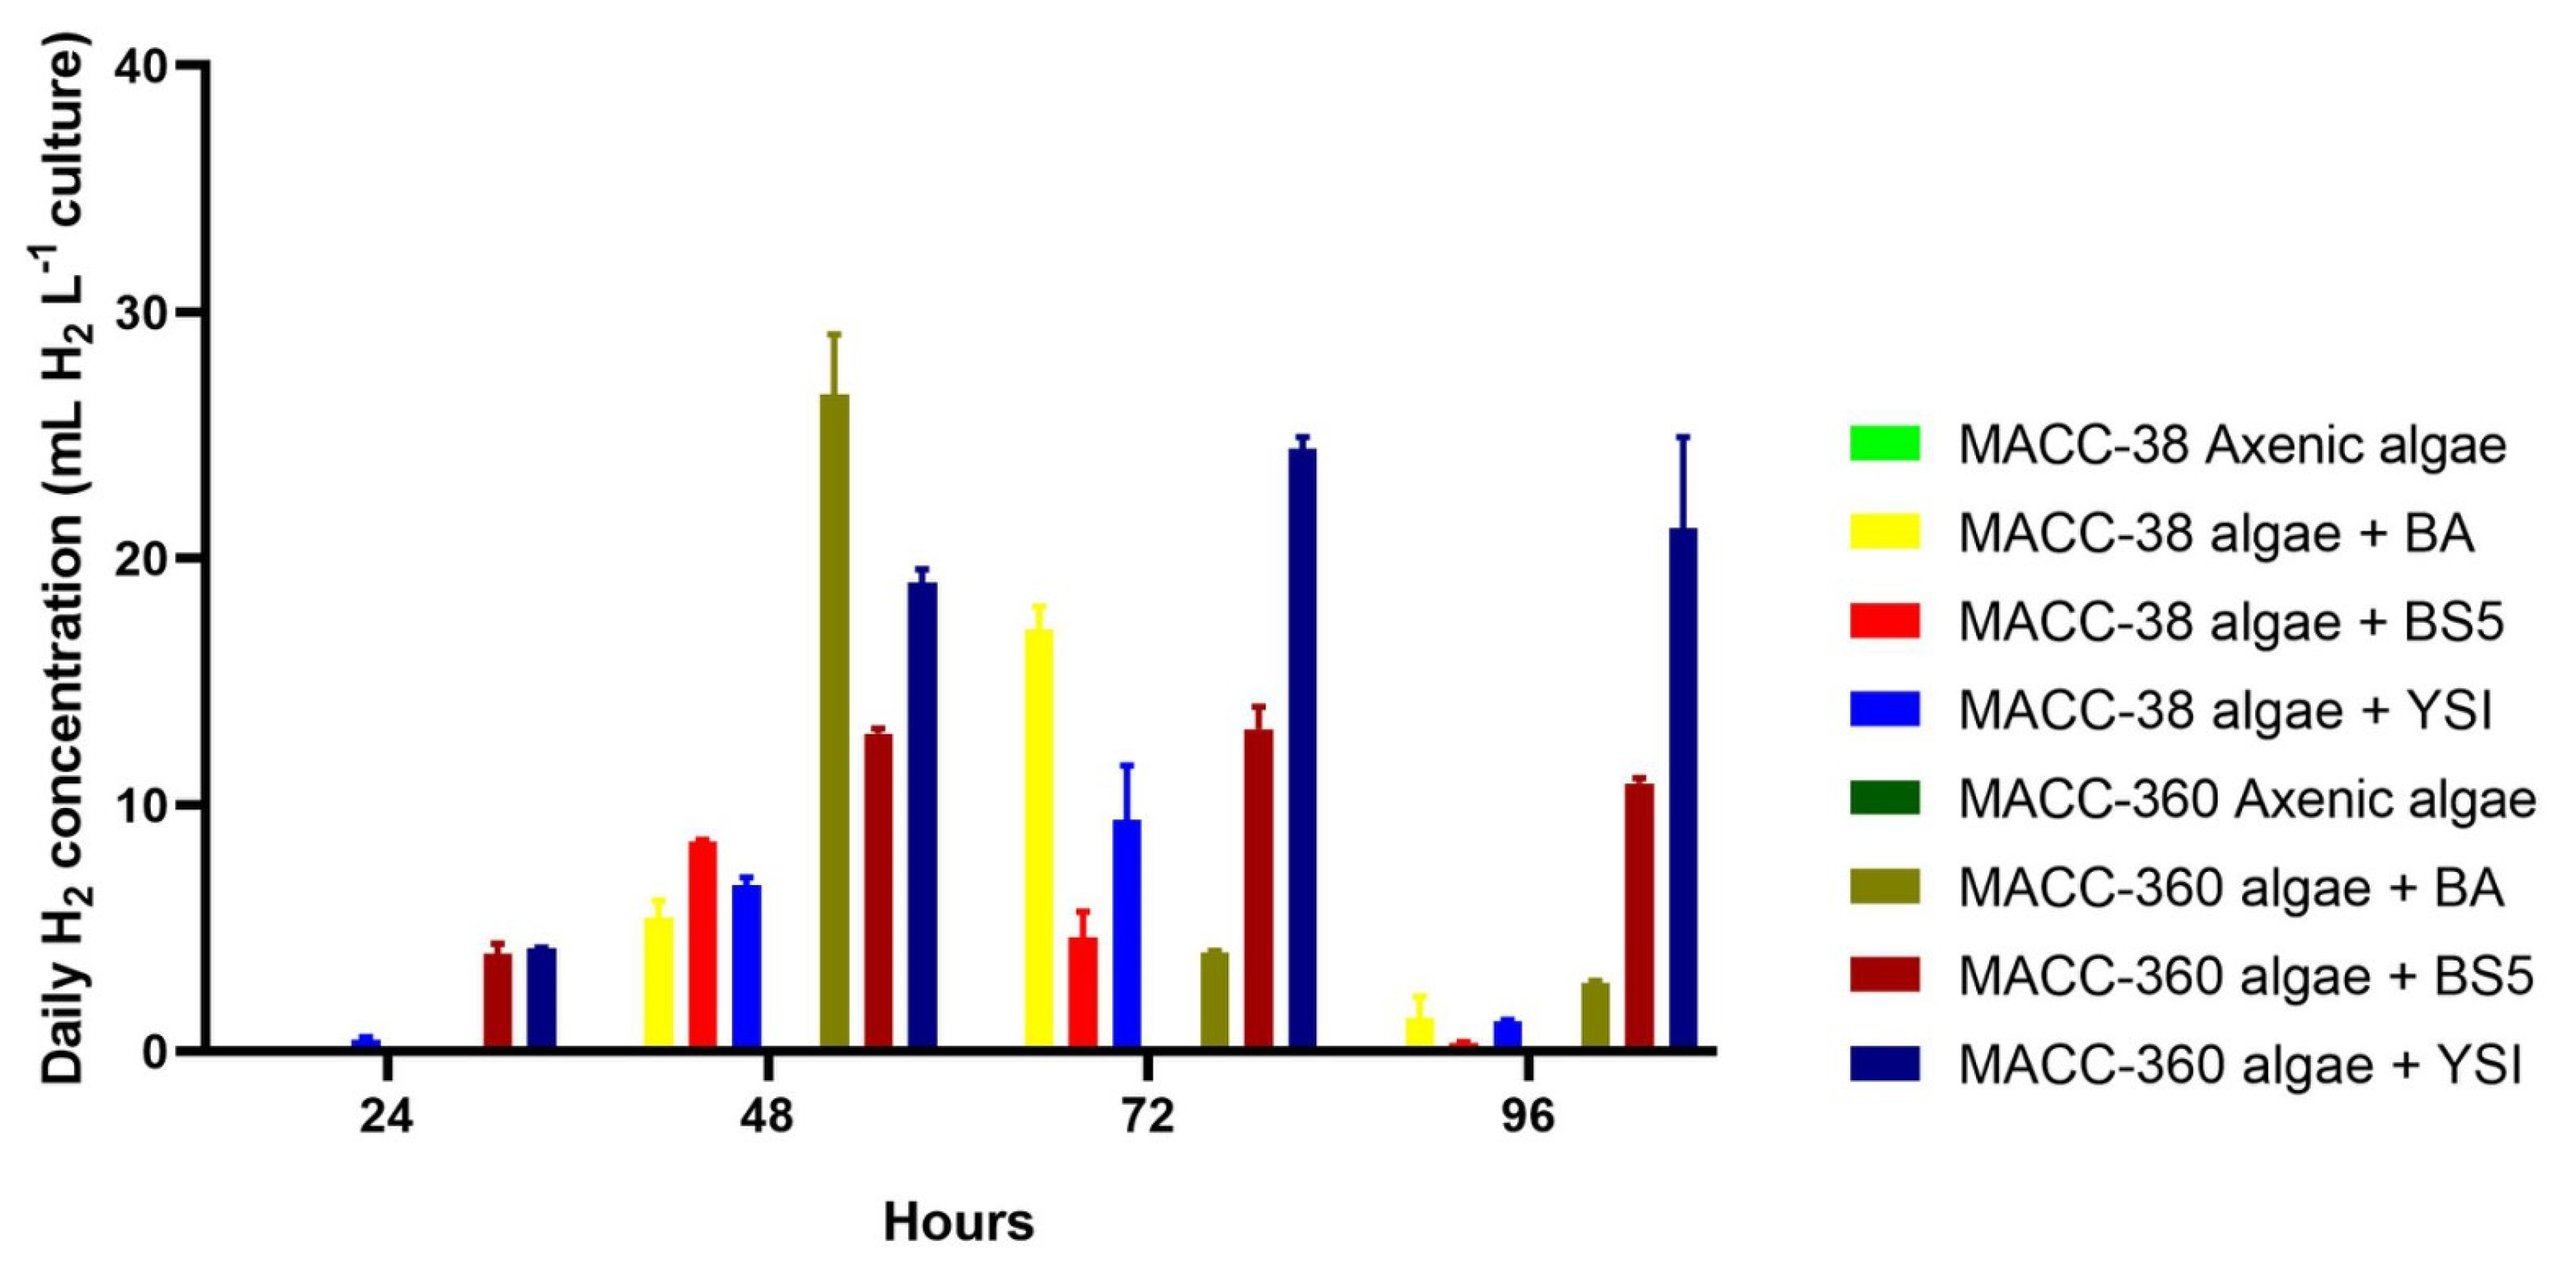
3.3. Algal Hydrogen Production

The accumulated algal hydrogen production values were influenced by all bacterial partners. B. amyloliquefaciens exerted the greatest effect, while B. mycoides and B. cereus bacterial partners had rather moderate promoting effects on the selected green algae to accumulate hydrogen. Both Chlorella algae produced around 40 mL H2 L−1 in co-cultures with B. amyloliquefaciens, while only around 25 mL H2 L−1 were produced by these algae when the other Bacillus partners were applied in the co-cultures (Figure 7A).
Bacterial respiration was shown to be linked to algal hydrogen production; hydrogen evolved immediately when the oxygen level decreased in the headspace and dissolved when the oxygen level decreased in the solution (Figure 7B). B. cereus in both Chlorella co-cultures and B. mycoides in co-culture with Chlorella sp. MACC-360 decreased the headspace oxygen level from 21% to 3% by the end of the 2nd day, while B. amyloliquefaciens showed a lower respiration rate when co-cultured with the algal strains. It is important to note that axenic algae cultures maintained high headspace oxygen content due to active photosynthesis and no decrease was observed in the headspace oxygen; therefore, no algal hydrogen production could be detected in the axenic algal cultures (Figure 7A–C).
Daily hydrogen data were measured every 24 h. Again, the axenic Chlorella strains did not produce any hydrogen in the SWW medium; this served as a baseline for the co-culture production data (Figure 8.) Chlorella sp. MACC-360 produced higher amounts of hydrogen compared with Chlorella sp. MACC-38 when co-cultivated with the Bacillus bacterial partners (Figure 8). The only exception was observed on the 3rd day: the Chlorella sp. MACC-38–B. amyloliquefaciens co-culture produced a higher amount of hydrogen compared with its Chlorella sp. MACC-360–B. amyloliquefaciens counterpart. The maximum daily hydrogen production was observed in the Chlorella sp. MACC-360–B. amyloliquefaciens co-culture on the 2nd day when a daily hydrogen amount of 26.7 mL L−1 culture was measured in the headspace of this algal–bacterial co-culture cultivated in SWW. Since the sum of the daily hydrogen productions exceeded the total accumulated hydrogen amounts measured at the end of the 4th day of cultivation, it can be concluded that accumulated hydrogen inhibited further hydrogen production, which is a known phenomenon [17]. This difference was most visible in the case of the Chlorella sp. MACC-360–B. cereus co-culture, where the sum of the daily hydrogen productions (68.9 mL H2 L−1 culture) was 3.8 times higher compared with the total accumulated hydrogen (in 96 h) measured in the same co-culture. Although the highest daily hydrogen production was achieved by the Chlorella sp. MACC-360–B. amyloliquefaciens co-culture, the most balanced daily production was recorded for the Chlorella sp. MACC-360–B. cereus co-culture, since this combination resulted in a daily average of 22 mL hydrogen with only minor deviations in a 3-day-long period between day 2 and day 4. Similarly, the daily production of the Chlorella sp. MACC-360–B. mycoides co-culture was quite stable, with a somewhat lower average daily production value of 15 mL over these three days. The generally lower daily hydrogen production level of Chlorella sp. MACC-38 was less influenced by its specific Bacillus partners.

4. Discussion

Interactions between eukaryotic green algae and bacteria are ubiquitous in natural ecosystems, and some of these interactions have been shown to be suitable for utilization in biohydrogen production [5,10,12,34,48]. Using algal–bacterial consortia has a number of advantages over axenic algae or pure bacterial cultures for biohydrogen evolution [10]. Appropriately chosen and applied heterotrophic bacterial partners share nutrients and vitamins with the eukaryotic alga partner and increase algal photosynthetic efficiency by directly respiring the evolved photosynthetic oxygen [33]. The bacterial partners strongly contribute to the maintenance of the anaerobic microenvironment necessary for the activation and function of the algal hydrogenase enzymes. Members of the Bacillus genus are among the most studied bacteria; they have essential functions in the soil (e.g., mineralization of phosphorus and other nutrients; phytohormone production; and production of siderophores, antimicrobial compounds, and hydrolytic enzymes) that facilitate plant growth promotion [37,38,39]. Certain Bacillus species were also shown to be suitable for hydrogen production: the bacterial cultures of Bacillus thuringiensis strain EGU45 and Bacillus amyloliquefaciens strain CD16 produced 2.4–3.0 L H2/day/L during a 60 days continuous culture system [35]. As wastewater is considered a potential substrate for biohydrogen production, both bacterial and algal–bacterial systems have been investigated in synthetic and real wastewater [49,50,51]. Tests have been conducted in various types of synthetic wastewater (SWW) to investigate the biomass yield and hydrogen productivity potential of various mono- and co-cultures as well as complex microbial communities [20,52,53].
The present study investigated engineered Chlorella–Bacillus co-cultures in sterile synthetic wastewater. Two eukaryotic green algal strains were selected for the investigation, Chlorella sp. MACC-360 and Chlorella sp. MACC-38, both being robust green algae capable of growth in various types of wastewater. Chlorella sp. MACC-360 has been investigated in detail previously [54,55], while the characteristics of Chlorella sp. MACC-38 have not yet been published. The average cell size values represent the main difference between the two Chlorella species, as the average cell size of MACC-38 alga is significantly larger compared with that of MACC-360 when grown in a TAP medium under optimal conditions. As partner bacteria, three different Bacillus species were selected for the co-culture experiments in SWW. Bacillus amyloliquefaciens (DSM 1060) was used in our previous starch-to-hydrogen conversion study [20], while Bacillus mycoides and Bacillus cereus were isolated by our research group from soil. Despite the largely different average cell sizes of the two algae strains, no significant differences were observed in the cell number of the algal strains grown in SWW either in axenic or in co-cultures.
Eukaryotic green algae are capable of hydrogen production through their Fe-Fe hydrogenase enzymes. Multiple pathways exist for hydrogen production in microalgae, as described for the model alga C. reinhardtii [28,56,57]. The PSII (Photosystem II)-dependent hydrogen production pathway (or direct photolysis) is directly connected to the water-splitting step of photosynthesis in which electrons derived from water splitting are channeled through the whole photosynthetic electron chain to the hydrogenase enzymes. The PSII-independent hydrogen production (also called photofermentation or indirect photolysis) utilizes only PSI (Photosystem I); electrons derived from storage materials (mainly starch) are fed to the plastoquinone pool by the plastoquinone-reducing Type II NAD(P)H dehydrogenase enzyme (NDA2), then go through PSI to the ferredoxin and then to the hydrogenase enzymes. The third possibility for the algae to produce hydrogen is performing simple dark fermentation. In this case, some portion of the fixed carbon (again, mainly starch in green algae) is simply metabolized in a fermentative way and a certain fraction of the electrons derived from pyruvate is directly fed to the ferredoxin through the function of the pyruvate-ferredoxin oxidoreductase [58]. In our present study, the ratios of the various hydrogen production pathways were not investigated.
Differences were detected in the daily hydrogen production patterns of the two algal strains cultivated in SWW. As was expected, the axenic algal cultures did not produce any hydrogen. The presence of bacterial partners was essential to induce hydrogen production of Chlorella species [10,20]. Chlorella sp. MACC-360 produced a higher daily amount of hydrogen compared with that of Chlorella sp. MACC-38 when co-cultivated with any of the bacterial partners. Interestingly, Chlorella sp. MACC-38 had a significantly higher chlorophyll (a + b) content compared with that of Chlorella sp. MACC-360. This difference was clearly visible both in axenic algae cultures and in algal–bacterial co-cultures throughout the whole period (96 h) of the experiments. This was in agreement with the hydrogen production data, as the higher photosynthetic activity of Chlorella sp. MACC-38 resulted in higher algal biomass (Figure 1), while in Chlorella sp. MACC-360, a supposedly higher amount of electrons was channeled to the hydrogenase enzymes, and fewer photosynthetic electrons were utilized for carbon fixation through the ferredoxin-NADP-reductase (FNR).
Only minor differences were detected for the two Chlorella strains in the accumulated hydrogen production throughout the 96-h-long experiment (Figure 8A). Both algae produced the highest amount of accumulated hydrogen when co-cultured with B. amyloliquefaciens, while the least hydrogen was produced by the algae when co-cultured with B. cereus. Daily hydrogen production data revealed more specific and interesting differences between the co-cultures (Figure 8). Again, in general, Chlorella sp. MACC-360 performed better in daily hydrogen production than Chlorella sp. MACC-38. Chlorella sp. MACC-360 reached its highest daily hydrogen yield on day 2 and relatively high daily algal hydrogen yields were observed on the following (3rd and 4th) days as well. Chlorella sp. MACC-38 showed its highest daily hydrogen production on day 3 (which was still significantly lower compared with the peak of Chlorella sp. MACC-360 on day 2), then this alga practically ceased producing hydrogen, though its biomass increased much faster than that of Chlorella sp. MACC-360 (Figure 1). The specific effects of the various Bacillus partners on the daily algal hydrogen production were analyzed in detail (Figure 8). The day 2 peak of Chlorella sp. MACC-360 was the most evident when the alga was co-cultured with B. amyloliquefaciens. However, the most stable and sustainable daily Chlorella sp. MACC-360 hydrogen production was achieved when B. cereus was the bacterial partner (similarly high algal hydrogen yields were observed every day starting on day 2). The daily hydrogen production of Chlorella sp. MACC-360 was also quite stable in co-culture with B. mycoides, though this production rate remained stable at a relatively low level. The comparably lower daily hydrogen yields of Chlorella sp. MACC-38 were less influenced by the bacterial partners, but the highest MACC-38 hydrogen yields were achieved when B. amyloliquefaciens was the applied bacterial partner.
Algal exopolysaccharides can be directly utilized by bacteria for growth, and EPSs are often produced by various bacteria as well [59]. The secreted EPSs might attract or repel other microorganisms and trigger biological responses. The presence of algal EPSs might also help in collecting beneficial bacteria in the environment [47]. Studies investigating the biostimulatory effects of secreted Chlorella polysaccharides have shown that these compounds might positively affect bacterial growth and biomass [19].
Interesting and potentially exploitable exopolysaccharide production patterns were also observed in the various co-cultures in our study. Even the axenic Chlorella cultures produced EPSs, as was confirmed by fluorescent staining; however, interesting changes were observed in the structure of the generated EPSs in response to bacterial co-cultivations. The EPSs produced by the axenic Chlorella strains contained α-d-mannose or α-d-glucose sugar residues since the fluorescent dye Concanavalin A (Con A) possesses a remarkably specific capacity to bind primarily to these residues within the macromolecules [60,61]. The EPSs showing green fluorescence (stained by Con A) and thereby containing α-D sugars was only detected in the Chlorella sp. MACC-38–B. amyloliquefaciens co-culture. The green fluorescence disappeared in all other algal–bacterial co-cultures. Thus, EPSs with altered structures were identified in the co-cultures of Chlorella sp. MACC-38 when cultivated either with B. cereus or B. mycoides and in the co-culture of Chlorella sp. MACC-360 when co-cultured with B. cereus. The altered structures of the EPSs were indicated by differential staining in which the extracellular matrices of these specific co-cultures were stained blue with CFW dye, which specifically binds to the β-D glucopyranose polysaccharides within complex macromolecules. It is significant to note that EPSs could not be detected at all in Chlorella sp. MACC-360 co-cultures except when B. cereus was the bacterial partner. SEM analysis also confirmed the extensive and differential EPS production of the axenic algal strains and certain previously discussed co-cultures.

5. Conclusions

Hydrogen is a promising candidate for gradually replacing fossil fuels. Biohydrogen production is still far from being economically feasible; however, intensive research is being conducted on green algae as potential future producers of this clean and environmentally friendly energy carrier. The application of algal–bacterial consortia for algal biohydrogen evolution has a number of advantages over using axenic algal cultures. Two robust Chlorella green algal strains in combination with three Bacillus bacterial partners were tested for increased hydrogen yield. Chlorella sp. MACC-360 in co-culture with B. amyloliquefaciens proved to be the most efficient combination in this study. It will be important in the future to investigate the molecular mechanism of algal hydrogen production induced by bacterial co-cultivation. (Meta)transcriptome and metabolome analyses are planned to clarify the contribution of the various algal hydrogen production pathways (photolytic and fermentative pathways). It is important to note that bacterial partners often induce the production of co-culture-specific algal biomolecules. Certain macromolecules (exopolysaccharides in the present study) might be of high relevance in specific further applications, such as plant biostimulation. Thus, the carefully designed valorization of the specific algal–bacterial biomass can strongly contribute to the economic feasibility of algal biohydrogen.

Author Contributions

B.H. composed the manuscript and executed the experiments; G.H. participated in the experimental work; A.F. performed all microscopy analyses; and G.M. designed the study, discussed the literature, and finalized the manuscript. All authors have read and agreed to the published version of the manuscript.

Funding

This research was funded by the following international and domestic funds: Lendület-Programme (GM) of the Hungarian Academy of Sciences (LP2020-5/2020) and the Széchenyi Plan Plus National Laboratory Programme (National Laboratory for Water Science and Water Security, RRF-2.3.1-21-2022-00008).

Institutional Review Board Statement

Not applicable.

Informed Consent Statement

Not applicable.

Data Availability Statement

The data presented in this study are available in the main text and in the figures.

Conflicts of Interest

The authors declare no conflict of interest.

References

  1. Demirbas, A.; Demirbas, F.M. Importance of Algae Oil as a Source of Biodiesel. Energy Convers. Manag. 2011, 52, 163–170. [Google Scholar] [CrossRef]
  2. Wang, Y.; Yang, H.; Zhang, X.; Han, F.; Tu, W.; Yang, W. Microalgal Hydrogen Production. Small Methods 2020, 4, 1900514. [Google Scholar] [CrossRef]
  3. Wang, J.; Yin, Y. Fermentative Hydrogen Production Using Pretreated Microalgal Biomass as Feedstock. Microb. Cell Fact. 2018, 17, 22. [Google Scholar] [CrossRef] [PubMed]
  4. Redding, K.E.; Appel, J.; Boehm, M.; Schuhmann, W.; Nowaczyk, M.M.; Yacoby, I.; Gutekunst, K. Advances and Challenges in Photosynthetic Hydrogen Production. Trends Biotechnol. 2022, 40, 1313–1325. [Google Scholar] [CrossRef] [PubMed]
  5. Ghirardi, M.L.; Dubini, A.; Yu, J.; Maness, P.C. Photobiological Hydrogen-Producing Systems. Chem. Soc. Rev. 2009, 38, 52–61. [Google Scholar] [CrossRef]
  6. Allakhverdiev, S.I.; Thavasi, V.; Kreslavski, V.D.; Zharmukhamedov, S.K.; Klimov, V.V.; Ramakrishna, S.; Los, D.A.; Mimuro, M.; Nishihara, H.; Carpentier, R. Photosynthetic Hydrogen Production. J. Photochem. Photobiol. C Photochem. Rev. 2010, 11, 101–113. [Google Scholar] [CrossRef]
  7. Fan, X.; Wang, H.; Guo, R.; Yang, D.; Zhang, Y.; Yuan, X.; Qiu, Y.; Yang, Z.; Zhao, X. Comparative Study of the Oxygen Tolerance of Chlorella Pyrenoidosa and Chlamydomonas Reinhardtii CC124 in Photobiological Hydrogen Production. Algal Res. 2016, 16, 240–244. [Google Scholar] [CrossRef]
  8. Kruse, O.; Hankamer, B. Microalgal Hydrogen Production. Curr. Opin. Biotechnol. 2010, 21, 238–243. [Google Scholar] [CrossRef]
  9. Lubitz, W.; Ogata, H.; Rüdiger, O.; Reijerse, E. Hydrogenases. Chem. Rev. 2014, 114, 4081–4148. [Google Scholar] [CrossRef]
  10. Lakatos, G.; Deák, Z.; Vass, I.; Rétfalvi, T.; Rozgonyi, S.; Rákhely, G.; Ördög, V.; Kondorosi, É.; Maróti, G. Bacterial Symbionts Enhance Photo-Fermentative Hydrogen Evolution of Chlamydomonas Algae. Green Chem. 2014, 16, 4716–4727. [Google Scholar] [CrossRef]
  11. Kargi, F.; Pamukoglu, M.Y. Dark Fermentation of Ground Wheat Starch for Bio-Hydrogen Production by Fed-Batch Operation. Int. J. Hydrogen Energy 2009, 34, 2940–2946. [Google Scholar] [CrossRef]
  12. Akano, T.; Miura, Y.; Fukatsu, K.; Mlyasaka, H.; Ikuta, Y.; Matsumoto, H.; Hamasaki, A.; Shioji, N.; Mlzoguchi, T.; Yagi, K.; et al. Hydrogen Production by Photosynthetic Microorganisms. Appl. Biochem. Biotechnol. Part A Enzym. Eng. Biotechnol. 1996, 57–58, 677–688. [Google Scholar] [CrossRef]
  13. Masojídek, J.; Torzillo, G.; Koblízek, M. Photosynthesis in Microalgae. In Handbook of Microalgal Culture: Applied Phycology and Biotechnology, 2nd ed.; John Wiley & Sons: Hoboken, NJ, USA, 2013; pp. 21–36. [Google Scholar] [CrossRef]
  14. Khoeyi, Z.A.; Seyfabadi, J.; Ramezanpour, Z. Effect of Light Intensity and Photoperiod on Biomass and Fatty Acid Composition of the Microalgae, Chlorella vulgaris. Aquac. Int. 2012, 20, 41–49. [Google Scholar] [CrossRef]
  15. Wirth, R.; Lakatos, G.; Böjti, T.; Maróti, G.; Bagi, Z. Anaerobic gaseous biofuel production using microalgal biomass—A review. Anaerobe 2018, 52, 1–8. [Google Scholar] [CrossRef]
  16. Wirth, R.; Lakatos, G.; Maróti, G.; Bagi, Z.; Minárovics, J.; Nagy, K.; Kondorosi, É.; Rákhely, G.; Kovács, K.L. Exploitation of Algal-Bacterial Associations in a Two-Stage Biohydrogen and Biogas Generation Process. Biotechnol. Biofuels. 2015, 8, 59. [Google Scholar] [CrossRef]
  17. Lakatos, G.; Balogh, D.; Farkas, A.; Ördög, V.; Tamás, P.; Bíró, T.; Maróti, G. Factors in Fl Uencing Algal Photobiohydrogen Production in Algal-Bacterial Co-Cultures. Algal Res. 2017, 28, 161–171. [Google Scholar] [CrossRef]
  18. Gorman, D.S.; Levine, R.P. Cytochrome < if and Plastocyanin: Their Sequence in the Photosynthetic Electron Transport Chain of Chlamydomonas Reinhardi. Proc. Natl. Acad. Sci. USA 1965, 54, 1665–1669. [Google Scholar] [CrossRef]
  19. El-Naggar, N.E.A.; Hussein, M.H.; Shaaban-Dessuuki, S.A.; Dalal, S.R. Production, Extraction and Characterization of Chlorella Vulgaris Soluble Polysaccharides and Their Applications in AgNPs Biosynthesis and Biostimulation of Plant Growth. Sci. Rep. 2020, 10, 3011. [Google Scholar] [CrossRef]
  20. Hupp, B.; Pap, B.; Farkas, A.; Maróti, G. Development of a Microalgae-Based Continuous Starch-to-Hydrogen Conversion Approach. Fermentation 2022, 8, 294. [Google Scholar] [CrossRef]
  21. Sharma, R. Effects of Culture Conditions on Growth and Biochemical Profile of Chlorella vulgaris. J. Plant Pathol. Microbiol. 2012, 3, 1–6. [Google Scholar] [CrossRef]
  22. Yuan, Q.; Li, H.; Wei, Z.; Lv, K.; Gao, C.; Liu, Y.; Zhao, L. Isolation, Structures and Biological Activities of Polysaccharides from Chlorella: A Review. Int. J. Biol. Macromol. 2020, 163, 2199–2209. [Google Scholar] [CrossRef]
  23. Singh, R.; Parihar, P.; Singh, M.; Bajguz, A.; Kumar, J.; Singh, S.; Singh, V.P.; Prasad, S.M. Uncovering Potential Applications of Cyanobacteria and Algal Metabolites in Biology, Agriculture and Medicine: Current Status and Future Prospects. Front. Microbiol. 2017, 8, 515. [Google Scholar] [CrossRef] [PubMed]
  24. Carillo, P.; Ciarmiello, L.F.; Woodrow, P.; Corrado, G.; Chiaiese, P.; Rouphael, Y. Enhancing Sustainability by Improving Plant Salt Tolerance through Macro-and Micro-Algal Biostimulants. Biology 2020, 9, 253. [Google Scholar] [CrossRef] [PubMed]
  25. Liu, X.; He, X.; Mao, W.; Cao, S.; Qin, L.; He, M.; He, X.; Mao, W. Anticoagulant Properties of a Green Algal Rhamnan-Type Sulfated Polysaccharide and Its Low-Molecular-Weight Fragments Prepared by Mild Acid Degradation. Mar. Drugs 2018, 16, 445. [Google Scholar] [CrossRef] [PubMed]
  26. Zhang, J.; Liu, L.; Ren, Y.; Chen, F. Characterization of Exopolysaccharides Produced by Microalgae with Antitumor Activity on Human Colon Cancer Cells. Int. J. Biol. Macromol. 2019, 128, 761–767. [Google Scholar] [CrossRef]
  27. Mousavian, Z.; Safavi, M.; Azizmohseni, F.; Hadizadeh, M.; Mirdamadi, S. Characterization, Antioxidant and Anticoagulant Properties of Exopolysaccharide from Marine Microalgae. AMB Express 2022, 12, 27. [Google Scholar] [CrossRef]
  28. Dubini, A.; Ghirardi, M.L. Engineering Photosynthetic Organisms for the Production of Biohydrogen. Photosynth. Res. 2015, 123, 241–253. [Google Scholar] [CrossRef]
  29. Boboescu, I.Z.; Gherman, V.D.; Lakatos, G.; Pap, B.; Bíró, T.; Maróti, G. Surpassing the Current Limitations of Biohydrogen Production Systems: The Case for a Novel Hybrid Approach. Bioresour. Technol. 2016, 204, 192–201. [Google Scholar] [CrossRef]
  30. Xiao, R.; Zheng, Y. Overview of Microalgal Extracellular Polymeric Substances (EPS) and Their Applications. Biotechnol. Adv. 2016, 34, 1225–1244. [Google Scholar] [CrossRef]
  31. Zhang, B.; Li, W.; Guo, Y.; Zhang, Z.; Shi, W.; Cui, F.; Lens, P.N.L.; Tay, J.H. Microalgal-Bacterial Consortia: From Interspecies Interactions to Biotechnological Applications. Renew. Sustain. Energy Rev. 2020, 118, 109563. [Google Scholar] [CrossRef]
  32. Buchan, A.; LeCleir, G.R.; Gulvik, C.A.; González, J.M. Master Recyclers: Features and Functions of Bacteria Associated with Phytoplankton Blooms. Nat. Rev. Microbiol. 2014, 12, 686–698. [Google Scholar] [CrossRef]
  33. Yao, S.; Lyu, S.; An, Y.; Lu, J.; Gjermansen, C.; Schramm, A. Microalgae–Bacteria Symbiosis in Microalgal Growth and Biofuel Production: A Review. J. Appl. Microbiol. 2019, 126, 359–368. [Google Scholar] [CrossRef]
  34. Fakhimi, N.; Dubini, A.; Tavakoli, O.; González-Ballester, D. Acetic Acid Is Key for Synergetic Hydrogen Production in Chlamydomonas-Bacteria Co-Cultures. Bioresour. Technol. 2019, 289, 121648. [Google Scholar] [CrossRef]
  35. Prakash, J.; Sharma, R.; Patel, S.K.S.; Kim, I.W.; Kalia, V.C. Bio-Hydrogen Production by Co-Digestion of Domestic Wastewater and Biodiesel Industry Effluent. PLoS ONE. 2018, 13, e0199059. [Google Scholar] [CrossRef]
  36. Mazareli, R.C.d.S.; Sakamoto, I.K.; Silva, E.L.; Varesche, M.B.A. Bacillus sp. Isolated from Banana Waste and Analysis of Metabolic Pathways in Acidogenic Systems in Hydrogen Production. J. Environ. Manag. 2019, 247, 178–186. [Google Scholar] [CrossRef]
  37. Goswami, D.; Thakker, J.N.; Dhandhukia, P.C. Portraying Mechanics of Plant Growth Promoting Rhizobacteria (PGPR): A Review. Cogent Food Agric. 2016, 2, 1127500. [Google Scholar] [CrossRef]
  38. Chen, X.H.; Koumoutsi, A.; Scholz, R.; Eisenreich, A.; Schneider, K.; Heinemeyer, I.; Morgenstern, B.; Voss, B.; Hess, W.R.; Reva, O.; et al. Comparative Analysis of the Complete Genome Sequence of the Plant Growth-Promoting Bacterium Bacillus amyloliquefaciens FZB42. Nat. Biotechnol. 2007, 25, 1007–1014. [Google Scholar] [CrossRef]
  39. Choi, S.K.; Jeong, H.; Kloepper, J.W.; Ryu, C.M. Genome Sequence of Bacillus Amyloliquefaciens GB03, an Active Ingredient of the First Commercial Biological Control Product. Genome Announc. 2014, 2, e01092-14. [Google Scholar] [CrossRef]
  40. Liu, H.; Prajapati, V.; Prajapati, S.; Bais, H.; Lu, J. Comparative Genome Analysis of Bacillus amyloliquefaciens Focusing on Phylogenomics, Functional Traits, and Prevalence of Antimicrobial and Virulence Genes. Front. Genet. 2021, 12, 724217. [Google Scholar] [CrossRef]
  41. Di Franco, C.; Beccari, E.; Santini, T.; Pisaneschi, G.; Tecce, G. Colony Shape as a Genetic Trait in the Pattern-Forming Bacillus Mycoides. BMC Microbiol. 2002, 2, 33. [Google Scholar] [CrossRef]
  42. Bottone, E.J. Bacillus Cereus, a Volatile Human Pathogen. Clin. Microbiol. Rev. 2010, 23, 382–398. [Google Scholar] [CrossRef] [PubMed]
  43. Vilain, S.; Luo, Y.; Hildreth, M.B.; Brözel, V.S. Analysis of the Life Cycle of the Soil Saprophyte Bacillus cereus in Liquid Soil Extract and in Soil. Appl. Environ. Microbiol. 2006, 72, 4970–4977. [Google Scholar] [CrossRef] [PubMed]
  44. Toole, G.O.; Kaplan, H.B.; Kolter, R. Biofillm Formation as Microbial Development. Annu. Rev. Microbiol. 2000, 54, 49–79. [Google Scholar] [CrossRef] [PubMed]
  45. Rani, V.; Maróti, G. Light-Dependent Nitrate Removal Capacity of Green Microalgae. Int. J. Mol. Sci. 2022, 24, 77. [Google Scholar] [CrossRef] [PubMed]
  46. Lichtenhaler, H.K.; Wellburn, A.R. Determinations of Total Carotenoids and Chlorophylls a and b of Leaf Extracts in Different Solvents. Biochem. Soc. Trans. 1983, 11, 591–592. [Google Scholar] [CrossRef]
  47. Gitau, M.M.; Farkas, A.; Balla, B.; Ördög, V.; Futó, Z.; Maróti, G. Strain-Specific Biostimulant Effects of Chlorella and Chlamydomonas Green Microalgae on Medicago truncatula. Plants 2021, 10, 1060. [Google Scholar] [CrossRef]
  48. Fakhimi, N.; Gonzalez-Ballester, D.; Fernández, E.; Galván, A.; Dubini, A. Algae-Bacteria Consortia as a Strategy to Enhance H2 Production. Cells 2020, 9, 1353. [Google Scholar] [CrossRef]
  49. Lobos, J.; Wisniewski, C.; Heran, M.; Grasmick, A. Membrane Bioreactor Performances: Effluent Quality Ofcontinuous and Sequencing Systems for Water Reuse. Desalination 2007, 204, 39–45. [Google Scholar] [CrossRef]
  50. Orhon, D.; Artan, N. Nutrient Removal Performance of a Five-Step Sequencing Batch Reactor as a Function of Wastewater Composition. Process Biochem. 2006, 41, 216–220. [Google Scholar] [CrossRef]
  51. Wang, C.; Li, J.; Wang, B.; Zhang, G. Development of an Empirical Model for Domestic Wastewater Treatment by Biological Aerated Filter. Process Biochem. 2006, 41, 778–782. [Google Scholar] [CrossRef]
  52. El Moussaoui, T.; Kessraoui, A.; Ouazzani, N.; Seffen, M.; Mandi, L. Synthetic Urban Wastewater Treatment by an Activated Sludge Reactor: Evolution of Bacterial Biomass and Purifying Efficiency. J. Mater. Environ. Sci. 2018, 9, 817–827. [Google Scholar]
  53. Yerushalmi, L.; Alimahmoodi, M.; Mulligan, C.N. Treatment of Synthetic Wastewater and Hog Waste with Reduced Sludge Generation by the Multi-Environment BioCAST Technology. Water Sci. Technol. 2013, 67, 587–593. [Google Scholar] [CrossRef]
  54. Wirth, R.; Pap, B.; Böjti, T.; Shetty, P.; Lakatos, G.; Bagi, Z.; Kovács, K.L.; Maróti, G. Chlorella vulgaris and Its Phycosphere in Wastewater: Microalgae-Bacteria Interactions During Nutrient Removal. Front. Bioeng. Biotechnol. 2020, 8, 557572. [Google Scholar] [CrossRef]
  55. Rani, V.; Maróti, G. Assessment of Nitrate Removal Capacity of Two Selected Eukaryotic Green Microalgae. Cells 2021, 10, 2490. [Google Scholar] [CrossRef]
  56. Grossman, A.R.; Catalanotti, C.; Yang, W.; Dubini, A.; Magneschi, L.; Subramanian, V.; Posewitz, M.C.; Seibert, M. Multiple Facets of Anoxic Metabolism and Hydrogen Production in the Unicellular Green Alga Chlamydomonas reinhardtii. New Phytol. 2011, 190, 279–288. [Google Scholar] [CrossRef]
  57. Ghirardi, M.L.; King, P.; Kosourov, S.; Forestier, M.; Zhang, L.; Seibert, M. Development of Algal Systems for Hydrogen Photoproduction: Addressing the Hydrogenase Oxygen-Sensitivity Problem. In Artificial Photosynthesis; Wiley-VCH: Weinheim, Germany, 2006; pp. 211–227. [Google Scholar] [CrossRef]
  58. Noth, J.; Krawietz, D.; Hemschemeier, A.; Happe, T. Pyruvate:Ferredoxin Oxidoreductase Is Coupled to Light-Independent Hydrogen Production in Chlamydomonas reinhardtii. J. Biol. Chem. 2013, 288, 4368–4377. [Google Scholar] [CrossRef]
  59. Ortiz-Moreno, M.L.; Sandoval-Parra, K.X.; Solarte-Murillo, L.V. Chlorella, a potential biofertilizer? Orinoquia 2019, 23, 71–78. [Google Scholar] [CrossRef]
  60. Kuhn, D.M.; Chandra, J.; Mukherjee, P.K.; Ghannoum, M.A. Comparison of Biofilms Formed by Candidaalbicans and Candidaparapsilosis on Bioprosthetic Surfaces. Society 2002, 70, 878–888. [Google Scholar]
  61. Chen, M.Y.; Lee, D.J.; Tay, J.H. Distribution of Extracellular Polymeric Substances in Aerobic Granules. Appl. Microbiol. Biotechnol. 2007, 73, 1463–1469. [Google Scholar] [CrossRef]
Figure 1. Total mono- and co-culture biomass data (A), bacterial CFU data (B), algae cell number data (C), and chlorophyll content (D). Chlorella sp. MACC-360 and Chlorella sp. MACC-38 algal strains were cultivated as axenic mono- and algal–bacterial co-cultures. B. amyloliquefaciens (BA), B. mycoides (BS5), and B. cereus (YSI) were the bacterial partners in co-cultures. Error bars are standard deviations based on three replicates.
Fermentation 09 00424 g001
Figure 2. Chlorella sp. MACC-38 (A) and Chlorella sp. MACC-360 (B) axenic mono- and bacterial co-cultures in Hypo-Vial bottles. Axenic algae and algal–bacterial co-cultures are shown. The first bottles on each day are the axenic algae, the second bottles are the algae co-cultured with B. amyloliquefaciens, the third bottles are the algae co-cultured with B. mycoides, and the fourth bottles on each day are the algae co-cultured with B. cereus.
Fermentation 09 00424 g002
Figure 3. SEM analysis of pure bacterial suspensions. B. amyloliquefaciens (BA), B. mycoides (BS5), and B. cereus (YSI) cultures were observed with various magnifications. Images were made on the 2nd day of cultivation. (Panel (A)): 250× magnification, scale bars: 100 μm; (Panel (B)): 1500× magnification, scale bars: 10 μm; (Panel (C)): 10,000× magnification, scale bars: 1 μm.
Fermentation 09 00424 g003
Figure 4. SEM analysis of axenic Chlorella sp. MACC-360 and its bacterial co-cultures. B. amyloliquefaciens (BA), B. mycoides (BS5), and B. cereus (YSI) were the applied bacterial partners. Images were made on the 2nd day of cultivation. (Panel (A)): 250× magnification, scale bars: 100 μm; (Panel (B)): 1500× magnification, scale bars: 10 μm; (Panel (C)): 10,000× magnification, scale bars: 1 μm.
Fermentation 09 00424 g004
Figure 5. SEM analysis of axenic Chlorella sp. MACC-38 and its bacterial co-cultures. B. amyloliquefaciens (BA), B. mycoides (BS5), and B. cereus (YSI) were the applied bacterial partners. Images were made on the 2nd day of cultivation. (Panel (A)): 250× magnification, scale bars: 100 μm; (Panel (B)): 1500× magnification, scale bars: 10 μm; (Panel (C)): 10,000× magnification, scale bars: 1 μm.
Fermentation 09 00424 g005
Figure 6. CLSM analyses of pure bacteria (B. amyloliquefaciens (BA), B. mycoides (BS5), and B. cereus (YSI)), axenic algal strains (Chlorella sp. MACC-360 and Chlorella sp. MACC-38), and algal–bacterial co-cultures. All samples were stained with CFW (blue fluorescence specific for β-D sugar residues) and Con A (green fluorescence specific for α-D sugar residues). Chloroplast autofluorescence of live cells is indicated by red color. Scale bars in all pictures represent 10 μm.
Fermentation 09 00424 g006
Figure 7. Accumulated hydrogen yields measured every day (A), dynamics of headspace oxygen concentrations (B), and final accumulated hydrogen yields at the end of the experiment (C). Headspace hydrogen and oxygen yields of Chlorella sp. MACC-360 and Chlorella sp. MACC-38 axenic algae and algal–bacterial co-cultures were measured every 24th h. Bacterial partners were B. amyloliquefaciens (BA), B. mycoides (BS5), and B. cereus (YSI). Error bars show standard deviations based on three replicates.
Fermentation 09 00424 g007
Figure 8. Daily hydrogen yields of Chlorella sp. MACC-360 and Chlorella sp. MACC-38 algae in axenic mono- and bacterial co-cultures. B. amyloliquefaciens (BA), B. mycoides (BS5), and B. cereus (YSI) bacterial partners were applied. Daily hydrogen concentrations in the headspace were measured every 24th h. After each hydrogen measurement, 5 min aeration was applied by opening the bottles under a sterile hood. Error bars show standard deviations based on three replicates.
Fermentation 09 00424 g008
Disclaimer/Publisher’s Note: The statements, opinions and data contained in all publications are solely those of the individual author(s) and contributor(s) and not of MDPI and/or the editor(s). MDPI and/or the editor(s) disclaim responsibility for any injury to people or property resulting from any ideas, methods, instructions or products referred to in the content.

