Article

Techno-Economic Analysis of Macroalgae Biorefineries: A Comparison between Ethanol and Butanol Facilities

1
Green Engineering and Resources Group, Department of Chemistry and Process & Resources Engineering, University of Cantabria, 39005 Santander, Spain
2
Faculty of Mechanical Engineering, Czech Technical University in Prague, Technická 4 Prague 6, 16000 Dejvice, Czech Republic
*
Author to whom correspondence should be addressed.
Fermentation 2023, 9(4), 340; https://doi.org/10.3390/fermentation9040340
Submission received: 28 February 2023 / Revised: 26 March 2023 / Accepted: 27 March 2023 / Published: 29 March 2023
(This article belongs to the Special Issue Marine-Based Biorefinery: A Path Forward to a Sustainable Future)

Abstract

:
Ulva rigida seaweed is constituted by ulvan, which is a sulfated polysaccharide with uses in a wide variety of applications. After the ulvan-oriented extraction process, a crystalline and recalcitrant residue, the so-called pulp, appears. In this work, this residue was valorized through a multiple-stage process. The total processing of the algae consists of hot water extraction, acid hydrolysis, ABE fermentation, and distillation in order to obtain not only ulvan but also butanol and bioethanol to be used as biofuels by simulating two third-generation algae-based biorefineries in Aspen Plus v10 software. Third-generation plants do not compete with food and algae biomass, and they do not require delignification nor pretreatment steps, which are usually the bottleneck of second-generation plants. A plant producing butanol as biofuel together with diluted ulvan, acetone, and ethanol as byproducts was modelled in Aspen Plus software. Regarding the profitability of the investment, the plants producing bioethanol and butanol were economically feasible. The economic parameters for the bioethanol and butanol plants were as follows: NPV equal to 27.66 M$ and 16.67 M$, and IRR equal to 46% and 37%, respectively. The discounted return period was acceptable for these types of plants, which were 4.11 and 3.16 years for the ABE biorefinery and the bioethanol biorefinery, respectively.

1. Introduction

Land use and groundwater consumption for food, energetic, or industrial purposes are becoming a problem that will increase in the next decades. The world population is projected to reach 8.5 billion in 2030 and to increase further to 9.7 billion in 2050 and 11.2 billion by 2100 [1]. Major changes in land use that impact groundwater are taking place because of population growth, increasing food demands, and expanding biofuel cultivation [2]. While policies have focused mainly on terrestrial biomass, marine crops have long been recognized for their low land use or groundwater consumption; GHG abatement potential and their ability to absorb CO2; their efficiency in utilizing wastewater macronutrients such as nitrogen and phosphorous; their rapid growth in comparison with forestry biomass; and their low lignin content avoiding the pretreatment step, which is usually the bottleneck of second-generation lignocellulosic biorefineries [3,4]. Another advantage of algae is related to the water footprint, which is lower than other lignocellulosic resources such as sugar beet, alfalfa, sugarcane, maize, sorghum, or soybean. Algal biofuel may use 40–16,000 L of water per liter of fuel; however, this value changes dramatically if algal production is designed to use wastewater [5].
Apart from the production of biofuels, green seaweeds are cultivated mainly as a raw material for the food industry, for use as fertilizers and for the extraction of hydrocolloids or the so-called phycocolloids [6]. One of the main phycocolloids is ulvan, and it can be extracted from Ulva rigida macroalgae. Ulvan is a sulfated polysaccharide that contains L-rhamnose, D-glucose, and D-xylose in a molar ratio of 4:0.1:0.3, and uronic acids D-glucuronic and L-iduronic in a molar ratio of 1.0:0.2 [7]. Among the different sulfate polysaccharides (carragenans in red algae or fucoidans in brown algae), ulvans from green algae are by far the least studied [8,9]. Ulvan displays several physico-chemical and biological features of potential interest for food, pharmaceutical, and agricultural applications. Moreover, sulfated polysaccharides (SPs) exhibit beneficial biological activities such as anticoagulant, antiviral, antioxidative, anti-tumor, immunomodulating, antihyperlipidemic, and antihepatotoxic effects, potentiating its use in pharmaceutical application [8,10,11,12]. There is no clear consensus regarding adequate SP composition or analytical procedures. Therefore, the exact chemical structure and composition as well as the molecular weight of ulvan is not well known [13]. Such deep analysis is necessary due to the complex structure of the seaweed cell wall that apart from ulvan is composed by cellulose, glucuronan, xyloglucan, and the presence of starch inside the cell, as represented in Figure 1. Although hot water extraction at neutral pH is a selective process providing ulvan-rich extracts, this is the first time where co-elution of the heteropolysaccharides has been considered.
In this work, two different biorefinery approaches were studied. One of them produced not only ulvan but also ABE fermentation for acetone, butanol, and ethanol production. In the second one, ulvan and bioethanol were produced. In order to obtain the monomers as the principal precursors of all products, they were extracted from the seaweed and determined by high-performance liquid chromatography coupled with refractive index detector (HPLC-RID). Considering the high content of neutral sugars presented in the U. rigida, this feedstock was used in this work as a perfect candidate for a sugar-based third-generation biorefinery.
Characterization of polysaccharides and monomers presented in the U. rigida is crucial in this research where two third-generation biorefinery models based on biological conversion of sugars are presented. Once the models were set up, an economic analysis of the two proposed biorefineries was carried out by determining production costs and revenues as well as the net present value (NPV) and the internal return rate (IRR). Finally, a sensitivity analysis with respect to the algae price and the selling price of ethanol and butanol was developed.

2. Materials and Methods

2.1. Seaweed Conditioning and Extractives Analysis

Fresh algae of Ulva rigida provided by the INVESTALGA AHTI S.L. company was used in this work. Seaweed was milled and sieved using a vibrating sieve (Retsch). Then, seaweed was washed three times with ultrapure water and oven-dried at 105 °C for 24 h. Ash at 575 °C and 900 °C were also determined.
Extractives were determined according to the standard UNE-EN ISO 14453:2014 by an extraction with acetone as solvent using a Soxhlet apparatus. Acetone was used as the solvent, and the total extraction time was 72 h.

2.2. Holocellulose, Seifert Cellulose, and Alfa-Cellulose

Holocellulose, which is the sum of cellulose and hemicellulose, was obtained following Wise’s chlorite method [16,17]. The sample was treated with water and sodium chlorite in an acid medium achieved by the addition of some drops of acetic acid. The mixture was heated at 75–80 °C using a water bath. The procedure was repeated three times until the sample was bleached. Then, the sample was cooled, filtered, and washed with water and acetone, dried, and weighed.
Total cellulose was determined by using the Seifert method [18] using the sample free of extractives and after holocellulose treatment. A total of 2 g of sample was mixed with 12 mL of acetone, 4 mL of 1,4-dioxane, and 3 mL of 35% HCl. The mixture was heated to boiling point and condensed for 35 min. Then, the mixture was cooled and underwent filtered washing with 100 mL of methanol, 300 mL of water, and 100 mL of acetone. After filtering and washing, the cellulose cake was dried and weighed.
Cellulose determined as alpha-cellulose was measured according to the method of Cruz et al. [19]. A total of 0.1 g of sample after holocellulose treatment was weighed and extracted consecutively with 17.5% and 9.45% sodium hydroxide solutions at 25 °C. The soluble fraction, consisting of beta- and gamma-cellulose, was determined volumetrically by oxidation with potassium dichromate, and the alpha-cellulose (insoluble fraction) was derived by difference.

2.3. Monomer Quantification

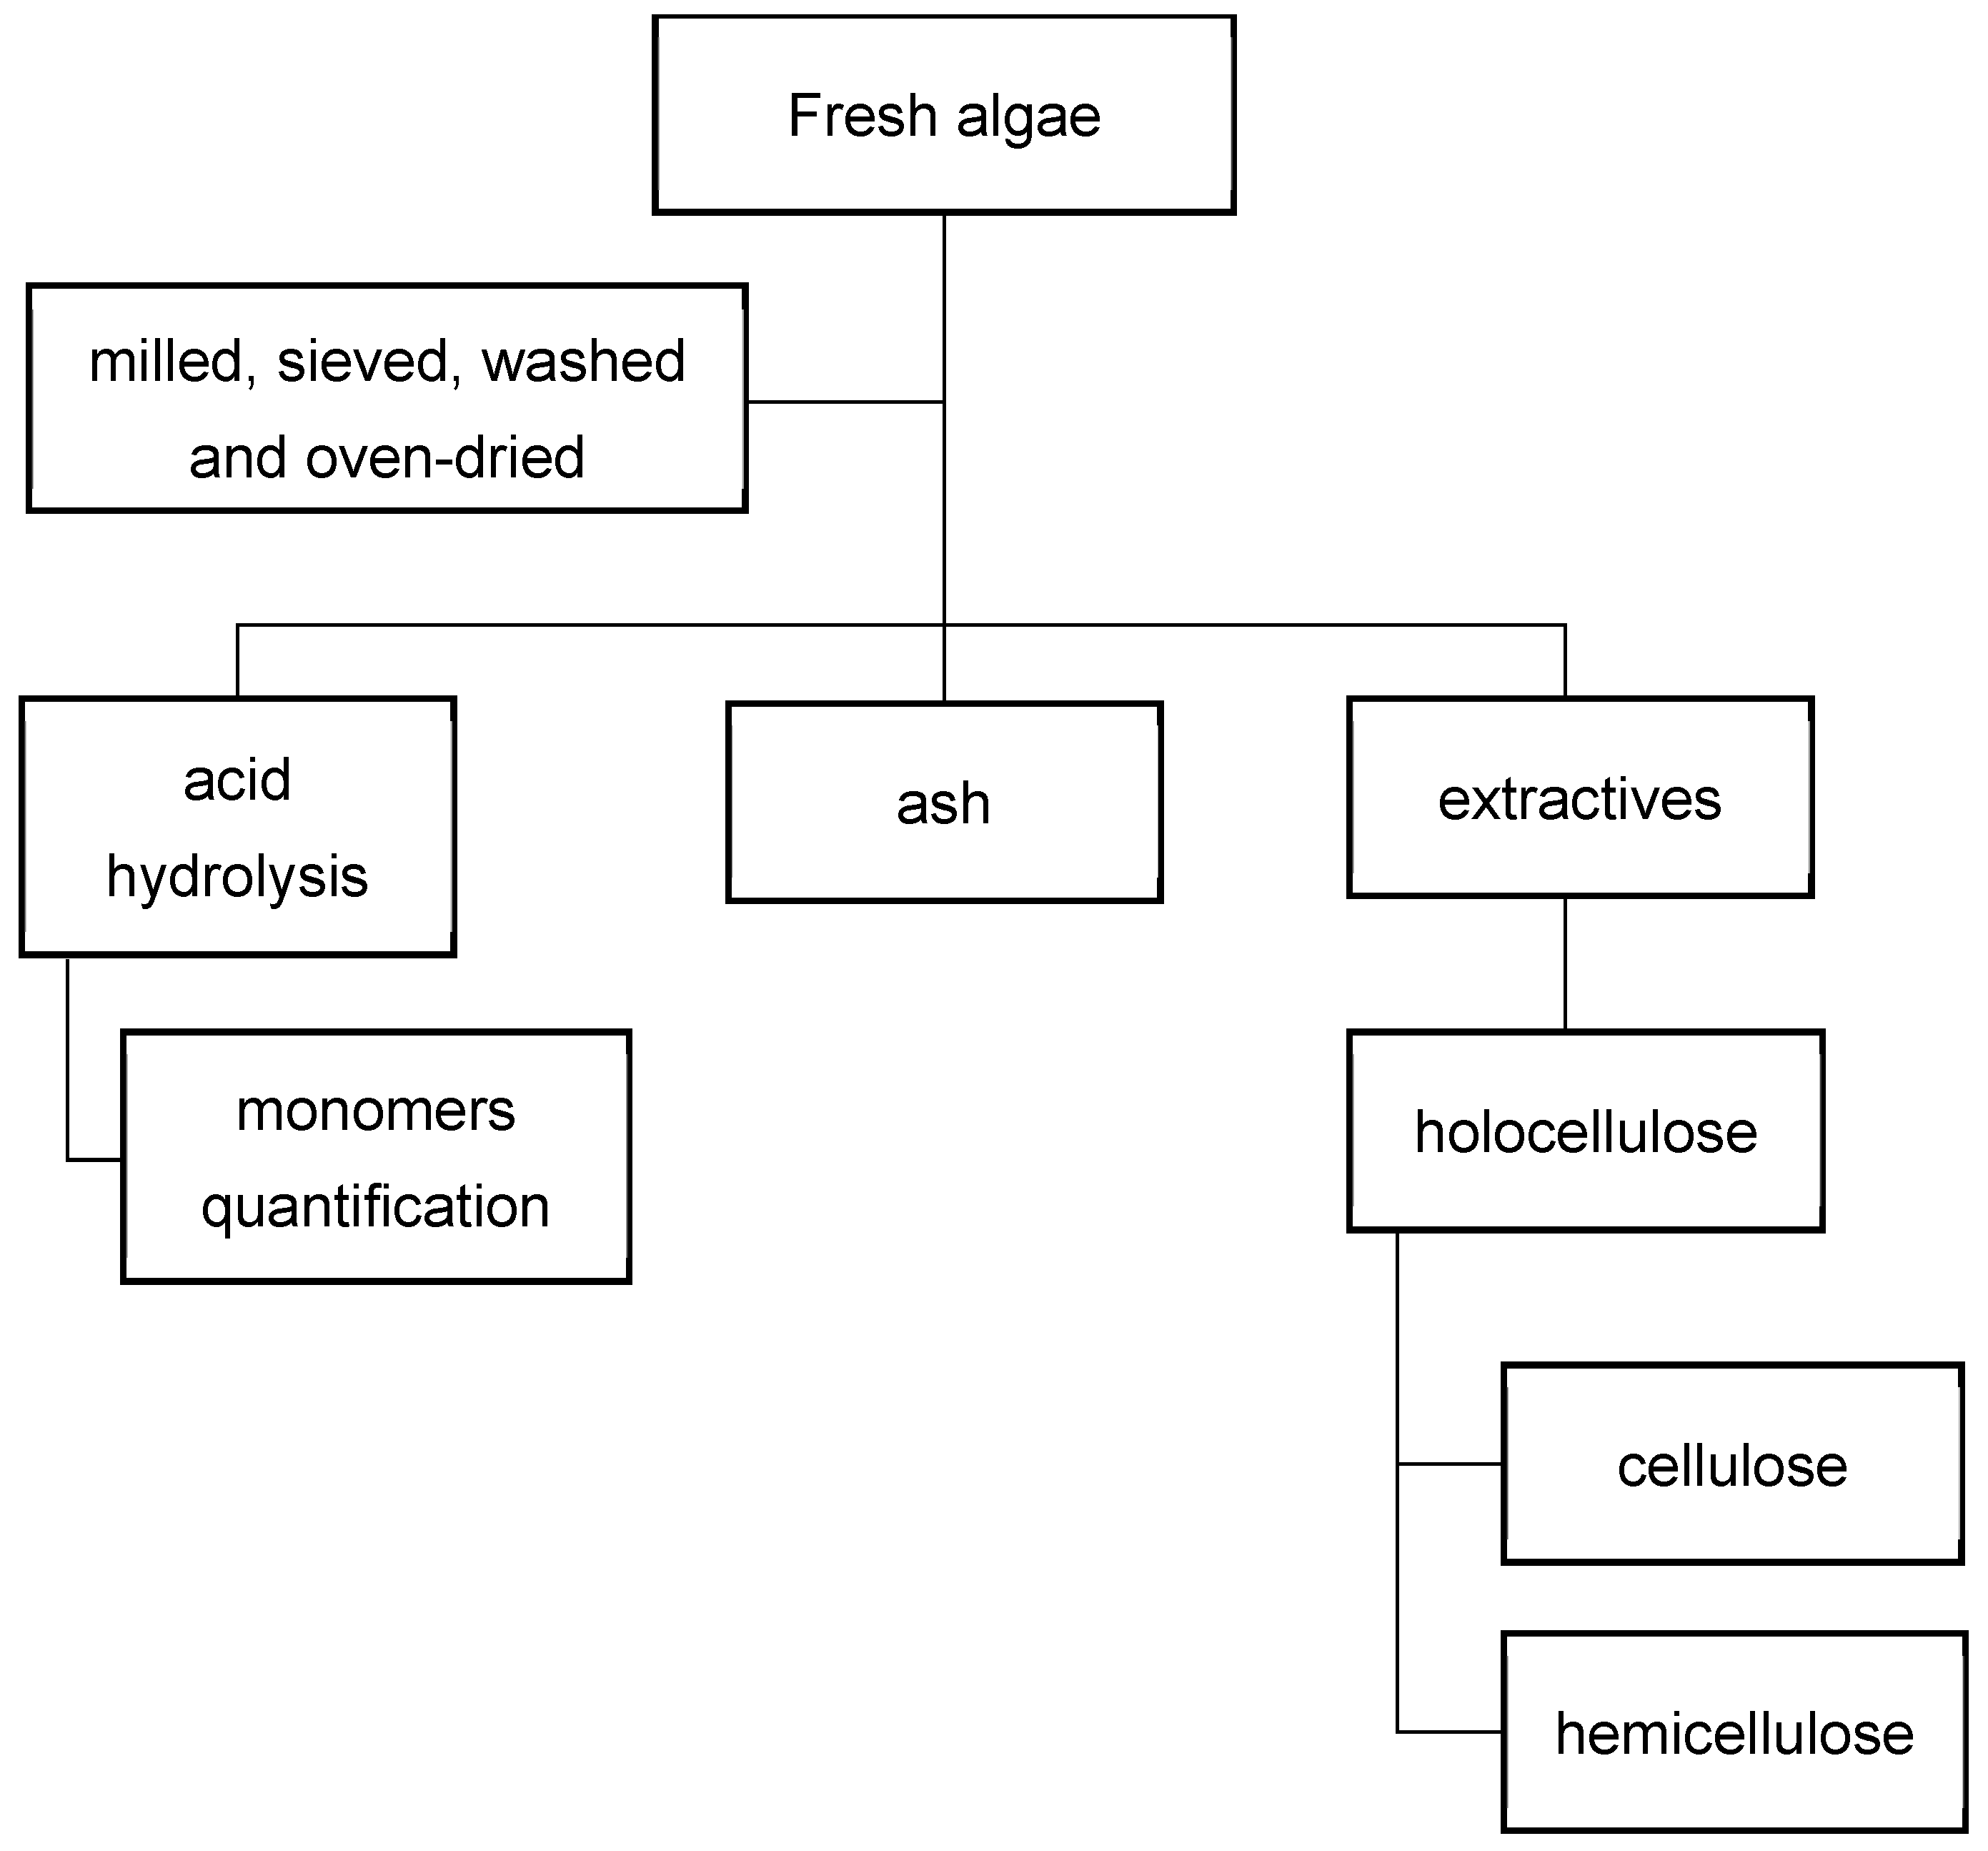
The first step was to depolymerize the cell wall polysaccharides of the algae. The methodology most widely used for this purpose is methanolysis [9]. Nevertheless, in a previous study, the authors stated that the major release was observed by acid hydrolysis with 2 M HCl at 100 °C after 6 h of treatment [20]. Once the hydrolyzates were obtained, monomers coming from ulvan, glucuronan, cellulose, and xyloglucan were quantified in the HPLC/RID (Shimadzu Prominence LGE-UV low-pressure gradient system) using the methodology of Llano et al. [21]. In Figure 2, a block diagram with all steps followed in this work for algae characterization is shown.

2.4. Aspen Plus Modelling of the ABE Process

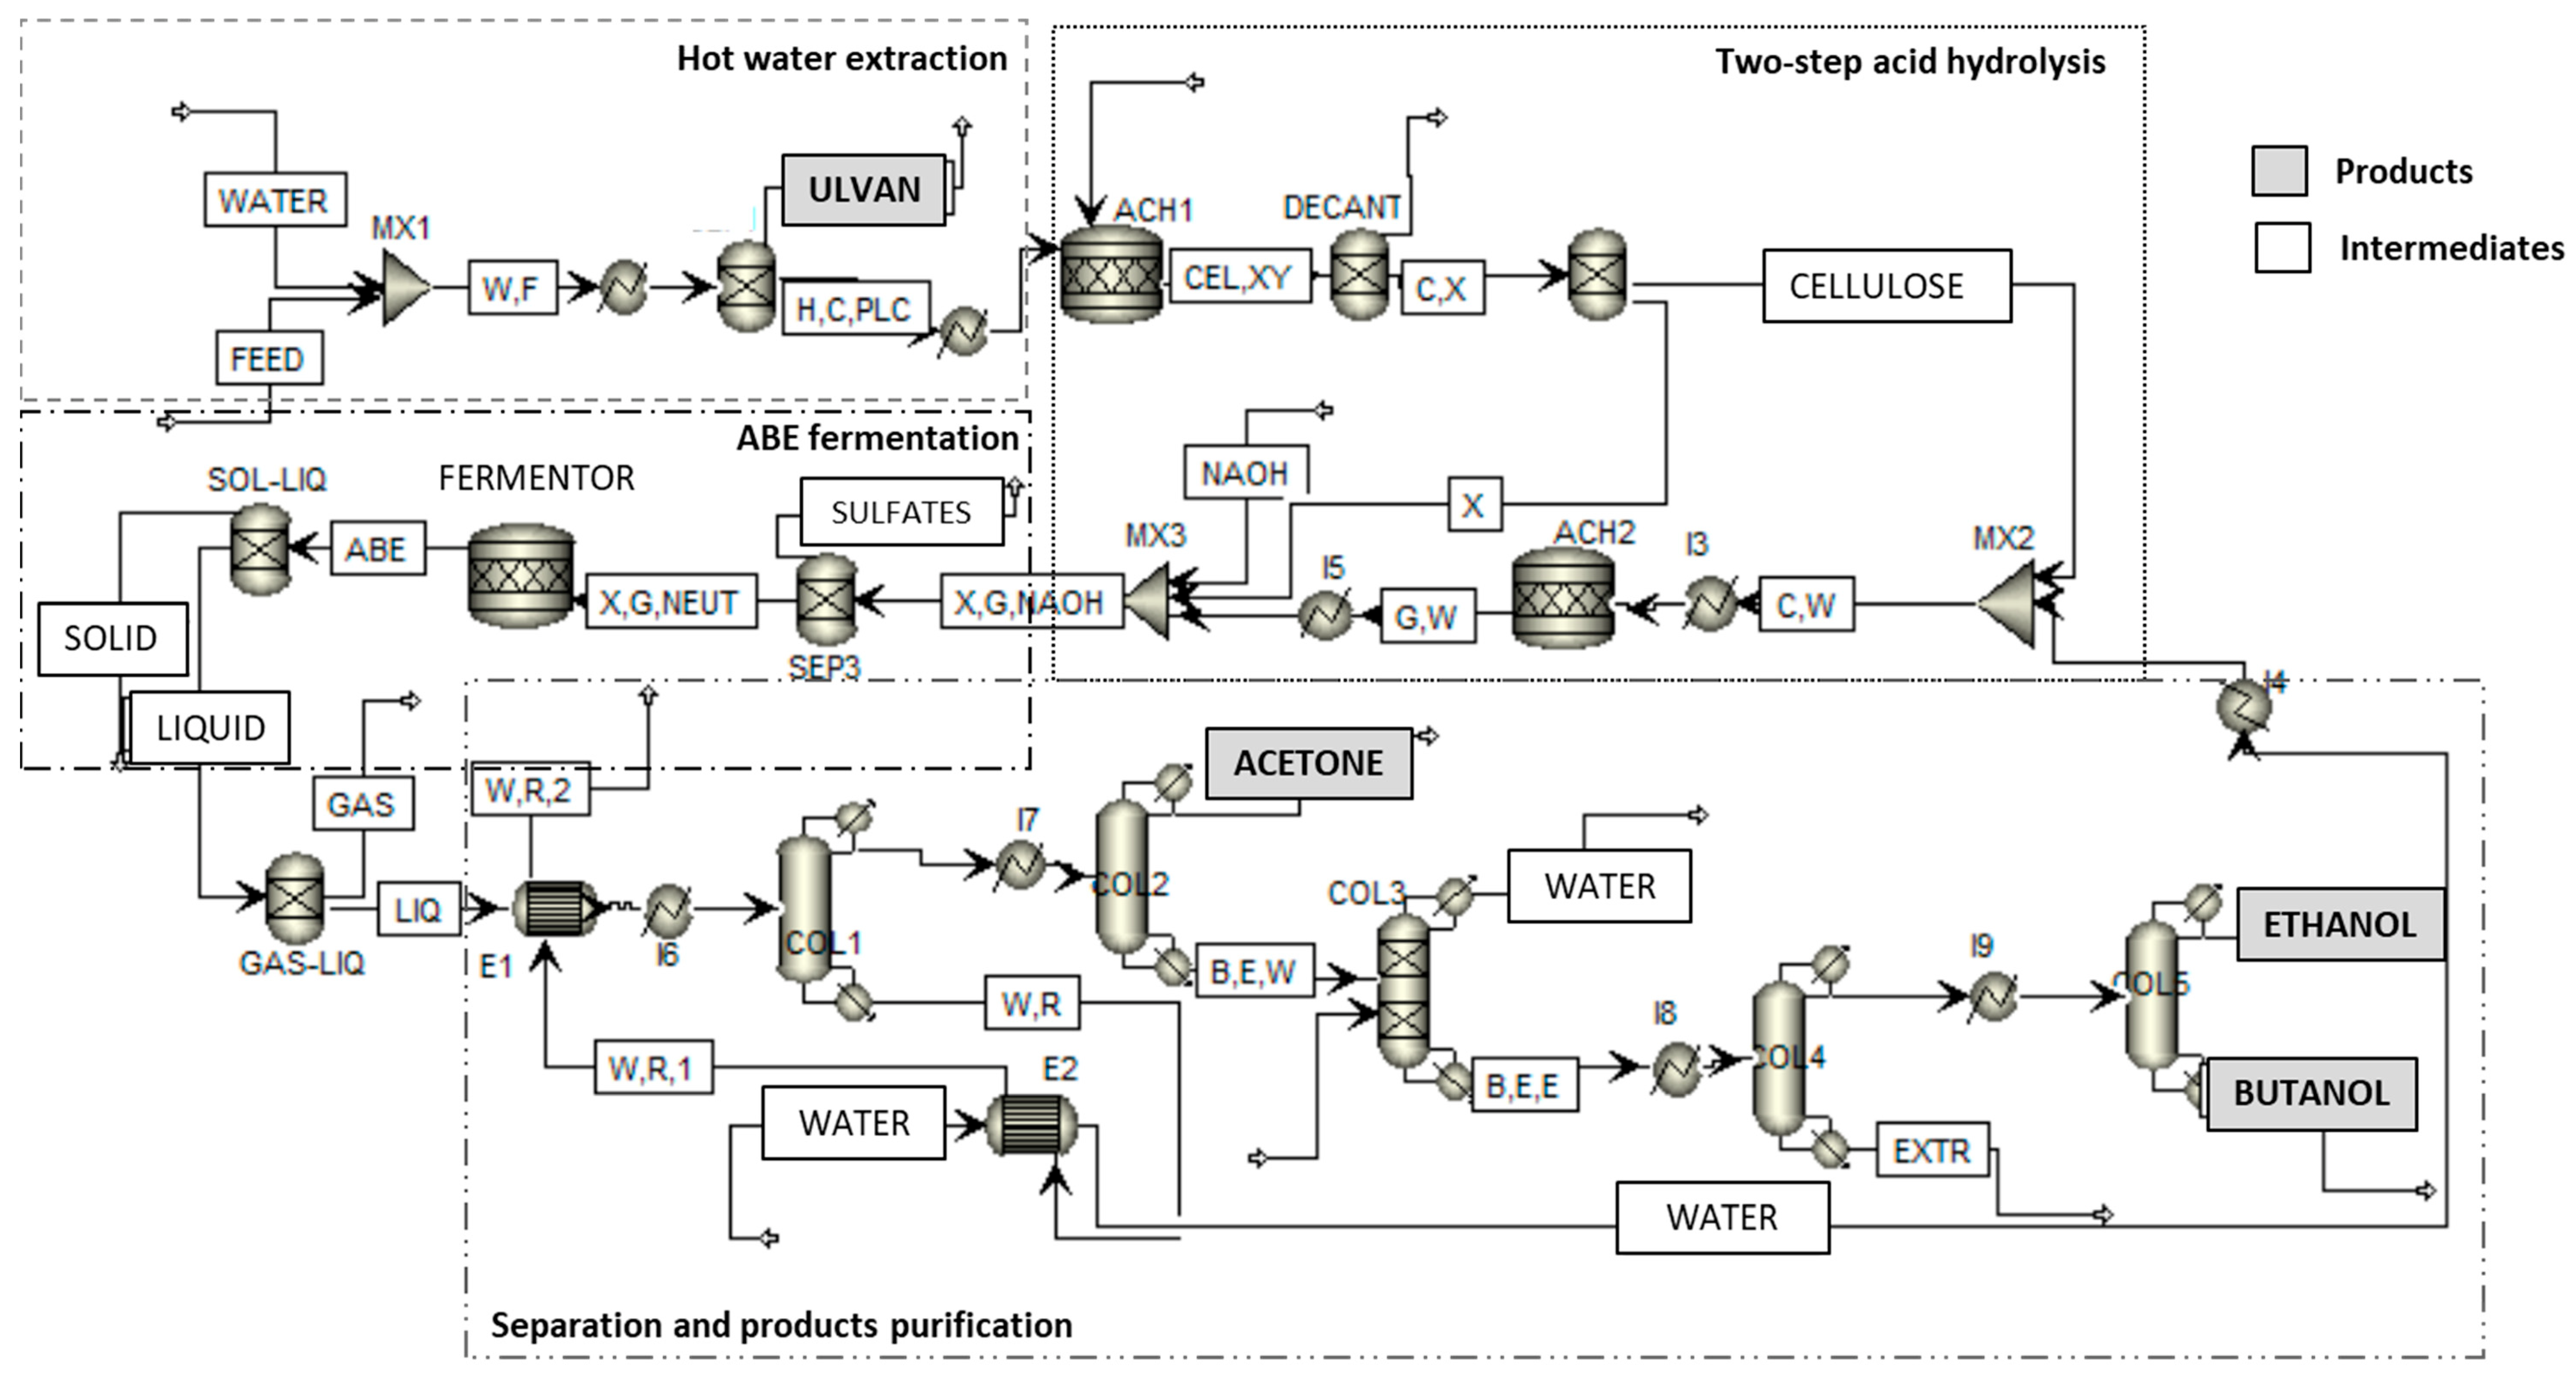
The factory model was performed in Aspen Plus v10 software. Freshly washed algae was introduced as the input stream. Compounds analyzed in this research were introduced in the feed stream. The thermodynamic method chosen was the non-random two-liquid model (NRTL), which correlates and calculates the mole fractions and activity coefficients of inlet and formed compounds. NRTL is appropriate for liquid–liquid (LLE), vapor–liquid (VLE), and vapor–liquid–liquid (VLL) equilibriums. Furthermore, NRTL permits model azeotropes, as in this model, there is an azeotrope between butanol (58% w/w) and water (42% w/w).
Inlet flux of fresh algae and water streams were set in 50,000 kg/h, considering the plant sizes found in the literature [22,23]. Both streams were introduced at room temperature. Ulvan extraction was carried out following experimental conditions developed by the authors in collaboration with the enterprise INVESTALGA AHTI SL that was based on previous studies of Pezoa et al. [9]. After the hot water extraction stage (under confidential conditions protected by the enterprise), diluted ulvan was separated from a stream composed by xyloglucan, glucuronan, and cellulose. Such a mixture of hemicellulose and cellulose was depolymerized through a two-step acid hydrolysis previously developed by the authors [24] and tested in recalcitrant biomass resources such as pulp (algae residue), wood, and textile cellulose. Reactions occurring in the stoichiometric reactors of hydrolysis and fermentation are described in Table 1. The extent of reactions was chosen from the literature [25,26,27].
Fermentation and purification stages were not carried out in the laboratory. ABE fermentation was performed at 35 °C using C. acetobutylicum and adjusting the pH at 6–7 with NaOH [28,29]. Under these conditions, sodium sulfate precipitates and is separated from the sugar substrate.
The last stage was the product separation and purification of ethanol and butanol for selling them as biofuels. This stage consists of a solid–liquid separation unit, one flash unit, and five distillation columns with a partial condenser. Such a complex system is required for selling butanol as a biofuel [28,30,31]. Acetone is separated at the second column, whereas a third column was required to overcome the azeotrope formed between water and butanol, using oleic alcohol as the extractant [28,30].

2.5. Aspen Plus Modelling of the Bioethanol Process

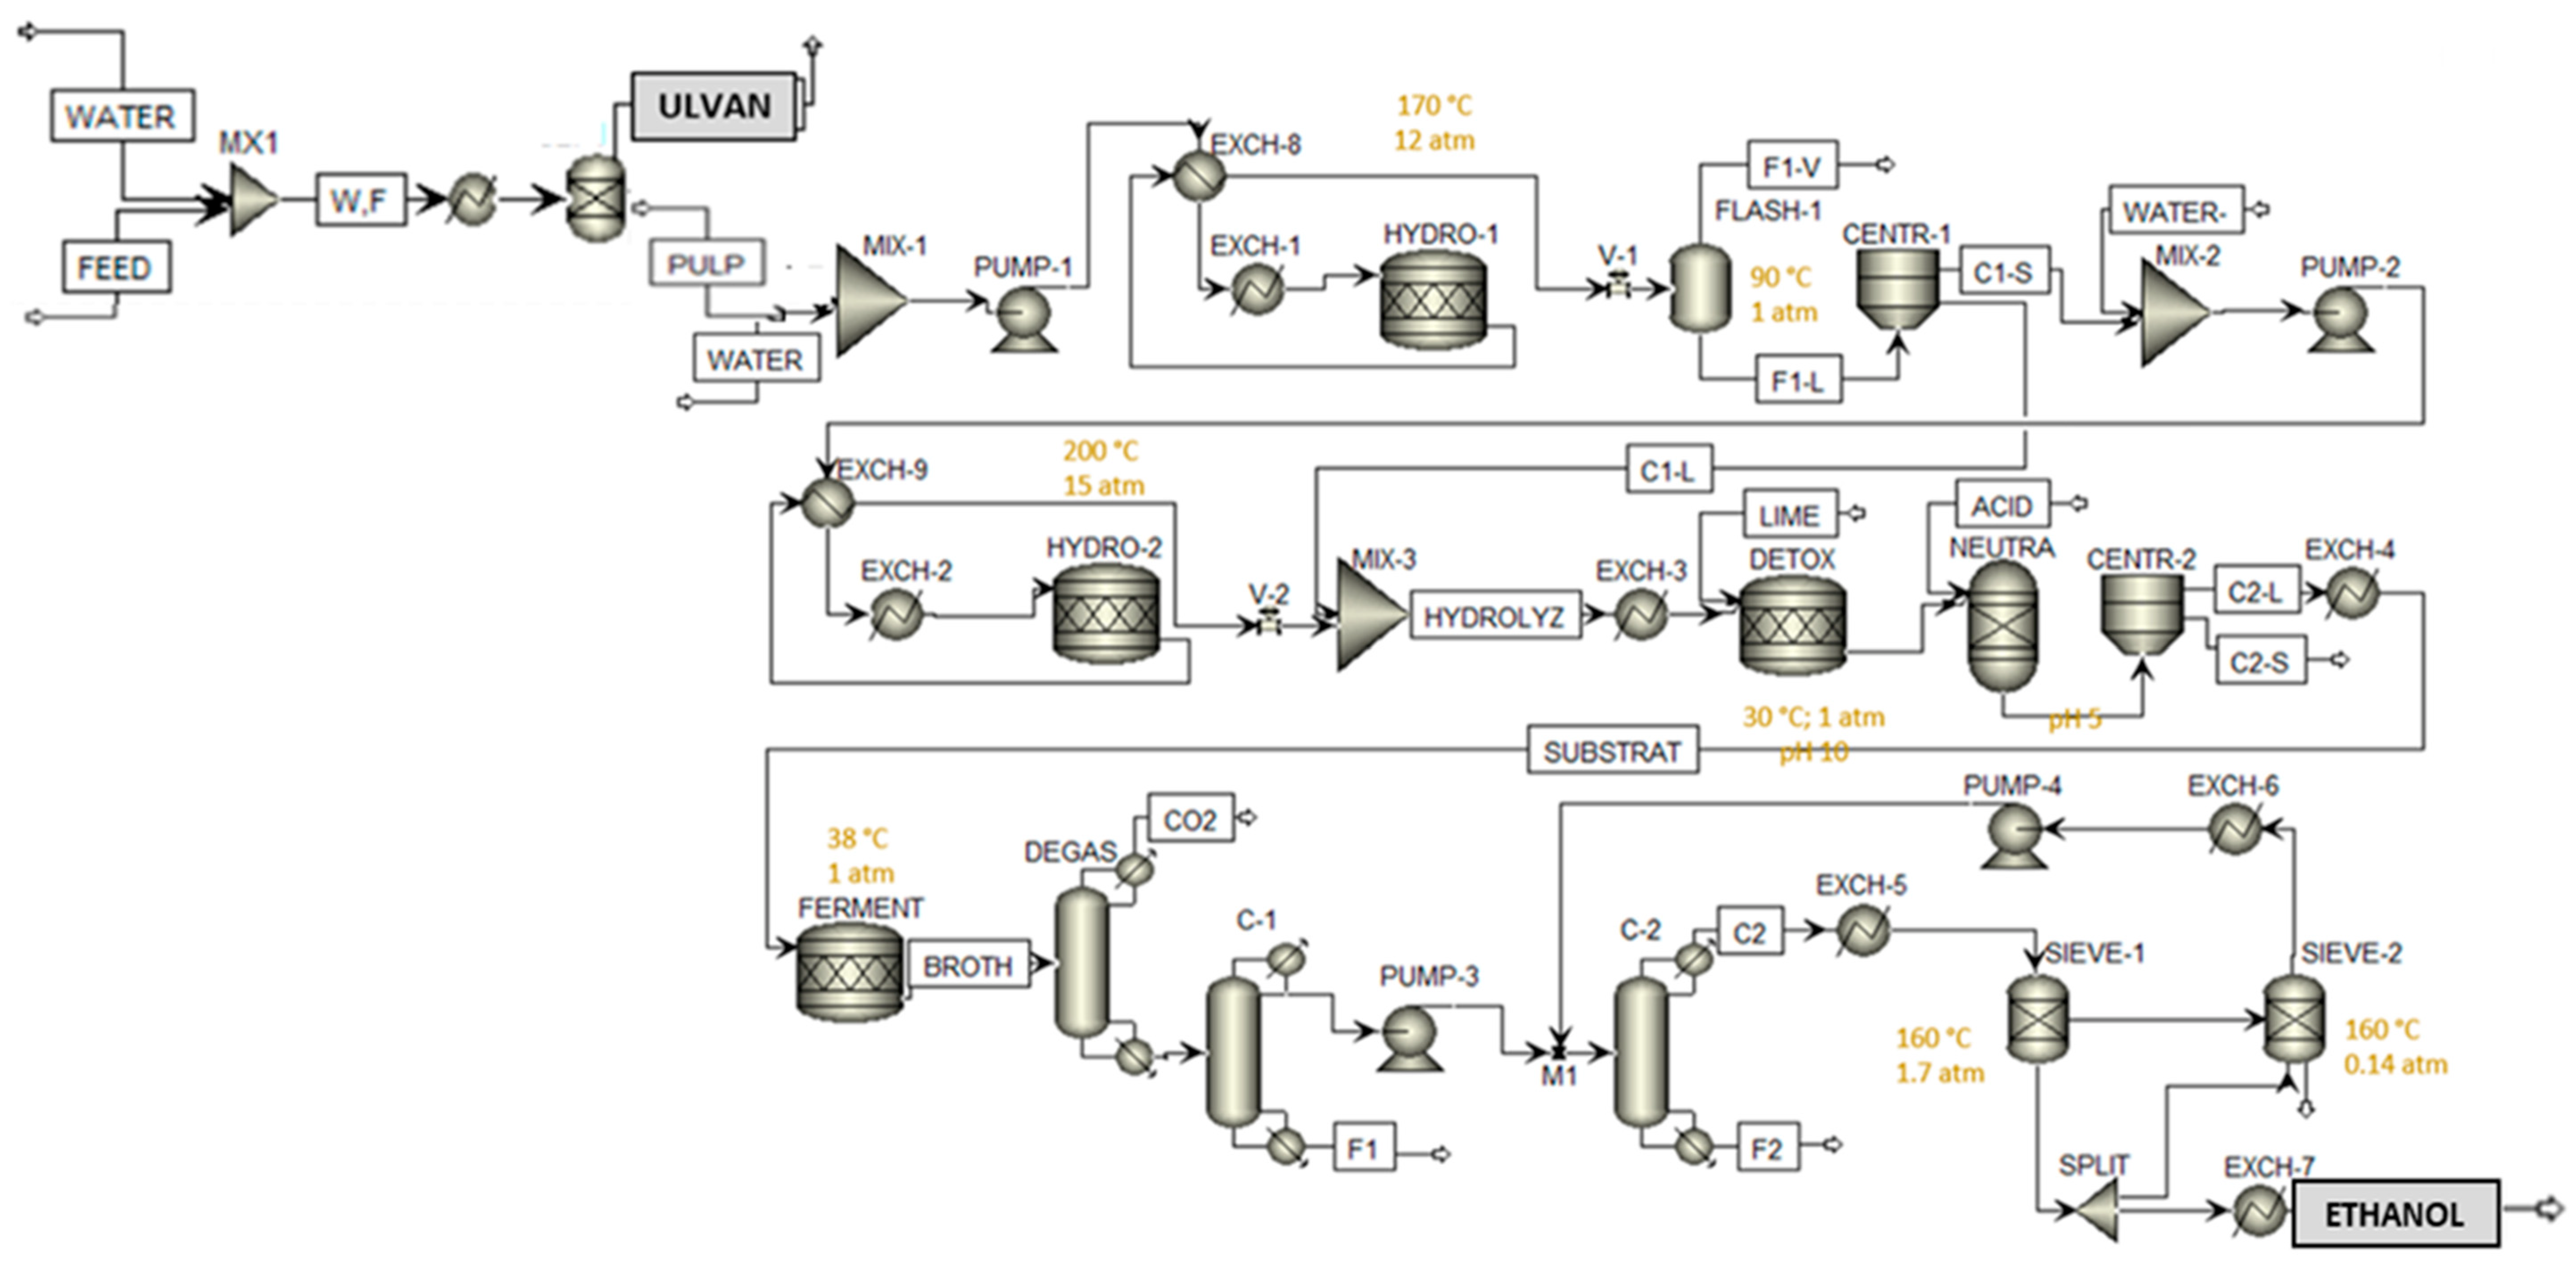
The model of the bioethanol biorefinery comprises the stages of ulvan hot water extraction, the polysaccharides cleavage by acid hydrolysis with H2SO4, detoxification using Ca(OH)2, fermentation with Z. mobilis, and a purification step through distillation and dehydration with molecular sieves.
The thermodynamic method selected for making calculations in the Aspen Plus software was POLYNRTL, which is a model that permits the calculation of activity coefficients of non-ideal liquid mixtures that permits modelling the azeotrope mixture of ethanol–water. The use of POLYNRTL instead of NRTL as used in the ABE process (described in Section 2.4) is that non-random two-liquids is recommended for working under 10 atm, and the acid hydrolysis simulated occurs between 12 and 15 atm. POLYNRTL includes the Redlich–Kwong state equation, which is adequate for the vapor phase under moderate pressure. The plant size was the same as the ABE and was fed with 50,000 kg/h of U. rigida.
Two-step acid hydrolysis was performed: a first hydrolysis (170 °C and 12 atm) for breaking down hemicelluloses and xyloglucan and a second hydrolysis (200 °C and 15 atm) for breaking down the recalcitrant cellulose into glucose monomers. The extent of the reaction was taken from the literature [25,26]. The next step was detoxification to remove fermentation inhibitors, which are sugar degradation compounds (mostly carboxylic acids and furfurals) caused by the high pressures and temperatures reached in the hydrolysis step. Among the detoxification alternatives previously tested by the authors, the best one and also the one applied in this work was oveliming at pH 10 using Ca(OH)2 at 30 °C, which has already been tested in lignocellulosic hydrolyzates [32,33], assuming a total inhibitor degradation of 50%, together with 11.2% of sugar losses. Before the fermentation step, the pH was adjusted to 5.0. Fermentation was carried out using Z. mobilis under atmospheric anaerobic conditions at 38 °C, providing glucose and xylose conversions into ethanol of 0.92 and 0.8, respectively [34]. Hydrolysis and fermentation reactions are shown in Table 2.
The last step of the model was the purification of ethanol that includes distillation columns and, due to the azeotrope formed at 95.6% of ethanol, molecular sieves were used, although their capital costs are high because they are more energy efficient than azeotropic and/or extractive distillation [35].

2.6. Economic Assessment

After the simulation was complete, from the mass balances obtained from the process, it was possible to evaluate the costs from the production and estimate a return period.
To estimate cost production, the method described in Towler and Sinnot was used [32]. This method estimates the cost of construction and installation of every equipment from the flowsheet. It uses the following expression (Equation (1)):
C e = a + b S n
where Ce is the cost of the equipment ($); a and b are cost constants, which value depends on the equipment being evaluated; S is a size parameter, obtained from the simulation that depends on the equipment that is being evaluated; and n is an exponent that also depends on the equipment. The values obtained from this method were estimated using carbon steel as a material to update this value and use it for stainless steel; this method has been previously used to evaluate biorefinery plants [36,37,38]. Using Equation (1), we estimated the inside battery limits (ISBL), which consider all the equipment used in the flowsheet, to estimate the outside battery limits (OSBL), wherein a factor of 0.5 of the ISBL was chosen. OSBL takes into consideration the initial expenses derived from buildings and equipment, other than the one shown in the flowsheet. Additional cost estimations included were obtained from the literature [39]. These costs were as follows: Engineering costs between 30% and 10% of the sum of ISBL and OSBL; contingency charges were also considered to allow changes in the initial budget, and they were assumed to be 10% of the sum of the ISBL and OSBL. Capital investment cost (CAPEX) was calculated as the sum of ISBL, OSBL, engineering costs, and contingency charges multiplied by a factor of 1.15 for new and unproven processes, recommended by Towler and Sinnot [36].
Production costs were calculated by factors obtained from the bibliography. A total of 344 working days were considered, and 31 days were chosen as maintenance and cleaning of the plant. Personal costs were calculated by considering 20 workers to cover 3 shifts of 8 h per day and with a wage of 1.15 times the minimum wage from Spain (EUR 1050/month). Additional costs regarding human resources were also considered, such as supervision costs (25% of the personal costs) and social security and insurance (50% of personal plus supervision costs); the total working capital was the sum of the three costs. Maintenance costs were 4% of the ISBL costs, property taxes accounted for 1.5% of the ISBL, and the rent of the land was considered to be 1.5% of the ISBL plus OSBL costs. Additional environmental charges accounted for 1% of the sum of the ISBL and OSBL costs. Utility costs were obtained directly from the model. Raw material costs were calculated according to a base case of 50,000 Kg/h.
Economic analysis was carried out considering the net present value (NPV) (Equation (2)) and the internal return rate (IRR).
N P V = i = 0 t Q i 1 + i n C A P E X
where Qi are the cash flows for each year; i is the rate of return; and n is the period considered, in years. If the NPV > 0, the investment can be recovered; if NPV < 0, the investment cannot be recovered; and if NPV = 0, the investment is not recovered but there are not loses. The IRR is the percentage of recovery of the investment.
To estimate the time to recover the investment, the discounted payback period was chosen. This method uses the discounted cash flows obtained from the calculation of the NPV. The discounted payback period (DPP) is the year that NPV changes from negative to positive. If the return period is not even, Equation (3) is used.
D P P = t + A b s C Q t Q
where t is the year where NPV changes its sign; Q is the annual cash flow for year t; and CQt is the cumulative discounted cashflow for year t.

3. Results

3.1. Characterization Results of the Green Seaweed

The U. rigida used in this work was composed of ash (17.9–18.8%), extractives (3.4%), cellulose (10.2%), and hemicellulose (17.8%). The neutral sugars detected were, in descending order, rhamnose (8%), glucose (6.8%), and xylose (3.8%). Uronic acids coming from the ulvan sulfate polysaccharide were glucuronic acid (2.4%) and iduronic acid (4.3%). Finally, the ulvan content and xyloglucan found in the seaweed were 24.0% and 5.2%, respectively.
The pulp coming from the hot water extraction was also analyzed, and these data were also introduced into the model. As ulvan was already extracted in the hot water extraction step, the pulp contained mostly hemicellulose (20.5%), cellulose (15.9%), and xyloglucan (12.0%).

3.2. Results of the Two Sugar Biorefinery Models

Regarding the ABE plant (Figure 3), the simulation resulted in production rates of 2667 kg/h of butanol with a purity of 99.8%. Purities higher than 99.5% are enough to be used as a fuel [31]. The ABE biorefinery also co-produced 678 kg/h of acetone (purity of 82%) and 41 kg/h of ethanol at 98% purity. Similar results were found in the literature, giving 4575 kg/h of butanol at 96% from 45,631 kg/h of U. lactuca seaweed [40]. Such an amount of butanol is higher than that obtained in this research due to the thermochemical conversion instead of the use of a biological process, but the purity is not quite enough for biofuel purposes. Another work used a biochemical route, obtaining 1638 kg/h of pure butanol using sweat sorghum as a feedstock [41]. Haigh et al. [28] studied different lignocellulosic raw materials with a fermentation process producing butanol in the range of 2838 and 3202 kg/h, which is very similar that obtained in this work.
Regarding the bioethanol plant (Figure 4), production rates of 8207 kg/h were obtained from the simulation. After the purification step using distillation coupled with molecular sieves, ethanol reached 99.5% purity, which is adequate to be used as a biofuel. Hydrolysis yield was around 0.476 g sugars/g pulp, and the fermentation yield was 0.192 g ethanol/g pulp.

3.3. Economic Analysis

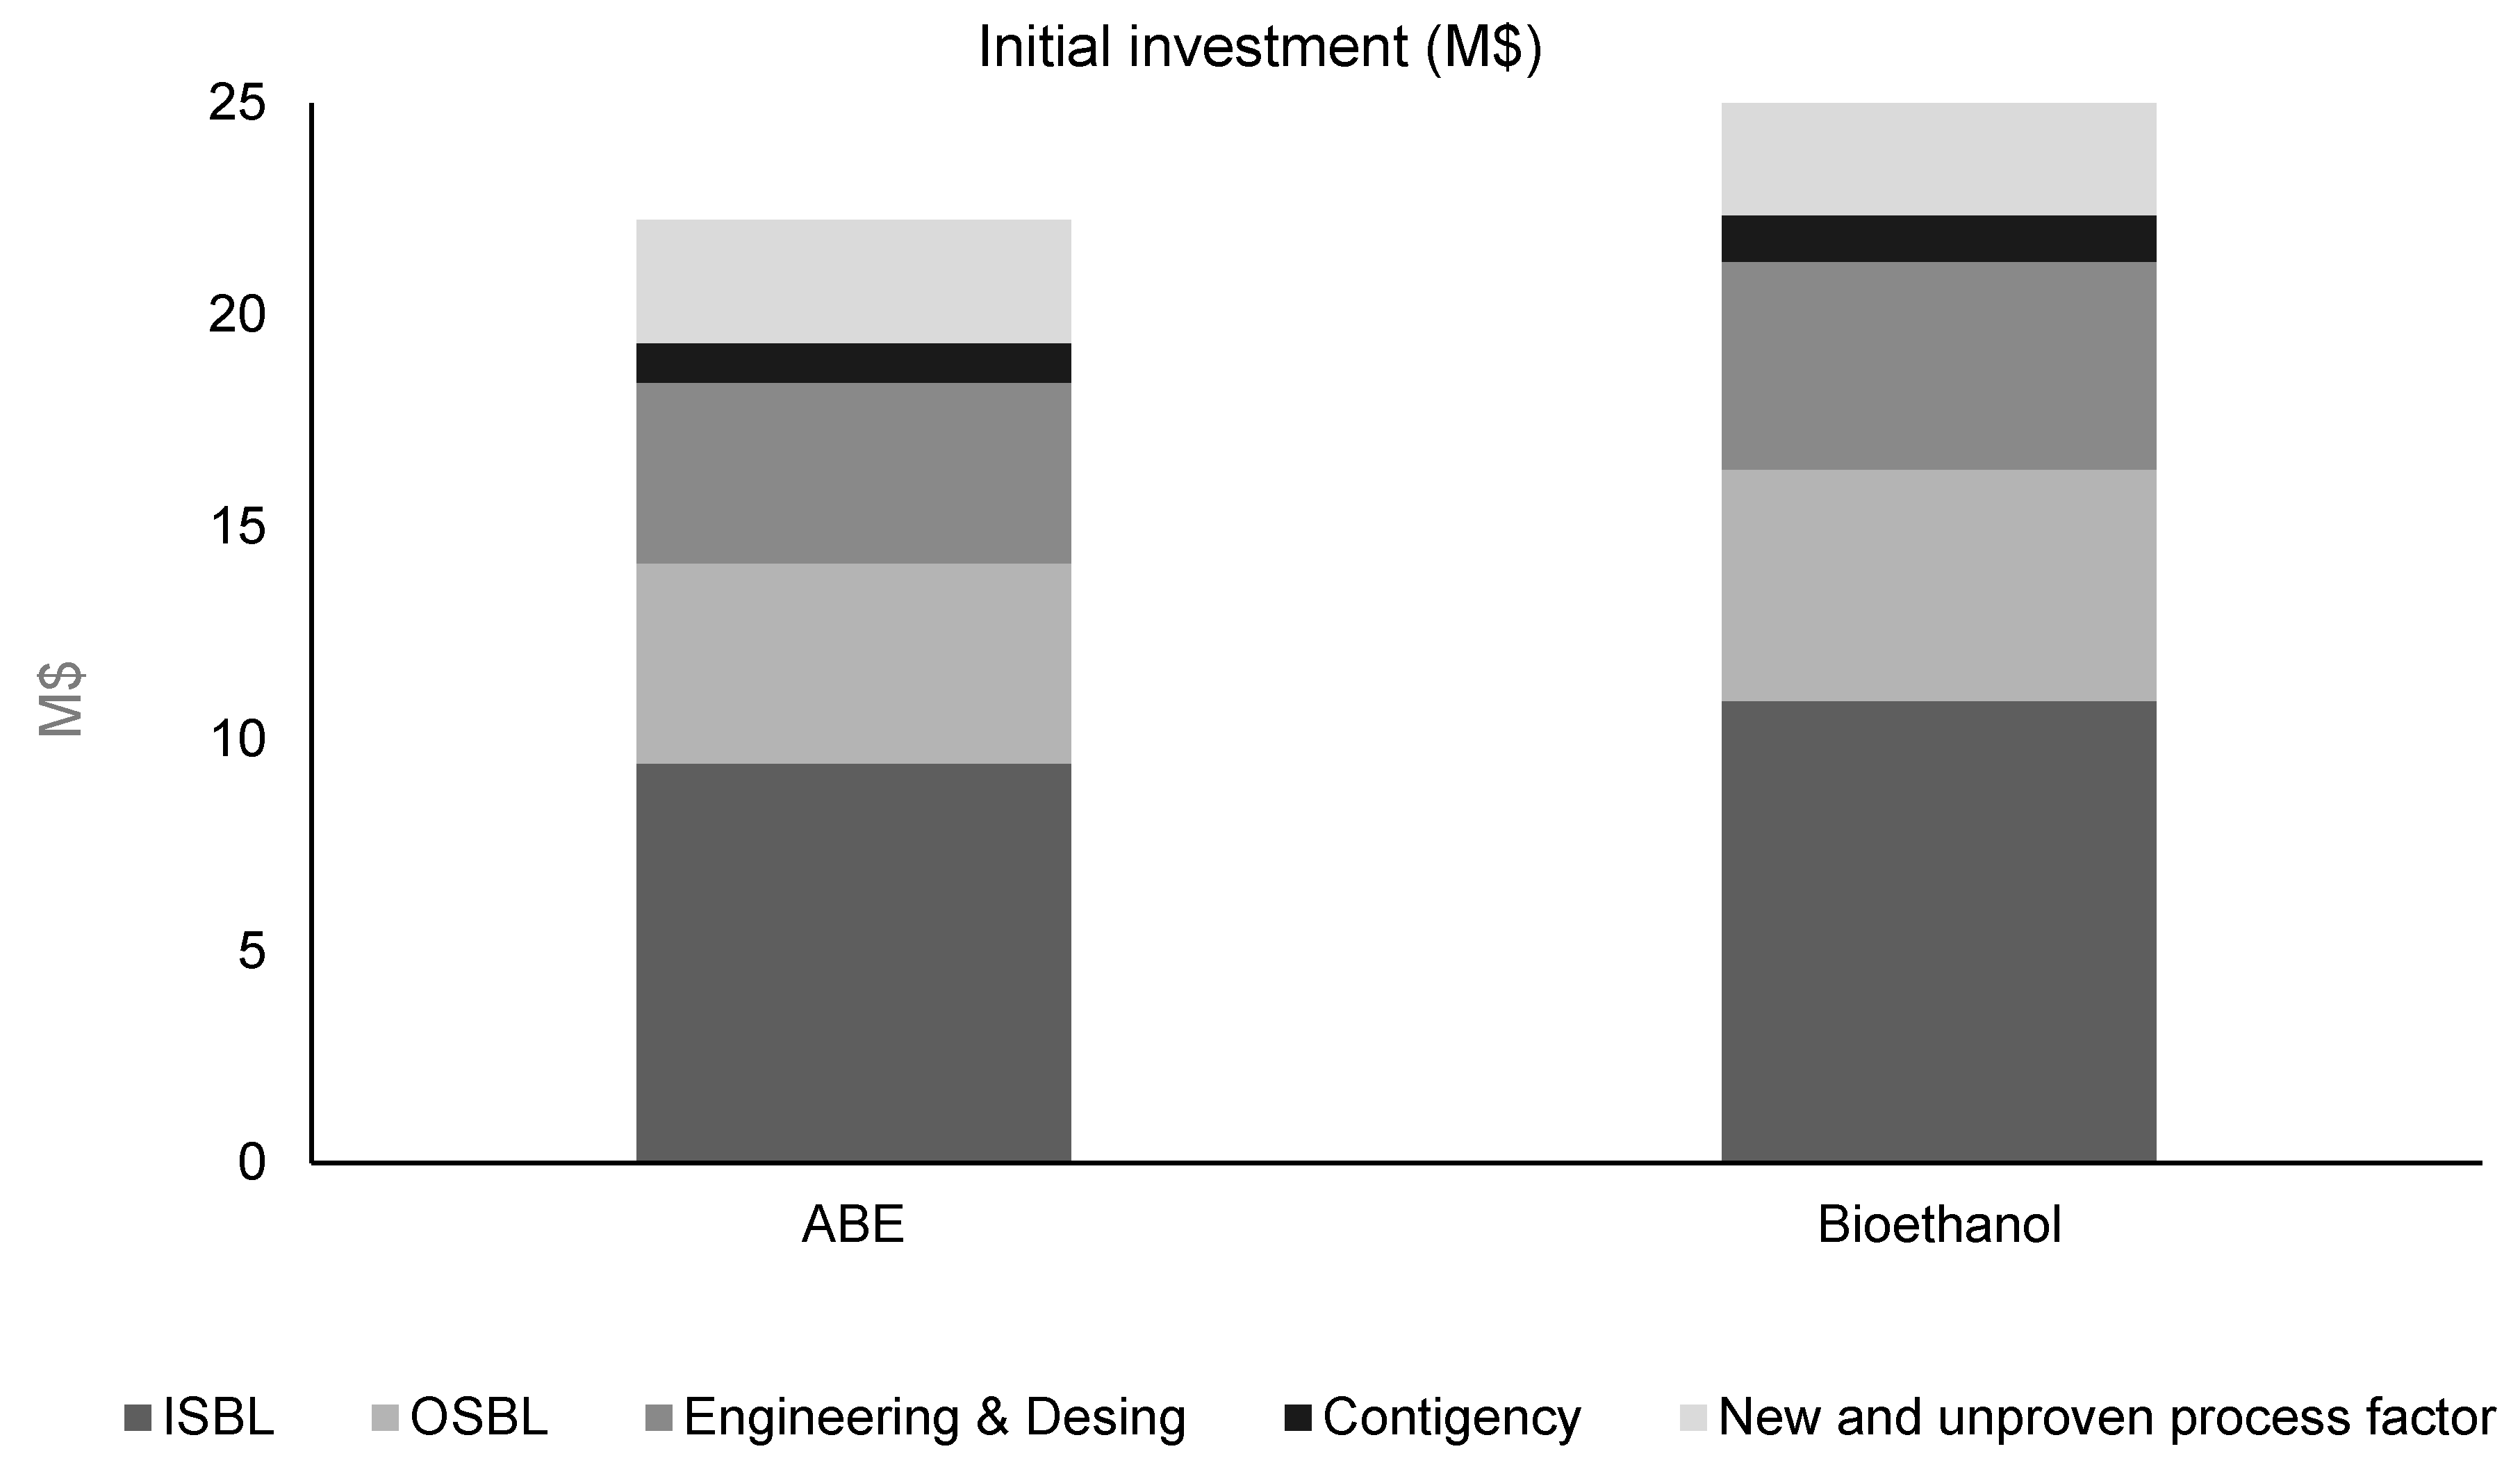
Initially, the results from the application of the estimation cost method were shown—first, the initial investment estimation, and then the production costs and the revenues from the main products obtained. Figure 5 shows the initial investment estimation results. As can be seen in Figure 5, the biorefinery option with the highest investment costs was the bioethanol plant. We concluded that the main bottleneck was the purification process. The section that contributed the most to the initial investment estimation was the ISBL, which was related to the expenses from the construction of the plant. On the contrary, the section that contributed less was contingency, since it was destined to have unexpected expenses. The estimated investment costs for ABE and bioethanol biorefineries were 22.25 M$ and 25.71 M$, respectively.
To obtain the economic parameters used for the assessment of the plant, production costs and revenues should be estimated. Table 3 shows the production costs and revenues.
The plant with the highest production costs was the ABE biorefinery, and the section that contributed the most to the production costs was the utilities. Utility costs are associated with electricity, cooling water, and steam. ABE fermentation uses many heat exchangers; therefore, the use of steam is higher than in the other plants. Additionally, material costs (mostly chemical compounds) are the highest in this type of plant. This section was calculated using the flow from the streams obtained through the simulator and the unitary costs from the literature. Table 4 shows the unitary costs for each compound in each plant.
Investment costs are the same for the ABE and bioethanol biorefinery, since conversion processes share several similarities; however, production costs are significantly lower. In this study, production costs were found to be around 58 and 51 M$/year. These costs were mainly influenced by the use of chemicals and utilities, and therefore the capacity of the plant, in terms of stream flow, is an important factor. Other authors used Codium tomentosum (seaweed) to produce biodiesel. For a plant capacity of 20 t/batch, the initial investment was 78.14 M$, with operational costs of 106.49 M$/year [40]. Considering a ten-day batch, the feed flow would be 1603 kt/y. Meramo-Hurtado estimated the investment cost to be 270 M€ and the production costs 1203 M€/year for ABE fermentation, considering a plant capacity of 320 t/h, which is larger than the one considered in this study [41]. The different values found in the bibliography show that production costs are, in general terms, lower than the initial investment costs. However, they exhibit a strong dependence on the size of the plant, reaching a value even higher than the initial investment cost.
With the estimation of the costs and revenues, it was possible to calculate the net present value (NPV) of the plant. This parameter has been widely used for the economic assessment of plant investments and was used in this study [42,43,44,45]. Table 5 shows the NPV and IRR results.

3.4. Sensitivity Analysis

As can be seen from Table 5, the ABE and bioethanol biorefineries had a positive value of NPV, which means that the investment would be profitable at ten years and at a rate of 20%. IRR was also calculated, leading to a result of 27% for the ABE biorefinery and 36% for the bioethanol biorefinery. Patel et al. [46] studied the economic feasibility of biodiesel production from microalgae and obtained an NPV of USD 750.91 and a 5.18% IRR, with a return period of 7.76 years. It should be noted that these calculations were performed at the lab scale, and therefore the capacity of the plant was lower. Harahap et al. [47] analyzed the profitability of a biofuel plant reaching an NPV of 2.9 M$ with a payback period of 5.9 years and IRR of 17.4%, with a capacity of 3 kt biodiesel/y.
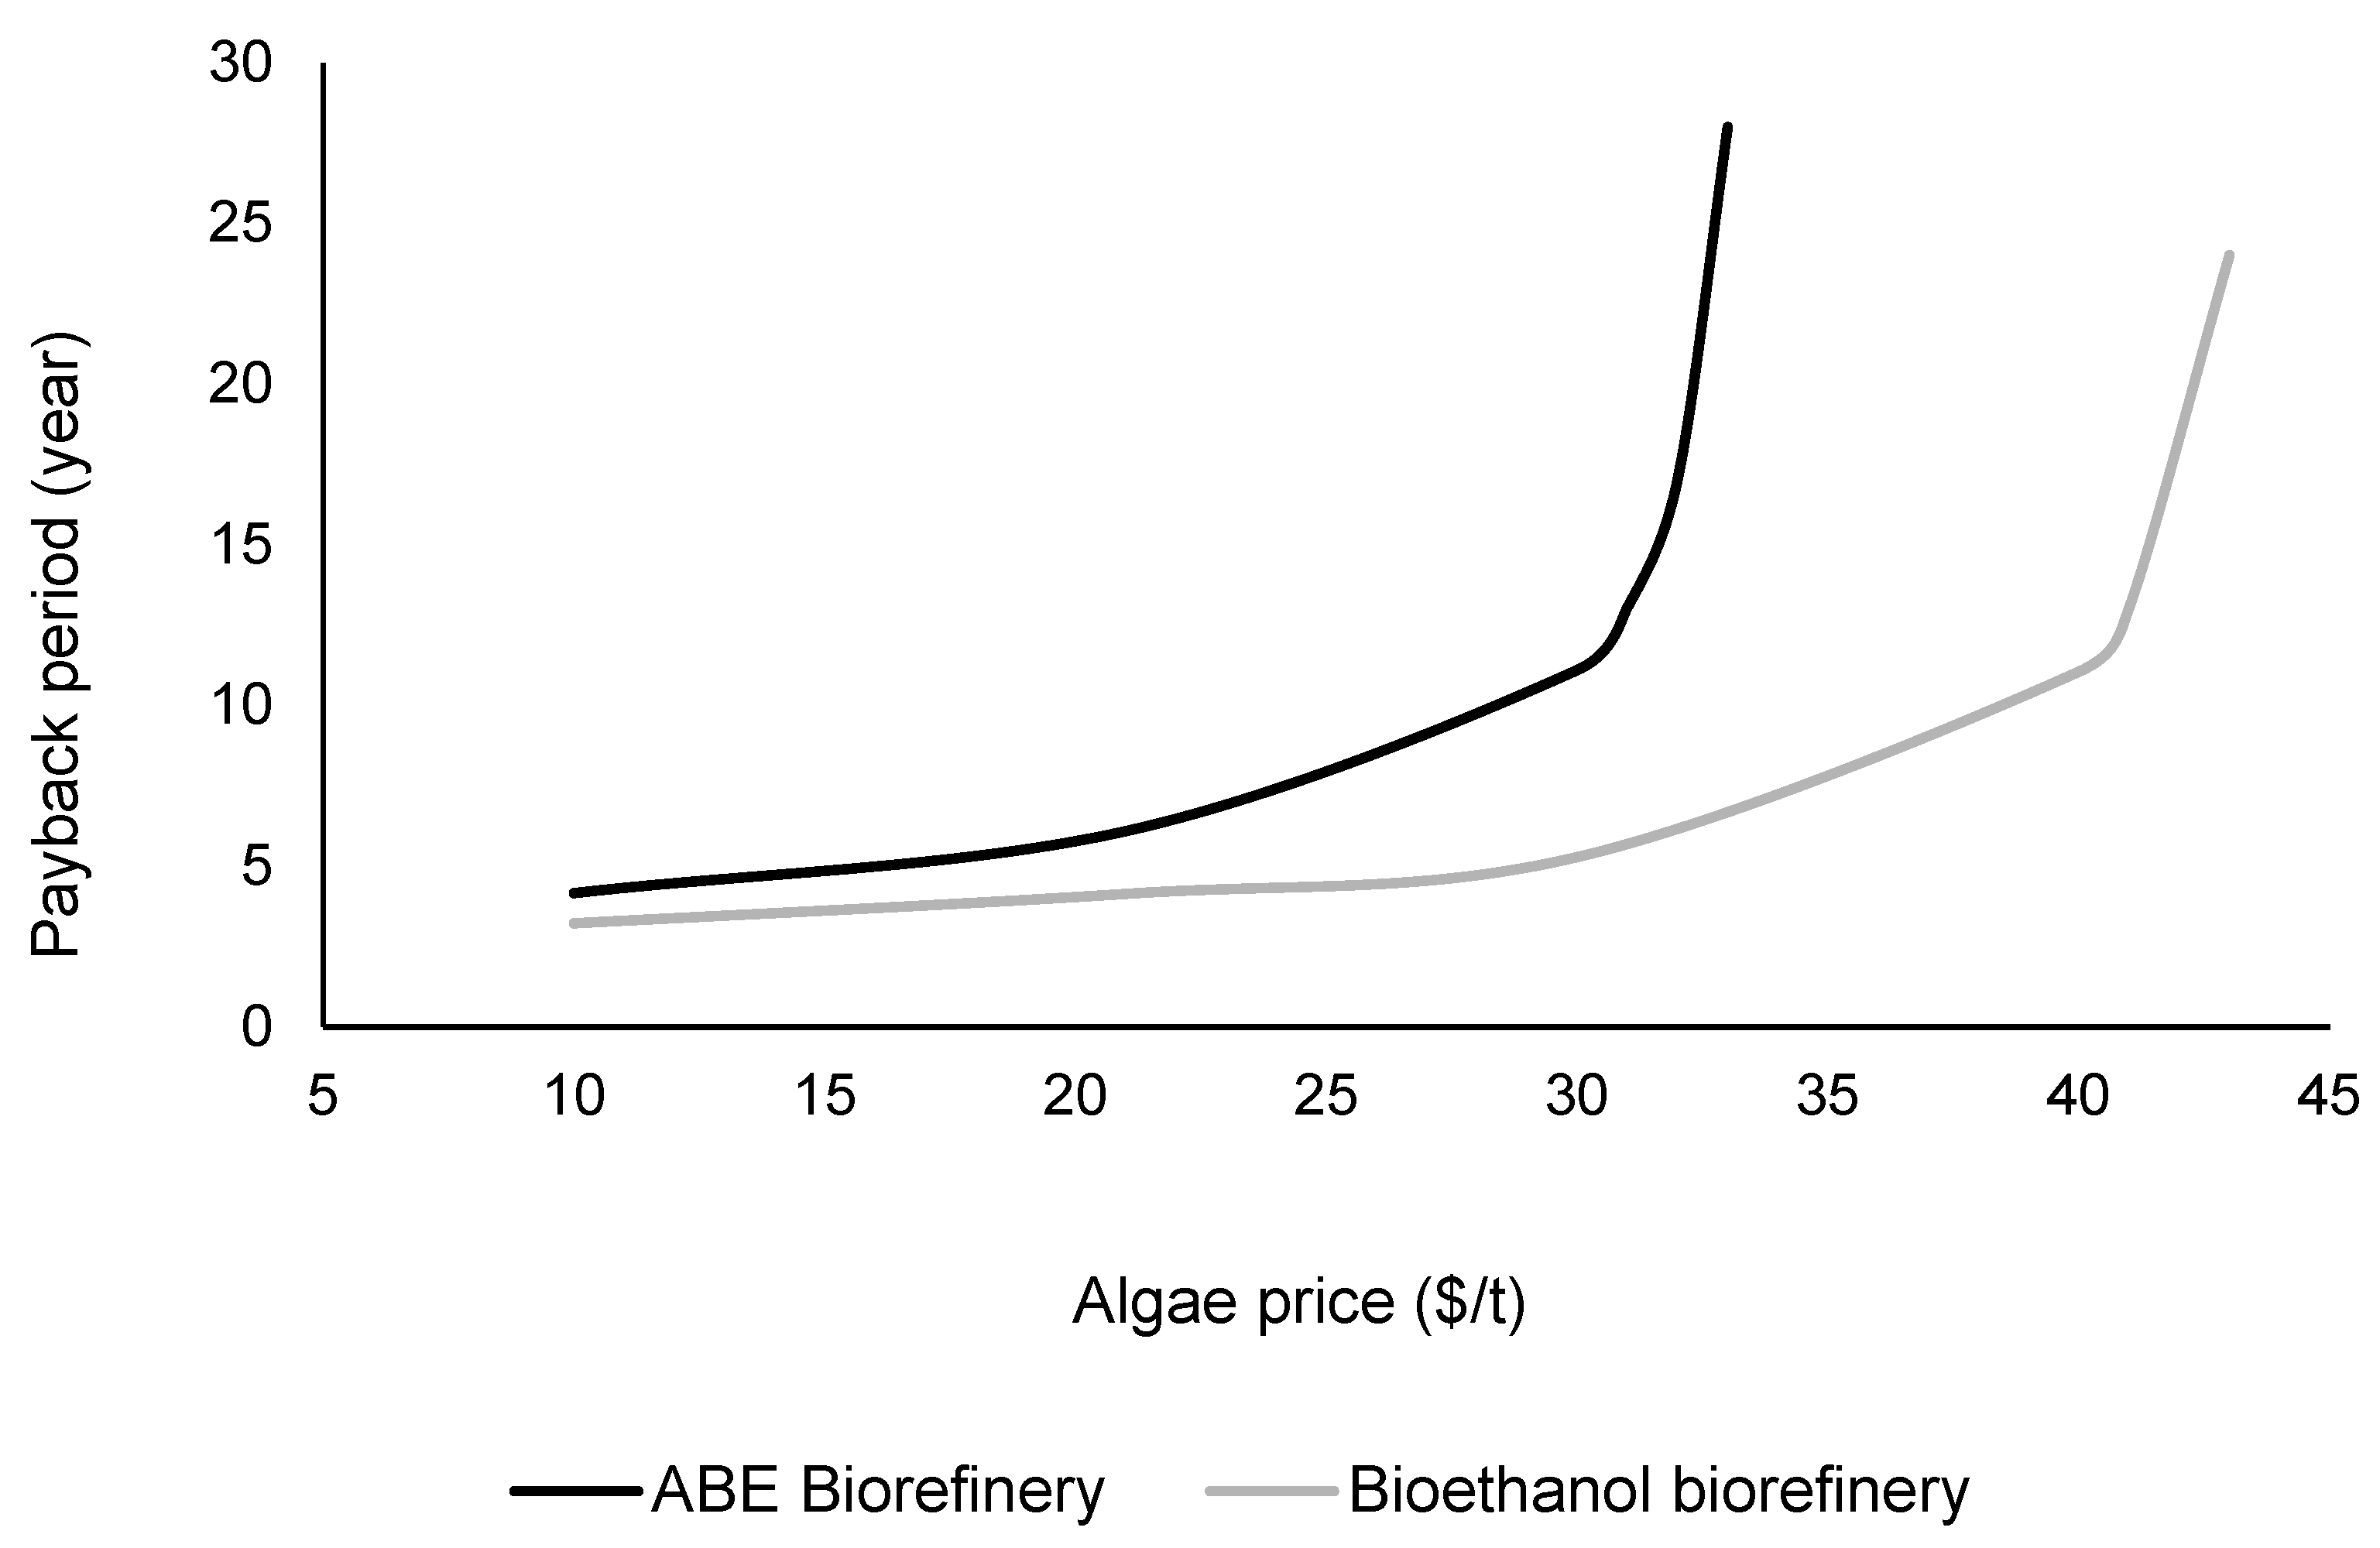
To observe the effect of the price of the raw material on the investment, a sensitivity analysis was performed. Varying the prices of the raw material had an effect on the production costs, and therefore on the return period of the investment. Figure 6 shows the sensitivity analyses of both plants for the price of the raw material.
The base price for the raw material for both plants was 21 $/t [48]. At the base price, the discounted payback period was 4.11 years for the ABE biorefinery and 6.1 years for the bioethanol biorefinery. Within the biorefinery concept, it is assumed that a payback period between 6 and 8 years is acceptable [36], and therefore the case of study is economically feasible. The previous figure shows that increasing the price of the raw material increases the payback period. Regarding the ABE biorefinery algae price, it can increase up to 25 $/t, and the discounted payback period would increase it to 7 years. Bioethanol plants are more flexible to variations of the algae price; in fact, they can reach a price of nearly 36 $/t.
The raw material is not the only product for which the market can be affected by price variation. The products obtained can vary as well; therefore, a sensitivity analysis for the price of the selling products was also carried out (Figure 7). The methodology was the same for the sensitivity analysis of the algae price. However, in this case, the effect was shown in the benefits of the plant, which also affected the NPV and the return period.
As can be seen from Figure 7, the economic feasibility of the ABE biorefinery was less sensitive to price changes than the bioethanol biorefinery. Butanol price can decrease from the base case 2.8 $/kg [49,50,51] to 2.7 $/kg, but if it decreases further, the economic feasibility of the plant would be compromised, since the discounted payback period would rise to more than 8 years. In fact, if the price of butanol decreased to lower than 2.58 $/kg, the return period would be higher than 20 years. On the other hand, ethanol price can decrease from the base case 0.934 €/kg [42,52] to 0.83 €/kg, so that the payback period would be nearly 8 years. If the ethanol price were to decrease to 0.8 $/kg, the payback period would increase up to 20 years. Additionally, a sensitivity analysis was performed with the prices of acetone and ethanol, and it was found that these side-products did not have an important effect on the economic feasibility of the plant. Therefore, it can be assumed that the approval of the investment of the plant depends on the stability of the prices of the major products.

4. Conclusions

Two algae-based third-generation biorefineries were simulated in Aspen Plus. The plant size was set in both cases at 50,000 kg/h of U. rigida seaweed. The proposed models provided production rates of 2667 kg/h of butanol (99.8% purity) and 8207 of bioethanol (99.5% purity) for use as biofuel.
The economic feasibility of two algae-based biorefinery scenarios was carried out. The initial investment, operational costs, and revenues were calculated with the flowsheet obtained from the simulation of the two scenarios. Regarding the profitability of the investment, the plants producing bioethanol and butanol were economically feasible. The economic parameters for the bioethanol and butanol plants were as follows: NPV equal 27.66 M$ and 16.67 M$, and IRR equal to 46% and 37%, respectively. The discounted return period was acceptable for these types of plants, which were 4.11 and 3.16 years for the ABE biorefinery and the bioethanol biorefinery, respectively. It can be concluded that both plants were economically feasible. However, sensitivity analysis showed that both scenarios were very dependent to market fluctuations.

Author Contributions

Conceptualization, T.L. and A.C.; methodology, T.L. and C.A.; formal analysis, L.E.G. and A.P.; investigation, C.A., L.E.G. and A.P.; resources, T.L. and A.C.; data curation, A.C.; writing—original draft preparation, T.L. and C.A.; writing—review and editing, A.C.; visualization, T.L.; supervision, T.L. and A.C.; project administration, T.L.; funding acquisition, T.L. and A.C. All authors have read and agreed to the published version of the manuscript.

Funding

This research was funded by EUROPEAN COMMISSION, Marie Sklodowska-Curie Actions-RISE, grant number 101007733 (CELISE project https://celise.unican.es/), and by AHTI INVESTALGA S.L. company under projects CIRCULVA and POLIEXTRALGA.

Institutional Review Board Statement

Not applicable.

Informed Consent Statement

Not applicable.

Data Availability Statement

Not applicable.

Acknowledgments

The authors acknowledge to the company AHTI INVESTALGA S.L. and the financial support of the research project H2020-MSCA-RISE CELISE (grant number 101007733) of the European Commission.

Conflicts of Interest

The authors declare no conflict of interest. The authors declare that this study received funding from AHTI INVESTALGA S.L. The funder was not involved in the study design, collection, analysis, interpretation of data, the writing of this article or the decision to submit it for publication.

References

  1. United Nations. World Population. Available online: https://www.un.org/en/sections/issues-depth/population/ (accessed on 30 July 2019).
  2. Global Water Partnership GWP Perspective Papers. 2014, pp. 1–20. Available online: https://www.gwp.org/globalassets/global/toolbox/publications/perspective-papers/perspective_paper_landuse_and_groundwater_no6_english.pdf (accessed on 21 July 2022).
  3. Jong, E.D.; Jungmeier, G. Biorefinery Concepts in Comparison to Petrochemical Refineries. In Industrial Biorefineries and White Biotechnology; Höfer, R., Pandey, A., Larroche, C., Eds.; Elsevier B.V.: Amsterdam, The Netherlands, 2015; pp. 3–33. ISBN 9780444634535. [Google Scholar]
  4. Geada, P.; Moreira, C.; Silva, M.; Nunes, R.; Madureira, L.; Rocha, C.M.R.; Pereira, R.N.; Vicente, A.A.; Teixeira, J.A. Algal proteins: Production strategies and nutritional and functional properties. Bioresour. Technol. 2021, 332, 125125. [Google Scholar] [CrossRef] [PubMed]
  5. Subharda, B.G.; Edwards, M. Coproduct market analysis and water footprint of simulated commercial algal biorefineries. Appl. Energy 2011, 10, 3515–3523. [Google Scholar] [CrossRef]
  6. Balina, K.; Romagnoli, F.; Blumberga, D. Seaweed biorefinery concept for sustainable use of marine resources. Energy Procedia 2017, 128, 504–511. [Google Scholar] [CrossRef]
  7. Tako, M.; Tamanaha, M.; Tamashiro, Y.; Uechi, S. Structure of Ulvan Isolated from the Edible Green Seaweed, Ulva pertusa. Adv. Biosci. Biotechnol. 2015, 6, 645–655. [Google Scholar] [CrossRef] [Green Version]
  8. Cunha, L.; Grenha, A. Sulfated Seaweed Polysaccharides as Multifunctional Materials in Drug Delivery Applications. Mar. Drugs 2016, 14, 42. [Google Scholar] [CrossRef] [Green Version]
  9. Pezoa-Conte, R.; Leyton, A.; Baccini, A.; Ravanal, M.C.; Mäki-Arvela, P.; Grénman, H.; Xu, C.; Willför, S.; Lienqueo, M.E.; Mikkola, J.P. Aqueous Extraction of the Sulfated Polysaccharide Ulvan from the Green Alga Ulva rigida—Kinetics and Modeling. Bioenergy Res. 2017, 10, 915–928. [Google Scholar] [CrossRef]
  10. Mis, L.; Ambroz, J.; Machu, L. Health Benefits of Algal Polysaccharides in Human Nutrition. Adv. Food Nutr. Res. 2012, 66, 75–145. [Google Scholar] [CrossRef]
  11. Ngo, D.H.; Kim, S.K. Sulfated polysaccharides as bioactive agents from marine algae. Int. J. Biol. Macromol. 2013, 62, 70–75. [Google Scholar] [CrossRef]
  12. Wang, L.; Wang, X.; Wu, H.; Liu, R. Overview on Biological Activities and Molecular Characteristics of Sulfated Polysaccharides from Marine Green Algaein Recent Years. Mar. Drugs 2014, 12, 4984–5020. [Google Scholar] [CrossRef] [Green Version]
  13. Pankiewicz, R.; Łę, B.; Messyasz, B.; Fabrowska, J.; So, M.; Pikosz, M. First isolation of polysaccharidic ulvans from the cell walls of freshwater algae. Algal Res. 2016, 19, 348–354. [Google Scholar] [CrossRef]
  14. Prabhu, M.; Chemodanov, A.; Gottlieb, R.; Kazir, M.; Nahor, O.; Gozin, M.; Israel, A.; Livney, Y.D.; Golberg, A. Starch from the sea: The green macroalga Ulva ohnoi as a potential source for sustainable starch production in the marine biorefinery. Algal Res. 2019, 37, 215–227. [Google Scholar] [CrossRef]
  15. Coste, O.B.N. Study of the Green Alga Ulva for Its Use as Functional Food in Aquaculture: Development of Biotechnologic Processes to Determine the Bioactivity of the Sulfated Polysaccharide Ulvan. Ph.D. Thesis, Escuela Internacional de Doctorado en estudios del mar (EIDEMAR), University of Cadiz, Cádiz, Spain, 2018. [Google Scholar]
  16. Wahab, R.; Mustafa, M.T.; Salam, M.A.; Sudin, M.; Samsi, H.W.; Rasat, M.S.M. Chemical Composition of Four Cultivated Tropical Bamboo in Genus Gigantochloa. J. Agric. Sci. 2013, 5, 66. [Google Scholar] [CrossRef] [Green Version]
  17. Haykiri-Acma, H.; Yaman, S.; Alkan, M.; Kucukbayrak, S. Mineralogical characterization of chemically isolated ingredients from biomass. Energy Convers. Manag. 2014, 77, 221–226. [Google Scholar] [CrossRef]
  18. Danielewicz, D.; Surma-Ślusarska, B.; Żurek, G.; Martyniak, D. Selected Grass Plants as Biomass Fuels and Raw Materials for Papermaking. Part I. Calorific Value and Chemical Composition. BioResources 2015, 10, 8539–8551. [Google Scholar] [CrossRef] [Green Version]
  19. Cruz, N.; Bustos, C.; Aguayo, M.G.; Cloutier, A.; Castillo, R. Impact of the chemical composition of Pinus radiata wood on its physical and mechanical properties following thermo-hygromechanical densification. BioResources 2018, 13, 2268–2282. [Google Scholar] [CrossRef]
  20. Llano, T.; Macías, C.; Trancho, A.; Robles, J.; Arroyo, N.L.; Coz, A. Acid depolymerization of cell wall polysaccharides from Ulvan-rich extracts of green seaweeds. In Proceedings of the II International Congress on Biorefineries and Renewable Energies Supported in ICTs: BRESICT, Bogotá, Colombia, 17–20 February 2020; pp. 51–54. [Google Scholar]
  21. Llano, T.; Quijorna, N.; Andrés, A.; Coz, A. Sugar, acid and furfural quantification in a sulphite pulp mill: Feedstock, product and hydrolysate analysis by HPLC/RID. Biotechnol. Rep. 2017, 15, 75–83. [Google Scholar] [CrossRef]
  22. Fasahati, P.; Liu, J.J. Process Simulation of Bioethanol Production from Brown Algae; IFAC: New York, NY, USA, 2012; Volume 45, ISBN 9783902823052. [Google Scholar]
  23. Fasahati, P.; Woo, H.C.; Liu, J.J. Industrial-scale bioethanol production from brown algae: Effects of pretreatment processes on plant economics. Appl. Energy 2015, 139, 175–187. [Google Scholar] [CrossRef]
  24. Llano, T.; García-Quevedo, N.; Quijorna, N.; Viguri, J.R.; Coz, A. Evolution of lignocellulosic macrocomponents in the wastewater streams of a sulfite pulp mill: A preliminary biorefining approach. J. Chem. 2015, 2015, 102534. [Google Scholar] [CrossRef] [Green Version]
  25. Rajendran, K.; Kankanala, H.R.; Lundin, M.; Taherzadeh, M.J. A novel process simulation model (PSM) for anaerobic digestion using Aspen Plus. Bioresour. Technol. 2014, 168, 7–13. [Google Scholar] [CrossRef] [Green Version]
  26. Quintero, J.A.; Cardona, C.A. Process simulation of fuel ethanol production from lignocellulosics using aspen plus. Ind. Eng. Chem. Res. 2011, 50, 6205–6212. [Google Scholar] [CrossRef]
  27. Liu, J.; Wu, M.; Wang, M. Simulation of the process for producing butanol from corn fermentation. Ind. Eng. Chem. Res. 2009, 48, 5551–5557. [Google Scholar] [CrossRef]
  28. Haigh, K.F.; Petersen, A.M.; Gottumukkala, L.; Mandegari, M.; Naleli, K. Simulation and comparison of processes for biobutanol production from lignocellulose via ABE fermentation. Biofuels Bioprod. Biorefin. 2018, 12, 1023–1036. [Google Scholar] [CrossRef]
  29. Procentese, A.; Raganati, F.; Olivieri, G.; Russo, M.E.; Salatino, P.; Marzocchella, A. Continuous xylose fermentation by Clostridium acetobutylicum—Assessment of solventogenic kinetics. Bioresour. Technol. 2015, 192, 142–148. [Google Scholar] [CrossRef] [PubMed]
  30. Verma, R.; Dehury, P.; Bharti, A.; Banerjee, T. Liquid-liquid extraction, COSMO-SAC predictions and process flow sheeting of 1-butanol enhancement using mesitylene and oleyl alcohol. J. Mol. Liq. 2018, 265, 824–839. [Google Scholar] [CrossRef]
  31. Mansur, M.C.; Rehmann, M.S.; Zohaib, M. ABE Fermentation of Sugar in Brazil. Sr. Des. Rep. 2010, 4, 17. [Google Scholar]
  32. Llano, T.; Rueda, C.; Dosal, E.; Andrés, A.; Coz, A. Multi-criteria analysis of detoxification alternatives: Techno-economic and socio-environmental assessment. Biomass Bioenergy 2021, 154, 106274. [Google Scholar] [CrossRef]
  33. Llano, T.; Quijorna, N.; Coz, A. Detoxification of a LignocellulosicWaste from a Pulp Mill to Enhance Its Fermentation Prospects. Energies 2017, 10, 348. [Google Scholar] [CrossRef] [Green Version]
  34. Martín, M.; Grossmann, I.E. Energy Optimization of Bioethanol Production Via Hydrolysis of Switchgrass. AIChE J. 2011, 59, 215–228. [Google Scholar] [CrossRef]
  35. Cifuentes, A.D.; Rojas Alfaro, D.M. Inmovilización de Lipasa candida Rugosa en Soporte de Quitosano. Ph. D. Thesis, Facultad de Ingeniería y Arquitectura, Universidad Nacional de Colombia (Sede Manizales), Manizales, Colombia, 2005. [Google Scholar]
  36. Towler, G.; Sinnot, R. Chemical Engineering Desing: Principles, Practice and Economics of Plant and Process Design; Elsevier: London, UK, 2012; ISBN 978-0-08-096659-5. [Google Scholar]
  37. Kutsay, A.; Kratky, L.; Jirout, T. Biogas Plant Upgrade to CO2-Free Technology: A Techno-Economic Case Study. Chem. Eng. Technol. 2020, 43, 1981–1993. [Google Scholar] [CrossRef]
  38. Kutsay, A.; Kratky, L.; Jirout, T. Diversity of Biogas Plant Realizations. Chem. Eng. Technol. 2019, 42, 370–380. [Google Scholar] [CrossRef]
  39. Kratky, L.; Zamazal, P. Economic feasibility and sensitivity analysis of fish waste processing biorefinery. J. Clean. Prod. 2020, 243, 118677. [Google Scholar] [CrossRef]
  40. Okoli, C.O.; Adams, R.A.; Brigljevic, B.; Liu, J.J. Design and economic analysis of a macroalgae-to-butanol process via a thermochemical route. Energy Convers. Manag. 2016, 123, 410–422. [Google Scholar] [CrossRef] [Green Version]
  41. Dehghanzad, M.; Shafiei, M.; Karimi, K. Whole sweet sorghum plant as a promising feedstock for biobutanol production via biorefinery approaches: Technoeconomic analysis. Renew. Energy 2020, 158, 332–342. [Google Scholar] [CrossRef]
  42. Meramo-Hurtado, S.I.; González-Delgado, Á.; Rehmann, L.; Quinones-Bolanos, E.; Mehvar, M. Comparative analysis of biorefinery designs based on acetone-butanol-ethanol fermentation under exergetic, techno-economic, and sensitivity analyses towards a sustainability perspective. J. Clean. Prod. 2021, 298, 126761. [Google Scholar] [CrossRef]
  43. Zhang, X.; Thomsen, M. Techno-economic and environmental assessment of novel biorefinery designs for sequential extraction of high-value biomolecules from brown macroalgae Laminaria digitata, Fucus vesiculosus, and Saccharina latissima. Algal Res. 2021, 60, 102499. [Google Scholar] [CrossRef]
  44. González-Gloria, K.D.; Rodríguez-Jasso, R.M.; Shiva; Aparicio, E.; Chávez González, M.L.; Kostas, E.T.; Ruiz, H.A. Macroalgal biomass in terms of third-generation biorefinery concept: Current status and techno-economic analysis—A review. Bioresour. Technol. Rep. 2021, 16, 100863. [Google Scholar] [CrossRef]
  45. Ozturk, A.B.; Arasoglu, T.; Gulen, J.; Cheng, S.; Al-Shorgani, N.K.N.; Habaki, H.; Egashira, R.; Kalil, M.S.; Yusoff, W.M.W.; Cross, J.S. Techno-economic analysis of a two-step fermentation process for bio-butanol production from cooked rice. Sustain. Energy Fuels 2021, 5, 3705–3718. [Google Scholar] [CrossRef]
  46. Patel, A.; Gami, B.; Patel, P.; Patel, B. Biodiesel production from microalgae Dunaliella tertiolecta: A study on economic feasibility on large-scale cultivation systems. Biomass Convers. Biorefin. 2023, 13, 1071–1085. [Google Scholar] [CrossRef]
  47. Harahap, A.F.P.; Ramadhan, M.Y.A.; Lestari, T.; Gozan, M.; Srinophakun, P. Preliminary Plant Design of Biofuel from Algae in Balikpapan, East Kalimantan. IOP Conf. Ser. Earth Environ. Sci. 2019, 353, 012059. [Google Scholar] [CrossRef]
  48. Roesijadi, G.; Jones, S.B.; Zhu, Y. Macroalgae as a Biomass Feedstock: A Preliminary Analysis; Report of the Pacific Northwest National Laboratory, U.S. Department of Energy PNNL-19944; Pacific Northwest National Laboratory: Richland, WA, USA, 2010; pp. 1–50. [CrossRef] [Green Version]
  49. Echemi. Available online: https://www.echemi.com (accessed on 21 July 2022).
  50. Servicio, T.D.E.L. La Factura del Agua para Suministros Comerciales/Industriales año 2016 La Factura del Agua para Suministros Comerciales/Industriales. 2016. Available online: https://www.aiguesdebarcelona.cat/documents/20126/0/triptico_factura_comercial_es_2019.pdf/c5066bb6-2bf8-fcc8-6b08-821ef649bc01?t=1549472793366 (accessed on 9 January 2023).
  51. Intratec. Available online: https://www.intratec.us (accessed on 21 July 2022).
  52. Gengiah, K.; Gurunathan, B.; Rajendran, N.; Han, J. Process evaluation and techno-economic analysis of biodiesel production from marine macroalgae Codium tomentosum. Bioresour. Technol. 2022, 351, 126969. [Google Scholar] [CrossRef]
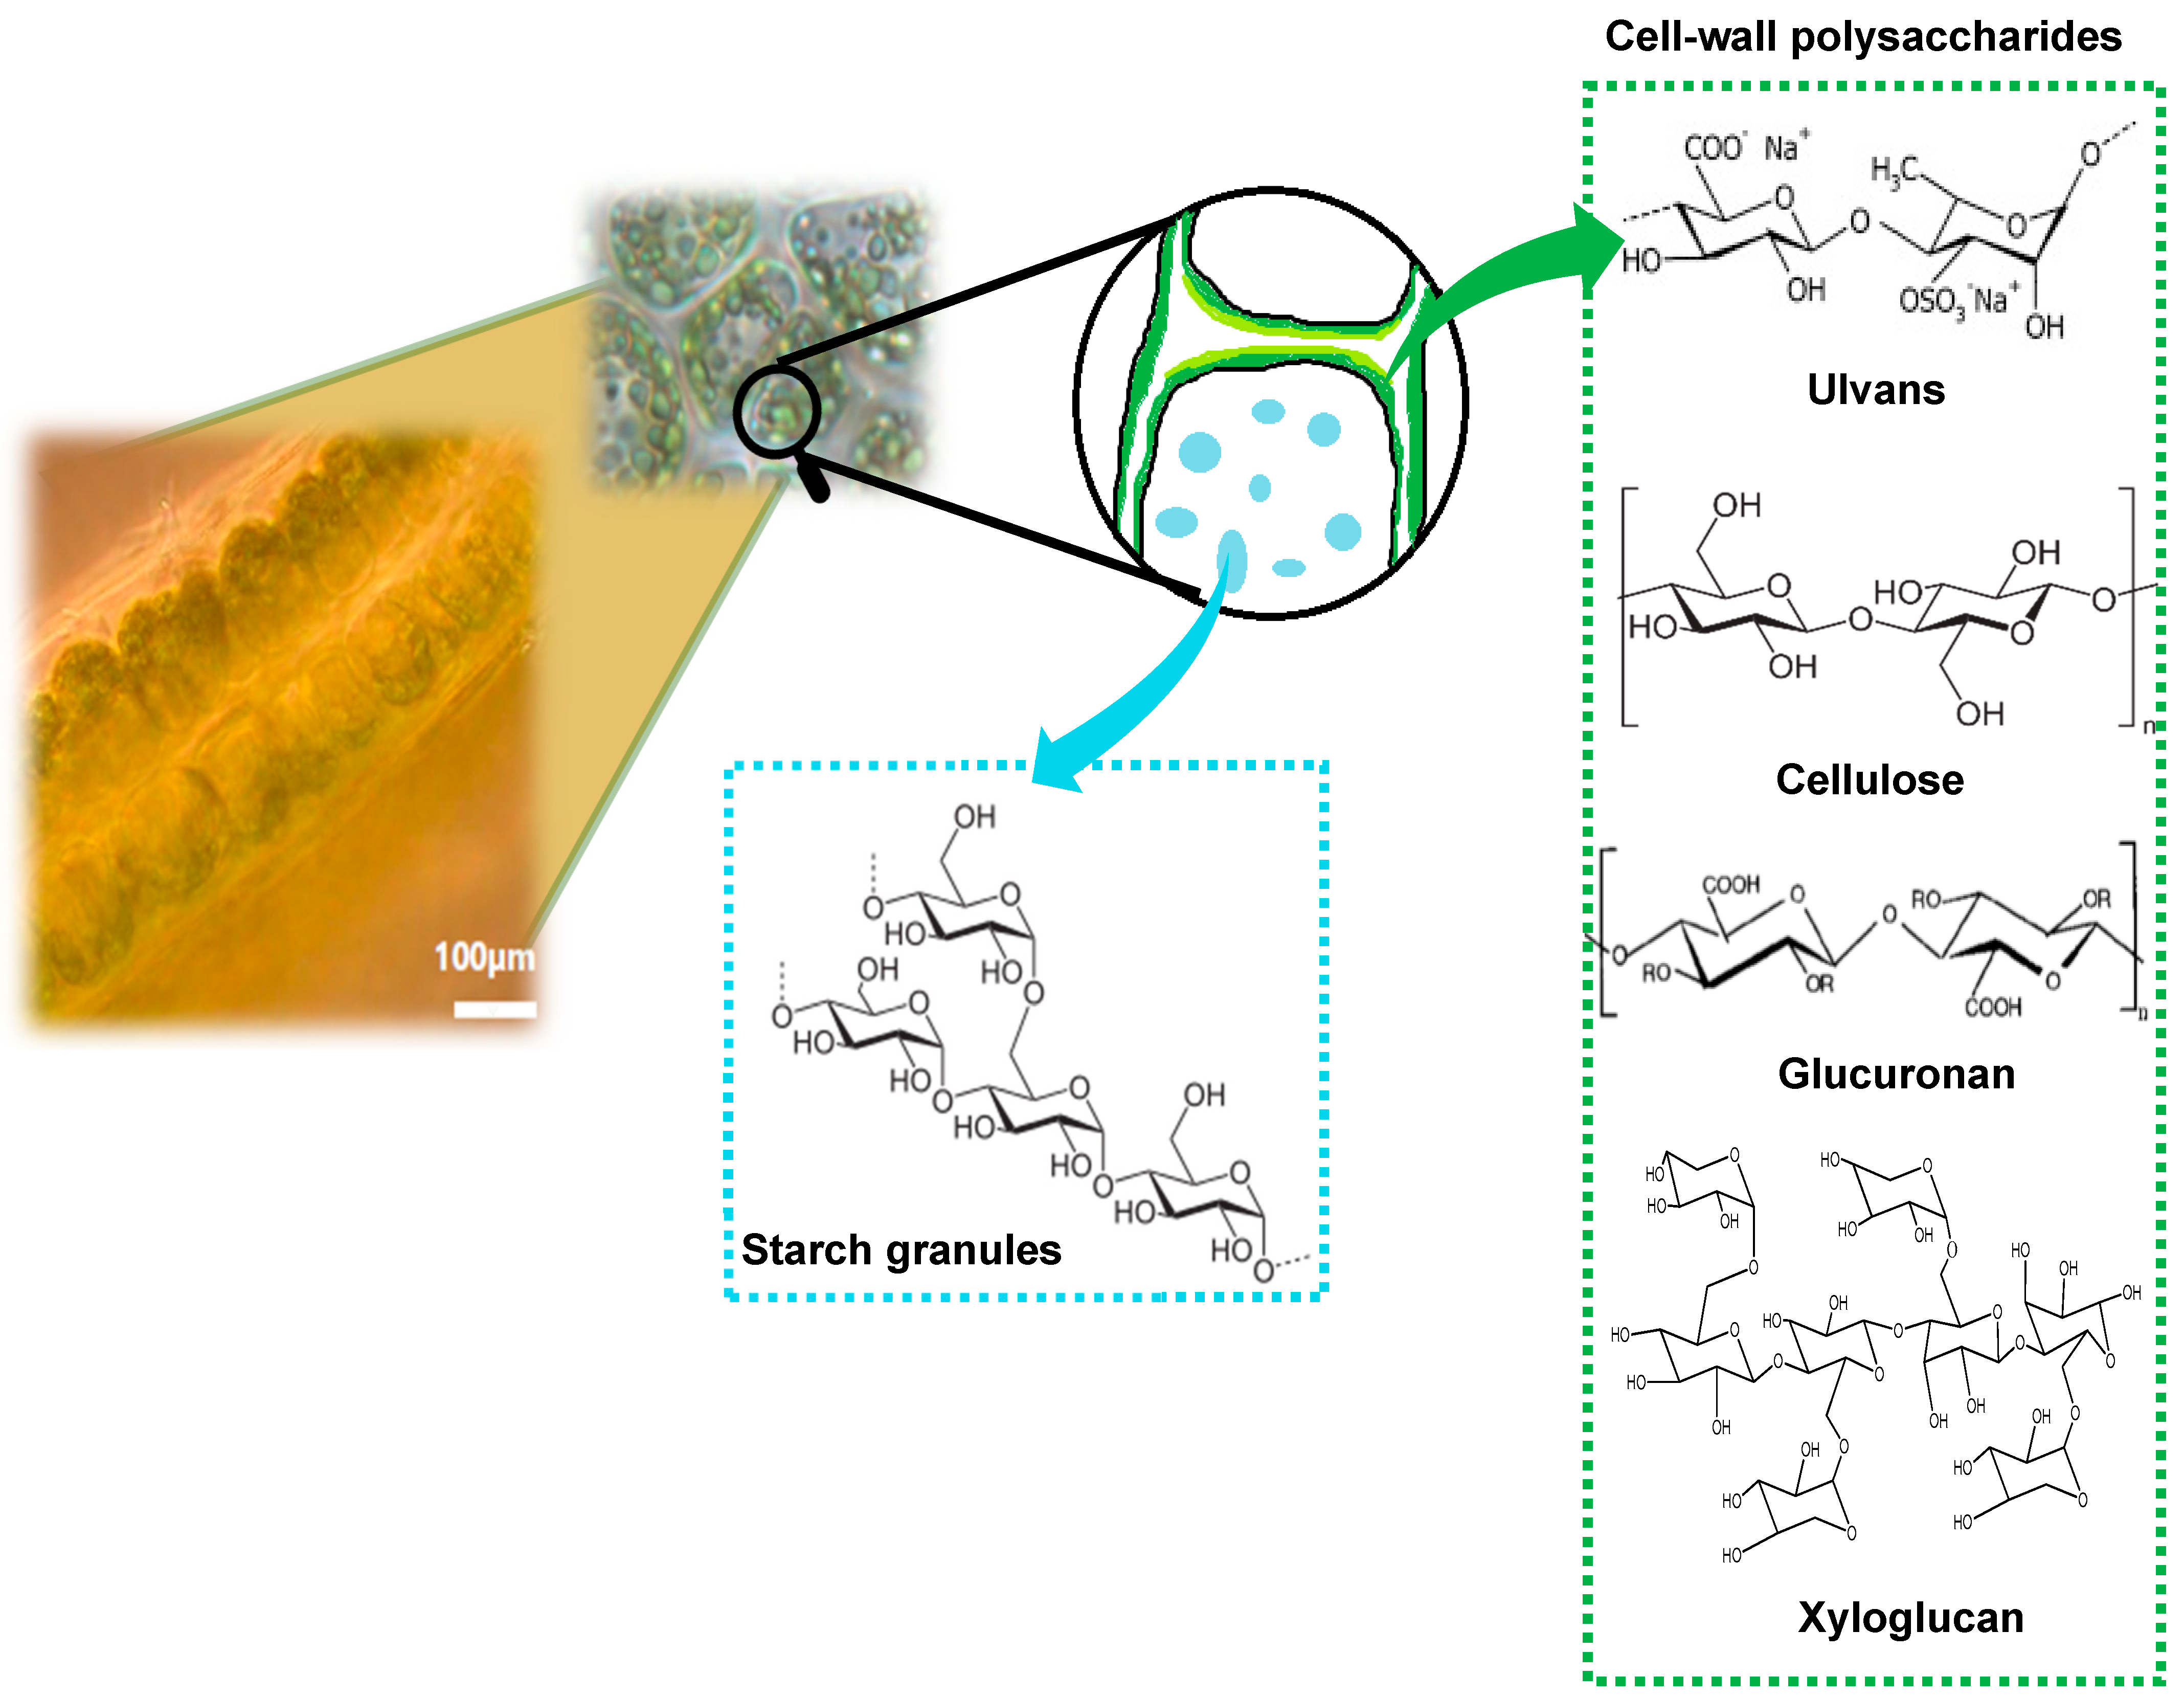
Figure 1. Structure of the family of polysaccharides of Ulva sp. Photography of Ulva sp. Talus by optical microscopy and microscopic observation of U. ohnoi by using light microscopy were both taken from the literature [14,15].
Fermentation 09 00340 g001
Figure 2. Scheme of polysaccharide and monomer characterization.
Fermentation 09 00340 g002
Figure 3. Flowsheet of the ABE plant.
Fermentation 09 00340 g003
Figure 4. Aspen Plus flowsheet of the bioethanol plant.
Fermentation 09 00340 g004
Figure 5. The estimation of the initial investment for the plants considered.
Fermentation 09 00340 g005
Figure 6. Sensitivity analysis for algae price.
Fermentation 09 00340 g006
Figure 7. Sensitivity analysis for the two third-generation biorefineries: (a) selling price of bioethanol; (b) selling price of butanol.
Fermentation 09 00340 g007
Table 1. Reaction scheme of the two-step acid hydrolysis and the ABE fermentation stage.
CompoundReactions of HydrolysisExtent of Reaction
Hemicellulose(C5H8O4)n + nH2O → nC5H10O50.60
Hemicellulose(C5H8O4)n + H2O → C2H4O20.40
ProteinC13H25O7N3S + 6H2O → 6.5CO2 + 6.5CH4 + 3NH3 + H2S0.9
TrioleinC57H104O6 + 3 H2O → C3H8O3 + 3 C18H34O20.9
Tripalmitin16C51H98O6 + 135 H2O → 64C3H8O3 + 39 C16H34O0.9
Cellulose(C6H10O5)m + mH2O → mC6H12O60.29 (first reactor)
0.9 (second reactor)
GlucoseC6H12O6 → C6H6O3 + 3H2O0.27
Reactions of ABE FermentationExtent of Reaction
C6H12O6 →C4H10O + 2CO2 + H2O0.629
C6H12O6 + H2O →C3H6O + 3CO2 + 4H20.322
C6H12O6 → 2C2H6O + 2CO2 + H20.014
C6H12O6 → C4H8O2 + 2CO2 + 2H20.018
C6H12O6 → 3C2H4O20.014
6 5 C5H10O5 → C4H10O + 2CO2 + H2O0.629
3 5 C5H10O5 → 2C2H5O + CO20.014
3 5 C5H10O5 → C4H8O2 + 2CO2 + 2H20.018
3 5 C5H10O5 → C2H4O2 + CO2 + H20.014
Table 2. Reaction scheme of the two-step acid hydrolysis and the bioethanol fermentation stage.
CompoundReactions of the First HydrolysisExtent of Reaction
Hemicellulose(C5H8O4)n + nH2O → nC5H10O50.92
Cellulose(C6H10O5)m + mH2O → mC6H12O60.29
XyloseC5H10O5 → C5H4O2 + 3H2O0.0046
ProteinC13H25O7N3S + 6H2O → 6.5CO2 + 6.5CH4 + 3NH3 + H2S0.90
TrioleinC57H104O6 + 3 H2O → C3H8O3 + 3 C18H34O20.90
Tripalmitin16 C51H98O6 + 135 H2O → 64 C3H8O3 + 39 C16H34O0.90
Reactions of the Second Hydrolysis
Cellulose(C6H10O5)m + mH2O → mC6H12O60.96
Hemicellulose(C5H8O4)n + nH2O → nC5H10O50.069
GlucoseC6H12O6 → C6H6O3 + 3H2O0.27
XyloseC5H10O5 → C5H4O2 + 3H2O0.10
Reactions of Bioethanol FermentationExtent of Reaction
GlucoseC6H12O6 → 2C2H5OH + 2CO20.92
Xylose3 C5H10O5 → 5 C2H5OH + 5CO20.80
Table 3. The estimation of production costs and revenues for each plant.
Production Costs (M$/Year)
ItemABEBioethanol
Total personnel costs0.580.58
Maintenance0.380.44
Property taxes0.140.16
Rent of land0.210.25
Environmental charges0.140.16
Materials6.042.74
Utilities38.0931.61
Raw material8.428.42
Total production costs54.0044.35
Revenues (M$/year)
Total67.4361.45
Pretax benefits13.4317.10
Depreciation and amortization1.111.29
Interest charges and others0.830.96
Profit before taxes11.4814.85
Income tax2.302.97
Net profit10.3013.17
Table 4. Cost of chemical compounds and raw material.
PlantABEBioethanolReferences
H2SO4 ($/t) 40[36]
H2O ($/m3) 1.9[37]
NaOH ($/t)400 [38]
Ca(OH)2 ($/t) 131.8[36]
Algae ($/t) 21[39]
Table 5. Investment parameters.
PlantABEBioethanol
BiorefineryVAN (M$)IRR
ABE6.580.27
Bioethanol15.900.36
Disclaimer/Publisher’s Note: The statements, opinions and data contained in all publications are solely those of the individual author(s) and contributor(s) and not of MDPI and/or the editor(s). MDPI and/or the editor(s) disclaim responsibility for any injury to people or property resulting from any ideas, methods, instructions or products referred to in the content.