Article

Influence of Fermentation Time on the Chemical and Functional Composition of Different Cocoa Clones from Southern Colombia

by
Paola Andrea Polanía-Hincapié
1,
Juan Carlos Suárez
2,3,*,
Héctor Eduardo Hernández
1,2,3,4,
Vivian Yorlady Ramón-Triana
1,3,
Liceth N. Cuéllar-Álvarez
5 and
Fernando Casanoves
3,6,7
1
Programa de Maestría en Sistemas Sostenibles de Producción, Facultad de Ciencias Agropecuarias, Universidad de la Amazonia, Florencia 180001, Colombia
2
Programa de Ingeniería Agroecológica, Facultad de Ingeniería, Universidad de la Amazonia, Florencia 180001, Colombia
3
Centro de Investigaciones Amazónicas CIMAZ Macagual César Augusto Estrada González, Grupo de Investigaciones Agroecosistemas y Conservación en Bosques Amazónicos-GAIA, Florencia 180001, Colombia
4
Programa de Doctorado en Ciencias Agrarias, Facultad de Ingenieria Agronomica, Universidad del Tolima, Ibagué 730001, Colombia
5
Programa de Química, Facultad de Ciencias Básicas, Universidad de la Amazonia, Florencia 180001, Colombia
6
Doctorado en Ciencias Naturales y Desarrollo Sustentable, Facultad de Ingeniería, Florencia 180001, Colombia
7
CATIE-Centro Agronómico Tropical de Investigación y Enseñanza, Turrialba 30501, Costa Rica
*
Author to whom correspondence should be addressed.
Fermentation 2023, 9(11), 982; https://doi.org/10.3390/fermentation9110982
Submission received: 10 October 2023 / Revised: 29 October 2023 / Accepted: 30 October 2023 / Published: 16 November 2023
(This article belongs to the Section Fermentation for Food and Beverages)

Abstract

:
Cocoa bean quality depends mainly on genetic material, edaphoclimatic factors and post-harvest processes such as fermentation. The impact of the fermentation process on the chemical and functional composition of different cocoa clones grown in southern Colombia was analyzed. A factorial design with repeated measures over time was used to analyze the effect of clone and fermentation time on chemical characteristics (bromatology, phenolic compounds and antioxidant activity). The bromatological characteristics showed significant differences between clones and fermentation time. Clones EET-8 and CCN-51 showed higher contents of acidity (0.51%), fat (63.61%), protein (12.85%) and carbohydrates (1.63 mg g−1). Moisture, acidity and sucrose increased their values between day 4 and day 6 of fermentation (p < 0.05). Phenolic compounds and antioxidant activity had significant differences between clones, where clones CCN-51 and ICS-95 had high contents of phenols (64.56 mg g−1), flavonoids (3.30 mg g−1) and DPPH reducing capacity (325.55 µmol g−1). In this sense, we consider the FSV-41 clone as the major grain quality index based on the results of chemical composition at the bromatological level, antioxidant activity and phenolic compounds.

1. Introduction

Cocoa (Theobroma cacao L.) is a cash crop with tropical distribution and its world production is around 4.955 million tons for the period 2021/22 (International Cocoa Organization [1]; production comes mainly from countries on the African and Latin American continent, which contribute around 70 and 13% of world volumes, respectively [2]. For producing countries, cocoa is an important economic, social, and cultural activity that is mostly developed in family farming [3]. In Latin America and the Caribbean, this activity is carried out by more than 350 thousand families and at least 1.7 million people depend on or directly benefit from its production [4].
In Colombia, there are 52,000 cocoa-producing families that depend directly on this crop [5]. This is produced in 30 of the 32 departments, where the department of Huila is the fourth largest producer of cocoa nationally, with a production of 4197 t per year [6], the production is recognized for its quality, as it has the distinction “fine aroma”, a situation that is recognized to only 7% of world production [7]. The cataloging of fine aroma cocoa for the origin of the department of Huila generates commercial opportunities for a sector that has been growing in area and production in recent years and has also gained recognition abroad, having greater export opportunities [7].
Cocoa bean quality depends on factors such as clone, crop management, climatic and edaphic factors, harvest, and post-harvest process (preconditioning of the pulp, fermentation, drying and roasting) and value-added processes (transformation of the raw material) [8]. In cocoa, fermentation is a prerequisite for the generation of flavor precursors [9], resulting in desirable changes in the chemical and sensory attributes of the product [10]. During this process, different chemical reactions occur that generate a large number of substances, among them, phenolic compounds and antioxidants that affect the organoleptic characteristics of the grain [11]. In addition, during fermentation, variations in temperature, pH and oxygen availability are generated, which affect protein, fat, and carbohydrate content [8].
Another factor affecting bean quality is the clone [12]. In this regard, Ramírez et al. [13] indicated that crosses between high-quality clones ensure the production of fine cocoa beans. Likewise, Nazario et al. [14] stated that the highest antioxidant activity against 1-1-diphenyl-2-picrylhydrazyl radical (DPPH) is presented by clones ICS-95 and TSH-1188, whereas clones IMC-67 and CCN-51 did not present good activity. In addition, bean weight and size are genetically inherited traits, being the clone and location determinants of some physical and chemical characteristics such as bean index, cob index, husk content, fat, fiber and protein [15]. Therefore, the objective of this work was to evaluate the effect of the fermentation process on the chemical and functional composition (content of phenolic compounds and antioxidant activity) in different cocoa clones grown in southern Colombia. To determine this variation, subindices (bromatological, antioxidant activity, phenolic compounds) and a grain quality index were developed in order to obtain a clone with a better chemical composition. The information generated will allow rural producers and cocoa associations to have the necessary information on the chemical composition of different clones during the fermentation process.

2. Materials and Methods

2.1. Study Area and Selection of Cocoa Clones

The study was carried out on farms in different municipalities located in the central region of the department of Huila (Rivera, Campoalegre, Hobo, Gigante, Algeciras and Tarqui). For the selection of the different farms (n = 11), criteria such as i. plots in production, ii. plots with an area greater than 1 ha of which 80% of the trees correspond to the same clone, and iii. plots with a shade canopy greater than 30%. Of the total number of selected farms, 32 plots were identified that had the different cocoa clones under study (Table 1). For each clone, four samples of cocoa beans were obtained from pods, each sample obtained from different plots. In each plot, 250 mature pods of each clone were systematically harvested at a stage of development between 20 and 22 weeks [16], without the presence of pests (Monalonion dissimultum) and diseases (Moniliophthora roreri and Phytophthora sp.) [17], and carried out between the months of March to June 2018, when the highest production pod is found. The cocoa clones found in the lots of the farms sampled are described in Table 1 which correspond to universal clones that have been introduced commercially and regional clones, products of the identification of production traits by FEDECACAO and AGROSAVIA.

2.2. Fermentation, Drying and Roasting of Cocoa Beans

After harvesting, fresh cocoa bean samples of 4 kg from each clone were obtained and fermented in wooden crates of 1 × 1 m, located 1 m above the ground. This process was carried out at the cocoa bean collection center located in the municipality of Campoalegre (department of Huila), belonging to the Association of Small Cocoa Producers of Campoalegre, Huila (ASOPECA). The mass of each cocoa sample was placed in a tulle bag duly labeled with the information of the clone, lot and farm, samples that were subjected to the same fermentation process in order to avoid variations due to this process [21]. From the second day on, the cocoa mass was turned, a process that was carried out every 24 h until the end of fermentation (day 8). In order to determine the effect of the fermentation process, samples were collected from four bags (replicates) for each clone at 0, 2, 4, 6 and 8 days of fermentation. After this process, the grains of each sample were subjected to the drying process by exposure to the sun until reaching between 7 and 8% moisture [22]. Subsequently, the grains were roasted in a ROASTY model oven, of which the drying was programmed with a development time of 15 min with initial and final temperatures of 80 and 120 °C, respectively [23]. Finally, the husk of the mass was removed manually, and the beans were ground manually to obtain the cocoa nibs.

2.3. Determination of Chemical Characteristics of Beans from Different Cocoa Clones during the Fermentation Process

Different bromatological characteristics (eight variables), phenolic compounds (six variables) and antioxidant activity (two variables) were determined in each cocoa sample following the methods mentioned in Table 2.

2.3.1. Component Bromatological

The pH and acidity in cocoa beans were measured according to the methodology proposed by Espín and Samaniego [24]. Five grams of cocoa bean sample was placed in an Erlenmeyer flask with 50 mL of distilled water, and the mixture was shaken continuously for one hour. Subsequently, the extract was filtered using qualitative filter paper (3 hw, 110 mm, 65 g m−2; Boeco, Hamburg, Germany). For pH, 10 mL of the extract was taken and measured using a previously calibrated potentiometer. For acidity, 25 mL of the extract was taken by adding five drops of phenolphthalein and titrating with a 0.1 N sodium hydroxide (NaOH) solution until the first turn of the indicator to pink persisted for 30 s and the final pH was 8.3. The results of the pH measurement were reported as pH units and those of acidity as a percentage of citric acid. The methodology of Espín and Samaniego [24] was used for moisture determination. An aluminum container was brought to constant weight, subsequently, 10 g of cocoa beans were weighed in the container and left in the oven (Heratherm OMH400, Fisher Scientific, Madrid, Spain) at 105 ± 5 °C for 12 h. Finally, the container with the sample was removed to a desiccator, allowed to cool and its weight was recorded. The results were expressed as a percentage of moisture.
The ash content was determined by setting a porcelain crucible to constant weight and incinerating 3 g of cocoa beans in a muffle furnace (1100 °C, 22.9 A Fisher Scientific, Spain) at 550 ± 5 °C until the sample was free of carbon, cooled in a desiccator and the amount of ash was calculated by expressing its content in percentage [25]. The fat was calculated by the soxhlet method with petroleum ether [24], this was brought to constant weight in a fat crucible and 70 mL of petroleum ether was added, then 5 g of cocoa bean was extracted using the semi-automatic solvent extractor (SER 148 VELP Scientifica, Usmate, Italy) at a temperature of 210 °C. Finally, the crucible was removed from the equipment, transferred to a desiccator and allowed to cool to room temperature, recording the weight of the crucible plus the fat content. The results were expressed as a percentage. Total nitrogen was determined by the Kjeldahl method [26] with digestion and distillation units (DK 6 and UDK 139 VELP Scientifica, Italy); 1 g of cocoa kernel was weighed, then added into the Kjeldahl tube together with 15 mL of 98% v/v sulfuric acid (H2SO4) and three catalyst tablets and digested for one hour. Once the sample was cooled, it was placed in the terminal tube of the coolant of the distiller with 30mL of boric acid (H3BO3) at 3% plus five drops of tashiro indicator. Finally, it was titrated with 0.1 N hydrochloric acid (HCl). The nitrogen to crude protein content was calculated using a conversion factor of 6.25 for all samples. The results were expressed as a percentage.
For sucrose determination, 2 g of cocoa beans were weighed and added to a test tube, then 4 mL of distilled water was added and shaken for half an hour. The extract was filtered with qualitative filter paper (3 hw, 110 mm, 65 g m2; Boeco, Germany), adding three drops in the digital brix refractometer (MA871, Milwaukee) and the respective reading was taken. The results were expressed as °Brix, which corresponds to the percentage of sucrose. Total sugar content was determined by the phenol-sulfuric colorimetric method according to the methodology proposed by Dubois et al. [27]. In a 2 mL reaction tube, 210 µL of the extract was mixed, then 200 µL of freshly prepared 80% phenol was added and shaken in an extraction cabinet. Subsequently, 1 mL of 98% (v/v) sulfuric acid (H2SO4) was added. It was stirred for one minute and allowed to cool at room temperature and in the dark and read after 15 min at an absorbance of 490 nm. D-glucose standard of intermediate concentration was used as the standard. The content was expressed as mg glucose/g cocoa bean.

2.3.2. Phenolic Compounds

First, the methanolic extract of roasted cocoa beans was obtained by weighing 0.7 g of cocoa beans and adding 7 mL of HPLC-grade methanol to a glass test tube with a screw cap. This mixture was kept in darkness and percolation for 8 days, at the end of this time the solvent was filtered, rotaevaporated and the extract was stored at 4 °C. The analyses were performed in triplicate on the MultiSkan Go (Thermo Fisher Scientific, Waltham, MA, USA) and on the high-performance liquid chromatograph (Shimadzu LC-2010HT, Kyoto, Japan). With this extract, the contents of total phenols, total flavonoids, catechin, epicatechin, theobromine, caffeine, DPPH and FRAP were analyzed.
The determination of total phenolic content was carried out spectrophotometrically using the Folin–Ciocalteu colorimetric method [28]. Eighteen µL of the extract, 124.5 µL of deionized water, 37.5 µL of Folin–Ciocalteu’s reagent and 120 µL of 7.1% anhydrous sodium carbonate (Na2CO3) were taken. It was allowed to react for 60 min in the dark at room temperature, after which the absorbance was read at 760 nm. Gallic acid was used as standard. The results were expressed as mg gallic acid (GAE)/g dry extract. Total flavonoid content was determined by reaction with aluminum chloride (AlCl3) [29]. The reaction mixture consisted of 120 µL of deionized water, then 30 µL of the extract was added, followed by 9 µL of 5% sodium nitrite (NaNO2) (waited 5 min), 9 µL of 10% aluminum chloride (AlCl3) (waited 5 min), then 60 µL of 1 M sodium hydroxide (NaOH) (waited 15 min) and finally 72 µL of deionized water. It was left to react in the dark at room temperature for 30 min and the absorbance was read at 510 nm. (+)-catechin was used as a standard for total flavonoid quantification. Results were expressed as mg catechin (EC)/g dry extract.
Quantification of (+)-catechin and (-)-epicatechin was carried out with HPLC standards, Sigma Aldrich brand on a Restek- Pinnacle RP-18 column (15 μm), particle size 5 µm. The mobile phase consisted of a binary mixture of Acetic Acid 3%: Acetonitrile HPLC in a ratio (90:10), with a flow rate of 1 mL/min, sample injection volume of 5 µL and oven temperature at 30 °C. The elution was monitored at 280 nm [30]. A standard curve was performed using (+)-catechin and (-)-epicatechin in a concentration range of (1–30 mg/L). The results were expressed as mg (+)-catechin/g and mg (-)-epicatechin/g dry extract) [30]. The quantification of theobromine and caffeine [31] was carried out with HPLC standards, Sigma Aldrich brand in a Restek-Pinnacle RP-18 column (15 μm), particle size 5 µm. As a mobile phase, 100% methanol was used in isocratic mode at a flow rate of 1 mL/min, sample injection volume of 5 µL and oven temperature at 30 °C. The elution was monitored at 280 nm [31]. A standard curve was performed using theobromine and caffeine in a concentration range of (1–30 mg/L). Results were expressed as mg theobromine and caffeine/g dry extract [31]. These chromatographic analyses were performed on a liquid chromatograph (Shimadzu LC-2010HT), equipped with an autosampler, a LC-2010CHT pump, UV-VIS detector and LC-Solutions analyzer software.

2.3.3. Antioxidant Activity Compounds

DPPH radical scavenging activity (DRSA) was analyzed by the colorimetric method [32]. A stock solution of DPPH (20 mg/L) in absolute methanol was prepared; the absorbance of the radical was adjusted to 0.3 absorbance units with methanol at 4 °C, then 3 µL of the extract and 297 µL of the adjusted DPPH solution were taken. It was allowed to react in the dark for 30 min at room temperature and the absorbance was read at a wavelength of 517 nm. The results were expressed as TEAC values in µmol Trolox/g dry extract, by constructing a reference curve using TROLOX as antioxidant. The FRAP (ferric reducing antioxidant power) evaluates the antioxidant capacity of a sample according to its ability to reduce ferric iron (Fe+3) present in complex with 2,4,6-tri(2-pyridyl)-s-triazine (TPTZ), to the ferrous form (Fe+3) [32]. The assay was carried out in a pH 3.6 acetic acid-sodium acetate buffer containing TPTZ and FeCl3; 15 µL of the extract, 15 µL of buffer and 270 µL of FRAP solution were used as sample. It was allowed to react in the dark for 30 min at room temperature and the absorbance was read at a wavelength of 590 nm. The FRAP values were expressed as µmol ascorbic acid (AA)/g dry extract, based on a reference curve of ascorbic acid as the primary standard.

2.4. Statistical Analysis

Data were analyzed using linear mixed models (LMM), where clone (CCN-51, EET-8, TSH-565, ICS-1, ICS-60, ICS-95, SCC-61, FSV-41) and fermentation time (0, 2, 4, 6 and 8 days) were the fixed factors and farms as lots were included as random effects. Assumptions of normality and homogeneity of variance were assessed by exploratory analysis of residuals. Differences between factors were analyzed using the LSD Fisher test. Subsequently, a principal component analysis (PCA) was performed to determine the multivariate relationships between the variables evaluated and the cocoa clones during the fermentation process [33]. In order to be able to assess the chemical quality of cocoa, an indicator was generated [23], which was constructed by transforming the values of each of the variables of the three components (Table 2) into scores with values from 0 to 1, using a standardized scoring function, under the criteria: I. More is better, suitable for standardizing the scores of cocoa properties (indicators) in cocoa quality, associated with values close to one (1), II. Less is worse, those properties whose values were close to zero (0). The variables moisture, total acidity, DPPH and FRAP were multiplied by (−1) to invert the value. Subsequently, the variables were summed by components (Table 2) and transformed back to the interval (0, 1). In this way, an index was generated for each component, these indices were summed and transformed (0, 1) to obtain the indicator of chemical quality of cocoa beans. Subsequently, a Pearson correlation analysis was performed to determine the relationships between the variables characterized [33]; for the analysis, the types of correlations used by Di Rienzo et al. [34] were taken into account: weak correlation (−0.01 to −0.1 or 0.01 to 0.1), medium correlation (−0.11 to −0.50 or 0.11 to 0.50), considerable correlation (−0.51 to −0.75 or 0.51 to 0.75), very strong correlation (−0.76 to −0.90 or 0.76 to 0.90) and perfect correlation (−0.91 to −1 or 0.91 to 1). Finally, a Multiple Factor Analysis (MFA) was performed in which the variables with the highest contribution for each component, their synergies and trade-offs were identified. The LMMs were performed using the lme function of the nlme package, the PCA and the graphical outputs were performed in the packages ade4, ggplot2, factoextra and corrplot in the R language software, version 4.2.0 [35], using the RStudio interface [35].

3. Results

3.1. Bromatological Characteristics of Beans from Different Cocoa Clones during the Fermentation Process

Bromatological characteristics showed differences (p < 0.05) between clones and days of fermentation, but no significant interactions were found (Table 3). Only for fat and total carbohydrates between clones were there no differences and for sucrose and total carbohydrates at the level of fermentation time. As fermentation time increased, variables such as moisture and acidity increased their values with respect to the initial value; however, ash, fat, and crude protein content, as well as pH values, decreased as a function of fermentation time (Table 3).

3.2. Phenolic Content and Antioxidant Activity of Beans from Different Cocoa Clones during the Fermentation Process

For the variables associated with the content of phenolic compounds and the antioxidant activity of the cocoa beans, there was no interaction between clones and fermentation time, nor was there an effect of fermentation time; only the clone factor was significant for some variables (Table 4). The content of phenolic compounds (total phenols and flavonoids, catechin, epicatechin, theobromine and caffeine) showed statistical differences between clones (p < 0.05) (Table 4). The highest concentrations of total phenols were recorded in clones TSH-565 and CCN-51 with values 60.97 and 64.56 mg g−1, respectively, while clones SCC-61 and ICS-60 had the lowest concentrations decreasing by 45.2 and 38.1% with respect to clone CCN-51. Clones CCN-51 and ICS-60 had higher total flavonoid contents, with values of 3.30 and 2.84 and mg g−1 respectively; on the contrary, clones TSH-565 and ICS-1 presented the lowest contents, decreasing their concentration significantly by 61 and 48% with respect to CCN-51 (Table 4).
Catechin and epicatechin had higher contents in clones CCN-51 and ICS-60, with concentrations of 1.90 and 1.95 mg g−1 and 0.48 and 0.49 mg g−1, respectively, while clones TSH-565 and ICS-1 obtained the lowest values, with a reduction of 12.30 and 8.71% for catechin and 10.20 and 6.1% for epicatechin. Clone TSH-565 presented lower theobromine and caffeine contents, decreasing by 6.7 and 7.9% with respect to clone ICS-60 (Table 4). Ferric reducing antioxidant power (FRAP) and 1-1-diphenyl-2-picrylhydrazyl radical (DPPH) decolorization did not show significant differences between clones (Table 4). Their behavior at the clone level ranged from 169.51 to 356.18 µmol g−1 and 350.01 to 168.71 µmol g−1, respectively (Table 4).
Figure 1 shows the association of the variables evaluated both at the clone level (Figure 1a) and fermentation time (Figure 1b) in the biplot plane obtained from the principal components analysis. The principal component analysis (PCA) at the clone level in its first two components explained 72.9% of the variance, component one related attributes such as crude protein and fat content with clones EET-8, TSH-565, ICS-1 and SCC-61. In component two, clones ICS-1 and TSH-565 were related to total phenol content, as were clones ICS-95 and CCN-51 to attributes such as caffeine, theobromine, catechin, epicatechin, total flavonoids, FRAP and DPPH (Figure 1a). As for sugar content (total carbohydrates and sucrose), these were related to clones FSV-41 and ICS-60, while moisture and total acidity did not show any relationship. At the level of fermentation time, the PCA explained 83.3% of the variance, where component one separated the fermentation days in which high contents of fat, crude protein, ash, and pH were higher both at time zero and day two (Figure 1b). In component two the samples were separated by high phenol contents.
When relating the different variables measured in sub-indicators proposed to measure quality in terms of chemical composition, at the clone level we found that FSV-41 presented the highest values for the grain quality index (p < 0.05, Figure 2A). Likewise, at the clone level, the bromatological and phenolic compound sub-indicators showed significant differences (p < 0.05), with FSV-41 and TSH-565 presenting the highest values, respectively (Figure 2A). At the level of fermentation time, both at the initial moment and on the second day, the highest values were found for the grain quality index and the bromatological sub-indicator (Figure 2B, p < 0.05). Finally, the antioxidant activity sub-indicator on days 4 and 6 showed the lowest values for the phenolic compounds index (Figure 2B, p < 0.05).

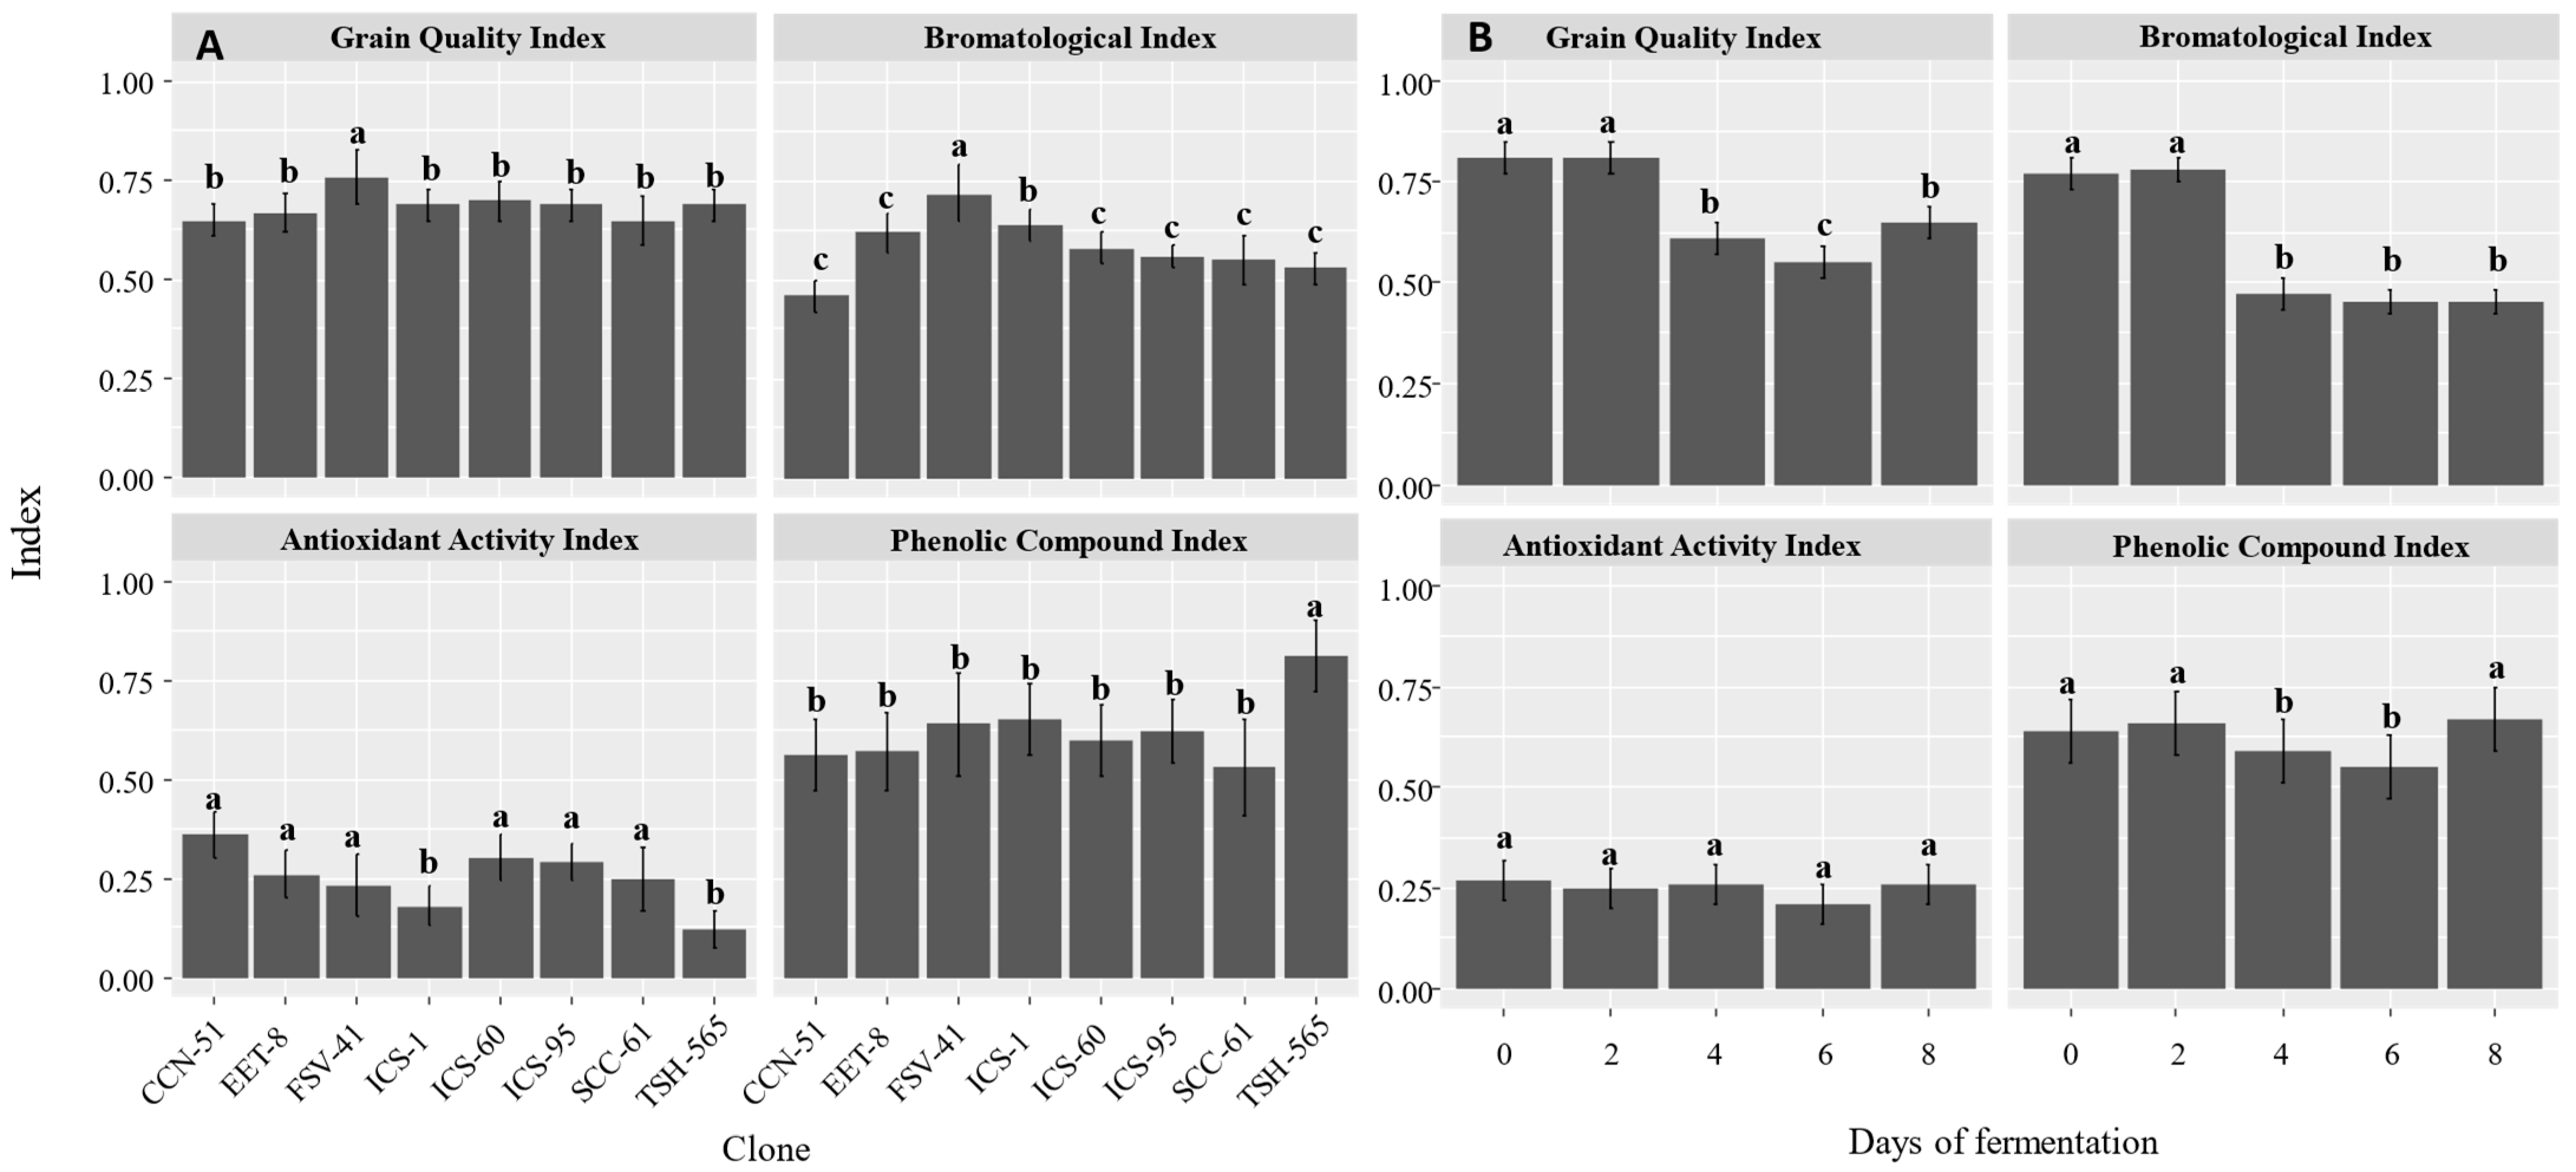
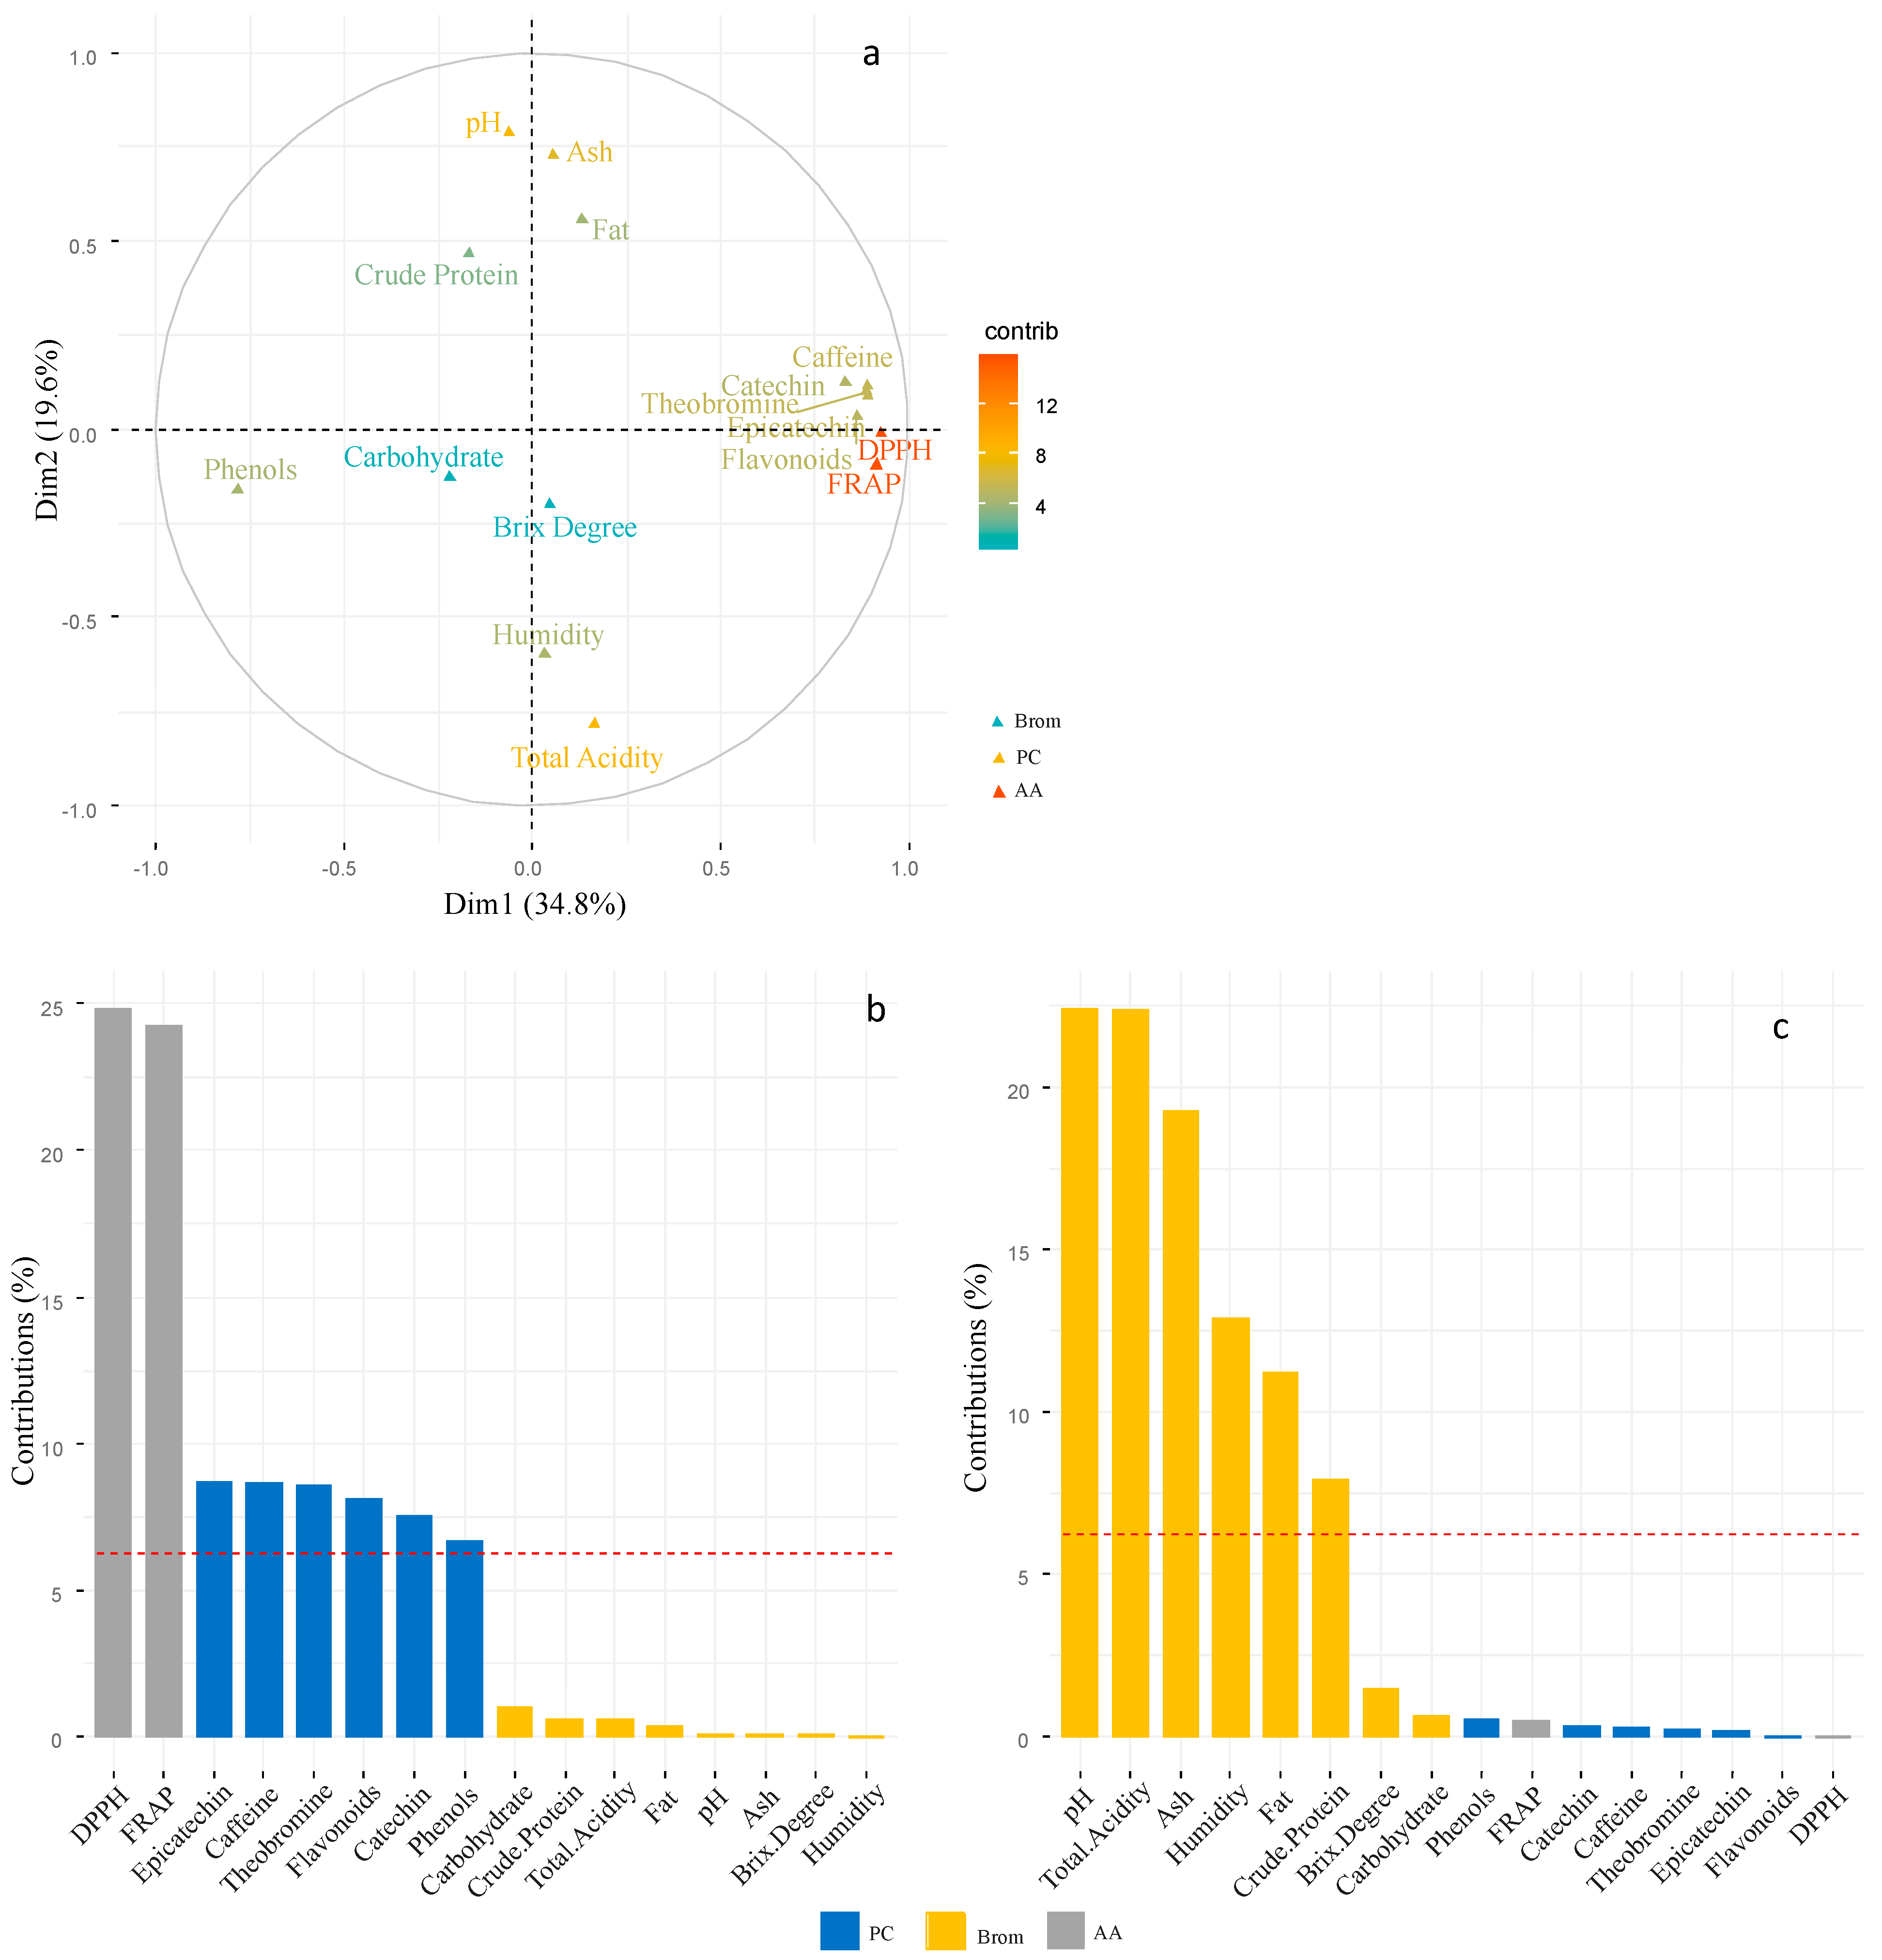
3.3. Correlations between the Different Bromatological Characteristics, Phenolic Compounds and Antioxidant Activity of Cocoa Beans

From the Multiple Factor Analysis performed with the 16 variables, 54.4% of the variance was explained, where those that contributed the highest proportion in principal component one (Figure 3a, p < 0.05) were DPPH and FRAP of the phenolic compounds variables (Figure 3b), followed by epicatechin, caffeine, theobromine, flavonoids, catechin and phenols that make up the antioxidant activity variables (Figure 3b). In the principal component two, the variables that contributed the highest proportion (p < 0.05) were the majority that make up the bromatological component excluding sucrose and carbohydrates (Figure 3c).
According to the spatial distribution of the variables of each of the components (Antioxidant Activity, Bromatological, Phenolic Compound) in the plane of each of the factors analyzed, clone and fermentation time (Figure 3a,b), it is possible to determine the positive relationships as well as the degree of contribution of the variables in each factor. For example, total acidity correlated negatively with pH, ash and fat, and a similar situation occurred between phenols and different variables FRAP, DDPH, among others. When analyzing the contribution of the variables, we found different contributions per factor, as shown by the variables above the red line (Figure 3b,c). For example, FRAP and DDPH were the variables with the highest contribution in the clone factor, the opposite behavior in the fermentation time factor. In the case of the variables with the highest contribution in the fermentation time factor, pH and total acidity presented the highest contributions.

4. Discussion

In general, we found a variation in the chemical composition at the clone level and during the fermentation process, in this sense, we highlight how the bromatological variables and those related to antioxidant capacity vary significantly among clones. Likewise, when analyzing the incidence of the fermentation process, differences were found in the bromatological variables and phenolic components. The incidence of these factors on the variables evaluated is discussed below.

4.1. Bromatological Characteristics of Beans from Different Cocoa Clones during the Fermentation Process

During the fermentation process, there were no significant variations in some variables; for example, the average moisture content was 2.74%, an adequate value to ensure the storage, transport, and processing of the product [36] as well as the preservation of the product [37]. The percentage of ash found for clones such as FSV, SCC, CCN and ICS are similar to those reported by Perea et al. [38], with values ranging between 2.7 and 3.5%, while for EET clones it coincides with that stated by Vera et al. [39], who found an average value of 3.2%. In addition, the percentage of ash for all clones is within the stipulations of the AOAC [40] standard, as Perea et al. [38] mention that ash values for cocoa should be less than 4%.
It was verified that as the acidity increased the pH decreased the behavior generated by fermentative reactions under microbiological action on the carbohydrates present in the mucilage [36]. During this process, high levels of acetic acid are generated, which is the predominant acid in the cocoa bean and the cause of their acidification, which is why the less fermented grains have lower acidity and higher pH, because in the absence of an adequate fermentation process, the degradation of carbohydrates is not carried out and these are not released during the drying and roasting process [41].
The fat content for the evaluated clones is adequate, since it presents a value higher than 48% as indicated by NTC 793, and similar to that reported by Perea et al. [38]. Some authors have studied [38,42] the variability in fat content and have concluded that the increase in temperature has a significant effect on the stearoyl-acyl transport protein protein, since it decreases the transfer of glycerides such as oleic, palmitic and stearic acid, reducing the fat percentage since it is mostly constituted by these acids [43]. In addition, fat was reduced during the fermentation process due to the increase in temperature in the first 48 h that causes a release of fat in the almonds [44], at which time the fatty acids that compose it begin to be lost by leaching [43].
The crude protein percentages of the FSV, SCC, CCN and ICS clones are similar to those reported by Perea et al. [38], with values ranging from 12.9 to 14.2%. Adequate protein range is demanded by companies that produce feed mixtures because raw materials with contents higher than 10% protein have a greater impact on the nutritional quality of the product [45]. As for the content during the fermentation process, there is a variation due to the microbiological activity that develops during this process and the requirement of substrates (proteins and minerals) to carry it out, as well as the dragging effect of these by the draining that occurs during fermentation [36].
The sucrose content (°Brix) in the evaluated clones shows a significant increase, being different from that reported by Loureiro et al. [22] and Barrientos et al. [46], since in their research, they obtained values of 1.3 and 0.5%, respectively, for fermented cocoa beans. This increase may be related to the shade of the cocoa plantations evaluated, showing that more shade causes a delay in ear maturation by a few days [47], increasing the mucilage content in the bean and thus increasing the concentration of sugars (carbohydrates) [22]. Although these sugars did not present statistical differences in both the clone factor and the fermentation time, there are reactions that are generated specifically during the roasting process that can affect the content of this variable [48,49], specifically during the roasting process. At this moment, a series of transformations are generated that originate aromatic compounds due to the reduction in carbohydrates and proteins that are concentrated in the cocoa bean [11].

4.2. Phenolic Content and Antioxidant Activity of Beans from Different Cocoa Clones during the Fermentation Process

The total phenol content coincides with that reported by Zapata et al. [50], with values ranging from 21.69 to 38.64 mg g−1 in unfermented grains and from 22.58 to 50.23 mg g−1 in fermented grains, for clones such as CCN-51, ICS-1, ICS-60, ICS-95 and TSH-565. In addition, the variability of the results obtained may be due to the characteristics of each clone, since according to Ramón et al. [23] and Zapata et al. [11] there are internal and external factors that affect the quality and quantity of phenolic compounds in plants, such as genetic diversity, maturity stage, environmental variables, extraction method, processing and storage. On the other hand, the content of total phenols although not significant, presented higher values during the first days, this is mainly due to the formation of polymeric proanthocyanidins during this process since these are equivalent to 58% of the total phenols in the cocoa bean [50].
The content of total flavonoids is similar to that reported by Zzaman et al. [51] in roasted cocoa beans. In addition, these authors also mention that the concentration of this compound is given by the contents of flavanoiles, flavonols, flavones and anthocyanins present in cocoa, where the most abundant flavonoids are catechin and epicatechin, which is why the total flavonoid content is more abundant in clones CCN-51, EET-8 and ICS-60, since they present the highest concentrations in these variables. The reduction in total flavonoid content in the roasting process can take place thanks to the high oxidation during the method, due to the presence of oxygen, or also to the effect of oxidative enzymes, which can also generate flavonoid losses during the conventional roasting process [51].
The catechin and epicatechin content found in the cocoa beans in the study were adequate since they coincide with those reported by Zapata et al. [11] in clones such as CCN-51, ICS-1, ICS-60, ICS-95 and TSH-565, which clarify that these compounds are influenced by clone and roasting. These same authors report that clone CCN-51 has the highest catechin content in roasted grains, which is similar to that found in this work. Epicatechin decreased considerably, this reduction may be due to the increase in temperature in the roasting process, which causes this compound to modify its structure and rearrange or transform into another from hydroxyl groups (H+ and OH−) [52]. Likewise, the catechin content, although it does not present significant differences during the fermentation process, tends to decrease this content. This is mainly due to the fact that this type of polyphenols are oxidized to quinones and these compounds can complex with amino acids, peptides and proteins and polymerize with other flavonoids to form tannins [11], in addition, the reduction can also be caused by the diffusion of phenolic compounds in the exudates released during this process [50].
Theobromine and caffeine values are similar to those reported by Zapata et al. [11], with ranges from 0.41 to 3.11 mg g−1 and from 0.16 to 1.21 mg g−1 for theobromine and caffeine, respectively, determining the type of cocoa clone as a main source of variation in the content of these alkaloids [53]. However, during the fermentation process, although there was no statistically significant reduction, the theobromine and caffeine content is mainly due to the diffusion of these alkaloids with cell liquids [53]; moreover, the content of these compounds is higher during the first days of fermentation and gradually decreases as fermentation time increases. The above is due to the accumulation through the grain coat during the first days of the fermentation process which increases the content [50,53]. However, theobromine and caffeine content decreases considerably after the roasting process, because during this process there is an increase in substances related to dicetopiperazines, which interact with these alkaloids and reduce their concentration [11].
The antioxidant activity of the free radical DPPH presented values similar to those reported by Zapata et al. [50] in five of the eight clones evaluated (CCN-51, ICS-1, ICS-60, ICS-95 and TSH-565), obtaining values between 224.52 and 350.01 µmol g−1. These results are related by the total flavonoid content, since there is a linear relationship between DPPH values and total flavonoids, because this radical reacts with hydrogen (H) donors and phenolic compounds [50,54,55]. On the other hand, the reducing capacity of the FRAP free radical presented values similar to those found by Perea et al. [56] in fermented cocoa beans where they report an average value of 361.15 µmol g−1.

4.3. Correlation of Bromatological Characteristics, Phenolic Compounds, and Antioxidant Activity of Beans from Different Cocoa Clones during the Fermentation Process

The percentage of ash correlates positively with the percentage of fat, crude protein and pH, this is due to the fact that these variables present higher values in the first days of fermentation and gradually decrease with time. The decline in protein takes place thanks to the demand for these molecules and minerals, plus the draining that occurs during fermentation [57]. The decline in fat percentage is due to the increase in temperature that occurs during the first 48 h [44], where losses by leaching of fatty acids begin since this process only takes place from the third day [43]. Likewise, pH decreases due to the production of acetic acid [36], an acid that increases with the passing of days in the fermentation process, which in turn, is responsible for the increase in grain acidity, negatively correlated with ash content.
On the other hand, the percentage of ash is reduced due to the exudation produced by the dough during fermentation, so it tends to lose soluble minerals that lead to an imbalance in the concentration of this substance in the kernel [58,59]. When the fermentation process is not carried out properly, there is no demand for proteins, minerals, increased temperature, formation of acetic acid and leaching, so that the protein, fat, pH and ash contents increase and acidity decreases.
Cocoa bean pH and acidity showed a significant negative correlation. Similar data were reported by Jinap and Dimick [60] in cocoa beans from different cocoa bean producing countries, finding a correlation coefficient of −0.94. This relationship may be given by the high concentration of acetic and lactic acid presented by the almonds during the fermentation process [57], since the correlation between acetic and lactic acid with pH was 0.86, while for total acidity it was 0.91, indicating that these acids could be the main ones responsible for the high acidity and low pH in cocoa almonds in the first days of fermentation [60].
Fat percentage presents a negative correlation with total carbohydrate content; this is probably due to the glyoxylate cycle that takes place during the fermentation process. In this cycle, glucose is generated from fatty acids because most of the metabolic energy required for its development is in the form of triacylglycerols, decreasing fat and increasing sugar content [61]. In addition, the percentage of fat also presents a negative correlation with the content of total phenols, agreeing with Locatelli et al. [62], who report a decrease in lipids in cocoa beans with the presence of phenolic compounds. This is because the concentration of phenols increases with the fermentation process, reducing the fat content, due to the fact that phenols promote the lipoperoxidation process [63], which reduces the oxidative degradation of lipids, causing them to be lost by the diffusion of exudates released during fermentation.
Total phenols show a negative correlation with flavonoids, flavanols (catechin and epicatechin), methylxanthine-type alkaloids (theobromine and caffeine) and fat. This is due to the increase in phenols and the reduction in flavonoids, flavonols, methylxanthines and fat during the fermentation and roasting processes. In fermentation, the formation of polymeric proanthocyanidins responsible for the increase in phenols takes place [50]. In addition, in this process also takes place the oxidation of epicatechin and catechin turning into quinones, which help to reduce the astringency and bitter taste of cocoa [11]. The decrease in these flavanols is also caused by the diffusion of phenolic compounds in the exudates released during this process [50].
The content of total alkaloids is given by the values of methylxanthines (theobromine and caffeine) which causes a decrease in the fermentation process, in addition, the reduction in these compounds is also influenced by the roasting process, where oxidation takes place due to the presence of oxygen or the effect of oxidative enzymes [51]. Likewise, the content of methylxanthines in cocoa beans decreases after the roasting process [11], during this process there is an increase in dicetopiperazine amide (DKP), a compound that interacts with alkaloids, decreasing the content of theobromine and caffeine. On the other hand, the decrease in fat is due to the reduction in fatty acids (oleic, palmitic and stearic acid) due to the increase in temperature in the fermentation process after the third day [64]. However, flavonoids present a positive correlation with antioxidant activity, estimated by FRAP and DPPH technique; this is because the flavonoid content largely determines the scavenging capacity of DPPH radicals, due to the fact that this radical reacts with H donors and phenolic compounds [55]. Likewise, the flavonoids of cocoa beans present high iron (Fe3+) reducing power, conducting this work by donating hydrogen or singlet oxygen carrying out the redox power [65]. Authors such as Szeto et al. [66] also reported that flavonoids have antioxidant properties through electron donation, which is related to the number of phenolic compounds and the location of the hydroxyl groups and the presence of the galloyl group (gelotannins).
Likewise, total flavonoids present a positive correlation with flavanols (catechin and epicatechin), this correlation is carried out because flavonoids are composed of chalcones, xanthones, flavonols, flavones, flavanones, isofiavonones, anthocyanidins, flavanols and condensed tannins [59] where flavanols comprise 37% of flavonoids. Similarly, the main catechin is epicatechin, which accounts for about 30% of the flavonoid content of the bean [67], thus, increasing the flavonoid content increases flavanols. In addition, total flavonoids also show a positive correlation with methylxanthine-type alkaloids (theobromine and caffeine). To date this relationship is not clear [68], and it is known that there is a possible synergistic interaction between flavonoids and methylxanthines, but further studies are needed to corroborate this claim [50]. Also, total flavonoids, catechin, epicatechin, caffeine and catechin present a positive correlation with DPPH and FRAP. This is because the molecules responsible for the antioxidant activity of cocoa are procyanidins, anthocyanins, flavonones and glycosidic flavonols [58], which are mostly present in flavonoids.
The positive correlation between catechin and epicatechin is due to the fact that catechins are comprised of epicatechin, epigallocatechin, gallocatechin, and catechin [69]. On the other hand, the positive correlation between methylxanthines (caffeine and theobromine) and flavanols (catechin or epicatechin) occurs because they are the secondary metabolites most synthesized by the plant [24]. The positive correlation between caffeine and theobromine is associated with the fact that these two alkaloids are the most abundant within the methylxanthine family [70], which comprise between 0.8 and 2% of the total dry weight of the cocoa bean in the case of theobromine, while caffeine in cocoa ranges around 0.2%, varying by clone type and degree of fermentation [71]. In addition, the positive correlation between the antioxidant activity estimated by FRAP and DPPH techniques is due to the fact that both are used to estimate the oxidation capacity of cocoa [65].

5. Conclusions

The fermentation process of the cocoa beans only significantly affected different variables of the bromatological composition (moisture, ash, pH, acidity, fat and crude protein) without affecting the antioxidant activity and phenolic compounds. At the clone level and based on the results obtained with the quality indices in terms of chemical composition (Bromatological, Antioxidant Activity, Phenolic Compound), the FVS-41 clone was the best qualified.

Author Contributions

Conceptualization, P.A.P.-H., H.E.H. and J.C.S.; data curation, P.A.P.-H., H.E.H., J.C.S. and F.C.; formal analysis, H.E.H., J.C.S. and F.C.; investigation, P.A.P.-H., H.E.H. and J.C.S.; methodology, P.A.P.-H., H.E.H., V.Y.R.-T., L.N.C.-Á., F.C. and J.C.S.; funding acquisition, H.E.H. and J.C.S.; project administration, H.E.H. and J.C.S.; resources, H.E.H. and J.C.S.; supervision, J.C.S.; writing—original draft, P.A.P.-H., H.E.H. and J.C.S.; writing—review and editing, P.A.P.-H., H.E.H., V.Y.R.-T., L.N.C.-Á., F.C. and J.C.S. All authors have read and agreed to the published version of the manuscript.

Funding

This research received no external funding.

Institutional Review Board Statement

Not applicable.

Informed Consent Statement

Not applicable.

Data Availability Statement

Data are available from the authors upon request.

Acknowledgments

The authors would like to thank the following collaborators: Ministry of National Education (MEN) and to rural households in the department of Meta that supported the investigation.

Conflicts of Interest

The authors declare no conflict of interest.

References

  1. ICCO. ICCO Quarterly Bulletin of Cocoa Statistics; The International Cocoa Organization (ICCO) Cocoa Producing and Cocoa Consuming Countries; Supply & Demand QBCS: London, UK, 2022; Volume XLVIII No. 1. [Google Scholar]
  2. ICCO. Quarterly Bulletin of Cocoa Statistics; ICCO: Côte d’Ivoire, France, 2017; pp. 20–29. [Google Scholar]
  3. Hernández-Núñez, H.E.; Gutiérrez-Montes, I.; Bernal-Núñez, A.P.; Gutiérrez-García, G.A.; Suárez, J.C.; Casanoves, F.; Flora, C.B. Cacao cultivation as a livelihood strategy: Contributions to the well-being of Colombian rural households. Agric. Hum. Values 2022, 39, 201–216. Available online: https://link.springer.com/article/10.1007/s10460-021-10240-y (accessed on 18 October 2023). [CrossRef]
  4. Barrera, V.; Alwang, J.; Casanova, T.; Domínguez, J.; Escudero, L.; Loor, G.; Tarqui, O.; Plaza, L.; Sotomayor, I.; Zambrano, F.; et al. La Cadena de Valor del Cacao en y el Bienestar de los Productores de la Provincia de Manabí-Ecuador. Iniap. 2019, pp. 1–204. Available online: http://repositorio.iniap.gob.ec/handle/41000/5382 (accessed on 19 February 2023).
  5. FEDECACAO. Colombia Cacaotera. Federación Nacional de Cacaoteros. 2022. 24. Available online: https://drive.google.com/file/d/1w2tBLP8IG6faDgdYacgLn9mIdXI0qBNL/view (accessed on 19 February 2023).
  6. González, X. La Producción de Cacao Alcanzó Cifra Récord en 2020 y Llegó a las 63,416 Toneladas. La República. 2021. p. Agronegocios. Available online: https://www.google.com/search?q=La+producción+de+cacao+alcanzó+cifra+récord+en+2020+y+llegó+a+las+63.416+toneladas.+La+Nación&hl=es&sxsrf=AJOqlzWkylahtjJvPaEGAA5c847XMIBkWQ%3A1676821783080&source=hp&ei=F0XyY_XbAZeawbkPmsyU0AU&iflsig=AK50M_UAAAAAY_JTJzJknS (accessed on 19 February 2023).
  7. Gómez, J.; González, K.; Londoño, C.; López, V. Analysis of Variables for the Export of Colombian cocoa to European Countries. Bachelor’s Thesis, Fundación Universitaria Catolica, Cali, Colombia, 2017. Available online: https://repository.unicatolica.edu.co/handle/20.500.12237/862 (accessed on 18 October 2023).
  8. Kongor, J.E.; Hinneh, M.; de Walle, D.; Van Afoakwa, E.O.; Boeckx, P.; Dewettinck, K. Factors influencing quality variation in cocoa (Theobroma cacao) bean flavour profile—A review. In Food Research International; Elsevier: Amsterdam, The Netherlands, 2016; Volume 82, pp. 44–52. [Google Scholar]
  9. Hue, C.; Gunata, Z.; Breysse, A.; Davrieux, F.; Boulanger, R.; Sauvage, F.X. Impact of fermentation on nitrogenous compounds of cocoa beans (Theobroma cacao L.) from various origins. Food Chem. 2016, 192, 958–964. [Google Scholar] [CrossRef] [PubMed]
  10. Rodriguez-Campos, J.; Escalona-Buendía, H.B.; Orozco-Avila, I.; Lugo-Cervantes, E.; Jaramillo-Flores, M.E. Dynamics of volatile and non-volatile compounds in cocoa (Theobroma cacao L.) during fermentation and drying processes using principal components analysis. Food Res. Int. 2011, 44, 250–258. [Google Scholar] [CrossRef]
  11. Zapata Bustamante, S.; Tamayo Tenorio, A.; Alberto Rojano, B. Efecto del Tostado Sobre los Metabolitos Secundarios y la Actividad Antioxidante de Clones de Cacao Colombiano. Rev. Fac. Nac. Agron. Medellín 2015, 68, 7497–7507. Available online: https://revistas.unal.edu.co/index.php/refame/article/view/47836 (accessed on 19 February 2023). [CrossRef]
  12. Martinez, N. Evaluación de Componentes Físicos, Químicos, Organolépticos y de Rendimiento de Clones Universales y regionales de Cacao (Theobroma cacao L.) en las Zonas Productoras de Santander, Arauca y Huila. Master’s Thesis, Universidad Nacional de Colombia, Facultad de Ciencias, Bogotá, Colombia, 2016. [Google Scholar]
  13. Ramírez González, M.B.; Cely Niño, V.H.; Ramírez, S.I. Actividad antioxidante de clones de cacao (Theobroma cacao L.) finos y aromáticos cultivados en el estado de Chiapas, México. Perspect. En Nutr. Humana 2013, 15, 27–47. Available online: http://www.scielo.org.co/scielo.php?script=sci_arttext&pid=S0124-41082013000100002&lng=en&nrm=iso&tlng=es (accessed on 19 February 2023). [CrossRef]
  14. Nazario, O.; Ordoñez, E.; Mandujano, Y.; Arévalo, J. Polifenoles totales, antocianinas, capacidad antioxidante de granos secos y análisis sensorial del licor de cacao (Theobroma cacao L.) criollo y siete clones. Investig. Amaz. 2013, 3, 51–59. [Google Scholar]
  15. Sukha, D.A.; Butler, D.R.; Umaharan, P.; Boult, E. The use of an optimised organoleptic assessment protocol to describe and quantify different flavour attributes of cocoa liquors made from Ghana and Trinitario beans. Eur. Food Res. Technol. 2008, 226, 405–413. Available online: https://link.springer.com/article/10.1007/s00217-006-0551-2 (accessed on 18 February 2023). [CrossRef]
  16. Quezada, L.; Quevedo, J.; García, R. Determinación del efecto del grado de madurez de las mazorcas en la producción y la calidad sensorial de (Theobroma cacao L.). Rev. Científica Agroecosistemas 2017, 5, 36–46. Available online: https://aes.ucf.edu.cu/index.php/aes/article/view/139 (accessed on 19 February 2023).
  17. Roos, W. Índice Mip de Algunos Cultivos Tropicales. EDICIONES. 2015. 119p. Available online: https://www.cabi.org/wp-content/uploads/Rogg-2000b-IPM-in-tropical-crops.pdf (accessed on 19 February 2023).
  18. Boza, E.J.; Motamayor, J.C.; Amores, F.M.; Cedeño-Amador, S.; Tondo, C.L.; Livingstone, D.S.; Schnell, R.J.; Gutiérrez, O.A. Genetic characterization of the cacao cultivar CCN 51: Its impact and significance on global cacao improvement and production. J. Am. Soc. Hortic. Sci. 2014, 139, 219–229. Available online: https://journals.ashs.org/jashs/view/journals/jashs/139/2/article-p219.xml (accessed on 19 February 2023). [CrossRef]
  19. Bekele, F.L.; Bekele, I.; Butler, D.R.; Bidaisee, G.G. Patterns of morphological variation in a sample of cacao (Theobroma cacao L.) germplasm from the International Cocoa Genebank, Trinidad. Genet. Resour. Crop Evol. 2006, 53, 933–948. [Google Scholar] [CrossRef]
  20. Johnson, E.S.; Bekele, F.L.; Brown, S.J.; Song, Q.; Zhang, D.; Meinhardt, L.W.; Schnell, R.J. Population Structure and Genetic Diversity of the Trinitario Cacao (Theobroma cacao L.) from Trinidad and Tobago. Crop Sci. 2009, 49, 564–572. Available online: https://onlinelibrary.wiley.com/doi/full/10.2135/cropsci2008.03.0128 (accessed on 20 February 2023). [CrossRef]
  21. Hernández-Núñez, H.E.; Gutiérrez-Montes, I.; Sánchez-Acosta, J.R.; Rodríguez-Suárez, L.; Gutiérrez-García, G.A.; Suárez-Salazar, J.C.; Casanoves, F. Agronomic conditions of cacao cultivation: Its relationship with the capitals endowment of Colombian rural households. Agrofor. Syst. 2020, 94, 2367–2380. [Google Scholar] [CrossRef]
  22. Loureiro, G.A.H.A.; Araujo, Q.R.; Sodré, G.A.; Valle, R.R.; Souza, J.O.; Ramos, E.M.L.S.; Comerford, N.B.; Grierson, P.F. Cacao quality: Highlighting selected attributes. In Food Reviews International; Taylor & Francis: Abingdon, UK, 2017; Volume 33, pp. 382–405. Available online: https://www.tandfonline.com/doi/abs/10.1080/87559129.2016.1175011 (accessed on 19 February 2023).
  23. Ramón, V.; Hernández, H.E.; Polania, P.; Suárez, J.C. Spatial Distribution of Cocoa Quality: Relationship between Physicochemical, Functional and Sensory Attributes of Clones from Southern Colombia. Agronomy 2023, 13, 15. Available online: https://www.mdpi.com/2073-4395/13/1/15/htm (accessed on 20 February 2023). [CrossRef]
  24. Samaniego, I.; Espín, S.; Quiroz, J.; Ortiz, B.; Carrillo, W.; García-Viguera, C.; Mena, P. Effect of the growing area on the methylxanthines and flavan-3-ols content in cocoa beans from Ecuador. J. Food Compos. Anal. 2020, 88, 103448. [Google Scholar] [CrossRef]
  25. AOAC. Official Methods of Analysis of AOAC International, 19th ed.; (970.22); Association of Official Analytical Chemists International: Gaithersburg, MD, USA, 2012. [Google Scholar]
  26. García, E.; Fernández, I. Determinación de Proteínas de un Alimento por el Método Kjeldahl. Valoración con un Ácido Fuerte. ETSIAMN. Universidad Politécnica de Valencia. Universitat Politècnica de València. June 2020. Available online: https://riunet.upv.es/handle/10251/29832 (accessed on 19 February 2023).
  27. Dubois, M.; Gilles, K.A.; Hamilton, J.K.; Rebers, P.A.; Smith, F. Colorimetric Method for Determination of Sugars and Related Substances. Anal. Chem. 1956, 28, 350–356. [Google Scholar] [CrossRef]
  28. Galeano, P.G.; Paladines, M.B. Actividad antioxidante de extractos de granos de copoazú (Theobroma grandiflorum). Vitae 2012, 19, 436–438. Available online: https://www.redalyc.org/pdf/1698/169823914137.pdf (accessed on 19 February 2023).
  29. Zhishen, J.; Mengcheng, T.; Jianming, W. The determination of flavonoid contents in mulberry and their scavenging effects on superoxide radicals. Food Chem. 1999, 64, 555–559. [Google Scholar] [CrossRef]
  30. Hatzidimitriou, E.; Nenadis, N.; Tsimidou, M.Z. Changes in the catechin and epicatechin content of grape seeds on storage under different water activity (aw) conditions. Food Chem. 2007, 105, 1504–1511. [Google Scholar] [CrossRef]
  31. Brunetto, M.d.R.; Gutiérrez, L.; Delgado, Y.; Gallignani, M.; Zambrano, A.; Gómez, Á.; Ramos, G.; Romero, C. Determination of theobromine, theophylline and caffeine in cocoa samples by a high-performance liquid chromatographic method with on-line sample cleanup in a switching-column system. Food Chem. 2007, 100, 459–467. [Google Scholar] [CrossRef]
  32. Velásquez, H.; Galeano, P. Evaluación fitoquímica y de actividad antioxidante de los rizomas de tres especies del género Cyperus. Momentos Cienc. 2012, 9, 15–21. [Google Scholar]
  33. Balzarini, M.; Di Rienzo, J.; Tablada, M.; Gonzalez, L.; Bruno, C.; Córdoba, M.; Casanoves, F. Estadística y Biometrías. Ilustraciones del uso de InfoStat en Problemas de Agronomía, 2nd ed.; Editorial Brujas: Córdoba, Argentina, 2012; 380p. [Google Scholar]
  34. Rienzo, D.; Alejandro, J.; Alicia, L.; Margot, E.; Pilar, M. Estadistica Para Las Ciencias Agropecuarias; Potencia: Córdoba, Argentina, 2005; pp. 1–329. [Google Scholar]
  35. R Development Core Team. R: The R Project for Statistical Computing; Foundation for Statistical Computing: Vienna, Austria, 2023; ISBN 3-900051-07-0. Available online: https://www.r-project.org/ (accessed on 18 October 2023).
  36. Del, M.; Amaíz, C.L.; Gutiérrez, R.; Pérez, E.; Álvarez, C. Efecto del Tostado Sobre las Propiedades Físicas, Fisicoquímicas, Composición Proximal y Perfil de Ácidos Grasos de la Manteca de Granos de Cacao del Estado Miranda, Venezuela Effect of Roasting Process on Physical and Physicochemical Properties, Proximat. Volume 12, Revista Científica UDO Agrícola. Universidad de Oriente. 2012. Available online: https://dialnet.unirioja.es/servlet/articulo?codigo=4688626&info=resumen&idioma=ENG (accessed on 19 February 2023).
  37. Álvarez, C.; Pérez, E.; Lares, M.C. Caracterización física y química de almendras de cacao fermentadas, secas y tostadas cultivadas en la región de Cuyagua, estado Aragua. Agron. Trop. 2007, 57, 249–256. Available online: http://ve.scielo.org/scielo.php?script=sci_arttext&pid=S0002-192X2007000400001&lng=es&nrm=iso&tlng=es (accessed on 18 February 2023).
  38. Perea, J.A.; Ramirez, O.L.; Villamizar, A.R. Caracterización fisicoquimica de materiales regionales de cacao colombiano. Biotecnol. Sect. Agropecu Agroindustrial 2011, 9, 35–42. Available online: http://www.scielo.org.co/scielo.php?script=sci_arttext&pid=S1692-35612011000100005&lng=en&nrm=iso&tlng=es (accessed on 18 February 2023).
  39. Vera Chang, J.F.; Vallejo Torres, C.; Párraga Morán, D.E.; Macías Véliz, J.; Ramos Remache, R.; Morales Rodríguez, W. Atributos físicos-químicos y sensoriales de las almendras de quince clones de cacao nacional (Theobroma cacao L.) en el Ecuador. Cienc. Tecnol. 2015, 7, 21–34. Available online: https://revistas.uteq.edu.ec/index.php/cyt/article/view/139 (accessed on 18 February 2023). [CrossRef]
  40. AOAC. Ash (Acid-Insoluble) of Cacao Products. AOAC 975.12. 2000. Available online: http://www.aoacofficialmethod.org/index.php?main_page=product_info&products_id=407 (accessed on 20 February 2023).
  41. Álvarez, R.; Portillo, E.; Portillo, A.; Villasmil, R. Evaluación de las propiedades sensoriales del licor de cacao (Theobroma cacao L.) obtenido en forma artesanal e industrial. Rev. Agrollanía 2018, 15, 1690–8066. Available online: http://localhost:8080/xmlui/handle/654321/2290 (accessed on 18 February 2023).
  42. Mustiga, G.M.; Morrissey, J.; Stack, J.C.; DuVal, A.; Royaert, S.; Jansen, J.; Bizzotto, C.; Villela-Dias, C.; Mei, L.; Cahoon, E.B.; et al. Identification of Climate and Genetic Factors That Control Fat Content and Fatty Acid Composition of Theobroma cacao L. Beans. Front. Plant Sci. 2019, 10, 1159. [Google Scholar] [CrossRef] [PubMed]
  43. Del Rosario Castro, M.; Hernández, J.A.; Marcilla, S.; Córdova, J.S.; Solari, F.A.; Chire, G.C. Efecto del contenido de grasa en la concentración de polifenoles y capacidad antioxidante de Theobroma cacao L. “Cacao”. Cienc. Investig. 2017, 19, 19–23. Available online: https://www.researchgate.net/profile/Armando-Solari-Godino/publication/308140856_EFECTO_DEL_CONTENIDO_DE_GRASA_EN_LA_CONCENTRACION_DE_POLIFENOLES_Y_CAPACIDAD_ANTIOXIDANTE_DE_Theobroma_cacao_L_CACAO/links/5df011af4585159aa473ecc8/EFECTO-DEL-CONTENIDO-DE-GR (accessed on 19 February 2023). [CrossRef]
  44. Servant, A.; Boulanger, R.; Davrieux, F.; Pinot, M.N.; Tardan, E.; Forestier-Chiron, N.; Hue, C. Assessment of cocoa (Theobroma cacao L.) butter content and composition throughout fermentations. Food Res. Int. 2018, 107, 675–682. [Google Scholar] [CrossRef]
  45. Andrade, J.A.; Rivera-García, J.; Chire-Fajardo, G.C.; Ureña-Peralta, M.O. Propiedades físicas y químicas de cultivares de cacao (Theobroma cacao L.) de Ecuador y Perú. Enfoque UTE 2019, 10, 1–12. Available online: http://scielo.senescyt.gob.ec/scielo.php?pid=S1390-65422019000400001&script=sci_arttext (accessed on 19 February 2023). [CrossRef]
  46. Barrientos, L.D.P.; Oquendo, J.D.T.; Garzón, M.A.G.; Álvarez, O.L.M. Effect of the solar drying process on the sensory and chemical quality of cocoa (Theobroma cacao L.) cultivated in Antioquia, Colombia. Food Res. Int. 2019, 115, 259–267. [Google Scholar] [CrossRef]
  47. Imru, N.O.; Wogderess, M.D.; Gidada, T.V. A study of the effects of shade on growth, production and quality of coffee (Coffea arabica) in Ethiopia. Int. J. Agric. Sci. 2015, 5, 748–752. Available online: http://www.academicjournals.org/JHF (accessed on 19 February 2023).
  48. Afoakwa, E.O.; Ofosu-Ansah, E.; Takrama, J.F.; Budu, A.S.; Mensah-Brown, H. Changes in chemical quality of cocoa butter during roasting of pulp pre-conditioned and fermented cocoa (Theobroma cacao) beans. Int. Food Res. J. 2014, 21, 2221–2227. Available online: https://www.researchgate.net/profile/Emmanuel-Ohene-Afoakwa/publication/276371202_Changes_in_Biochemical_and_Physico-chemical_Qualities_during_Drying_of_Pulp_Preconditioned_and_Fermented_Cocoa_Theobroma_cacao_Beans/links/56a795e008ae860e025577d3/Changes-i (accessed on 19 February 2023).
  49. Rohan, T.A.; Stewart, T. The Precursors of Chocolate Aroma: Changes in the Sugars During the Roasting of Cocoa Beans. J. Food Sci. 1966, 31, 206–209. Available online: https://onlinelibrary.wiley.com/doi/full/10.1111/j.1365-2621.1966.tb00480.x (accessed on 19 February 2023). [CrossRef]
  50. Zapata Bustamante, S.; Tamayo Tenorio, A.; Alberto Rojano, B. Efecto de la fermentación sobre la actividad antioxidante de diferentes clones de cacao Colombiano. Rev. Cuba Plantas Med. 2013, 18, 391–404. Available online: http://scielo.sld.cu/scielo.php?pid=S1028-47962013000300007&script=sci_arttext&tlng=pt (accessed on 20 February 2023).
  51. Zzaman, W.; Bhat, R.; Abedin, M.Z.; Yang, T.A. Comparison between superheated steam and convectional roasting on changes in the phenolic compound and antioxidant activity of cocoa beans. Food Sci. Technol. Res. 2013, 19, 949–956. [Google Scholar] [CrossRef]
  52. Lujano, E.; Manganiello, L.; Contento, A.; Rios, A. Identification and quantification of (+)-Catechins and Procyanidins in Cocoa from Ocumare de la Costa, Venezuela. Rev. Ing. UC 2019, 26, 192–201. [Google Scholar]
  53. Álvarez, L.C.; Álvarez, N.C.; García, P.G.; Salazar, J.C.S. Effect of fermentation time on phenolic content and antioxidant potential in Cupuassu (Theobroma grandiflorum (Willd. ex Spreng.) K. Schum.) beans. Acta Agron. 2017, 66, 473–479. Available online: http://www.scielo.org.co/scielo.php?pid=S0120-28122017000400473&script=sci_arttext&tlng=en (accessed on 19 February 2023). [CrossRef]
  54. Kuskoski, E.M.; Asuero, A.G.; Troncoso, A.M.; Mancini-Filho, J.; Fett, R. Aplicación de diversos métodos químicos para determinar actividad antioxidante en pulpa de frutos. Ciência Tecnol. Aliment. 2005, 25, 726–732. Available online: http://www.scielo.br/j/cta/a/B58T9S5zLLxjBL5PVzZXHCF/abstract/?lang=es (accessed on 19 February 2023). [CrossRef]
  55. Roginsky, V.; Lissi, E.A. Review of methods to determine chain-breaking antioxidant activity in food. Food Chem. 2005, 92, 235–254. [Google Scholar] [CrossRef]
  56. Perea, J.; Cadena, T.; Herrera, J. El cacao y sus productos como fuente de antioxidantes: Efecto del procesamiento. Salud UIS 2009, 41, 128–134. Available online: http://www.scielo.org.co/scielo.php?script=sci_arttext&pid=S0121-08072009000200003 (accessed on 19 February 2023).
  57. Apriyanto, M. Changes in Chemical Properties of Dreid Cocoa (Theobroma cacao) Beans during Fermentation. Int. J. Fermented Foods 2016, 5, 11. Available online: https://www.indianjournals.com/ijor.aspx?target=ijor:ijff&volume=5&issue=1&article=002 (accessed on 19 February 2023). [CrossRef]
  58. Acevedo, L.; Mejía, D.; Acosta, E.; Valencia, W.; Penagos, L. Efecto de la temperatura del conchado sobre los polifenoles en un chocolate semi-amargo. Aliment. Hoy 2017, 25, 31–50. Available online: https://alimentoshoy.acta.org.co/index.php/hoy/article/view/447 (accessed on 19 February 2023).
  59. Quiñones, M.; Miguel, M.; Aleixandre, A. Los polifenoles, compuestos de origen natural con efectos saludables sobre el sistema cardiovascular. Nutr. Hosp. 2012, 27, 76–89. [Google Scholar]
  60. Jinap, S.; Dimick, P.S. Acidic Characteristics of Fermented and Dried Cocoa Beans from Different Countries of Origin. J. Food Sci. 1990, 55, 547–550. Available online: https://onlinelibrary.wiley.com/doi/full/10.1111/j.1365-2621.1990.tb06806.x (accessed on 19 February 2023). [CrossRef]
  61. Afoakwa, E.O.; Quao, J.; Takrama, J.; Budu, A.S.; Saalia, F.K. Chemical composition and physical quality characteristics of Ghanaian cocoa beans as affected by pulp pre-conditioning and fermentation. J. Food Sci. Technol. 2013, 50, 1097–1105. Available online: https://link.springer.com/article/10.1007/s13197-011-0446-5 (accessed on 19 February 2023). [CrossRef] [PubMed]
  62. Locatelli, M.; Travaglia, F.; Giovannelli, L.; Coïsson, J.D.; Bordiga, M.; Pattarino, F.; Arlorio, M. Clovamide and phenolics from cocoa beans (Theobroma cacao L.) inhibit lipid peroxidation in liposomal systems. Food Res. Int. 2013, 50, 129–134. [Google Scholar] [CrossRef]
  63. Ordoñez, E.S.; Leon-Arevalo, A.; Rivera-Rojas, H.; Vargas, E. Cuantificación de polifenoles totales y capacidad antioxidante en cáscara y semilla de cacao (Theobroma cacao L.), tuna (Opuntia ficus indica Mill), uva (Vitis vinífera) y uvilla (Pourouma cecropiifolia). Sci. Agropecu. 2019, 10, 175–183. Available online: http://www.scielo.org.pe/scielo.php?script=sci_arttext&pid=S2077-99172019000200003&lng=es&nrm=iso&tlng=pt (accessed on 19 February 2023). [CrossRef]
  64. Ramos-Escudero, F.; Casimiro-Gonzales, S.; Fernández-Prior, Á.; Cancino Chávez, K.; Gómez-Mendoza, J.; de la Fuente-Carmelino, L.; Muñoz, A.M. Colour, fatty acids, bioactive compounds, and total antioxidant capacity in commercial cocoa beans (Theobroma cacao L.). LWT 2021, 147, 111629. [Google Scholar] [CrossRef]
  65. Othman, A.; Ismail, A.; Abdul Ghani, N.; Adenan, I. Antioxidant capacity and phenolic content of cocoa beans. Food Chem. 2007, 100, 1523–1530. [Google Scholar] [CrossRef]
  66. Szeto, Y.T.; Tomlinson, B.; Benzie, I.F.F. Total antioxidant and ascorbic acid content of fresh fruits and vegetables: Implications for dietary planning and food preservation. Br. J. Nutr. 2002, 87, 55–59. Available online: https://www.cambridge.org/core/journals/british-journal-of-nutrition/article/total-antioxidant-and-ascorbic-acid-content-of-fresh-fruits-and-vegetables-implications-for-dietary-planning-and-food-preservation/F457978920144B378888C03DEEA2885A (accessed on 19 February 2023). [CrossRef]
  67. Sotelo, C.L.; Alvis, B.A.; Arrázola, P.G. Evaluación de epicatequina, teobromina y cafeína en cáscaras de cacao (Theobroma cacao L.), determinación de su capacidad antioxidante. Rev. Colomb. Cienc. Hortícolas 2015, 9, 124. Available online: http://www.scielo.org.co/scielo.php?script=sci_arttext&pid=S2011-21732015000100011&lng=en&nrm=iso&tlng=es (accessed on 19 February 2023). [CrossRef]
  68. Belščak, A.; Komes, D.; Horžić, D.; Ganić, K.K.; Karlović, D. Comparative study of commercially available cocoa products in terms of their bioactive composition. Food Res. Int. 2009, 42, 707–716. [Google Scholar] [CrossRef]
  69. Quizhpe, P.A.C. Efecto Inhibitorio de la Pulpa que Recubre las Semillas del Cacao (Theobroma cacao) a Diferentes Concentraciones sobre la cepa de Streptococcus mutans: Estudio in estudio in Vitro. Quito: UCE. 2018. Available online: http://www.dspace.uce.edu.ec/handle/25000/15186 (accessed on 19 February 2023).
  70. Peláez, P.P.; Bardón, I.; Camasca, P. Methylxanthine and catechin content of fresh and fermented cocoa beans, dried cocoa beans, and cocoa liquor. Sci. Agropecu. 2016, 7, 355–365. Available online: http://www.scielo.org.pe/scielo.php?script=sci_arttext&pid=S2077-99172016000500001&lng=es&nrm=iso&tlng=en (accessed on 19 February 2023). [CrossRef]
  71. Carrillo, L.C.; Londoño-Londoño, J.; Gil, A. Comparison of polyphenol, methylxanthines and antioxidant activity in Theobroma cacao beans from different cocoa-growing areas in Colombia. Food Res. Int. 2014, 60, 273–280. [Google Scholar] [CrossRef]
Figure 1. Biplot result of principal component analysis between cocoa bean chemical characteristics at the clone level (a) and fermentation time (b). Vectors with color gradients from blue to red mean lower to higher contribution (%) of the variable in the principal components.
Fermentation 09 00982 g001
Figure 2. Indicator and sub-indicators representing cocoa bean quality at both (A). clone level and (B). fermentation time. Values represent the mean and standard error (n = 4). a,b,c mean statistical differences between each of the factors for clone and days of fermentation.
Fermentation 09 00982 g002
Figure 3. Most important variables in each sub-indicator that impact the cocoa quality index. (a) Contribution of the variables for each sub-indicator in the principal component (PC) 1 and 2. From red to blue means from highest to lowest contribution. (b,c) distribution of the variables in a biplot plane obtained through a principal component analysis, obtained through a multiple factor analysis. The variables above the dotted line presented the highest contribution. AA: Antioxidant Activity; Brom: Bromatological; PC: Phenolic Compound.
Fermentation 09 00982 g003
Table 1. List of cocoa clones, their identification and origin.
Introduced Commercial
NomenclatureIdentification and OriginCharacteristics of Interest
CCN-51Castro Naranjal (Ecuador)Commercially grown. High yield. Resistance to Monilia [18].
EET-8United Fruit Company (Costa Rica)Commercially grown. Good grain index [19].
TSH-565Trinidad Selection Hybrid (Trinidad)Resistance to Monilliphthora perniciosa, high productivity [20].
ICS-1Imperial College Selection (Trinidad, Nicaragua y Venezuela)Present in commercial crops in several countries. Good grain and cob index [19].
ICS-60Imperial College Selection (Trinidad, Nicaragua y Venezuela)Present in commercial crops in several countries. Good grain and cob index [19].
ICS-95Imperial College Selection (Trinidad, Nicaragua y Venezuela)Present in commercial crops in several countries. Good grain and cob index [19].
Regional
SCC-61Selección Colombia Corpoica (Santander), Hibrido trinitarioHigh grain index [12].
FSV-41Fedecacao San Vicente (Santander), Híbrido trinitarioHigh grain rate, yield and quality [12].
Table 2. Bromatological variables, phenolic compounds and antioxidant activity characterized.
ComponentVariableUnitMethod
BromatologicalpH Potentiometric [24]
Acidity%Titling [24]
Moisture%Gravimetric [24]
Ash%Incineration [25]
Fat%Soxhlet [24]
Crude protein%Kjeldahl [26]
Sucrose°BrixRefractometry [22]
Total carbohydratesmg g−1Phenol-Sulfuric [27]
Phenolic compoundsTotal phenolsmg g−1Folin-Ciocalteu colorimetry [28]
Total flavonoidsmg g−1Aluminum chloride [29]
Catechinmg g−1HPLC [30]
Epicatechinmg g−1HPLC [30]
Theobrominemg g−1HPLC [31]
Caffeinemg g−1HPLC [31]
Antioxidant activityDPPH(µmol g−1)Colorimetric [32]
FRAP(µmol g−1)Colorimetric [32]
Table 3. Bromatological characteristics evaluated in cocoa clones at different fermentation times (Mean ± Standard error).
FactorLevelMoisture (%)Ash (%)pHAcidity (%)Fat (%)Crude Protein (%)Sucrose
°Brix
Total Carbohydrates (mg g−1)
CloneCCN-512.98 ± 0.16 a3.03 ± 0.09 c5.14 ± 0.090.56 ± 0.03 ab53.25 ± 2.5612.07 ± 0.18 c2.78 ± 0.54 b1.63 ± 0.12
EET-82.54 ± 0.18 abc3.17 ± 0.10 bc5.30 ± 0.100.46 ± 0.03 c63.61 ± 3.1012.40 ± 0.21 bc3.42 ± 0.61 ab1.35 ± 0.13
FSV-411.98 ± 0.26 c3.53 ± 0.14 a5.32 ± 0.130.49 ± 0.05 bc60.66 ± 4.9912.60 ± 0.28 abc4.43 ± 0.81 ab1.55 ± 0.18
ICS-12.38 ± 0.15 bc3.35 ± 0.09 ab5.16 ± 0.090.54 ± 0.03 abc58.26 ± 2.5612.85 ± 0.18 a3.51 ± 0.52 ab1.62 ± 0.11
ICS-602.65 ± 0.18 ab3.21 ± 0.10 bc5.17 ± 0.100.49 ± 0.03 bc64.45 ± 2.9812.19 ± 0.20 c3.23 ± 0.59 b1.55 ± 0.13
ICS-952.90 ± 0.13 a3.37 ± 0.07 ab5.10 ± 0.080.59 ± 0.02 a55.66 ± 2.0712.50 ± 0.16 bc4.57 ± 0.46 a1.55 ± 0.10
SCC-613.01 ± 0.23 a3.31 ± 0.13 abc5.35 ± 0.120.52 ± 0.04 abc59.83 ± 3.7212.82 ± 0.26 ab3.97 ± 0.76 ab1.22 ± 0.17
TSH-5652.61 ± 0.15 ab3.15 ± 0.08 c5.11 ± 0.090.55 ± 0.03 ab60.80 ± 2.5012.12 ± 0.18c3.91 ± 0.52 ab1.53 ± 0.11
p value0.00310.00170.19370.04200.06240.00090.03240.2789
Fermentation time (days)02.52 ± 0.15 ab3.47 ± 0.08 a5.49 ± 0.08 a0.42 ± 0.03 b65.44 ± 2.38 a12.90 ± 0.17 a3.29 ± 0.511.49 ± 0.11
22.21 ± 0.14 b3.58 ± 0.08 a5.51 ± 0.08 a0.43 ± 0.03 b62.37 ± 2.10 ab12.87 ± 0.16 a3.28 ± 0.481.52 ± 0.11
42.75 ± 0.14 a3.15 ± 0.08 b4.99 ± 0.08 b0.61 ± 0.03 a56.69 ± 2.14 bc12.21 ± 0.16 b3.97 ± 0.491.47 ± 0.11
62.86 ± 0.14 a3.07 ± 0.08 b4.98 ± 0.08 b0.60 ± 0.03 a55.70 ± 2.10 c12.14 ± 0.16 b3.98 ± 0.481.56 ± 0.11
82.82 ± 0.14 a3.05 ± 0.08 b5.05 ± 0.08 b0.58 ± 0.03 a54.96 ± 2.10 c12.12 ± 0.16 b4.12 ± 0.481.46 ± 0.11
p value0.0004<0.0001<0.0001<0.00010.0028<0.00010.25680.8975
a,b,c Different letters indicate significant differences between cocoa clones and fermentation time (LSD Fisher test, p < 0.05). Values represent the mean and standard error (n = 4).
Table 4. Phenolic content and antioxidant activity evaluated in cocoa clones at different fermentation times.
FactorLevelTotal Phenols
(mg g−1)
Total Flavonoids
(mg g−1)
Catechin
(mg g−1)
Epicatechin (mg g−1)Theobromine (mg g−1)Caffeine (mg g−1)DPPH
(µmol g−1)
FRAP
(µmol g−1)
CloneCCN-5164.56 ± 11.74 a3.30 ± 0.57 a1.95 ± 0.06 a0.49 ± 0.01 a0.30 ± 0.01 a0.37 ± 0.01 a325.55 ± 33.30331.00 ± 34.29
EET-842.71 ± 7.63 abc2.73 ± 0.54 a1.90 ± 0.07 a0.48 ± 0.01 ab0.29 ± 0.01 a0.37 ± 0.01 a251.47 ± 40.26244.72 ± 41.45
FSV-4146.46 ± 19.37 abc2.25 ± 0.78 abc1.82 ± 0.09 abc0.47 ± 0.02 abc0.29 ± 0.01 ab0.37 ± 0.01 ab168.71 ± 64.91169.51 ± 66,84
ICS-147.55 ± 7.30 abc1.72 ± 0.44 bc1.78 ± 0.05 bc0.46 ± 0.01 bc0.29 ± 0.01 ab0.36 ± 0.01 ab245.23 ± 33.30248.29 ± 34.29
ICS-6039.93 ± 7.54 bc2.84 ± 0.53 a1.93 ± 0.07 a0.48 ± 0.01 a0.30 ± 0.01 a0.38 ± 0.01 a224.42 ± 38.79226.87 ± 39.94
ICS-9552.23 ± 7.73 ab2.55 ± 0.43 ab1.88 ± 0.05 ab0.48 ± 0.01 ab0.30 ± 0.01 a0.37 ± 0.01 a256.22 ± 26.95259.61 ± 27.75
SCC-6135.36 ± 7.66 c2.41 ± 0.69 abc1.87 ± 0.08 abc0.48 ± 0.02 ab0.29 ± 0.01 ab0.37 ± 0.01 ab275.00 ± 48.38278.95 ± 49.82
TSH-56560.97 ± 8.27 a1.29 ± 0.42 c1.71 ± 0.05 c0.44 ± 0.01c0.28 ± 0.01 b0.35 ± 0.01 b350.01 ± 32.56356.18 ± 33.42
p value 0.02380.00630.00220.02130.01950.01170.06780.0678
Fermentation time (days)039.32 ± 8.772.64 ± 0.461.90 ± 0.060.48 ± 0.010.30 ± 0.010.37 ± 0.01256.11 ± 32.88259.50 ± 30.43
248.91 ± 8.622.44 ± 0.441.88 ± 0.050.47 ± 0.010.29 ± 0.010.37 ± 0.01272.95 ± 29.00276.84 ± 29.86
452.91 ± 8.642.36 ± 0.461.85 ± 0.050.47 ± 0.010.29 ± 0.010.37 ± 0.01291.95 ± 29.55296.40 ± 30.43
650.50 ± 8.622.18 ± 0.411.82 ± 0.050.47 ± 0.010.29 ± 0.010.36 ± 0.01260.08 ± 29.00263.59 ± 29.86
851.97 ± 8.622.31 ± 0.431.83 ± 0.050.47 ± 0.010.29 ± 0.010.37 ± 0.01283.11 ± 29.00287.30 ± 29.86
p value 0.58060.83140.33300.89450.29620.22820.91010.9101
a,b,c Different letters indicate significant differences between cocoa clones and fermentation time (LSD Fisher test, p < 0.05). Values represent the mean and standard error (n = 4).
Disclaimer/Publisher’s Note: The statements, opinions and data contained in all publications are solely those of the individual author(s) and contributor(s) and not of MDPI and/or the editor(s). MDPI and/or the editor(s) disclaim responsibility for any injury to people or property resulting from any ideas, methods, instructions or products referred to in the content.

