Article

Optimization of Growth Conditions to Enhance PHA Production by Cupriavidus necator

by
Soňa Ronďošová
1,
Barbora Legerská
1,
Daniela Chmelová
1,
Miroslav Ondrejovič
1,* and
Stanislav Miertuš
1,2
1
Department of Biotechnology, Faculty of Natural Sciences, University of SS. Cyril and Methodius, J. Herdu 2, 91701 Trnava, Slovakia
2
ICARST n.o., Jamnického 19, 84101 Bratislava, Slovakia
*
Author to whom correspondence should be addressed.
Fermentation 2022, 8(9), 451; https://doi.org/10.3390/fermentation8090451
Submission received: 24 August 2022 / Revised: 7 September 2022 / Accepted: 8 September 2022 / Published: 10 September 2022

Abstract

:
The accumulation of polyhydroxyalkanoates (PHAs) by microorganisms usually occurs in response to environmental stress conditions. Therefore, it is advantageous to choose two-step cultivation. The first phase is aimed at maximizing biomass production, and only in the second phase, after setting the suitable conditions, PHA production starts. The aim of this work was to optimize the composition of the minimal propagation medium used for biomass production of Cupriavidus necator DSM 545 using the response surface methodology (RSM). Based on the results from the search for optimization limits, the glucose concentration, the ammonium sulfate concentration and the phosphate buffer molarity were chosen as independent variables. The optimal values were found as follows: the glucose concentration 10.8 g/L; the ammonium sulfate concentration 0.95 g/L; and the phosphate buffer molarity 60.2 mmol/L. The predicted biomass concentration was 4.54 g/L, and the verified value was at 4.84 g/L. Although this work was primarily focused on determining the optimal composition of the propagation medium, we also evaluated the optimal composition of the production medium and found that the optimal glucose concentration was 6.7 g/L; the ammonium sulfate concentration 0.60 g/L; and the phosphate buffer molarity 20 mmol/L. The predicted PHB yield was 54.7% (w/w) of dry biomass, and the verified value was 49.1%.

1. Introduction

Polyhydroxyalkanoates (PHA) can be divided into three main classes based on their chemical structure, namely (i) short-chain-length PHA (scl, 3–5 carbon units), (ii) medium-chain-length PHA (mcl, 6–14 carbon units) and (iii) long-chain-length PHA (lcl, 15 or more carbon units) [1,2]. Despite the many suitable material properties of PHAs, their application potential is still limited by the high production cost associated with sterilization, low conversion of carbon substrates, poor growth of a producer and downstream processes [3,4]. Costs can be reduced by modifying the producer through genetic engineering [5,6], modifying the production conditions by changing the composition of the medium or the type of cultivation [4,7] or by selecting a cheap carbon source [8,9,10,11,12].
PHAs are synthesized by many microorganisms, but the main candidates for large-scale industrial production of PHAs are bacteria (wild-type or recombinant) [13]. In bacteria, these biopolymers can accumulate up to levels >90% (w/w) CDW [14,15]. Their accumulation is not only a natural way of storing carbon and energy when the nutrient supply is not balanced but can also be observed when growth is limited by depletion of the N, P or O source in the presence of an increased concentration of the carbon source [16,17]. Although nitrogen is the most common limiting factor [18,19], some bacterial species produce more PHAs under oxygen stress [17,20]. Cupriavidus necator is currently one of the most efficient producers of scl-PHA [21,22,23,24,25]. C. necator (synonyms Wautersia eutropha, Ralstonia eutropha, Hydrogenomonas eutropha, Cupriavidus sp. NH9, Cupriavidus sp. JCM 20695, Alcaligenes eutrophus, Alcaligenes eutrophus 335) is a facultatively anaerobic, mesophilic, Gram-negative bacterium occurring in soil but also in water in the form of rods with a size of 1.8–2.6 × 0.7 µm [26,27,28]. Bacteria of the Cupriavidus genus belong to a group of producers requiring stress conditions such as a lack of one of the nutrient sources (N, P, S) to produce PHAs [29]. The exception is the carbon source, which must always be present in elevated concentration in the culture medium [25]. In addition to the PHB homopolymers, depending on the selected carbon source, they are also able to synthesize P(3HB)-co-(3HV) copolymers, or P(3HB-co-3HV-co-3HHx) terpolymers [25].
Currently, PHAs can be produced by one of the following approaches, namely (i) in vitro polymerization using PHA-polymerase [30] and in vivo using (ii) the batch [7,31], (iii) fed-batch [32,33] and (iv) continuous cultivation methods using a chemostat [34]. PHA polymerases and PHA monomers with bound CoA as a cofactor were used for in vitro PHA synthesis [30]. Although the isolation method is simpler than in vivo production because it does not involve a living organism, the recycling of cofactors is problematic and expensive. Therefore, PHA production in vivo using a suitable cultivation method and a producer such as the C. necator bacteria remains the appropriate method. Fed-batch cultivation consists of two main phases: in the first phase cells are cultivated in a minimal medium to promote cell growth with minimal PHA production (propagation phase), and in the second phase a suitable set of conditions promotes PHA production (production phase) [35]. Fed-batch cultivation of C. necator can increase PHB productivity [24]. However, in the first phase aimed at biomass production, it is necessary to adjust the appropriate composition of the medium and then change it to lead to higher PHA production.
Therefore, this work aimed to optimize the composition of the minimal propagation medium usable in the first phase of PHB production by C. necator DSM 545 using the response surface methodology (RSM). Secondarily, we also focused on evaluating the impact of changing the medium composition on the amount of PHB determined in the biomass of C. necator.

2. Materials and Methods

2.1. Materials and Chemicals

Glucose, ammonium sulfate, dipotassium phosphate, potassium phosphate monobasic, magnesium sulfate heptahydrate, chloroform, sodium sulfate, n-hexane, methanol, potassium sodium tartrate, sodium hydroxide and sulfuric acid were obtained from CentralChem (Bratislava, Slovak Republic); 3,5-dinitrosalicylic acid (DNS) was purchased from Sigma-Aldrich (St. Louis, Missouri, USA). Standards of PHA monomers, such as methyl 3-hydroxybutyrate (3-HB) and (−)-methyl I-3-hydroxyvalerate (3-HV), were obtained from Sigma-Aldrich (St. Louis, MO, USA).

2.2. Production Organism

The bacterial strain C. necator DSM 545 was obtained from the German Collection of Microorganisms and Cell Cultures GmbH (DSM; Brunswick, Germany). Bacterial cells were re-inoculated at 4-day intervals and cultivated at 30 °C. The cells were diluted with sterile distilled water to obtain 0.8–0.9 McFarland unit (MFU) solution (OD600 nm = 0.075–0.081) and prepared inoculum was used to inoculate the propagation medium at a final concentration of 2% (v/v).

2.3. Cultivation of Cupriavidus necator DMS 545 Cells

A modified minimal propagation medium for C. necator DSM 545 growth was used according to Chmelová et al. [7] and contained glucose (5.0 g/L), ammonium sulfate (4.0 g/L), dipotassium phosphate (5.8 g/L), potassium phosphate monobasic (3.7 g/L) and magnesium sulfate heptahydrate (0.25 g/L). Fermentation was carried out in 0.1 L Erlenmeyer flasks containing 25 mL of the medium. Cultivation was performed under dynamic conditions (100 RPM) for 48 h at 30 °C.

2.4. Screening the Components Affecting Biomass Production and PHB Yield

The effect of glucose (carbon source) concentration (1.0–10.0 g/L), ammonium sulfate (nitrogen source) concentration (1.0–20.0 g/L), magnesium sulfate concentration (0.025–0.625 g/L) and phosphate buffer molarity (11–151 mmol/L) was tested on selected dependent variables (biomass concentration, crude PHB-containing extract concentration, glucose consumption and PHB yield).

2.5. Optimization of the Propagation Medium

RSM was used to investigate the effect of glucose concentration, ammonium sulfate concentration and phosphate buffer molarity on the dependent variables (biomass concentration, glucose consumption and PHB yield). These three independent factors were tested on five level codes: −1.682; −1; 0; 1; and 1.682 (Table 1).
The second-order polynomial function with respect to the three selected parameters is given by Equation (1).
Y = b 0 + i = 1 k b i X i + i = 1 k b i i X i 2 + i = 1 i < j k 1 j = 2 b i j X i X j
where X are independent variables (glucose concentration, ammonium sulfate concentration and phosphate buffer molarity), Y is a response (biomass concentration, glucose consumption and PHB yield) and b are regression coefficients (bi—the linear coefficients, bii—the quadratic coefficients, bij—the interaction coefficients). The interaction between two variables and the effect of these factor levels on biomass concentration, glucose consumption and PHB yield were derived from 3D surface response plots. The coefficients of the response surface equation were determined.

2.6. Analytical Methods

The glucose concentration was determined by the DNS method [36] at 540 nm using a microplate reader (Multiskan Sky, Thermo Scientific, Karlsruhe, Germany). The glucose consumption was expressed as % of the carbon source consumed during cultivation (y = 0.4917 × −0.0285; R2 = 0.9991).
Dried C. necator DSM 545 biomass was homogenized for 5 min at 3000 RPM using metal beads and PHAs were extracted into chloroform (15 mL) for 24 h at 22 °C and 150 RPM. The obtained crude PHB-containing extract was dried by sodium sulfate, filtered, and evaporated to dryness on a rotary evaporator (Heidolph, Schwabach, Germany). The concentration of crude PHB-containing extract was expressed in g per liter of a medium.
The dry crude PHB-containing extract was further hydrolyzed to methyl-ester monomers via a methanolysis reaction [37]. Briefly, the dry extract was dissolved in 2 mL of chloroform and mixed with 2 mL of acidic methanol with 3% (v/v) sulfuric acid. PHB derivatization was carried out for 1 h at 100 °C. After the specified time, the mixture was cooled and mixed with 1 mL of distilled water. After equilibrium establishing, the chloroform layer was used to determine the most common PHA monomers originated by C. necator (3-HB and 3-HV) using Agilent 6890N (Agilent Technologies, Santa Clara, CA, USA) with FID detector. System control and data analysis were processed using the Agilent ChemStation software Rev. B.04.03-SP1 (Agilent Technologies, Santa Clara, CA, USA). The chromatographic separation was performed in the DB-23 column (0.25 mm i.d., 60 m long, 0.25 µm film thickness) (Agilent Technologies, Santa Clara, CA, USA), and 2 µL of the sample was injected. The injector temperature was 250 °C, and the FID temperature was set at 270 °C. The carrier gas (nitrogen) flow was 1.1 mL/min (constant flow). The program was set as follows: initial temperature 80 °C for 1 min, temperature increase at a rate of 10 °C/min to a temperature of 150 °C, temperature increase at a rate of 20 °C/min to a temperature of 280 °C maintained for 5 min. The presence of 3-HV monomers was below the limit of quantification in all tested samples. The presence of 3-HB monomers was detected and PHB concentration was calibrated using a 5-point calibration curve (y = 104.55 × −1.7855; R2 = 0.9975), and the results were then expressed as % (w/w) of the amount of dry weighed biomass.

2.7. Statistical Analysis

Microsoft Excel 2016 (Microsoft Corporation, Redmont, WA, USA) was used to process all initial data obtained, OriginPro 2016 (OriginLab Corporation, Northamton, MA, USA) for better visualization of the results and Statgraphic Centurion XV (Statpoint Technologies, Warrenton, VA, USA) was used for statistical analysis of experimental data. All assays were performed in triplicate.

3. Results and Discussion

The species C. necator is still one of the most efficient producers of scl-PHAs [23,24,25]. Although we relied on our previously published data to the propagation medium design [7], we verified the suitability of different nitrogen sources (ammonium sulfate, sodium-ammonium phosphate, ammonium nitrate, potassium nitrate, ammonium chloride) for the biomass concentration, glucose consumption, concentration of crude PHB-containing extract, and PHB yield. From the initial experiments (data not shown), we found that the most suitable source of nitrogen for the growth of C. necator DSM 545 was ammonium sulfate, for which we observed the complete consumption of glucose (100 ± 5.29%) and the highest biomass concentration (2.01 ± 0.07 g/L) after 48 h. This N source was found by Arumugam et al. [38] as the most unsuitable for PHA and bacterial biomass production. Instead of ammonium sulfate, the use of urea was found to be the best choice, according to these authors, reporting the highest accumulation of CDW (9.44 g/L) and PHAs (7.22 g/L). However, it should be noted that the strain C. necator MTCC-1954 was used and the different results in protein expression related to PHB synthesis and accumulation may have been caused by the influence of other conditions and sources of C and N [39]. Moreover, our results are supported by the work of Khanna and Srivastava [40], who used Ralstonia eutropha NRRL B14690 (known as C. necator) as the producer and determined that ammonium sulfate is the most suitable source of N when fructose is used as the carbon source (biomass 3.25 g/L, PHAs 1.4 g/L). Ammonium sulfate as a nitrogen source is most often used to produce PHAs by C. necator [21,22,23]. The highest PHB yield was found using ammonium nitrate (27.0 ± 0.2%), which was among the unsuitable N sources for biomass production (0.71 ± 0.08 g/L) (data not shown). Therefore, in terms of biomass production of C. necator DSM 545, we chose ammonium sulfate as the N source.

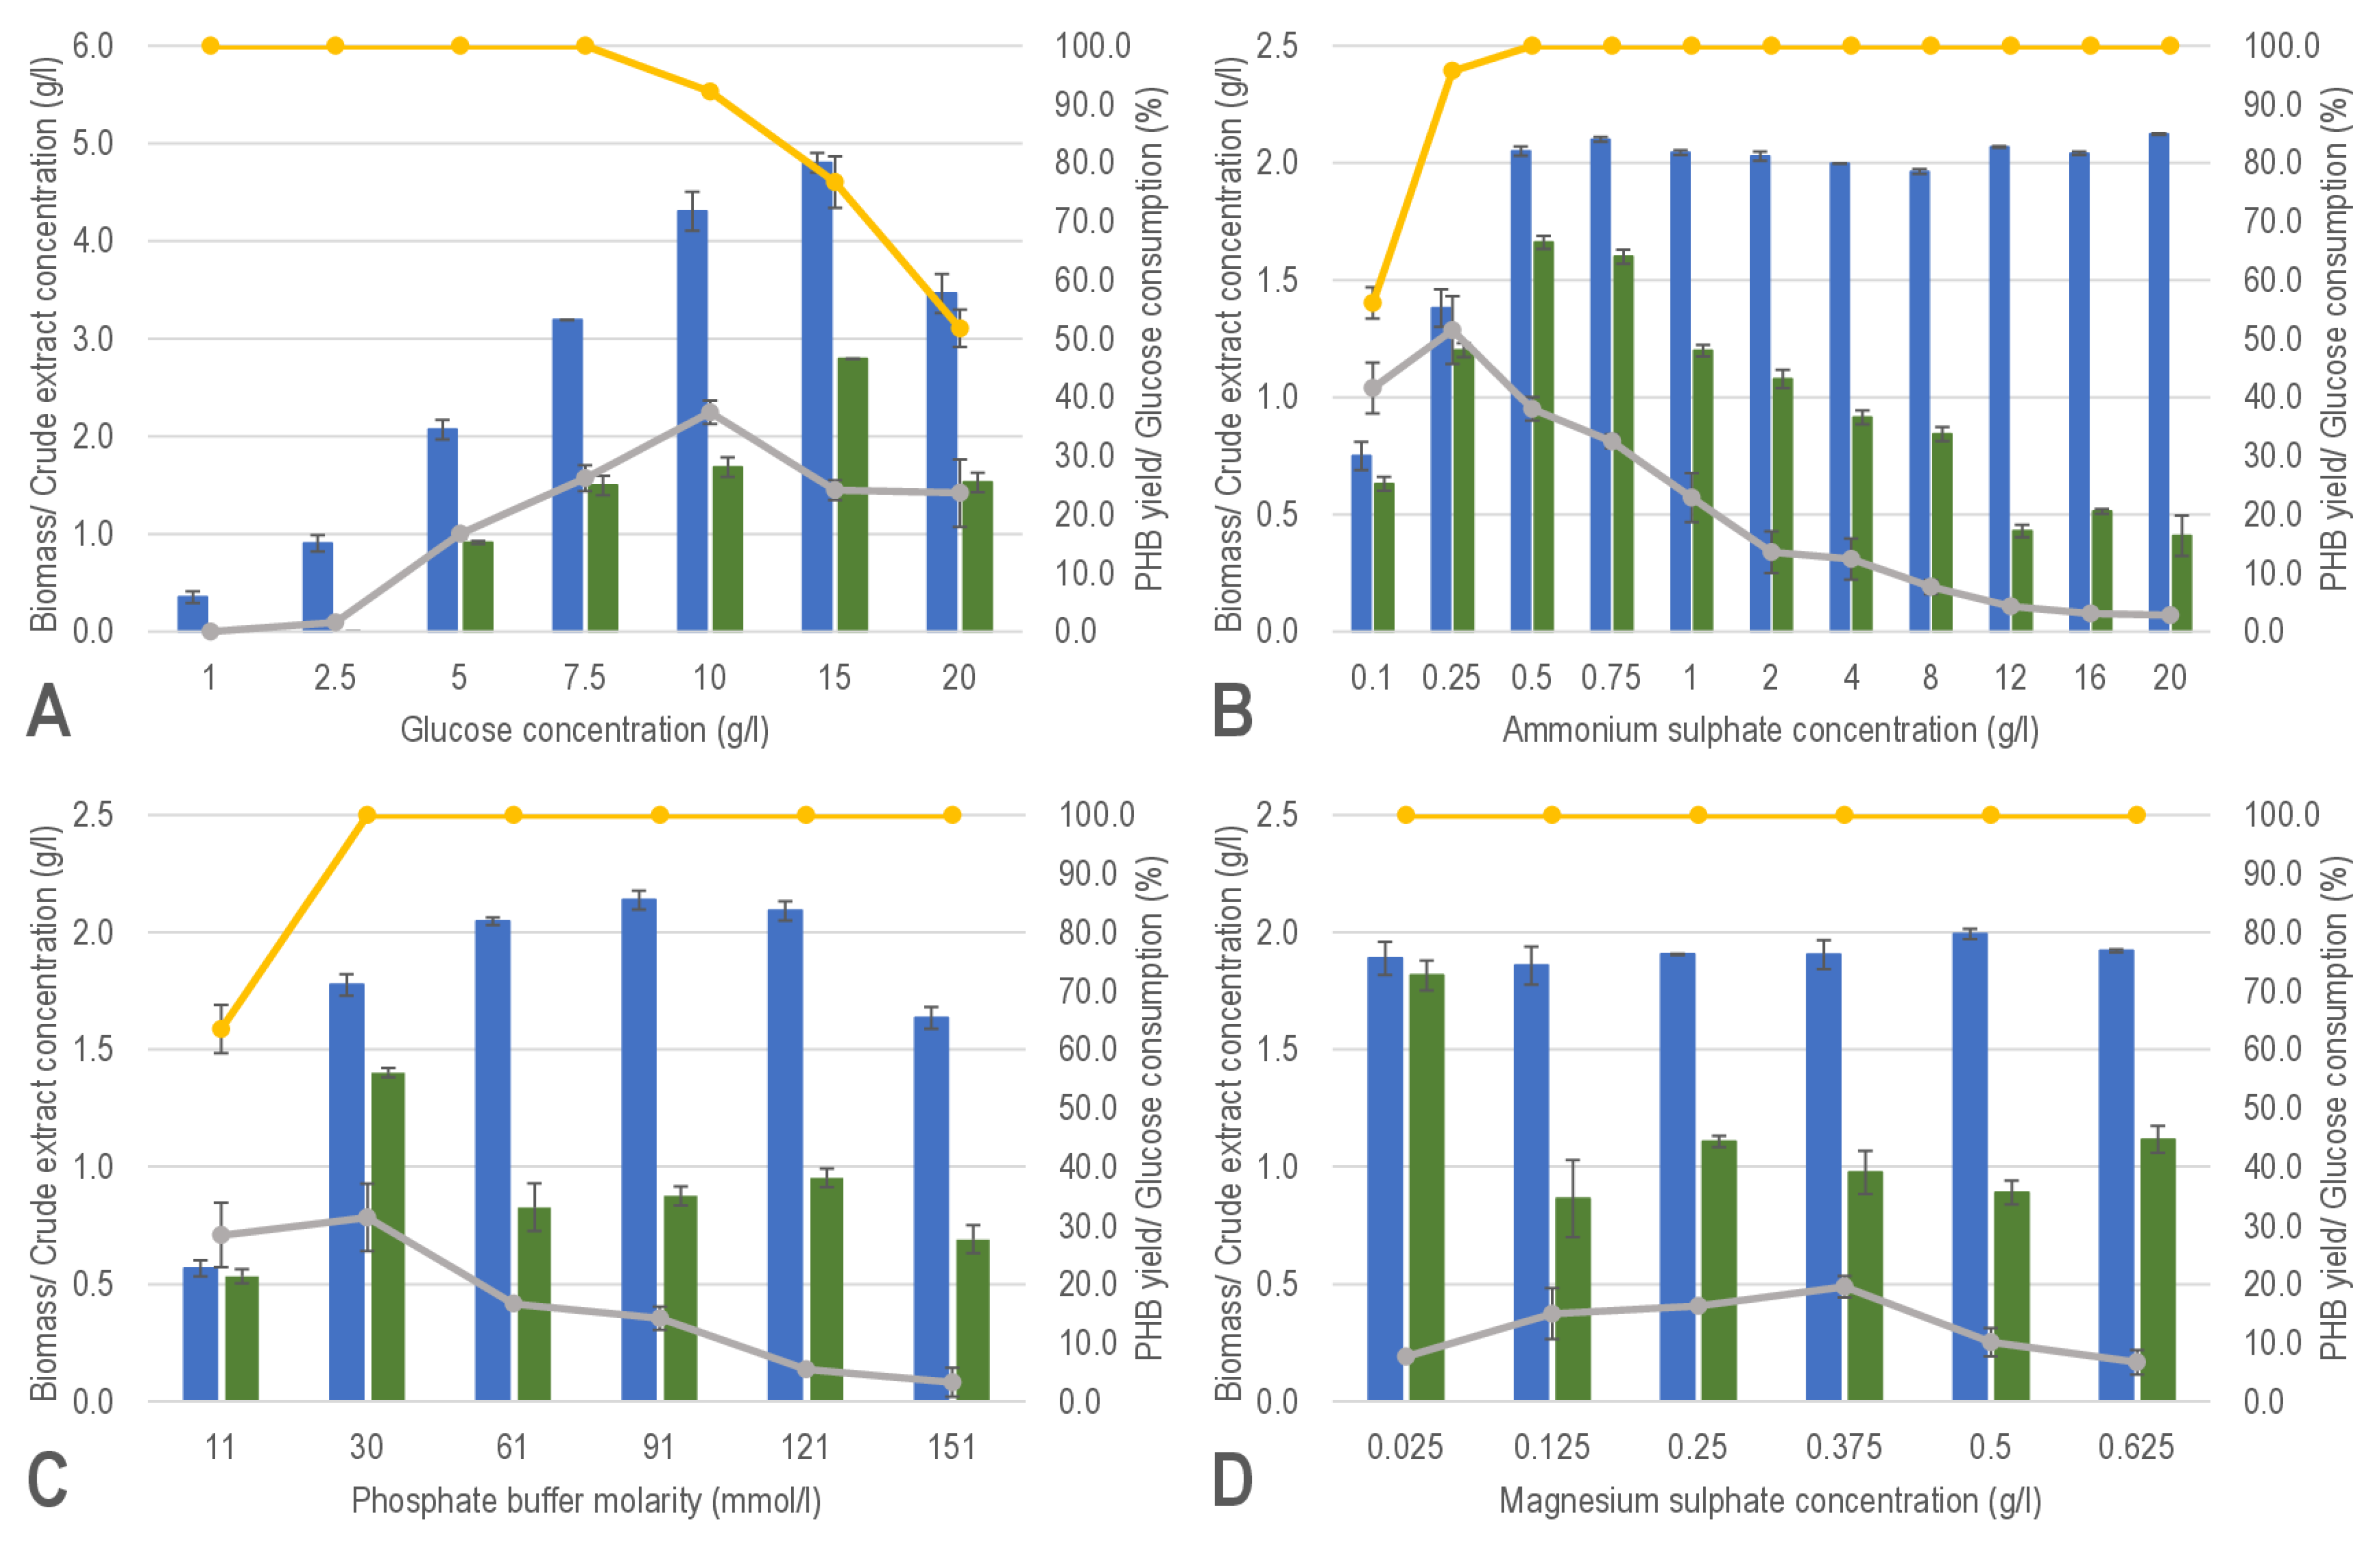
3.1. Screening the Variable Components Affecting Biomass Production and PHB Production

After selecting a suitable nitrogen source for the growth of C. necator DSM 545, we focused on determining the influence of the concentration of the different components of the minimal propagation medium (glucose, ammonium sulfate, magnesium sulfate) and the molarity of the phosphate buffer solution used (Figure 1).
The results show that the concentration of glucose and ammonium sulfate and the molarity of the buffer solution had a major influence on the biomass concentration. We observed a decrease in the amount of biomass when the concentration was increased (20 g/L), and we can assume that this concentration was inhibitory to the growth of C. necator DSM 545 (Figure 1A). The highest PHB yield was recorded at a glucose concentration of 10 g/L (37.4 ± 2.0% of dry biomass). The amount of PHB then decreased with increasing glucose concentration (Figure 1A). The concentration of crude PHB-containing extract increased with increasing glucose concentration, but this increase was caused by the higher production of lipophilic compounds, especially fatty acids (data not shown). It is important to note that at concentration higher than 10 g/L, complete depletion of glucose did not occur (Figure 1A), which is not optimal for commercial PHB production. Similarly, at extremely low concentration of ammonium sulfate (0.1 and 0.25 g/L), there was complete glucose consumption did not occur within 48 h of cultivation and the biomass concentration was determined to be ~2 g/L (Figure 1B). The results also show that a glucose concentration of 5 g/l allows maximum biomass production in the range of 2.5–2.12 g/L at nitrogen concentration higher than 0.25 g/L (Figure 1B). Crude extract production was highest at a concentration of 0.5 g/L (1.66 ± 0.03 g/L) and PHB yield was determined to be 38.0 ± 2.0% of dry biomass. The highest amount of PHB (51.4 ± 5.8% of dry biomass) was found in the medium with 0.25 g/L ammonium sulfate concentration. It is evident that, especially at lower concentration, the amount of ammonium sulfate in the medium significantly affects both biomass and PHB production, and therefore this independent variable was chosen in the concentration range of 0.5–1.0 g/L. A similar value for ammonium sulfate concentration was determined by Zahari et al. [41], who observed the highest rate of PHB production by a strain of C. necator (strain CCUG52238(T)) at a concentration of 0.5 g/L. Conversely, a higher concentration (1.5 g/L) suitable for growth and PHA production of C. necator (strain ATCC 17697) was also recorded by Nygaard et al. [22]. We observed a positive effect of increasing buffer molarity on biomass production in the range of 11–151 mmol/L (Figure 1C). Maximum PHB yield was measured in the medium with 30 mmol/L phosphate buffer (31.73% of dry biomass) with complete depletion of glucose. These results agree with those of other authors who described that the C. necator bacteria require stress conditions and a lack of a single source of nutrition (N, P, S) for PHA production [29]. Phosphorus is an important component of various cellular components such as phospholipids, nucleic acids, proteins, and enzymes, and is also involved in cellular energetics [42]. Similarly, Mohan and Reddy [43] found that increased P concentration leads to rapid protein synthesis, while its deficiency reduces this rate and affects the amount of biomass as well as PHAs. C. necator DSM 545 requires some appropriate concentration of P in the medium, but its extremely low concentration (11 mmol/L) caused inhibition of biomass production (Figure 1C). In addition, even the lowest molarity of phosphate buffer used (11 mmol/L) was not sufficient to maintain a stable pH, which was lowest at 4.95 ± 0.05 at the end of the cultivation (data not shown). Similarly, we observed this when 30 mmol/L phosphate buffer (5.25 ± 0.11) was used (data not shown). At higher molarity of buffer (˃61 mmol/L), the pH of the propagation medium at the end of cultivation was ~6.8. In the concentration range of 0.025–0.625 g/L magnesium sulfate (Figure 1D), we did not observe any effect on the growth of C. necator DSM 545, but increasing concentration was inhibitory to PHB production, as the highest value was recorded at the lowest concentration. The concentration of magnesium sulfate used in a medium varies from 0.2–0.5 g/L in the studies, but lower concentrations from this range are usually used [24,44,45]. Comparable results were reported by Passanha et al. [14] who found that the growth of C. necator DSM 545 can be facilitated by sulfates, phosphates, and low concentration of tin, while excess ammonia and low levels of magnesium affect PHA production. The concentration of glucose, ammonium sulfate and the phosphate buffer molarity are parameters affecting the biomass production of C. necator DSM 545 and based on the results (Figure 1), we proposed suitable ranges of these parameters in the matrix to optimize them using RSM.

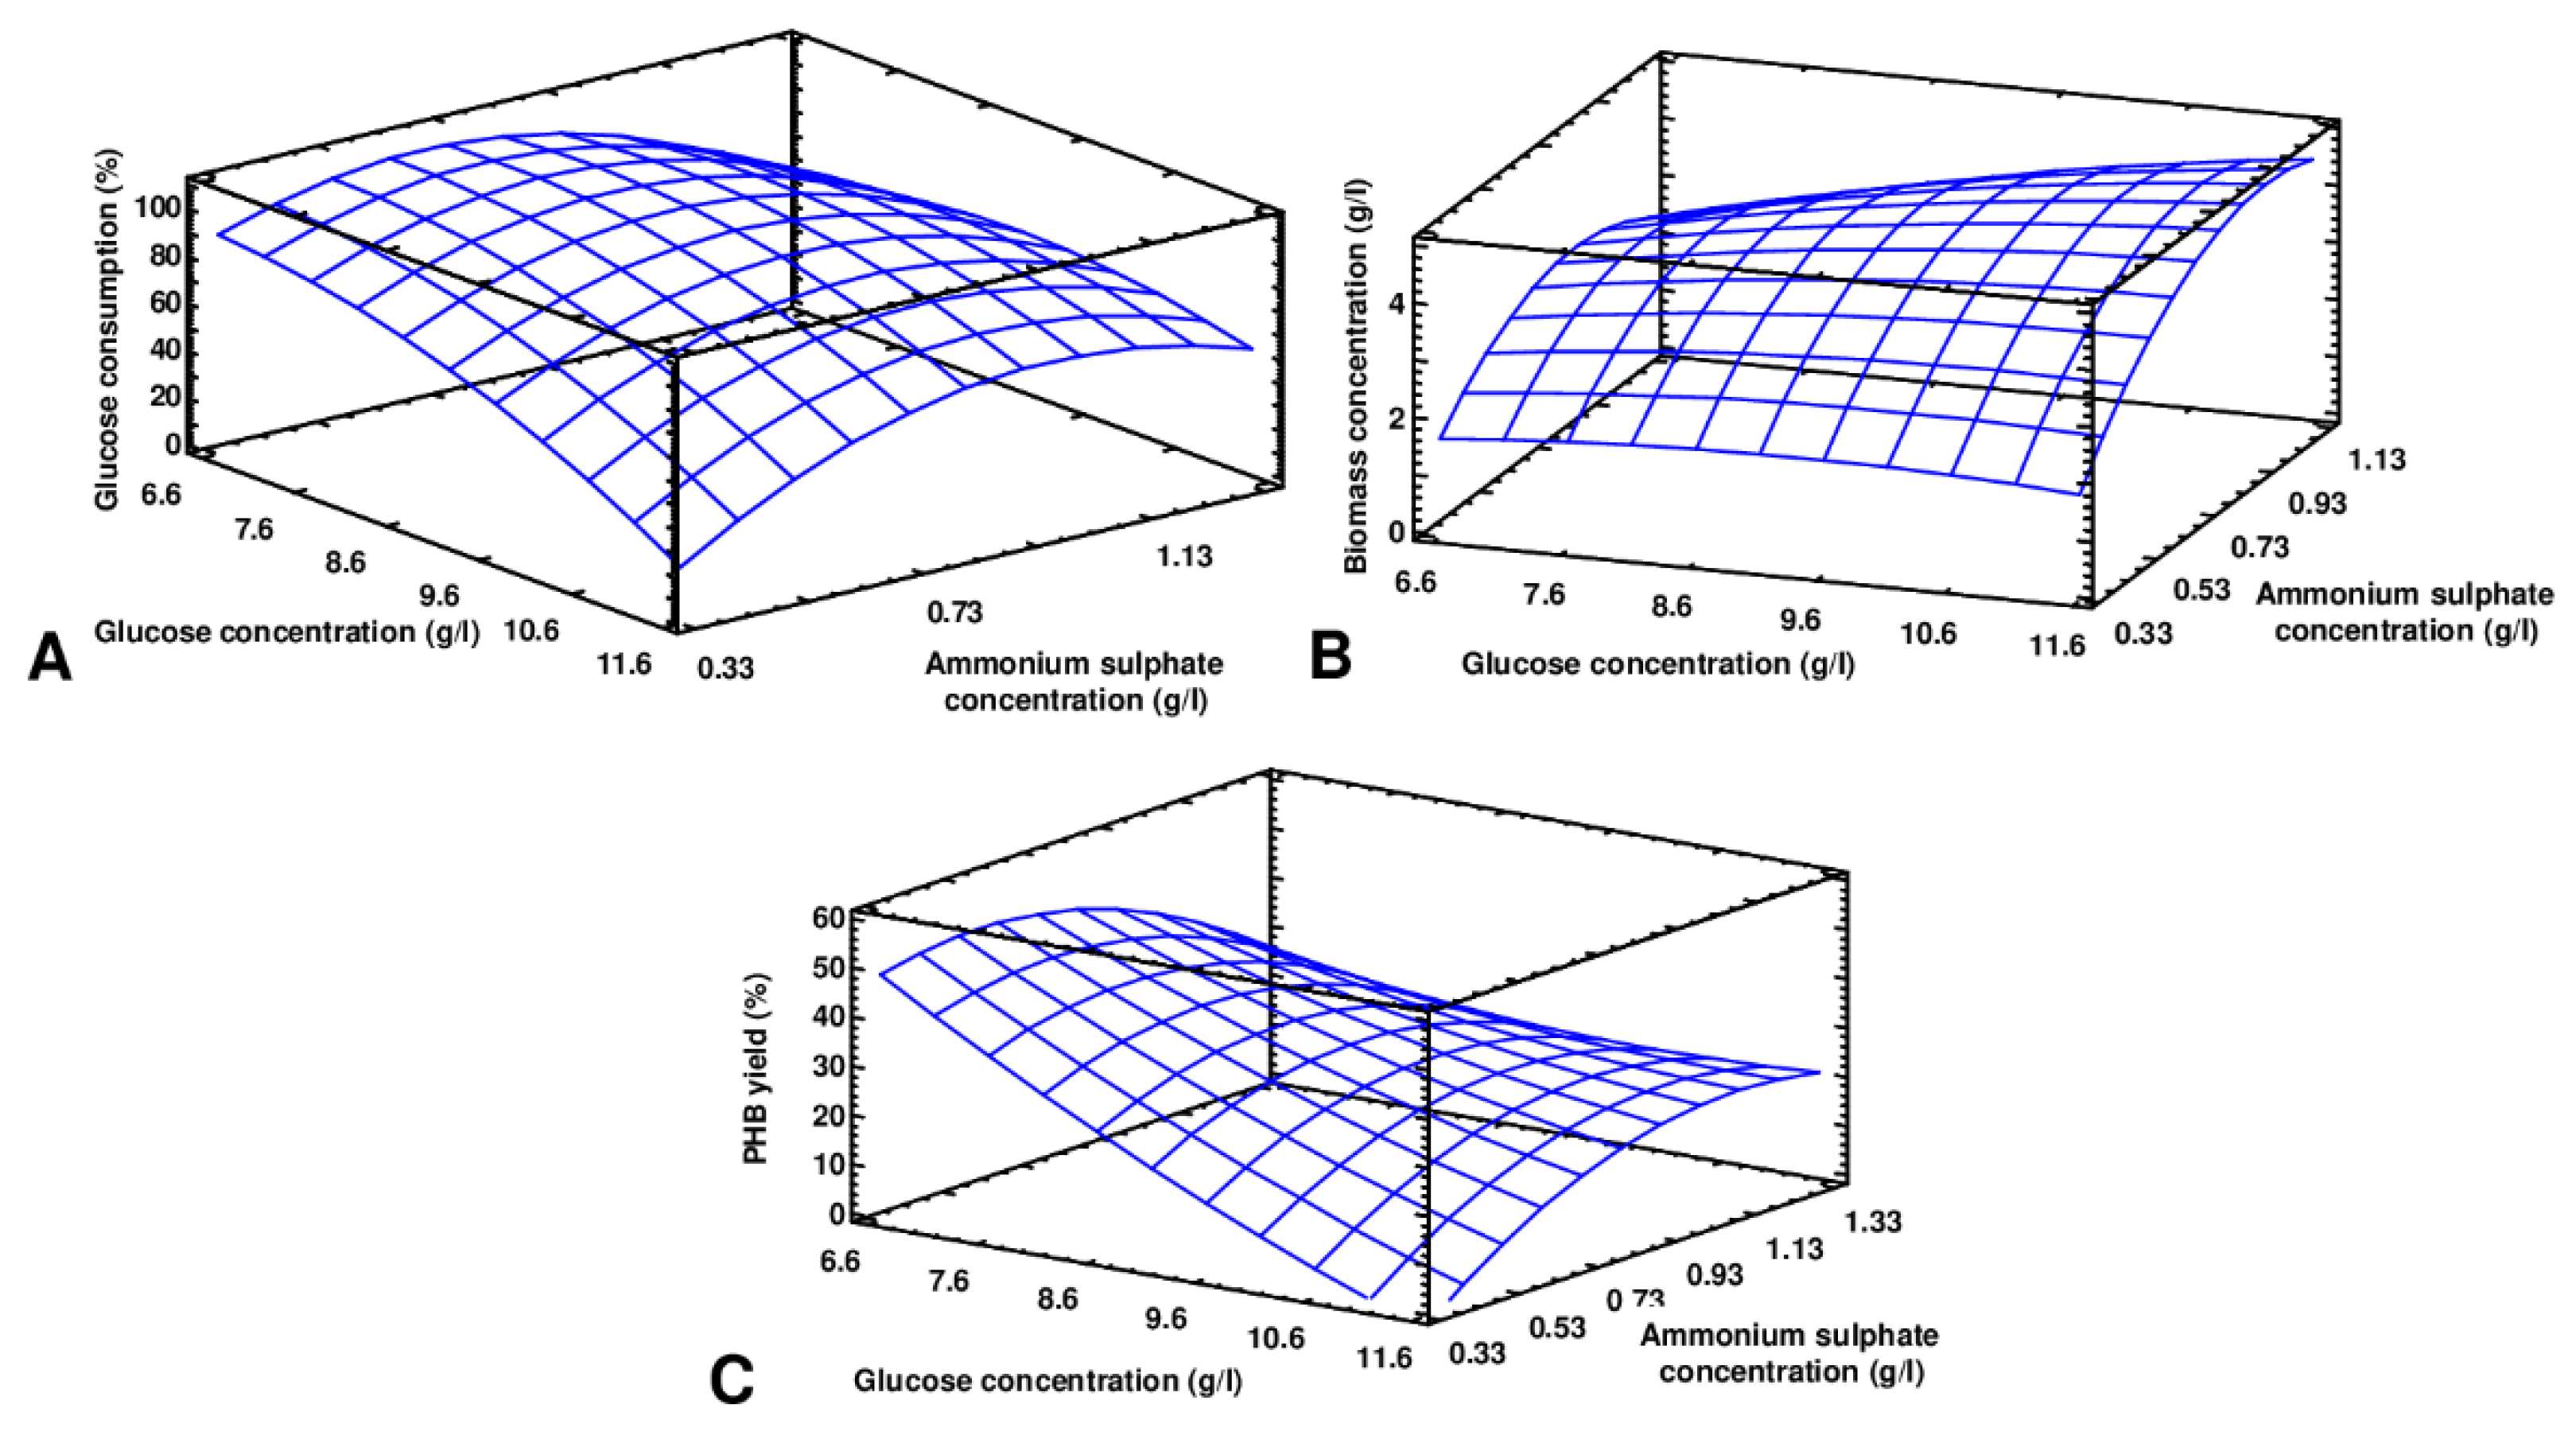
3.2. RSM Optimization

The results show that magnesium sulfate has no effect on biomass or PHB production, and this parameter was not considered in the RSM optimization of the propagation medium composition, and it was set at 0.025 g/L in all media. Thus, the following parameters were valued: concentration of glucose and ammonium sulfate and phosphate buffer molarity on biomass concentration (g/L), glucose consumption (%) and PHB yield (%) (Table 2). The measured biomass concentration values were in the range 2.80–4.25 g/L; glucose consumption ranged from 59.7 to 99.6%; and the PHB yield ranged from 17.9 to 49.4% of dry biomass. The obtained experimental data were used to calculate the coefficients of the second-order polynomial equations.
The R2 coefficients were determined at 97.6% for biomass concentration, 98.2% for glucose consumption and 96.2% for PHB yield. Three-dimensional plots to better understand the interactions between the selected variables are shown in Figure 2.
Table 3 summarizes the regression coefficients and analysis of variance calculated for biomass concentration, glucose consumption and PHB yield.
All independent variables had a positive linear effect on glucose consumption and biomass concentration and a negative effect on PHB yield, except for ammonium sulfate concentration, where a statistically significant positive linear effect was observed (p < 0.05). The quadratic effect of all tested effects (AA, BB, CC) had a statistically significant effect on glucose consumption (p < 0.05). At lower ammonium sulfate concentration, glucose consumption was lower (Figure 2A), but PHB production was higher (Figure 2C); conversely, at higher ammonium sulfate concentration, biomass production increased (Figure 2B). Phosphate buffer molarity had a positive linear effect and a negative quadratic effect on biomass production. A negative quadratic effect of this parameter was observed for all variables, moreover, with statistical significance (p < 0.05) for glucose consumption and biomass concentration.

3.3. Optimization and Verification of the Model

The results of predicted and experimentally verified values show that the conditions for the maximum yield of biomass and PHB are different. The optimal conditions for biomass production of C. necator DSM 545 in the propagation medium were determined as: 10.8 g/L glucose, 0.95 g/L ammonium sulfate, and 60.2 mmol/L phosphate buffer molarity (Table 4). Lower concentrations of all variables were determined for PHB production: glucose 6.7 g/L, ammonium sulfate 0.60 g/L, and phosphate buffer molarity 20 mmol/L (Table 4).
Under optimal conditions (Table 4), biomass concentration is expected to be 4.54 g/L, glucose consumption 100% and PHB yield 54.7%. These conditions were then experimentally verified, confirming in all cases the correct setting of the optimization matrix. By optimizing the propagation medium, we increased the biomass concentration up to 2.5-fold compared to the minimal propagation medium (Figure 1). Nygaard et al. [22] optimized the medium for PHB production using C. necator ATCC 17697. The authors determined the optimal concentration of C source (20 g/L fructose) and N source (1.5 g/L ammonium sulfate), which was almost twice as high as in the case of our optimized composition of the production medium (Table 4). After verification of predicted results, the authors set the maximum PHB yield at 70%. However, in terms of the price of the medium, our medium is more suitable for the PHB production because the higher concentration of C source is also related to the higher price of a medium, and fructose used by these authors is more expensive (EUR 97.9/kg D-(−)-fructose) than glucose (EUR 66.8/kg D-(+)-glucose). A similar optimization model using RSM was also applied in a study of Biglari et al. [46], who used the modified C. necator NSDG-GG, which had its original native phaC replaced with phaC from Aeromonas caviae, for PHB production. The authors identified an optimal medium composition with a higher concentration of the C source (37.7 g/L glucose) but a similar nitrogen concentration (0.73 g/L urea) to what we determined. The study also shows the suitability of the RSM method to enhance PHA production by C. necator and, moreover, this method is very commonly used to enhance the PHA production by various producers [7,10,44]. The present results show that two different media are required for biomass and PHB production (Table 4), and therefore it would be advisable to consider a two-step cultivation in which, once the carbon and nitrogen sources have been depleted, a dose of carbon and nitrogen is added to the medium at concentrations sufficient to stimulate PHB production. However, the key factor in the composition of these two media is not the ratio between C and N, as this ratio is 9.9:1 for the maximum biomass production and 11.2:1 for the maximum PHB production (Table 4). According to other authors, the ratio of these two sources has a significant effect on PHA production, with PHA production influenced by orders higher ratio and moreover, the ratios of C and N vary considerably in the literature [47,48,49]. Ahn et al. [47] set a high ratio of 360:1 as the most suitable ratio when they observed the highest accumulation of PHA (0.72 g/L) using the production organism C. necator ATCC 17697. Glucose and ammonium chloride were used in a medium, and rice straw was also used to reduce overall costs, bringing the ratio down to 160:1. In this work, the supporting growth medium for C. necator ATCC 17697 biomass was nutrient broth. Approximately double the ratio (20:1) compared to our work is reported by Park et al. [48], who used soybean oil and ammonium sulfate for this purpose. Under these conditions, they recorded 0.0–0.82 g PHA/g soybean oil. The concentration and ratio of phosphorus to C and N are likely to play a key role and may positively influence the amount of PHB. Taking this parameter into account can be crucial for optimizing PHA production. Amini et al. [49], for PHA production using C. necator DSM 545, determined that higher C/N/P ratios (100:2:15) resulted in maximized biomass (7.9 g/L) and PHB (3 g/L) production. According to the authors, reducing the C/N/P ratio to 100:0.5:1 slowed PHB production by up to 14%. Reddy and Mohan [50] described that a lower N and P ratio had a positive effect on PHA production, although the authors used a mixed culture of microorganisms (71.4% Furmicutes, 28.6% Protobacteria). The importance of low P concentration on the growth of C. necator DSM 545 (along with the effect of ammonia, magnesium, and sulfate) are also described in the study by Passanha et al. [11]. We noticed that lower concentrations of P and N have a positive effect on PHB yield, and conversely, a higher concentration of P has a positive effect on biomass concentration. This conclusion is supported by the fact that it is necessary to produce PHB of C. necator DSM 545 in two steps (to separate the propagation phase from the production phase), ideally by fed-batch cultivation, although this conclusion will require further research.

4. Conclusions

The aim of the work was to optimize the composition of the propagation medium to maximize biomass production of C. necator DSM 545. The optimal values of the selected variables to produce biomass were as follow: glucose concentration of 10.8 g/L; ammonium sulfate concentration of 0.95 g/L; and phosphate buffer molarity 60.2 mmol/L. The optimal values of selected variables for PHB production were lower than for biomass production: glucose concentration 6.7 g/L; ammonium sulfate concentration 0.60 g/L; and phosphate buffer molarity 20 mmol/L. This approach resulted in a 2.5-fold increase in biomass production and a 3.8-fold increase in PHB yield compared to the original medium. Based on the obtained results, we can summarize that two-step cultivation should be used because the optimal conditions for biomass and PHB production are different.

Author Contributions

Conceptualization, B.L. and D.C.; methodology, M.O. and D.C.; software, D.C.; validation, S.R.; formal analysis, S.R.; investigation, S.R.; resources, M.O.; data curation, S.R. and D.C.; writing—original draft preparation, B.L. and D.C.; writing—review and editing, M.O.; visualization, B.L.; supervision, S.M.; project administration, M.O. and S.M.; funding acquisition, M.O. and S.M. All authors have read and agreed to the published version of the manuscript.

Funding

This work was supported by Slovak Research and Development Agency [APVV-18-0420].

Institutional Review Board Statement

Not applicable.

Informed Consent Statement

Not applicable.

Data Availability Statement

Not applicable.

Conflicts of Interest

The authors declare no conflict of interest.

Abbreviations

3-HB—3_hydroxybutyrate, 3-HV—3-hydroxyvalerate, CDW—cell dry weight, CoA—coenzyme A, DNS—3,5-dinitrosalicylic acid, lcl—long-chain length, mcl—medium-chain length, MFU—McFarland unit, NADPH—reduced nicotinamide adenine dinucleotide phosphate, P(3HB)—poly(3-hydroxybutyrate), PHA—polyhydroxyalkanoate, scl—short-chain length.

References

  1. Kumar, M.; Gupta, A.; Thakur, I.S. Carbon dioxide sequestration by chemolithotrophic oleaginous bacteria for production and optimization of polyhydroxyalkanoate. Bioresour. Technol. 2016, 213, 249–256. [Google Scholar] [CrossRef]
  2. Maheshwari, N.; Kumar, M.; Thakur, I.S.; Srivastava, S. Production, process optimization and molecular characterization of polyhydroxyalkanoate (PHA) by CO2 sequestering B. cereus SS105. Bioresour. Technol. 2018, 254, 75–82. [Google Scholar] [CrossRef]
  3. Chen, G.-Q.; Chen, X.-Y.; Wu, F.Q.; Chen, J.-C. Polyhydroxyalkanoates (PHA) toward cost competitiveness and functionality. Adv. Ind. Eng. Polym. Res. 2020, 3, 1–7. [Google Scholar] [CrossRef]
  4. Chmelová, D.; Legerská, B.; Ondrejovič, M. Recombinant DNS technology as a tool for improving production of polyhydroxyalkanoates by the natural producers. Nova Biotechnol. Chim. 2020, 19, 124–137. [Google Scholar] [CrossRef]
  5. Santolin, L.; Waldburger, S.; Neubauer, P.; Riedel, S.L. Substrate-flexible two-stage fed-batch cultivations for the production of the PHA copolymer P(HB-co-HHx) with Cupriavidus necator Re2058/pCB113. Front. Bioeng. Biotechnol. 2021, 9, 623890. [Google Scholar] [CrossRef]
  6. Araceli, F.S.; Ramsay, J.A.; Berenice, V.-P.; Fermin, P.-G.; Ramsay, B.A. High amounts of medium-chain-length polyhydroxyalkanoates subunits can be accumulated in recombinant Cupriavidus necator with wild-type synthase. J. Biotechnol. 2022, 349, 25–31. [Google Scholar] [CrossRef]
  7. Chmelová, D.; Legerská, B.; Ondrejovič, M.; Miertuš, S. Optimization of propagation medium for enhanced polyhydroxyalkanoate production by Pseudomonas oleovorans. Fermentation 2022, 8, 16. [Google Scholar] [CrossRef]
  8. Brojanigo, S.; Parro, E.; Cazzorla, T.; Favaro, L.; Basaglia, M.; Casella, S. Conversion of starchy waste streams into polyhydroxyalkanoates using Cupriavidus necator DSM 545. Polymers 2020, 12, 1496. [Google Scholar] [CrossRef]
  9. Rayasam, V.; Chavan, P.; Kumar, T. Polyhydroxyalkanoate synthesis by bacteria isolated from landfill and ETP with pomegranate peels as carbon source. Arch. Microbiol. 2020, 202, 2799–2808. [Google Scholar] [CrossRef]
  10. Arias-Roblero, M.; Mora-Villalobos, V.; Velazquez-Carrillo, C. Evaluation of fed-batch fermentation for production of polyhydroxybutyrate with a banana pulp juice substrate from an agro industrial by-product. Front. Sustain. Food Syst. 2021, 5, 681596. [Google Scholar] [CrossRef]
  11. Koller, M.; Obruča, S. Biotechnological production of polyhydroxyalkanoates from glycerol: A review. Biocatal. Agric. Biotechnol. 2022, 42, 102333. [Google Scholar] [CrossRef]
  12. Koller, M. Advances in polyhydroxyalkanoate (PHA) production, volume 3. Bioengineering 2022, 9, 328. [Google Scholar] [CrossRef]
  13. Obruča, S.; Dvořák, P.; Sedláček, P.; Koller, M.; Sedlář, K.; Pernicová, I.; Šafránek, D. Polyhydroxyalkanoates synthesis by halophiles and thermophiles: Towards sustainable production of microbial bioplastics. Biotechnol. Adv. 2022, 58, 107906. [Google Scholar] [CrossRef]
  14. Passanha, P.; Esteves, S.R.; Kedia, G.; Dinsdale, R.M.; Guwy, A.J. Increasing polyhydroxyalkanoate (PHA) yields from Cupriavidus necator by using filtered digestate liquors. Bioresour. Technol. 2013, 147, 345–352. [Google Scholar] [CrossRef]
  15. Aljuraifani, A.A.; Berekaa, M.M.; Ghazwani, A.A. Bacterial biopolymer (polyhydroxyalkanoate) production from low-cost sustainable sources. MicrobiologyOpen 2019, 8, e00755. [Google Scholar] [CrossRef]
  16. Możejko-Ciesielska, J.; Kiewisz, R. Bacterial polyhydroxyalkanoates: Still fabulous? Microbiol. Res. 2016, 192, 271–282. [Google Scholar] [CrossRef]
  17. Madhusoodanan, G.; Hariharapura, R.C.; Somashekara, D. Dissolved oxygen as a propulsive parameter for polyhydroxyalkanoate production using Bacillus endophyticus cultures. Environ. Dev. Sustain. 2022, 24, 4641–4658. [Google Scholar] [CrossRef]
  18. Basak, B.; Ince, O.; Artan, N.; Yagci, N.; Ince, B.K. Effect of nitrogen limitation on enrichment of activated sludge for PHA production. Bioprocess Biosyst. Eng. 2011, 34, 1007–1016. [Google Scholar] [CrossRef]
  19. Ntaikou, I.; Koumelis, I.; Kamilari, M.; Iatridi, Z.; Tsitsilianis, C.; Lyberatos, G. Effect of nitrogen limitation on polyhydroxyalkanoates production efficiency, properties and microbial dynamics using a soil-derived mixed continuous culture. Int. J. Biobased Plast. 2019, 1, 31–47. [Google Scholar] [CrossRef]
  20. Papapostolou, A.; Karawavvas, E.; Chatzidoukas, C. Oxygen mass transfer limitations set the performance boundaries of microbial PHA production processes—A model-based problem investigation supporting scale-up studies. Biochem. Eng. J. 2019, 148, 224–238. [Google Scholar] [CrossRef]
  21. Quintanar-Gómez, S.; Abreu-Corona, A.; Zamudio-Pérez, E.; Vargas-Hérnanez, G.; Téllez-Jurado, A.; Gracida-Rodríguez, J. Production of medium chain length polyhydroxyalkanoates from Cupriavidus necator with beeswax hydrolyzates as carbon source. Rev. Int. Contam. Ambient. 2018, 34, 467–474. [Google Scholar] [CrossRef]
  22. Nygaard, D.; Yasshuk, O.; Hermida, É.B. Evaluation of culture medium on poly(3-hydroxybutyrate) production by Cupriavidus necator ATCC 17697: Application of the response surface methodology. Heliyon 2019, 5, e01374. [Google Scholar] [CrossRef]
  23. Nehra, K.; Lathwal, P.; Gupta, S.; Sidhu, P.K.; Rana, J.S. Agro-industrial byproducts as alternate cost-effective medium components for production of polyhydroxybutyrate. Indian J. Exp. Biol. 2020, 58, 631–642. [Google Scholar]
  24. Nygaard, D.; Yaschuk, O.; Noseda, D.G.; Araoz, B.; Hermida, É.B. Improved fermentation strategies in a bioreactor for enhancing poly(3-hydroxybutyrate) (PHB) production by wild type Cupriavidus necator from fructose. Heliyon 2021, 7, e05979. [Google Scholar] [CrossRef]
  25. Zhila, N.O.; Sapozhnikova, K.Y.; Kiselev, E.G.; Vasiliev, A.D.; Nemstev, I.V.; Shishatskaya, E.I.; Volova, T.G. Properties of degradable polyhydroxyalkanoates (phas) synthesized by a new strain, Cupriavidus necator IBP/SFU-1, from various carbon sources. Polymers 2021, 13, 3142. [Google Scholar] [CrossRef]
  26. Ballard, D.G.H.; Holmes, P.A.; Senior, P.J. Formation of polymers of β-hydroxybutyric acid in bacterial cells and a comparison of the morphology of growth with the formation of polyethylene in the solid state. Recent Adv. Mech. Synth. Asp. Polym. 1987, 215, 293–314. [Google Scholar]
  27. Anderson, A.J.; Dawes, E.A. Occurrence, metabolism, metabolic role, and industrial uses of bacterial polyhydroxyalkanoates. Microbiol. Rev. 1990, 54, 450–472. [Google Scholar] [CrossRef]
  28. Cramm, R. Genomic view of energy metabolism in Ralstonia eutropha H16. J. Mol. Microbiol. Biotechnol. 2009, 16, 38–52. [Google Scholar] [CrossRef]
  29. Jendrossek, D.; Pfeiffer, D. New insights in the formation of polyhydroxyalkanoate granules (carbonosomes) and novel functions of poly(3-hydroxybutyrate). Environ. Microbiol. 2014, 16, 2357–2373. [Google Scholar] [CrossRef]
  30. Tajima, K.; Han, X.; Hashimoto, Y.; Satoh, Y.; Satoh, T.; Taguchi, S. In vitro synthesis of polyhydroxyalkanoates using thermostable acetyl-CoA synthase, CoA transferase, and PHA synthase from thermotolerant bacteria. J. Biosci. Bioeng. 2016, 12, 660–665. [Google Scholar] [CrossRef]
  31. Novackova, I.; Hrabalova, V.; Slaninova, E.; Sedlacek, P.; Samek, O.; Koller, M.; Krzyzanek, V.; Hrubanova, K.; Mrazova, K.; Nebesarova, J.; et al. The role of polyhydroxyalkanoates in adaptation of Cupriavidus necator to osmotic pressure and high concentration of copper ions. Int. J. Biol. Macromol. 2022, 206, 977–989. [Google Scholar] [CrossRef] [PubMed]
  32. Karasavvasa, E.; Chatzidoukas, C. Model-based dynamic optimization of the fermentative production of polyhydroxyalkanoates (PHAs) in fed-batch and sequence of continuously operating bioreactors. Biochem. Eng. J. 2020, 162, 107702. [Google Scholar] [CrossRef]
  33. Norhafini, H.; Huong, K.-H.; Amirul, A.A. High PHA density fed-batch cultivation strategies for 4HB-rich P(3HB-co-4HB) copolymer production by transformant Cupriavidus malaysiensis USMAA1020. Int. J. Biol. Macromol. 2019, 125, 1024–1032. [Google Scholar] [CrossRef]
  34. Koller, M.; Braunegg, G. Potential and prospects of continuous polyhydroxyalkanoate (PHA) production. Bioengineering 2015, 2, 94–121. [Google Scholar] [CrossRef] [PubMed]
  35. Byrom, D. Polymer synthesis by microorganisms: Technology and economics. Trends Biotechnol. 1987, 5, 246–250. [Google Scholar] [CrossRef]
  36. Miller, G.L. Use of dinitrosalicylic acid reagent for determination of reducing sugar. Anal. Chem. 1959, 31, 426–428. [Google Scholar] [CrossRef]
  37. Lanham, A.B.; Ricardo, A.R.; Albuquerque, M.G.E.; Pardelha, F.; Carvalheira, M.; Coma, M.; Frandinho, J.; Carvalho, G.; Oehmen, A.; Reis, M.A.M. Determination of the extraction kinetics for the quantification of polyhydroxyalkanoate monomers in mixed microbial systems. Process Biochem. 2013, 48, 1626–1634. [Google Scholar] [CrossRef]
  38. Arumugam, A.; Senthamizhan, S.G.; Ponnusami, V.; Sudalai, S. Production and optimization of polyhydroxyalkanoates from non-edible Calophyllum inophyllum oil using Cupriavidus necator. Int. J. Biol. Macromol. 2018, 112, 598–607. [Google Scholar] [CrossRef] [PubMed]
  39. Sharma, P.K.; Fu, J.; Spicer, V.; Krokhin, O.V.; Cicek, N.; Sparling, R.; Levin, D.B. Global changes in the proteome of Cupriavidus necator H16 during poly-(3-hydroxybutyrate) synthesis from various biodiesel by-product substrates. AMB Express 2016, 6, 36. [Google Scholar] [CrossRef]
  40. Khanna, S.; Srivastava, A.K. Statistical media optimization studies for growth and PHB production by Rastonia eutropha. Process Biochem. 2005, 40, 2173–2182. [Google Scholar] [CrossRef]
  41. Zahari, M.A.K.M.; Ariffin, H.; Mokhtar, M.N.; Salihon, J.; Shirai, Y.; Hassan, M.A. Factors affecting poly(3-hydroxybutyrate) production from oil palm frond juice by Cupriavidus necator (CCUG52238(T)). J. Biomed. Biotechnol. 2012, 2012, 125865. [Google Scholar]
  42. Bhatia, S.K.; Otari, S.V.; Jeon, J.-M.; Gurav, R.; Choi, Y.K.; Bhatia, R.K.; Pugazhendhi, A.; Kumar, V.; Banu, J.R.; Yoon, J.-J.; et al. Biowaste-to-bioplastic (polyhydroxyalkanoates): Conversion technologies, strategies, challenges, and perspective. Bioresour. Technol. 2021, 326, 124733. [Google Scholar] [CrossRef] [PubMed]
  43. Mohan, S.V.; Reddy, M.V. Optimization of critical factors to enhance polyhydroxyalkanoates (PHA) synthesis by mixed culture using Taguchi design of experimental methodology. Bioresour. Technol. 2013, 128, 409–416. [Google Scholar] [CrossRef] [PubMed]
  44. Trakunjae, C.; Boondaeng, A.; Apiwatanapiwat, W.; Kosugi, A.; Arai, T.; Sudesh, K.; Vaithanomsat, P. Enhanced polyhydroxybutyrate (PHB) production by newly isolated rare actinomycetes Rhodococcus sp. strain BSRT1-1 using response surface methodology. Sci. Rep. 2021, 11, 1896. [Google Scholar] [CrossRef] [PubMed]
  45. Kiselev, E.G.; Demidendko, A.V.; Zhila, N.O.; Shishatskaya, E.I.; Volova, T.G. Sugar beet molasses as a potential c-substrate for PHA production by Cupriavidus necator. Bioengineering 2022, 9, 154. [Google Scholar] [CrossRef]
  46. Biglari, N.; Dashti, M.G.; Abdeshahian, P.; Orita, I.; Fukui, T.; Sudesh, K. Enhancement of bioplastic polyhydroxybutyrate P(3HB) production from glucose by newly engineered strain Cupriavidus necator NSDG-GG using response surface methodology. 3 Biotech 2018, 8, 330. [Google Scholar] [CrossRef]
  47. Ahn, J.; Jho, E.H.; Nam, K. Effect of C/N ratio on polyhydroxyalkanoates (PHA) accumulation by Cupriavidus necator and its implication on the use of rice straw hydrolysates. Environ. Eng. Res. 2015, 20, 246–253. [Google Scholar] [CrossRef]
  48. Park, D.H.; Kim, B.S. Production of poly(3-hydroxybutyrate) and poly(3-hydroxybutyrate-co-4-hydroxybutyrate) by Ralstonia eutropha from soybean oil. New Biotechnol. 2011, 28, 719–724. [Google Scholar] [CrossRef]
  49. Amini, M.; Yousefi-Massumabad, H.; Younesi, H.; Abyar, H.; Bahramifar, N. Production of the polyhydroxyalkanoate biopolymer by Cupriavidus necator using beer brewery wastewater containing maltose as a primary carbon source. J. Environ. Chem. Eng. 2020, 8, 102588. [Google Scholar] [CrossRef]
  50. Reddy, M.V.; Mohan, S.V. Effect of substrate load and nutrients concentration on the polyhydroxyalkanoates (PHA) production using mixed consortia through wastewater treatment. Bioresour. Technol. 2012, 114, 573–582. [Google Scholar] [CrossRef]
Figure 1. The influence of a selected component of the minimal propagation medium ((A)—glucose concentration (g/L); (B)—ammonium sulfate concentration (g/L); (C)—phosphate buffer molarity (mmol/L) and (D)—magnesium sulfate concentration (g/L) on the monitored variables; —biomass concentration (g/L); —crude PHB-containing extract concentration (g/L); —PHB yield (%); —glucose consumption (%)).
Fermentation 08 00451 g001
Figure 2. Graphs showing the effect of glucose and ammonium sulfate concentration on glucose consumption (A), biomass concentration (B), and PHB yield (C). The optimal value of phosphate buffer molarity was set as a constant.
Fermentation 08 00451 g002
Table 1. Interpretation of coded levels of the three independent variables tested by RSM.
VariablesUnitCode Levels
−1.682−1011.682
glucose concentration(g/L)6.667.508.7510.0010.84
ammonium sulfate concentration(g/L)0.330.500.751.001.17
phosphate buffer molarity(mmol/L)20.0030.0045.0060.0070.00
Table 2. Experimental matrix with actual and coded level of independent variables and measured values of biomass concentration (g/L), glucose consumption and PHB yield (%).
Run NumberGlucose
Concentration
(g/L)
Ammonium Sulfate
Concentration
(g/L)
Phosphate Buffer
Molarity
(mmol/L)
Biomass Concentration
(g/L)
Glucose
Consumption
(%)
PHB
Yield
(%)
17.50 (−1)0.50 (−1)30 (−1)2.91 ± 0.0591.9 ± 0.444.9 ± 2.1
210.00 (1)1.00 (1)30 (−1)3.25 ± 0.0078.2 ± 0.927.6 ± 1.2
310.00 (1)0.50 (−1)60 (1)3.06 ± 0.0375.5 ± 0.240.2 ± 1.5
48.75 (0)0.75 (0)45 (0)3.84 ± 0.0997.4 ± 0.239.1 ± 0.2
57.50 (−1)1.00 (1)60 (1)3.30 ± 0.1399.6 ± 0.222.8 ± 2.1
67.50 (−1)1.00 (1)30 (−1)2.53 ± 0.0685.6 ± 1.544.8 ± 1.8
710.00 (1)1.00 (1)60 (1)4.25 ± 0.1387.7 ± 0.941.9 ± 5.4
88.75 (0)0.75 (0)45 (0)3.84 ± 0.0396.6 ± 0.541.0 ± 4.0
97.50 (−1)0,50 (−1)60 (1)2.80 ± 0.0896.6 ± 2.549.4 ± 0.8
1010.00 (1)0.50 (−1)30 (−1)3.06 ± 0.1959.7 ± 5.632.2 ± 1.1
1110.84 (1.682)0.75 (0)45 (0)4.13 ± 0.1070.0 ± 1.035.1 ± 1.8
128.75 (0)0.75 (0)20 (−1.682)2.36 ± 0.1068.7 ± 5.323.4 ± 1.4
136.66 (−1.682)0.75 (0)45 (0)3.02 ± 0.1497.9 ± 0.835.1 ± 1.1
148.75 (0)0.75 (0)70 (1.682)3.63 ± 0.1196.7 ± 0.727.9 ± 0.9
158.75 (0)1.17 (1.682)45 (0)2.86 ± 0.1577.8 ± 5.517.9 ± 0.5
168.75 (0)0.75 (0)45 (0)3.88 ± 0.0097.0 ± 0.729.9 ± 3.7
178.75 (0)0.33 (−1.682)45 (0)2.08 ± 0.0067.2 ± 2.123.5 ± 1.5
Table 3. Regression coefficients of the hypothesized second-order polynomial model for the dependent variables.
EffectFactorBiomass
Concentration
(g/L)
Glucose
Consumption
(%)
PHB
Yield
(%)
Constant −2.47246−25.4555258.859
LinearA0.377065 *18.0657 *−43.417
B4.40674 *67.7699 *9.06373 *
C0.0569158 *1.49479 *−1.2257
QuadraticAA−0.0357402−2.12928 *1.32338
BB−7.20779 *−118.663 *−49.2582 *
CC−0.0011688 *−0.016771 *−0.005873
InteractionAB0.504 *13.6 *9.552 *
AC0.002266670.0440.2648 *
BC0.0626667 *0.1−0.67067
A—glucose concentration, B—ammonium sulfate concentration, C—phosphate buffer molarity,* statistically significant differences at the p-value ˂ 0.05.
Table 4. Predicted and experimentally measured values for dependent variables under optimal propagation media conditions.
Independent Variable
Dependent VariableGlucose
Concentration
(g/L)
Ammonium Sulfate
Concentration (g/L)
Phosphate Buffer
Molarity (mmol/L)
Predicted ValueExperimental Value
biomass concentration10.80.9560.24.54 g/L4.84 ± 0.00 g/L
glucose consumption7.10.7256.0100%100 ± 0.14%
PHB yield6.70.6020.054.7%49.0 ± 1.9%
Publisher’s Note: MDPI stays neutral with regard to jurisdictional claims in published maps and institutional affiliations.

