Abstract
Production of carotenoids and lipids by Rhodotorula toruloides CBS 14 cultivated on wheat straw hydrolysate was investigated. An ultra-high-performance liquid chromatography (UHPLC) method for carotenoid quantification was developed and validated. Saponification effects on individual carotenoid quantification were identified, and lipid and carotenoid kinetics during cultivation were determined. The carotenoids β-carotene, γ-carotene, torularhodin, and torulene were identified; β-carotene was the major carotenoid, reaching a maximum of 1.48 mg/100 g dry weight. Recoveries of the carotenoids were between 66% and 76%, except torulene and torularhodin, which had lower recoveries due to saponification effects. Total carotenoid content in saponified and unsaponified yeast extract, respectively, determined by UHPLC or photometer, respectively, was 1.99 mg/100 g and 4.02 mg β-EQ/100 g dry weight. Growth kinetics showed a positive correlation between carotenoid content and lipid accumulation. β-carotene was the major carotenoid at all time points. At the end of the cultivation, triacylglycerols (TAGs) were the major lipid class, with 58.1% ± 3.32% of total lipids. There was also a high proportion of free fatty acids, reaching from 20.5% to 41.8% of total lipids. Oleic acid (C18:1) was the major fatty acid. The lipid yield at the end of the cultivation was 0.13 g/g of sugar consumed.
1. Introduction
Oleaginous yeasts have the ability to accumulate lipids to more than 20% of their total dry biomass weight [1]. The lipids produced are referred to as single-cell oil (SCO) and are dominated by triacylglycerols (TAGs). The oil mainly includes oleic (18:1), linoleic (18:2), palmitic (16:0), and palmitoleic (16:1) acids [2]. This fatty acid profile is comparable to that of vegetable oils such as palm or sunflower oil [3]. Thus, microbial oil has the potential to be utilized in similar applications as vegetable oil, e.g., the production of biodiesel [4,5], or the production of pharmaceuticals and cosmetics, as well as in the nutritional sector [6,7].
In oleaginous yeasts, lipid synthesis and storage are initiated at a surplus of carbon sources coupled with the limitation of nutrients such as nitrogen, sulfur, etc. [8]. Most of the formed lipids are TAGs, which are synthesized via the Kennedy pathway [9,10].
Carotenoids are a group of natural pigments synthesized by plants and microbes. They are tetraterpenoids, which are composed of eight isoprenoid units joined together in a polyene chain [11] and belong to the class of organic, lipid-soluble compounds. They exhibit natural antioxidant properties and are important components for the pharmaceutical, chemical, food, and feed industries [12]. These commercially important pigments are produced naturally by a variety of yeasts, including those belonging to the genus Rhodotorula. Therefore, these microorganisms have been regarded as potential pigment sources [13]. The basidiomycetous yeast genus Rhodotorula comprises a variety of oleaginous, pigmented species that can be cultivated efficiently on low-cost carbon sources such as lignocellulose [14,15,16].
In Rhodotorula species, carotenoids are synthesized via biosynthetic pathways that include the mevalonate pathway, isoprene biosynthesis, and the carotenogenic pathway. The proportion of each carotenoid produced depends on the strain and culture conditions [17,18].
The major carotenoid pigments in Rhodotorula species are γ-carotene, β-carotene, torularhodin, and torulene [19]. Perrier et al. [19] showed that the amounts of torulene and torularhodin pigments produced in Rhodotorula species vary by strain.
For identification and quantification of the carotenoids produced in specific Rhodotorula species, an accurate analytical method is required. Usually, a spectrophotometric technique, based on a standard curve with different concentrations of one individual carotenoid, is used to identify the total carotenoid content. In one study, torulene and torularhodin were quantified based on a β-carotene standard curve and related to the specific pigment extinction coefficients [20]. In another study, torulene was prepared as a crude pigment, isolated and purified from a torulene-producing yeast, and used as a standard for quantification in yeast samples [21]. Apart from these methods, due to unavailability of commercial standards, other methods such as thin-layer chromatography, liquid chromatography coupled with atmospheric pressure chemical ionization mass spectrometry (LC-APCI-MS), and flow cytometry have been used for separation and identification of torulene and torularhodin in yeast samples [19,22,23].
Carotenoid extraction is one of the most crucial steps in a successful analytical procedure when determining carotenoid production by yeasts. The classical acetone extraction of carotenoids from yeast samples includes freeze-drying, homogenization, centrifugation, heating, and saponification. Applying these pretreatment steps to yeast samples allows preconcentration of all carotenoids in the final extract [24]. The main purpose of adopting an extraction procedure for analyzing a multicomponent carotenoid composition in a sample is to obtain the highest possible recovery of a broad range of analytes. Among the different steps of carotenoid extraction, saponification of the coextracted lipids is often considered an essential step prior to quantification [25]. Previously, the effect of saponification on the total carotenoid content obtained from plant-derived sources has been studied [26], but there is a lack of information about the extent of the saponification effect on individual carotenoids produced by yeasts.
Currently, most of the commercially available carotenoids are chemically synthesized. However, in modern society, the growing interest in “natural” ingredients among consumers and their increased concern about synthetic pigments and their detrimental effects on health and the environment has reawakened interest in the use of natural colorants [27]. In this context, yeast-based carotenoids may be used to replace chemically synthesized carotenoids. Costs of production may be reduced by using improved strains and inexpensive (often byproduct) carbon and nitrogen sources in culture media [28].
Rhodotorula strains have the potential to play an important role in the production of SCOs, which have been proven to be a highly interesting class of biotechnological products ranging from bulk chemicals to high-value products [29].
This study aimed to monitor the formation of carotenoids and lipids in R. toruloides CBS 14, grown on wheat straw hydrolysate. To reach this aim, we developed a UHPLC-based quantification method for carotenoids, using commercial standards, and characterized the effect of saponification on individual carotenoids. Our results show dynamic changes in carotenoid and lipid composition during the course of cultivation.
2. Materials and Methods
2.1. Hydrolysate Preparation
Lignocellulose hydrolysate was prepared at the Department of Chemical Engineering, Lund University, Sweden, as described previously [6,30], i.e., in brief, the acid-soaked (1% acetic acid) biomass was steam exploded at 190 °C for 10 min in a 10 L steam pretreatment reactor. The liquid fraction was further separated from the solid fraction, and the latter was enzymatically hydrolyzed using a mixture of enzymes that includes cellulases, exoglucanases, β-glucosidases, and hemicellulases at 45 °C and pH 4.8.
2.2. Rhodotorula toruloides Cultivation
2.2.1. Inoculum Preparation
R. toruloides CBS 14 was obtained from the Westerdijk Fungal Biodiversity Institute, Utrecht, The Netherlands. Cells were stored in frozen stocks at −80 °C. R. toruloides CBS 14 inoculum was prepared as described before by Shapaval et al. [2], with slight modifications. For bioreactor cultivations, cells from YPD-agar plates (glucose 20 g/L, peptone 20 g/L, yeast extract 10 g/L, agar 15 g/L) were inoculated into 300 mL of YPD (glucose 20 g/L, peptone 20 g/L, yeast extract 10 g/L) in a 3 L Erlenmeyer flask and incubated at 25 °C for 48–72 h at 150 rpm. The cells were harvested by centrifugation (4000× g, 10 min), washed twice with sterile saline solution (NaCl, 9 g/L), resuspended in saline, and inoculated into the fermenters. Similarly, for shake-flask cultivations, 50 mL of preculture was prepared in 250 mL Erlenmeyer flasks, and the cells were washed, resuspended in saline, and inoculated into the shake-flask cultivation.
2.2.2. Fermentation Experiments
Shake-flask cultures were performed in 250 mL sterile baffle shake flasks with 50 mL of growth medium. The bioreactor cultures were run in Minifors 2, Bench-Top bioreactors (INFORS HT, Switzerland, working volume 2 L) with 1.5 L of growth medium. The growth medium in both the cultures included filter-sterilized lignocellulose hydrolysate and filter-sterilized 10× YNB (yeast nitrogen base) solution without amino acids and ammonium sulfate mixed with (NH4)2SO4 20 g/L, KH2PO4 70 g/L, NaH2PO4 20 g/L, MgSO4·7H2O 15 g/L, and yeast extract 10 g/L [31]. The cultures were inoculated with cells prepared as described above (Section 2.2.1). The shake-flask cultures were incubated at 25 °C for 4 days at 150 rpm, with an initial pH set to 6.0. After cultivation, the cells were washed with Milli-Q water, harvested, freeze-dried, and stored at −20 °C until carotenoid extraction.
In bioreactors, the pH was adjusted to 6.0 and automatically controlled by addition of NaOH (5M) or H3PO4 (3M). The aeration was initially set to 0.7 L/min, and during the experiment, it was increased up to 1 L/min. Dissolved oxygen tension (pO2) was set to 20% and was maintained by changing the stirring speed. A 1 mL volume of polypropylene glycol 2000 (Alfa Aesar, Karlsruhe, Germany) was added to minimize foaming. Immediately after the inoculation, 100 mL of culture broth was collected from each fermenter, and similarly, for the next 4 days, samples were collected every 24 h and then harvested (4000× g, 10 min), washed, freeze-dried, and stored at −20 °C until lipid and carotenoid extraction. At each time point, samples were collected for determining optical density, cell dry weight, and sugar content.
2.3. Analytical Techniques
2.3.1. Optical Density (OD600)
The optical density of the culture broth at each time point was monitored using a Biochrom WPA CO8000 cell density meter (UK) at a wavelength of 600 nm with distilled water as a blank.
2.3.2. Cell Dry Weight Determination
For dry weight determination, 2 mL of the broth culture was centrifuged at 15,000× g for 2 min. The cell pellets were washed thrice with deionized water and transferred onto a preweighed aluminum plate, which was then dried at 105 °C for 24 h, followed by weight measurement. All samples were analyzed in triplicate.
2.3.3. Sugars and Acetic acid Analysis
From the supernatant preserved after cell harvesting, the sugar and acetic acid content was measured as described by Brandenburg et al. [30]. A 1 mL volume of the supernatant was filtered using a sterile syringe filter with 0.2 μm polyether sulfone membrane (VWR International, Europe, Leuven, Belgium) and analyzed for sugars (glucose and xylose) and acetic acid in an Agilent Technologies high-performance liquid chromatography (HPLC) (Santa Clara, CA, USA), 1100 Series system containing refraction index detector, and a Rezex-ROA-Organic Acid H + 300 × 7.80 mm column (Skandinaviska Genetec AB, Västra Frölunda, Sweden). The column was eluted at 60 °C with 5 mM sulfuric acid at a flow rate of 0.6 mL/min.
2.3.4. Lipid Extraction
Lipids were extracted by using a modified Folch method [32]. Freeze-dried cells (100 mg) were soaked in 2 mL of 1 M HCl for 15 min in a glass tube and then heated at 75 °C for 1 h on a heating block. The mixture was then transferred to a separation funnel, and 2 mL of 0.8% KCl was added, followed by 6 mL of Folch solution (chloroform–methanol, 2:1 v/v). The mixture in the funnel was thoroughly mixed and then left to stand for 15 min to facilitate phase separation. The lower lipid phase was collected into a preweighed glass tube. Subsequently, 4 mL of chloroform was added into the funnel, mixed well with the remaining phase, and left to stand until phase separation occurred. Then, the lower lipid phase was again transferred to the same glass tube. The extraction with chloroform was repeated until a clear lipid phase was obtained. Finally, the tube with the lipid phase was dried under nitrogen to evaporate the chloroform. The tube containing lipids was weighed. The dried lipid samples were resuspended in 1 mL of hexane and stored at −20 °C until methylation.
2.3.5. Fatty Acid Profile
The extracted lipid samples were methylated, and the resulting fatty acid methyl esters (FAME) were analyzed using a gas chromatography (GC) system. The methylation was carried out using the procedure with boron trifluoride reagent described by Appelqvist [33]. Briefly, 0.5 mL of the extracted lipid in hexane (with 2 mg/mL concentration) was mixed with 2 mL of dry methanol in a new glass tube, which was then incubated at 60 °C for 10 min. Then, 3 mL of boron trifluoride reagent was added. After thorough mixing, the tube was incubated for another 10 min at 60 °C. The mixture was then cooled to room temperature, and subsequently, 2 mL of 20% NaCl and 2 mL of hexane were added, and the mixture was vortexed well and then left to stand to facilitate phase separation.
The upper hexane phase with the FAME was transferred into a new glass tube. A 10 μL volume of the sample was used to check for complete derivatization to FAME on a thin-layer chromatography (TLC) silica-coated plate. Finally, the fatty acids were analyzed in a GC system (CP-3800, CTC Analytics AG, Zwingen, Switzerland) equipped with a flame ionization detector and a split injector and fitted with a 50 m long × 22 mm i.d., 0.25 µm film thickness, BPX 70 fused-silica capillary column. The GC was programmed to start at 158 °C, with temperature increasing at a rate of 2 °C min−1 until 220 °C and a final constant time of 13 min at 220 °C. The peaks were identified by comparing their retention times with those of the standard mixture GLC-68D (Nu-Chek Prep, Elysian, MN, USA) and other authentic standards. The response factors were also evaluated by comparison with the GLC-68D standard.
2.3.6. Lipid Profile Analysis
Lipid classes were analyzed using the method of Olsen and Henderson [34] with some modifications. The extracted lipid samples were diluted to a concentration of 1 g/L in hexane and were separated by TLC. In brief, 5 μL of each sample was applied in 2 mm bands with a CAMAG TLC Sampler ATS4 (CAMAG, Muttenz, Switzerland) on a TLC plate (precoated with silica gel TLC plates, 20 × 10 cm; Silicagel 60; 0.20 mm layer, Merck, Darmstadt, Germany). All samples were applied in duplicate.
Separation of the lipid classes was carried out using hexane–diethyl ether–acetic acid (85:15:2; v/v/v) as the mobile phase in a CAMAG Automatic Developing Chamber 2 (ADC 2) (CAMAG, Switzerland). After separation, the TLC plates were dipped into a solution of 3% cupric acetate in 8% phosphoric acid and incubated for 20 min at 120 °C. Quantitative analysis was performed with a CAMAG TLC Scanner 3 (Camag, Muttenz, Switzerland). The scanning was performed at a speed of 20 mm/s and a data resolution of 100 μm/step, with a slit dimension of 6.00 × 0.45 mm at a wavelength of 350 nm. Finally, the separated lipid classes were identified by comparing with external standards (TLC 18-4A, Nu-Chek Prep, Elysian, MN, USA; Ergosterol, PHR1512, Sigma-Aldrich, Solna, Sweden). VisionCATS Ultimate software was used for data analysis using Savitsky-Golay 7 mode. Manual baseline and peak correction were used if necessary.
2.4. Carotenoid Extraction
The extraction procedure was carried out in dark conditions to minimize carotenoid degradation. All the chemicals for extraction were obtained from Sigma-Aldrich (Europe). Freeze-dried cells (100 mg) were disrupted using a French press (Constant Systems Ltd., Daventry, UK) at 276 mPa after addition of 45 mL of ultrapure water to the freeze-dried cells. An acetone extraction method was applied to extract carotenoids from yeast as described by Reif et al. [35], with minor modifications. Briefly, 4.5 mL of French-pressed yeast biomass (10 mg dry weight) was transferred to a glass tube containing 2 mL of acetone. This mixture was vortexed for 10 s and centrifuged at 450× g for 10 min. The upper phase was collected into a Teflon tube, and the extraction procedure with acetone for the lower phase in the glass tube was repeated until the supernatant was clear. For the final acetone extraction step, cyclohexane was added to the collected upper acetone phase in the Teflon tube (v/v, 1:1), which was vortexed for 10 s and centrifuged at 1890× g for 5 min. The upper acetone phase from the Teflon tube was then transferred into a new glass tube. This final extraction with acetone and cyclohexane was repeated until the supernatant in the Teflon tube was clear. At the end of extraction, the acetone collected in the new glass tube was evaporated under nitrogen and the remaining carotenoid extract was subjected to saponification.
A saponification step was applied to remove lipids from the extracts, which may interfere with the UHPLC analysis. For this, 2 mL of ethanol (96%), 1.2 mL of butylated hydroxytoluene (BHT, 0.2 mg/mL in methanol), 0.6 mL of methanol, and 1.2 mL of methanolic potassium hydroxide (2 M KOH, in methanol) were added to the carotenoid extract. Saponification was performed at 56 °C for 20 min. After saponification, 3 mL of hexane was added at room temperature, and the sample was vortexed for 10 s and centrifuged at 700× g for 10 min. The upper phase was transferred to a new tube, and the remaining solvent was evaporated under nitrogen. Final extracts were diluted with methanol–acetone (1:1, v/v).
2.5. Total Carotenoid Quantification Using Spectrophotometry
Total carotenoid content in the yeast extracts was measured using the method described by Davey et al. [36]. A six-point β-carotene calibration curve was used to determine the total carotenoid content. For this, six standard solutions with different concentrations of β-carotene (0.25, 0.5, 0.75, 1.0, 1.5, and 2.0 µg/mL) were prepared using hexane as solvent. The absorbances of unsaponified and saponified standard samples of β-carotene were measured in a 1 cm cuvette at 450 nm using a Shimadzu UV-1800 spectrophotometer (Shimadzu, Kyoto, Japan) and calibrated against the blank containing only hexane. The total carotenoid content was expressed as mg of β-carotene equivalent (β-EQ)/100 g of dried yeast weight.
The molar extinction coefficient (εmax) for the β-carotene absorbance at 450 nm was calculated as follows:
where ‘A’ is the absorbance of β-carotene at maximum wavelength (λmax), ‘C’ is concentration of β-carotene, and ‘L’ is the width of the cuvette (1 cm) [37].
εmax = A/CL
2.6. Carotenoid Identification and Quantification Using UHPLC-PDA
The analysis was carried out using a Shimadzu UHPLC-Nexera instrument (Kyoto, Japan) equipped with an autosampler (SIL-20AC) and quaternary pumps (LC-20AD). The equipment included a column oven (CTO-20AC) and a PDA detector (Shimadzu, model SPD-M20A) connected in series. LabSolutions software was used to control the instruments, data acquisition, and processing. The UV−visible spectra were acquired between 250 and 600 nm, and the peaks of β-carotene and torularhodin were acquired at 450 nm, ɣ-carotene at 462 nm, and torulene at 478 nm, respectively.
2.6.1. Chromatographic Method Conditions
Carotenoid separation was performed using an analytical RP C18 Kinetex 100 Å column (100 mm length, 4.6 mm internal diameter, 2.6 µm particle size; Phenomenex) and binary gradient system with the mobile phases A, consisting of acetonitrile–methanol (7:3, v/v), and B, consisting of ultrapure water with 0.1% formic acid. The gradient was set as follows: 0–3 min 60% B; 3–7 min 100% B; 7–30 min 100% B, and 30–35 min 60% B. The flow rate was 0.3 mL/min, the column temperature was 40 °C, and the sample volume was 20 µL.
2.6.2. Instrument Performance
The performance of the chromatographic method was assessed with regard to its linearity, limit of detection (LOD), limit of quantification (LOQ), precision, recovery, and matrix effect. Four analytes were quantified using a twelve-point calibration curve. The analytical standards of β- and ɣ-carotenes used for the analysis were purchased from Sigma-Aldrich (Sweden), whereas torularhodin and torulene were purchased from CaroteNature (Münsingen, Switzerland). The concentration range used was 20–0.05 µg/mL for torularhodin, 140–0.1 µg/mL for torulene, 12.5–0.001 µg/mL for β-carotene, and 50–0.005 µg/mL for γ-carotene. Analytical standards were used for preparation of standard mixtures to determine the linear range of the tested carotenoid. For all carotenoids, the analyzed concentration range covered four orders of magnitude, from ng/mL to µg/mL, which corresponds to the carotenoid content in the samples.
All analyses were performed in triplicate. Precision was calculated as the relative standard deviation (RSD) of the replicates. For evaluation of the matrix effects on the signals of the target analytes, the response factors delivered from the calibration curve were compared to the matrix-matched standard response. Matrix-matched standard was prepared from the sample extract by spiking with the standards of the carotenoids at concentration levels of 2 µg/mL torularhodin, 36 µg/mL torulene, 1.7 µg/mL β-carotene, and 25.5 µg/mL γ-carotene. The relative recoveries of four carotenoids were obtained by preparation of fortified samples containing 1 µg/mL torularhodin, 0.2 µg/mL torulene, 5 µg/mL β-carotene, and 10 µg/mL γ-carotene. All the samples were extracted as per the procedure stated in Section 2.4.
Quality control samples were analyzed before and after each quantification run at three different concentrations along with procedural blanks to monitor the method and instrumental performance and to check for contamination of the equipment.
The LOD and LOQ were determined based on the residual standard deviation of calibration curve:
where ‘s’ is the residual standard deviation of the calibration line in the LOD region, and ‘b’ is the slope of the calibration curve [38].
LOD = 3.3 × (s/b)
LOQ = 10 × (s/b)
2.7. Effect of Saponification on Total Carotenoids
To analyze the effect of saponification on carotenoids, individual carotenoid standards were subjected to extraction procedures similar to that of sample extraction described earlier (see Section 2.4). To compare the saponification effect, all extractions were made in triplicate with and without including the saponification step. These samples were analyzed by UHPLC-PDA, using the same chromatographic conditions as described above (Section 2.6.1).
2.8. Statistical Analysis
The statistical analysis was performed using R (v. 1.2.5001, 2009–2019 RStudio, Inc., Boston, MA, USA) software package. The data are expressed as the mean ± standard deviation. Total carotenoid content was compared and evaluated using one-way analysis of variance (ANOVA), followed by the Tukey test for pairwise comparisons among experimental conditions. The results were considered statistically significant at p ≤ 0.05.
3. Results
3.1. Establishing Carotenoid Analysis Method
3.1.1. Characterization of Calibration Curves of the Two Carotenoid Analysis Methods
Linear regression characteristics of carotenoid standard curves, as measured by UHPLC and spectrophotometer methods, are presented in Table 1.

Table 1.
Characterization of carotenoid standard curves for UHPLC-PDA and spectrophotometric methods.
Determination of the carotenoid content using UHPLC-PDA: Carotenoids were eluted as governed by their retention factors and the hydrophobicity of the stationary phase [39]. Accordingly, torularhodin appeared first in the chromatogram, followed by torulene, γ-carotene, and β-carotene. An unknown peak was identified at a retention time of 28.89 min. We have currently no explanation as to which compound this peak could represent; this is a topic for future investigation. The coefficient of linearity (R2) of the calibration curve was found to be more than 0.99 for all identified carotenoids. The repeatability of the proposed method was performed at one concentration level with satisfactory relative standard deviation (RSD) for all carotenoids. RSD ranged from 2 to 15%. The developed method shows that LOD and LOQ for each respective carotenoid differed by two orders of magnitude; they were in the range of 0.26–14.5 ng/mL for LOD and 0.72–44.1 ng/mL for LOQ (Table 1).
Determination of the carotenoid content using spectrophotometric method: The determined absorbance of the β-carotene standard was linear between 0.25 and 2 mg/mL. With a calibration curve slope of 1.234, the molar extinction coefficient was 126,833 mM−1cm−1 at 450 nm, which is similar to the values determined by Biehler et al. [37].
3.1.2. Relative Recovery and Matrix Effect
The relative recovery in saponified samples was detected in procedural blanks. The blanks were prepared and extracted in the same way as the samples. The relative recovery rates were obtained for four carotenoid compounds (Table 2). The highest recovery rate was found for γ-carotene (76%), followed by β-carotene. Torularhodin was only recovered to 4%, whereas torulene was below the limit of quantification.
Table 2.
Evaluation of relative recovery and matrix effect in saponified samples as a percentage of compounds quantified based on response factors from calibration curves or matrix-matched standards (n = 3). Data are presented as mean ± standard deviation.
The change in the ionization efficiency of target analytes in the presence of coeluting compounds in the same matrix often leads to a matrix effect. This might lead to either loss in response (ion suppression) or an increase in response (ion enhancement), which would in turn affect the analytical performance of a method [40]. The results of the evaluation of these matrix effects in our yeast sample are summarized in Table 2. The lowest matrix effect was observed for γ-carotene (12%), followed by torularhodin (18%) and β-carotene (31%) from R. toruloides yeast extracts. The matrix effect could not be determined for torulene since its concentration was below the LOQ.
3.1.3. Saponification Effect
To evaluate the effect of saponification on carotenoids, we performed additional analyses with individual carotenoid standards. Torulene was excluded from analysis, as it was below the LOQ, which is most likely attributed to the saponification effect. As demonstrated in Figure 1, saponification reduced the concentrations of β-carotene and γ-carotene by 14% and 7%, respectively.
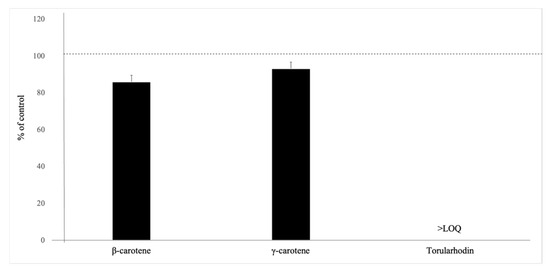
Figure 1.
Effect of saponification on the carotenoids tested by UHPLC-PDA, n = 3. Data presented as percent of control values (mean ± standard deviation). The dashed line represents the levels of carotenoids in unsaponified samples.
Torularhodin was below LOQ after saponification. The results of this study show that quantification of torularhodin and torulene are affected considerably by saponification and the yeast matrix. This effect of saponification on individual carotenoids produced by R. toruloides has not been studied before. A previous report on carotenoids in broccoli suggests that saponification with 30% methanolic KOH at room temperature for 3 h under nitrogen atmosphere reduces β-carotene and 15,15′-cis-β-carotene by 6% and 17–84%, respectively [41]. Additionally, Nierenberg and Nann [42] reported a significant reduction in the recoveries of five carotenoids (lutein, cryptoxanthin, lycopene, α-carotene, and β-carotene) in human tissues when saponified using 5% methanolic KOH. In addition, Kimura et al. [43] also observed that even with mild saponification using 10% KOH, lutein, zeaxanthin, and violaxanthin degraded significantly in tomato, kale, and papaya samples. Lietz and Henry [44] also reported significant losses of α-carotene (19%), β-carotene (28%), and α-tocopherol (18%), as well as isomerization of α-carotene and β-carotene in a standard mixture during HPLC analysis of red palm oil after the saponification of the extract. Our report demonstrates for the first time that saponification has a similar effect on yeast carotenoids.
3.1.4. Carotenoid Content in R. toruloides
Total carotenoid content in R. toruloides was quantified using two methods, spectrophotometry and UHPLC-PDA (Table 3). Only saponified samples were analyzed by UHPLC-PDA to avoid unwanted interference of the lipids with the analytical column, whereas saponified and unsaponified extracts were analyzed by the spectrophotometric method. The total carotenoid content in saponified extracts measured by the two methods did not differ significantly (p = 0.23), and similarly, there was no significant difference observed between the total carotenoid content in saponified and unsaponified extracts from spectrophotometer results (p = 0.11). The spectrophotometric method showed a much higher standard deviation than chromatography, and this could probably be due to the presence of several compounds in the sample mixture that affect total absorbance. The accuracy of the spectrophotometric method is poor in sample mixtures with different carotenoids because absorbance is measured only at 450 nm, which is equivalent to beta carotene absorbance [45]. A significant difference in total carotenoid content was observed only comparing saponified (UHPLC-PDA analysis) and unsaponified extracts (spectrophotometer analysis) (p = 0.05). Our results strongly indicate that this difference was mainly due to the saponification effect on torulene and torularhodin.
Table 3.
Quantification of individual carotenoids, averaged to total in saponified samples, as determined by UHPLC-PDA, and total carotenoids in both saponified and unsaponified samples, as determined spectrophotometrically. Data are presented as mean ± standard deviation (n = 3) and different superscript letters represent significant differences (p ≤ 0.05).
The total carotenoid content from R. toruloides CBS 14 was further characterized by detecting individual carotenoids by UHPLC-PDA. Overall, three out of four identified carotenoids were above the LOQ (Table 3). Levels of torulene were below the LOQ. Torulene and torularhodin compounds produced by R. toruloides were identified and quantified using their respective commercial reference standards, unlike some previous studies, where they were quantified using either β- or γ-carotene as the reference standards [20,46].
The most abundant carotenoid observed in R. toruloides CBS 14 was β-carotene (74%), followed by γ-carotene (21%) and torularhodin (4.5%). The total carotenoid concentration in the saponified yeast extract was 1.99 ± 0.27 mg/100 g dry weight. According to Perrier et al. [19], β-carotene (70%) was the main carotenoid produced by 13 different Rhodotorula strains, whereas only eight Rhodotorula strains were observed to produce torulene. The concentration of β-carotene varied within the yeast strains by 0.5–7.5 mg/100 g dry weight [19,47]. Nam et al. [47] reported 3.6 mg/100 g dry weight total carotenoids in Rhodotorula glutinis extract (excluding the concentration of torulene), which was similar to our results.
3.2. Kinetics of Carotenoid and Lipid Formation in Bioreactor Cultivation
3.2.1. Cell Growth, Cell Dry Weight, Sugar, and Lipid Content Analysis
The cell growth, biomass, sugar consumption, and lipid production of R. toruloides in the hydrolysate media were monitored at time intervals of 24 h. Cell growth was monitored by measuring the optical density (OD) and cell dry weight. There was a considerable increase in the cell dry weight between 24 and 72 h of the growth phase (Figure 2). All the sugars were consumed within 96 h of cultivation. Significant lipid accumulation was mainly observed at the two last measuring time points, 72 h and 96 h, and the onset of lipid accumulation was most probably correlated to the depletion of nitrogen from the culture medium [48]. Moreover, between these time points, it was observed that the lipid yield per g consumed sugar was 0.5. This is by far above the theoretical maximum, which is 0.31 for glucose [48] and 0.34 for xylose [49]. It has been observed in other oleaginous yeasts that they accumulate endopolysaccharides in earlier stages of the fermentation [50,51]. It is possible that this strain was also accumulating endopolysaccharides in the earlier stages of fermentation and that it partially converted these endopolysaccharides to lipids towards the end of the fermentation. However, this hypothesis needs further verification. At the end of the cultivation period, the final lipid content in the yeast cells from all three fermenters was 41 ± 1%. The lipid yield was 0.13 g/g of sugar consumed.
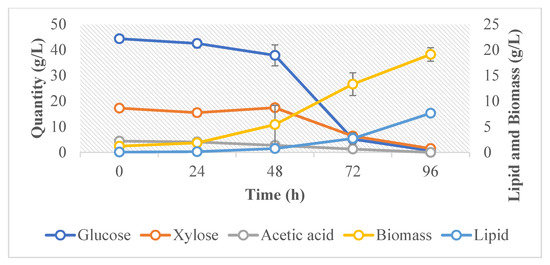
Figure 2.
Average cell dry weight, lipid concentration, and sugar content during the fermentation of R. toruloides.
3.2.2. Lipid Composition and Classes
During cultivation, considerable changes were observed in the fatty acid profile of the yeast (Table 4). Oleic acid (C18:1 (n-9)) was the major fatty acid. Initially, it comprised 55.8% of the total fatty acids, which decreased to 40.3% at the end of the cultivation. Palmitic acid (C16:0) comprised about 13–15% of total fatty acids until 48 h of cultivation, but its proportion increased to more than 20% during the last two measuring points. Linoleic acid (C18:2 (n-6)) was the second most abundant fatty acid at most of the measuring points, typically comprising more than 20% of the total fatty acids (apart from at t0). The cells also formed considerable amounts of alpha-linolenic acid (C18:3 (n-3)), more than 7% of the total fatty acids at t0 and after 24 h of cultivation. This proportion decreased in the further course of cultivation to 2.9% at 96 h. Formation of alpha-linolenic acid (C18:3 (n-3)) has previously been observed as a response to low cultivation temperatures in other yeasts [52]. The production of polyunsaturated fatty acids such as alpha-linolenic acid makes this lipid more suitable for production of food and feed additives [53]. In general, there was an increase in the percentage of saturated fatty acids and a decrease in unsaturated fatty acids during the course of cultivation. This should be due to the increasing amount of storage lipids (Figure 2). The proportion of saturated fatty acids in lipid bodies is usually higher than in the membrane systems in the cell [54,55].
Table 4.
Quantification of different fatty acids in the yeast sample at different time points during cultivation. Data are presented as mean % ± standard deviation of fatty acids in the samples from three fermenters.
Additionally, a detectable amount of heptadecenoic acid (C17:1) was identified in our yeast sample. This fatty acid has been rarely identified and reported in yeasts [56] but it was identified in Rhodotorula babjevae when cultivated on wheat straw hydrolysate [14].
Neutral lipids in the lipid bodies of oleaginous yeast are stored as monoacylglycerols (MAG), diacylglycerols (DAG), and triacylglycerols (TAG) [57]. In this study, during the cultivation period, as the carbon source was consumed, the percentage of TAG increased; indeed, TAG was observed to be the major lipid class by the end of cultivation, comprising 58% of all lipids (Table 5).
Table 5.
Lipid class quantification in the yeast sample at different time points during cultivation. Data are presented as mean % ± standard deviation of lipid classes in the samples from three fermenters.
Free fatty acids (FFAs) were very abundant during cultivation, comprising around 20–40% of the total lipid content. FFAs were the most abundant lipids during the first three measuring points, with TAG becoming more abundant at the last two sampling points. Still, even at these later measuring points, FFAs were the second most abundant lipid class (Table 5). In Saccharomyces cerevisiae, an extensive concentration of FFAs was toxic and resulted in mainly necrotic cell death [58]. However, our findings are in line with previous results, and we also found a substantial amount of FFAs in a variety of oleaginous yeast strains [2]. Obviously, oleaginous yeasts have a higher tolerance to FFAs, and R. toruloides has evolved mechanisms to handle the toxicity of FFAs. Towards the end of the cultivation, in a situation with enhanced lipid accumulation, production of TAG was obviously enhanced, resulting in a decrease in the proportion of FFAs. FFAs in yeasts are in equilibrium with acyl-CoA, which is used for TAG production [59], so it is possible that the pool of FFAs is used for the production of TAG. However, since the absolute proportion of FFAs relative to the total biomass was still increasing towards the end of fermentation, the cells were obviously still producing considerable amounts of FFAs. We have currently no explanation for the biological function of FFAs in R. toruloides.
In yeast cells, phospholipids and sterols are mainly found in the plasma membrane. Some sterols are also present in secretory vesicles and lipid particles [60]. In this study, the proportion of both phospholipids and sterols decreased over the cultivation period. The proportion of phospholipids decreased from 12% to about 8% at the end of the growth phase due to an increase in triacylglycerols, which is in line with the increase in total lipid content. Storage lipids are usually stored in lipid bodies, which mainly contain TAGs [55]. Thus, an increase in storage lipids would be reflected by an increase in the proportion of TAGs, which is in line with our results.
3.2.3. Carotenoid Kinetics and Quantification
Carotenoid content in the saponified extracts of R. toruloides analyzed at different time points during the cultivation is summarized in Table 6. β-carotene constituted the majority of total carotenoids produced throughout the growth phase, followed by γ-carotene. As described in Section 3.1.2 above, due to the effect of saponification, torulene was observed to be below the limit of quantification (LOQ) at all time points, and torularhodine could not be determined. The proportion of γ-carotene increased during cultivation, nearly reaching concentrations as high as that of β-carotene towards the end of cultivation. Similar observations have been made by Tkacova et al. [61]. The reason for the increase in γ-carotene is unclear. This carotenoid is formed from lycopene by the enzyme encoded by crtYB. However, it is converted to β-carotene by the same enzyme. The activity of this enzyme might in general be increased, which would explain the increase in both γ-and β-carotene concentrations, but not the relative increase in γ-carotene. However, γ-carotene can also be formed by dehydrogenation of β–zeacarotene, which might be enhanced as well [62].
Table 6.
Quantification of individual carotenoids in saponified samples at different growth time points. Data are presented as mean ± standard deviation of carotenoid content in the samples from three fermenters.
From this kinetic study, a correlation between the metabolism of lipids and the carotenoid pigments was also observed. With increased lipid accumulation, an increase in the total carotenoid content was observed during the growth period, as also reported in some studies [46,63] but somewhat contradictory to another study [61]. In this latter study, lipid and carotenoid formation of R. glutinis was investigated in glucose media with different C/N ratios, with the finding that there are differences in lipid and carotenoid production, depending on strain, type of carbon and nitrogen source, and other factors. In our study, when R. toruloides CBS 14 was grown on wheat straw hydrolysate, the yeast first consumed glucose and acetate and then assimilated xylose. Since both lipid content and carotenoid content increased during the last two sampling points, there was obviously no limitation of acetyl-CoA [64]. By the end of the cultivation period, the total carotenoid content in the saponified yeast extract was 2.85 ± 0.26 mg/100 g dry weight. Carotenoids act as antioxidants and protect the cell from oxidative stress, including lipid oxidation [63]. Thus, a synchronized increase in the cellular lipid and carotenoid contents is a logical consequence and is in keeping with our results.
4. Conclusions
In this study, we have shown that four carotenoids (torularhodin, torulene, β-carotene, and γ-carotene) are produced by R. toruloides, and β-carotene was identified as the major carotenoid. Torulene was below the limit of quantification when analyzed by the current method, due to matrix effects and saponification. Removal of the lipids coeluted with the carotenoid extracts is required before running the samples in the UHPLC system, as the presence of lipids will lead to inaccurate quantification of carotenoids, i.e., lower values, and it might destroy the analytical column as well. Therefore, when using standard methods for extraction of carotenoids, saponification cannot be avoided. In this study, we also confirmed a significant effect of saponification on the concentration of torulene and torularhodin. This impact of saponification makes it necessary to develop a lipid-free extraction method for better quantification of carotenoids from yeasts, without the need for saponification. We have shown that yeast growth is accompanied by proportional changes in amounts of lipid fractions and individual lipid classes, as well as in their fatty acid composition. There was a positive correlation between lipid accumulation and carotenoid formation, indicating that these metabolic pathways do not interfere with each other, although using the same precursor.
Author Contributions
Experimental work, methodology Y.N.N., V.B., L.O. and S.S.; result evaluation, Y.N.N., J.B., V.B., L.O., S.S., J.P. and V.P.; conceptualization, V.B., S.S., A.R., J.P. and V.P.; writing—original draft, Y.N.N. and V.B.; writing review and editing, S.S., J.P., J.B., M.S. and V.P.; supervision, S.S., J.P., J.B., M.S. and V.P.; funding acquisition, M.S., V.P. and A.R.; project administration, M.S. and V.P. All authors have read and agreed to the published version of the manuscript.
Funding
The study was financially supported by the Swedish Research Council for Environment, Agricultural Sciences and Spatial Planning (Formas) (Grant Number 2018-01877), Nordforsk-SAFE/Swedish Research council for Environment, Agricultural Sciences and Spatial Planning (Formas), (Grant Number 2020-02637) and partially supported by the Ministry of Education, Youth and Sports of the Czech Republic, South Bohemian Research Center of Aquaculture and Biodiversity of Hydrocenoses/CENAKVA/. L.O. gratefully acknowledges a Research and Training Grant from FEMS.
Institutional Review Board Statement
Not applicable.
Informed Consent Statement
Not applicable.
Data Availability Statement
The data supporting the results in this study are available on request from the corresponding author.
Conflicts of Interest
The authors declare that they have no known competing financial interests or personal relationships that could have appeared to influence the work reported in this paper.
References
- Ageitos, J.M.; Vallejo, J.A.; Veiga-Crespo, P.; Villa, T.G. Oily yeasts as oleaginous cell factories. Appl. Microbiol. Biotechnol. 2011, 90, 1219–1227. [Google Scholar] [CrossRef]
- Shapaval, V.; Brandenburg, J.; Blomqvist, J.; Tafintseva, V.; Passoth, V.; Sandgren, M.; Kohler, A. Biochemical profiling, prediction of total lipid content and fatty acid profile in oleaginous yeasts by FTIR spectroscopy. Biotechnol. Biofuels 2019, 12, 1–12. [Google Scholar] [CrossRef]
- Vicente, G.; Bautista, L.F.; Gutiérrez, F.J.; Rodríguez, R.A.; Martínez, V.; Rodríguez-Frómeta, R.A.; Ruiz-Vázquez, R.M.; Torres-Martínez, S.; Garre, V. Direct transformation of fungal biomass from submerged cultures into biodiesel. Energy Fuels 2010, 24, 3173–3178. [Google Scholar] [CrossRef]
- Abeln, F.; Chuck, C.J. The history, state of the art and future prospects for oleaginous yeast research. Microb. Cell Factories 2021, 20, 221. [Google Scholar] [CrossRef]
- Dai, C.-c.; Tao, J.; Xie, F.; Dai, Y.-j.; Zhao, M. Biodiesel generation from oleaginous yeast Rhodotorula glutinis with xylose assimilating capacity. Afr. J. Biotechnol. 2007, 6, 2130–2134. [Google Scholar]
- Blomqvist, J.; Pickova, J.; Tilami, S.K.; Sampels, S.; Mikkelsen, N.; Brandenburg, J.; Sandgren, M.; Passoth, V. Oleaginous yeast as a component in fish feed. Sci. Rep. 2018, 8, 15945. [Google Scholar] [CrossRef]
- Schulze, I.; Hansen, S.; Großhans, S.; Rudszuck, T.; Ochsenreither, K.; Syldatk, C.; Neumann, A. Characterization of newly isolated oleaginous yeasts-Cryptococcus podzolicus, Trichosporon porosum and Pichia segobiensis. AMB Express 2014, 4, 24. [Google Scholar] [CrossRef]
- Granger, L.-M.; Perlot, P.; Goma, G.; Pareilleux, A. Effect of various nutrient limitations on fatty acid production by Rhodotorula glutinis. Appl. Microbiol. Biotechnol. 1993, 38, 784–789. [Google Scholar] [CrossRef]
- Beopoulos, A.; Cescut, J.; Haddouche, R.; Uribelarrea, J.-L.; Molina-Jouve, C.; Nicaud, J.-M. Yarrowia lipolytica as a model for bio-oil production. Prog. Lipid Res. 2009, 48, 375–387. [Google Scholar] [CrossRef]
- Takaku, H.; Matsuzawa, T.; Yaoi, K.; Yamazaki, H. Lipid metabolism of the oleaginous yeast Lipomyces starkeyi. Appl. Microbiol. Biotechnol. 2020, 104, 6141–6148. [Google Scholar] [CrossRef]
- Kaczor, A.; Baranska, M. Carotenoids: Nutrition, Analysis and Technology; John Wiley & Sons: Hoboken, NJ, USA, 2016. [Google Scholar]
- Rapoport, A.; Guzhova, I.; Bernetti, L.; Buzzini, P.; Kieliszek, M.; Kot, A.M. Carotenoids and some other pigments from fungi and yeasts. Metabolites 2021, 11, 92. [Google Scholar] [CrossRef]
- Ungureanu, C.; Marchal, L.; Chirvase, A.A.; Foucault, A. Centrifugal partition extraction, a new method for direct metabolites recovery from culture broth: Case study of torularhodin recovery from Rhodotorula rubra. Bioresour. Technol. 2013, 132, 406–409. [Google Scholar] [CrossRef]
- Brandenburg, J.; Poppele, I.; Blomqvist, J.; Puke, M.; Pickova, J.; Sandgren, M.; Rapoport, A.; Vedernikovs, N.; Passoth, V. Bioethanol and lipid production from the enzymatic hydrolysate of wheat straw after furfural extraction. Appl. Microbiol. Biotechnol. 2018, 102, 6269–6277. [Google Scholar] [CrossRef]
- Passoth, V.; Sandgren, M. Biofuel production from straw hydrolysates: Current achievements and perspectives. Appl. Microbiol. Biotechnol. 2019, 103, 5105–5116. [Google Scholar] [CrossRef]
- Chmielarz, M.; Blomqvist, J.; Sampels, S.; Sandgren, M.; Passoth, V. Microbial lipid production from crude glycerol and hemicellulosic hydrolysate with oleaginous yeasts. Biotechnol. Biofuels 2021, 14, 65. [Google Scholar] [CrossRef]
- Frengova, G.I.; Beshkova, D.M. Carotenoids from Rhodotorula and Phaffia: Yeasts of biotechnological importance. J. Ind. Microbiol. Biotechnol. 2009, 36, 163. [Google Scholar] [CrossRef]
- Buzzini, P.; Innocenti, M.; Turchetti, B.; Libkind, D.; van Broock, M.; Mulinacci, N. Carotenoid profiles of yeasts belonging to the genera Rhodotorula, Rhodosporidium, Sporobolomyces, and Sporidiobolus. Can. J. Microbiol. 2007, 53, 1024–1031. [Google Scholar] [CrossRef]
- Perrier, V.; Dubreucq, E.; Galzy, P. Fatty acid and carotenoid composition of Rhodotorula strains. Arch. Microbiol. 1995, 164, 173–179. [Google Scholar] [CrossRef]
- Flieger, K.; Knabe, N.; Toepel, J. Development of an improved carotenoid extraction method to characterize the carotenoid composition under oxidative stress and cold temperature in the rock inhabiting fungus Knufia petricola A95. J. Fungi 2018, 4, 124. [Google Scholar] [CrossRef]
- Shi, Q.; Wang, H.; Du, C.; Zhang, W.; Qian, H. Tentative Identification of Torulene Cis/trans Geometrical Isomers Isolated from Sporidiobolus pararoseus by High-Performance Liquid Chromatography–Diode Array Detection–Mass Spectrometry and Preparation by Column Chromatography. Anal. Sci. 2013, 29, 997–1002. [Google Scholar] [CrossRef]
- Weber, R.W.; Anke, H.; Davoli, P. Simple method for the extraction and reversed-phase high-performance liquid chromatographic analysis of carotenoid pigments from red yeasts (Basidiomycota, Fungi). J. Chromatogr. A 2007, 1145, 118–122. [Google Scholar] [CrossRef]
- Freitas, C.; Nobre, B.; Gouveia, L.; Roseiro, J.; Reis, A.; da Silva, T.L. New at-line flow cytometric protocols for determining carotenoid content and cell viability during Rhodosporidium toruloides NCYC 921 batch growth. Process Biochem. 2014, 49, 554–562. [Google Scholar] [CrossRef]
- Schüler, L.M.; Gangadhar, K.N.; Duarte, P.; Placines, C.; Molina-Márquez, A.M.; Léon-Bañares, R.; Sousa, V.S.; Varela, J.; Barreira, L. Improvement of carotenoid extraction from a recently isolated, robust microalga, Tetraselmis sp. CTP4 (chlorophyta). Bioprocess Biosyst. Eng. 2020, 43, 785–796. [Google Scholar] [CrossRef]
- de Quirós, A.R.-B.; Costa, H.S. Analysis of carotenoids in vegetable and plasma samples: A review. J. Food Compos. Anal. 2006, 19, 97–111. [Google Scholar] [CrossRef]
- Granado, F.; Olmedilla, B.; Blanco, I.; Rojas-Hidalgo, E. Carotenoid composition in raw and cooked Spanish vegetables. J. Agric. Food Chem. 1992, 40, 2135–2140. [Google Scholar] [CrossRef]
- Kalra, R.; Conlan, X.A.; Goel, M. Fungi as a potential source of pigments: Harnessing filamentous fungi. Front. Chem. 2020, 8, 369. [Google Scholar] [CrossRef]
- Buzzini, P. An optimization study of carotenoid production by Rhodotorula glutinis DBVPG 3853 from substrates containing concentrated rectified grape must as the sole carbohydrate source. J. Ind. Microbiol. Biotechnol. 2000, 24, 41–45. [Google Scholar] [CrossRef]
- Ochsenreither, K.; Glück, C.; Stressler, T.; Fischer, L.; Syldatk, C. Production strategies and applications of microbial single cell oils. Front. Microbiol. 2016, 7, 1539. [Google Scholar] [CrossRef]
- Brandenburg, J.; Blomqvist, J.; Pickova, J.; Bonturi, N.; Sandgren, M.; Passoth, V. Lipid production from hemicellulose with Lipomyces starkeyi in a pH regulated fed-batch cultivation. Yeast 2016, 33, 451–462. [Google Scholar] [CrossRef]
- Enshaeieh, M.; Abdoli, A.; Madani, M.; Bayat, M. Recycling of lignocellulosic waste materials to produce high-value products: Single cell oil and xylitol. Int. J. Environ. Sci. Technol. 2015, 12, 837–846. [Google Scholar] [CrossRef][Green Version]
- Folch, J.; Lees, M.; Stanley, G.S. A simple method for the isolation and purification of total lipids from animal tissues. J. Biol. Chem. 1957, 226, 497–509. [Google Scholar] [CrossRef]
- Appelqvist, L.-Å. Rapid methods of lipid extraction and fatty acid methyl ester preparation for seed and leaf tissue with special remarks on preventing the accumulation of lipid contaminants. Ark. Kemi 1968, 28, 551–570. [Google Scholar]
- Olsen, R.; Henderson, R. The rapid analysis of neutral and polar marine lipids using double-development HPTLC and scanning densitometry. J. Exp. Mar. Biol. Ecol. 1989, 129, 189–197. [Google Scholar] [CrossRef]
- Reif, C.; Arrigoni, E.; Schärer, H.; Nyström, L.; Hurrell, R.F. Carotenoid database of commonly eaten Swiss vegetables and their estimated contribution to carotenoid intake. J. Food Compos. Anal. 2013, 29, 64–72. [Google Scholar] [CrossRef]
- Davey, M.W.; Keulemans, J.; Swennen, R. Methods for the efficient quantification of fruit provitamin A contents. J. Chromatogr. A 2006, 1136, 176–184. [Google Scholar] [CrossRef]
- Biehler, E.; Mayer, F.; Hoffmann, L.; Krause, E.; Bohn, T. Comparison of 3 spectrophotometric methods for carotenoid determination in frequently consumed fruits and vegetables. J. Food Sci. 2010, 75, C55–C61. [Google Scholar] [CrossRef]
- Vilaro, F.; Perez-Hedo, M.; Eras, J.; Canela, R.; Eizaguirre, M. UHPLC-MS Analysis of Juvenile Hormone II in Mediterranean Corn Borer (Sesamia nonagrioides) Hemolymph Using Various Ionization Techniques. J. Agric. Food Chem. 2012, 60, 3020–3025. [Google Scholar] [CrossRef]
- Ligor, M.; Kováčová, J.; Gadzała-Kopciuch, R.; Studzińska, S.; Bocian, S.; Lehotay, J.; Buszewski, B. Study of RP HPLC retention behaviours in analysis of carotenoids. Chromatographia 2014, 77, 1047–1057. [Google Scholar] [CrossRef]
- Gosetti, F.; Mazzucco, E.; Zampieri, D.; Gennaro, M.C. Signal suppression/enhancement in high-performance liquid chromatography tandem mass spectrometry. J. Chromatogr. A 2010, 1217, 3929–3937. [Google Scholar] [CrossRef]
- Khachik, F.; Beecher, G.R.; Whittaker, N.F. Separation, identification, and quantification of the major carotenoid and chlorophyll constituents in extracts of several green vegetables by liquid chromatography. J. Agric. Food Chem. 1986, 34, 603–616. [Google Scholar] [CrossRef]
- Nierenberg, D.W.; Nann, S.L. A method for determining concentrations of retinol, tocopherol, and five carotenoids in human plasma and tissue samples. Am. J. Clin. Nutr. 1992, 56, 417–426. [Google Scholar] [CrossRef]
- Kimura, M.; Rodriguez-Amaya, D.B.; Godoy, H.T. Assessment of the saponification step in the quantitative determination of carotenoids and provitamins A. Food Chem. 1990, 35, 187–195. [Google Scholar] [CrossRef]
- Lietz, G.; Henry, C. A modified method to minimise losses of carotenoids and tocopherols during HPLC analysis of red palm oil. Food Chem. 1997, 60, 109–117. [Google Scholar] [CrossRef]
- Barba, A.O.; Hurtado, M.C.; Mata, M.S.; Ruiz, V.F.; De Tejada, M.L.S. Application of a UV–vis detection-HPLC method for a rapid determination of lycopene and β-carotene in vegetables. Food Chem. 2006, 95, 328–336. [Google Scholar] [CrossRef]
- Pham, K.D.; Shida, Y.; Miyata, A.; Takamizawa, T.; Suzuki, Y.; Ara, S.; Yamazaki, H.; Masaki, K.; Mori, K.; Aburatani, S. Effect of light on carotenoid and lipid production in the oleaginous yeast Rhodosporidium toruloides. Biosci. Biotechnol. Biochem. 2020, 84, 1501–1512. [Google Scholar] [CrossRef]
- Nam, H.; Cho, S.; Rhee, J.S. High-performance liquid chromatographic analysis of major carotenoids from Rhodotorula glutinis. J. Chromatogr. A 1988, 448, 445–447. [Google Scholar] [CrossRef]
- Ratledge, C.; Wynn, J.P. The biochemistry and molecular biology of lipid accumulation in oleaginous microorganisms. In Advances in Applied Microbiology; Academic Press: Cambridge, MA, USA, 2002; Volume 51, pp. 1–52. [Google Scholar]
- Zhou, W.; Wang, Y.; Zhang, J.; Zhao, M.; Tang, M.; Zhou, W.; Gong, Z. A metabolic model of Lipomyces starkeyi for predicting lipogenesis potential from diverse low-cost substrates. Biotechnol. Biofuels 2021, 14, 148. [Google Scholar] [CrossRef]
- Cescut, J.; Fillaudeau, L.; Molina-Jouve, C.; Uribelarrea, J.-L. Carbon accumulation in Rhodotorula glutinis induced by nitrogen limitation. Biotechnol. Biofuels 2014, 7, 164. [Google Scholar] [CrossRef]
- Maina, S.; Pateraki, C.; Kopsahelis, N.; Paramithiotis, S.; Drosinos, E.H.; Papanikolaou, S.; Koutinas, A. Microbial oil production from various carbon sources by newly isolated oleaginous yeasts. Eng. Life Sci. 2017, 17, 333–344. [Google Scholar] [CrossRef]
- Suutari, M.; Rintamäki, A.; Laakso, S. The effect of temperature on lipid classes and their fatty acid profiles in Lipomyces starkeyi. J. Am. Oil Chem. Soc. 1996, 73, 1071–1073. [Google Scholar] [CrossRef]
- Das, U.N. Essential fatty acids: Biochemistry, physiology and pathology. Biotechnol. J. Healthc. Nutr. Technol. 2006, 1, 420–439. [Google Scholar] [CrossRef] [PubMed]
- Wood, J.; Enser, M.; Fisher, A.; Nute, G.; Sheard, P.; Richardson, R.; Hughes, S.; Whittington, F. Fat deposition, fatty acid composition and meat quality: A review. Meat Sci. 2008, 78, 343–358. [Google Scholar] [CrossRef] [PubMed]
- Sandager, L.; Gustavsson, M.H.; Ståhl, U.; Dahlqvist, A.; Wiberg, E.; Banas, A.; Lenman, M.; Ronne, H.; Stymne, S. Storage lipid synthesis is non-essential in yeast. J. Biol. Chem. 2002, 277, 6478–6482. [Google Scholar] [CrossRef] [PubMed]
- Tronchoni, J.; Rozès, N.; Querol, A.; Guillamón, J.M. Lipid composition of wine strains of Saccharomyces kudriavzevii and Saccharomyces cerevisiae grown at low temperature. Int. J. Food Microbiol. 2012, 155, 191–198. [Google Scholar] [CrossRef]
- Patel, A.; Arora, N.; Mehtani, J.; Pruthi, V.; Pruthi, P.A. Assessment of fuel properties on the basis of fatty acid profiles of oleaginous yeast for potential biodiesel production. Renew. Sustain. Energy Rev. 2017, 77, 604–616. [Google Scholar] [CrossRef]
- Eisenberg, T.; Büttner, S. Lipids and cell death in yeast. FEMS Yeast Res. 2014, 14, 179–197. [Google Scholar] [CrossRef]
- Tehlivets, O.; Scheuringer, K.; Kohlwein, S.D. Fatty acid synthesis and elongation in yeast. Biochim. Biophys. Acta (BBA)-Mol. Cell Biol. Lipids 2007, 1771, 255–270. [Google Scholar] [CrossRef]
- Zinser, E.; Paltauf, F.; Daum, G. Sterol composition of yeast organelle membranes and subcellular distribution of enzymes involved in sterol metabolism. J. Bacteriol. 1993, 175, 2853–2858. [Google Scholar] [CrossRef]
- Tkacova, J.; Caplova, J.; Klempova, T.; Certik, M. Correlation between lipid and carotenoid synthesis in torularhodin-producing Rhodotorula glutinis. Ann. Microbiol. 2017, 67, 541–551. [Google Scholar] [CrossRef]
- Kot, A.M.; Błażejak, S.; Gientka, I.; Kieliszek, M.; Bryś, J. Torulene and torularhodin: “New” fungal carotenoids for industry? Microb. Cell Factories 2018, 17, 49. [Google Scholar] [CrossRef]
- Kot, A.M.; Błażejak, S.; Kieliszek, M.; Gientka, I.; Bryś, J. Simultaneous production of lipids and carotenoids by the red yeast Rhodotorula from waste glycerol fraction and potato wastewater. Appl. Biochem. Biotechnol. 2019, 189, 589–607. [Google Scholar] [CrossRef] [PubMed]
- Aksu, Z.; Eren, A.T. Carotenoids production by the yeast Rhodotorula mucilaginosa: Use of agricultural wastes as a carbon source. Process Biochem. 2005, 40, 2985–2991. [Google Scholar] [CrossRef]


Publisher’s Note: MDPI stays neutral with regard to jurisdictional claims in published maps and institutional affiliations. |
© 2022 by the authors. Licensee MDPI, Basel, Switzerland. This article is an open access article distributed under the terms and conditions of the Creative Commons Attribution (CC BY) license (https://creativecommons.org/licenses/by/4.0/).