Article

Antidiabetic and Hypolipidemic Efficiency of Lactobacillus plantarum Fermented Oat (Avena sativa) Extract in Streptozotocin-Induced Diabetes in Rats

1
Department of Food Science and Human Nutrition, College of Agriculture and Veterinary Medicine, Qassim University, Buraydah 51452, Saudi Arabia
2
Department of Food Technology, Faculty of Agriculture, Benha University, Moshtohor 13736, Egypt
*
Author to whom correspondence should be addressed.
Fermentation 2022, 8(6), 267; https://doi.org/10.3390/fermentation8060267
Submission received: 5 May 2022 / Revised: 3 June 2022 / Accepted: 3 June 2022 / Published: 6 June 2022

Abstract

:
Antidiabetic properties of fermented foods have been previously demonstrated. This study aimed to examine the antidiabetic and hypolipidemic potential activities of L. plantarum fermented oat extract in Streptozotocin-induced diabetic rats. Firstly, inoculating 1% of L. plantarum starter culture in 10% whole oat flour in aqueous media resulted in 8.36 log CFU mL−1 and pH 4.60 after 72 h of fermentation at 37 °C. With time progression of oat fermentation, total phenolic content (TPC), antioxidant activity (AOA), and γ-aminobutyric acid (GABA) contents were significantly increased up to 72 h. On the contrary, a significant reduction in β-glucan content was observed only after 72 h of fermentation. Secondly, separated aqueous extracts, i.e., unfermented oat extract (UFOE) and L. plantarum fermented oat extract (LFOE) were examined in vivo in a rat model, which consisted of five groups. Group 1 (negative group, NR); GROUP 2 (positive group, STZ), intraperitoneally injected with a single dose of 45 mg kg−1 BW of Streptozotocin and administered 7 mL of distilled water orally per day; Group 3 (STZ+MET), diabetic rats orally administered 50 mg of metformin kg−1 BW daily; Group 4 (STZ+UFOE), diabetic rats orally administered 7 mL of UFOE daily; and Group 5 (STZ+UFOE), diabetic rats orally administered 7 mL of LFOE daily for 6 weeks. Monitoring random blood glucose (RBG) and fasting blood glucose (FBG) showed that both the UFOE and the LFOE alleviated hyperglycemia in the STZ-induced diabetic rats. The extracts were significantly efficient in improving serum lipid profiles as compared with the positive group. Moreover, liver and kidneys’ functions were improved, and both extracts promoted hepatoprotective and nephroprotective characteristics. Furthermore, the administration of the UFOE and the LFOE efficiently attenuated GSH, CAT, and SOD enzymes and decreased MDA levels as compared with the positive group. In conclusion, data indicate the potential of UFOE and LFOE in future strategies as functional supplements against diabetes and diabetes-related complications.

1. Introduction

Regardless of the late global pandemic, i.e., the COVID-19, diabetes has caused 6.7 million deaths in 2021. Future estimations predict that, in 2045, about 783 million adults will have diabetes, representing about 12% of the world’s adult population. Due to diabetes, about 966 billion USD was spent worldwide in 2021 [1]. Diabetes is a life-threatening disease, and a significant cause of several serious health conditions such as blindness, kidney failure, and cardiovascular disease [2]. Yet, no satisfactory cure has been found. The only approach is by maintaining blood glucose levels at normal concentrations as possible [3], obtained via expensive medications, which represent some difficulties in avoiding their side effects [4]. Nonetheless, lifestyle changes have been reported as the first-line management for type 2 diabetes, including a healthy diet, regular physical activity, and maintaining a normal body weight [5].
Common oats (Avena sativa) have been documented as the healthiest among other cereals due to their nutritious value and the therapeutic effects against multiple disorders such as dyslipidemia, hypertension, inflammatory state, vascular injury, and diabetes [6,7]. The impact of oats on diabetes is attributed to the properties of maintaining the homeostasis of glucose and insulin levels and the cholesterol-lowering property. Oats’ soluble dietary fiber, especially the β-glucan, has been well documented as the primary bioactive fraction that exerts these effects [6,7,8]. In addition to β-glucan, oat contains unique polyphenol compounds known as avenanthramides, which exercise a strong antioxidant capacity of 10–30 times higher than that in other typical cereals’ antioxidants such as ferulic acid and vanillic acid [9,10].
Furthermore, oat fermentations have shown a significant increase in antioxidant activity due to changes in the oats’ nutritional profile during fermentation [11,12]. The microbial activity involved in the fermentation process modifies the ratio of various nutritive and antinutritive components, affecting the product’s organoleptic properties and enhancing the bioaccessibility and bioavailability of nutrients [13,14,15]. The hydrolysis of carbohydrate fractions into different end-products such as acids is the main activity produced during fermentation. The γ-aminobutyric acid (GABA) is an example of the most substantial acids synthesized by different kinds of microbes [16]. GABA is a non-protein amino acid known as a neurotransmitter in mammals’ brains [17]. It has been reported to promote antidiabetic activities, mainly by stimulating pancreatic cells’ insulin secretion [18]. A varied range of fermented foods have been shown to have antidiabetic effects both in vitro and in vivo [19], using a wide range of different microorganisms as starter cultures. However, the raw food substrate used in the fermentation, the selected microbes, and the fermentation time significantly affect the final product with its associated health benefits [11,14,15,20]. Zhang et al. [15] reported that fermentation of barley with Lactobacillus had more significant effects on the prevention of obesity than fermented with Saccharomyces. The Lactobacillus species such as L. fermentum, L. acidophilus, and L. plantarum are widely used as probiotics in the food industry [21]. They have been reported to promote positive health activities such as immunomodulation, anti-pathogenic, and cholesterol-lowering activities [22].
Moreover, a recent in vitro investigation [23] reported that L. plantarum promoted antidiabetic effects. A similar strain was used in vivo to investigate the antidiabetic effects [24]. The results showed a reduction in blood glucose levels. The authors indicated that the use of L. plantarum was a potential therapeutic agent for the management of diabetes. Nonetheless, the use of L. plantarum for producing functional oat-based fermented products has not been sufficiently investigated. Therefore, the current study aimed to examine the potential antidiabetic effects of oat extract fermented with the L. plantarum strain using Streptozotocin-induced diabetic rat models, looking toward producing oat-based fermented products that are acceptable for diabetic individuals.

2. Materials and Methods

2.1. Ingredients, Chemicals, and Strain

Whole oat grains were purchased from the local store of Buraydah, Saudi Arabia (manufactured by Federal Oats Mills, 13400, Butterworth, Malaysia). The oats’ nutritional value per 100 g consists of: 370 kcal, 12.1 g protein, 8.4 g fat, 56.1 g carbohydrates, 1.0 g sugar, 10.8 g dietary fiber, 4.0 mg iron, 110.0 mg magnesium, 3.0 mg zinc, 52.0 µg folic acid, 1.0 mg, 0.4 mg, and 0.4 µg of vitamin A, B1, and B12, respectively.
Lactobacillus plantarum (NRRL B-59151) was generously provided by the USDA Agricultural Research Service (ARS) Culture Collection (Peoria, IL, USA), and MRS broth was purchased from Condalab (Madrid, Spain). A mixed-linkage β-glucan kit was purchased from Megazyme International (Bray, Ireland); γ-aminobutyric acid (GABA) analytical standard was purchased from Sigma-Aldrich (Saint Louis, MO, USA). Streptozotocin, >97+% purity, was purchased from Alfa Aesar, Thermo Fisher Scientific (Kandel, Germany), and Metformin in pure form was purchased from Sigma-Aldrich.

2.2. Preparation of Fermented Oat Extract

The fermentation process was prepared following Zhang et al. [15] with slight modifications. To obtain sterilized oat flour, the whole oat grains were ground with a high-speed mill and autoclaved at 121 °C for 15 min. To obtain a primary activation of the starter culture, the L. plantarum B-59151 strain was cultured in MRS broth for 12 h at 37 °C. The bacteria were transferred to a fresh MRS medium and cultured under the same conditions to obtain a second activation; this step was repeated as a third activation to obtain the starter culture with a bacterial count of (1 × 10⁹ CFU mL−1). Then, the oat mixture was prepared by mixing oat flour with distilled water aseptically to yield a 10% oat (w/v), shacked well, and heated in a water bath with regular shaking at 80 °C for 10 min. After cooling down to room temperature, the starter culture was inoculated to the mixture at 1% (v/v). This mixture was then fermented in screw cap bottles in a microbiological incubator at 37 °C for 24, 48, and 72 h. A control sample (0 h fermentation) was prepared following the same method without inoculating with the starter culture and left for 1 h in shaking tables at room temperature. Further, to obtain the L. plantarum fermented oat extract (LFOE), samples were centrifuged at 12,000× g for 15 min at 4 °C in a refrigerator centrifuge. The supernatant was collected and stored at 4–8 °C for 7 days. This extract was used to administrate rats by the oral gavage, and a fresh-made extract was prepared each week for the rats’ oral admiration.

2.3. Estimation of Viable L. plantarum B-59151

The viable count of L. plantarum in the prepared fermented oat mixture was estimated following the standard plate count method according to Vinderola and Reinheimer [25]. Briefly, 10-fold serial dilutions of the fermented mixture were prepared in sterile peptone water. Aliquots of 1 mL of appropriate dilutions were inoculated in sterile plates, and then, a duplicate of MRS agar was added using the pour plate method. MRS agar inoculated plates were incubated at 37 °C for 48–72 h in anaerobic jars (5 L) with GasPak (GasPak System-Oxoid, Basingstoke, Hampshire, England), according to standard methods [25]. Data were expressed as logarithm colony forming units per mL (log10 CFU mL−1).

2.4. Determination of Total Phenolic Content (TPC)

The TPC values of the prepared extracts were determined using Folin–Ciocalteu reagent, according to Yawadio Nsimba et al. [26]. Briefly, in Eppendorf tubes, 150 µL of the sample was mixed with 300 µL of Folin–Ciocalteu reagent for 5 min. Then, 300 µL of an alkali solution (7.5% sodium carbonate solution, Na2CO3) was added. The mixture was incubated in the dark for 60 min at 23 °C, then centrifuged at 10,000× g for 10 min at 4 °C, and 120 µL of supernatant from each Eppendorf was transferred to a new plate; the absorbance was then measured at 765 nm using a microplate reader (BioTek, Winooski, VT, USA). Measurements were compared to the standard curve of gallic acid (GA) solution (R2 = 0.99), and TPC content was expressed as milligrams of gallic acid equivalents (GAE) per 100 g (mg of GAE g−1 DW).

2.5. Determination of Total Antioxidant Capacity (TAC) by the DPPH and ABTS Methods

The TAC values of the prepared extracts were measured spectrophotometrically based on the bleaching of DPPH radicals in purple solution, according to Yawadio Nsimba et al. [26]. Briefly, 600 µL of DPPH solution was added to 120 µL of the sample in Eppendorf tubes. After incubating in the dark for 60 min at 23 °C, tubes were centrifuged at 10,000× g for 10 min at 4 °C, and 120 µL of supernatant from each Eppendorf was transferred to a new plate. Then, the absorbance was measured at 517 nm using a microplate reader (BioTek, Winooski, VT, USA). The DPPH radical scavenging activity percentage was used to plot the trolox calibration curve. The antiradical activity was expressed as micromoles of trolox Equivalents (TE) per gram (µmol TE g−1). The samples’ radical scavenging activity against ABTS radicals was tested using the adapted method of Lu et al. [27].

2.6. Determination of the β-Glucan Content

The total β-glucan content in the prepared oat mixture was determined using an enzymatic mixed-linkage assay kit (Megazyme International, Wicklow, Ireland). All measurements were performed twice and in duplicate according to manufacturer protocol, following method C. Briefly, samples were washed twice with ethanol to remove free sugars and fats, then incubated with lichenase at 50 °C for 1 h, followed by hydrolyzing with β-glucosidase at 50 °C for 10 min. Samples were further incubated with glucose determination reagent (GOPOD reagent) at 50 °C for 20 min. Then, the absorbance of the generated color was measured at 510 nm, and the results were expressed as (g 100 g−1) of dry weight (DW).

2.7. Determination of the GABA Content

The content of the γ-aminobutyric acid (GABA) was evaluated spectrophotometrically, according to Yuwa-amornpitaK et al. [28]. Briefly, 0.5 mL of the LFOE was mixed with 0.5 mL of borate buffer, 0.5 mL of 6% phenol reagent, and 1.5 mL of 6% sodium hypochlorite (NaCIO). Then, the mixture was boiled at 100 °C for 10 min and immediately cooled down in a cooling bath. The absorbance was then measured at 630 nm. GABA standard was used to prepare a standard curve, and the results were expressed as (mg 100 g−1).

2.8. Animals and Experimental Design

Forty male albino Wistar rats weighing 150–200 g were used in the study. The experiment was performed under the approval of the Committee of Research Ethics (Institutional Review Board, IRB) of Qassim University, Saudi Arabia (approval no. 21-05-06). The animals were housed at the Department of Food Science and Human Nutrition, College of Agriculture and Veterinary Medicine, Qassim University, Saudi Arabia, in air-conditioned polypropylene cages and kept under standard laboratory conditions (24 ± 1 °C, 40–60% of humidity, 12 h light/dark cycle) supplied with a basal diet (standard rodent chow) and water ad libitum. The standard diet (laboratory animals feed pellets) compised 20% crude protein, 4% crude fat, 3.5% crude fiber, 6% ash, 0.5% salt, 1% calcium, 0.6% phosphorus, 20 IU g−1 vitamin A, 2.2 IU g−1 vitamin D, 70 IU kg−1 vitamin E, and 2850 ME Kcal kg−1 energy, with added trace minerals (cobalt, copper, iodine, iron, manganese, selenium, and zinc).
After one week of acclimation, the rats were randomly divided into two groups; the first group (n = 8) was the negative control group. The second group (n = 32) was the Streptozotocin (STZ)-induced diabetic rats. The induction of diabetes was performed according to the Shiju et al. [29] method. Briefly, a dose of 45 mg kg−1 BW of STZ was dissolved in a 0.1 M citrate buffer (pH = 4.5) and immediately injected intraperitoneally into the fasted rats. After the injection, the rats were supplemented for 24 h with glucose solution (5%) in drinking water to suppress hypoglycemia. Three days after STZ injection, blood glucose levels were measured using a glucometer (Accu-Chek, Roche, Germany), and ≥250–300 mg dl−1 of blood glucose levels were considered to be diabetic and included in the study. After the confirmation of diabetes, the diabetic rats were divided into five groups (n = 8) each (Table 1). The unfermented oat extract (UFOE) and the LFOE were orally administered to two diabetic groups at a dose of 7 mL, chosen based on 1 g of cereals’ dry weight per kg of rats BW [15]. The final aqueous extract volume was calculated after estimating total solids % and assembled for an average of 200–250 g of rats BW. Metformin was given to a comparative control group at a dose of 50 mg kg−1 BW, which was calculated using the presented equation according to Reagan-Shaw et al. [30] based on 500 mg−1 daily as a human dose.
At the end of the experiment, animals were fasted for 12 h with free access to water and anesthetized with a mixture of alcohol/chloroform/ether (1:2:3). The cardiac puncture was applied to collect blood samples. Immediately after the collection, the blood was submitted to centrifugation (4000 rpm at 10 °C) for 30 min, and the serum obtained was preserved at −18 °C until used to determine various biochemical parameters. The biochemical parameters were determined using suitable kits (Human Diagnostics Worldwide, Germany) and an absorbance reader (BioTek, Winooski, VT, USA).

2.8.1. Determination of Fasting Blood Glucose Level (FBG), Lipid Profile, Liver and Kidneys’ Functions

Serum samples were used to determine FBG according to the GOD-PAP method, using an enzymatic colorimetric test kit. Lipid profile parameters, including triglycerides (TG) and total cholesterol (CHO) were determined according to the GPO-PAP method using an enzymatic colorimetric test kit. High-density lipoproteins (HDL) were determined using an enzymatic colorimetric direct homogenous test kit following company protocols. Low-density lipoproteins (LDL) and very-low-density lipoproteins (VLDL) were mathematically calculated according to Friedewald et al. [31]; according to Nwagha et al. [32], the atherogenic index (AI) was calculated. Levels of glucose and serum lipids were expressed as mg dL−1. Liver functions such as alanine aminotransferase (ALT), aspartate aminotransferase (AST), alkaline phosphatase (ALP), and total bilirubin (T. Bili) were determined in serum samples using an alanine aminotransferase kit (EC 2.6.1.2), an aspartate aminotransferase kit (EC 2.6.1.1), an optimum alkaline kit (EC 3.1.3.1), and a photometric test kits for total bilirubin, respectively, and the concentrations were expressed as UL−1 for ALT, AST, and ALP, and as mg dL−1 for T. Bili. Kidneys’ functions such as total protein (T. protein), albumin, creatinine, and urea concentrations were determined according to the manufacturer’s instructions using photometric, colorimetric test kits applying Biuret method; photometric, colorimetric test kits applying BCG method; photometric, colorimetric test kits, fully enzymatic test kit applying GLDH method, respectively. Globulin was calculated by subtracting albumin from T. protein concentrations. Lastly, blood urea nitrogen (BUN) was calculated by multiplying urea concentration by 0.47. All biochemical examination kits were purchased from the Human Co., Wiesbaden, Germany. Concentrations of serum proteins were expressed as g dL−1; concentrations for creatinine, urea, and BUN were expressed as mg dL−1.

2.8.2. Determination of Oxidative Stress Biomarkers

Reduced glutathione (GSH) was estimated using a GSH colorimetric assay kit (E-BC-K030-S, Elabscience, Houston, TX, USA), according to the method described by Beutler et al. [33], and the results were expressed as µg dL−1. Lipid peroxidation was estimated using a malondialdehyde (MDA) colorimetric assay kit (E-BC-K025-S, Elabscience, Houston, TX, USA) by measuring TBARS, and expressed in terms of MDA content according to Ohkawa et al. [34]. MDA, an end product of fatty acid peroxidation, forms a colored complex reacting with thiobarbituric acid (TBA). The absorbance of the supernatant was measured at 532 nm, and the results were calculated as nmol mL−1. Superoxide dismutase (SOD) activity using a SOD-type activity assay kit (E-BC-K022-S, Elabscience, Houston, TX, USA) was determined according to Giannopolitis and Ries [35]. The color reaction was measured at 550 nm, expressed as U L−1. Catalase (CAT) activity was determined using a CAT activity assay kit (E-BC-K031-S, Elabscience, Houston, TX, USA) according to the method of Aebi [36], and expressed as U L−1. all Oxidative stress markers were determined using suitable kits and a blood chemistry analyzer (HumaLyzer 4000, Human Gesellschaft für Biochemica und Diagnostica mbH, Wiesbaden, Germany).

2.9. Statistical Analysis

The statistical analysis was carried out by applying one-way ANOVA for phytochemicals and antioxidant capacity, γ-aminobutyric acid content, β-glucan content, lipid profile parameters, liver and kidney functions, and antioxidant biomarkers data and two-way ANOVA for RBG data using SPSS (Ver. 22.0 for Windows). The experimental results were expressed as mean ± standard error. Applying Tukey’s test, multiple comparisons were carried out, and the significance level was set at <0.05. Data were treated as a complete randomization design according to Steel et al. [37].

3. Results

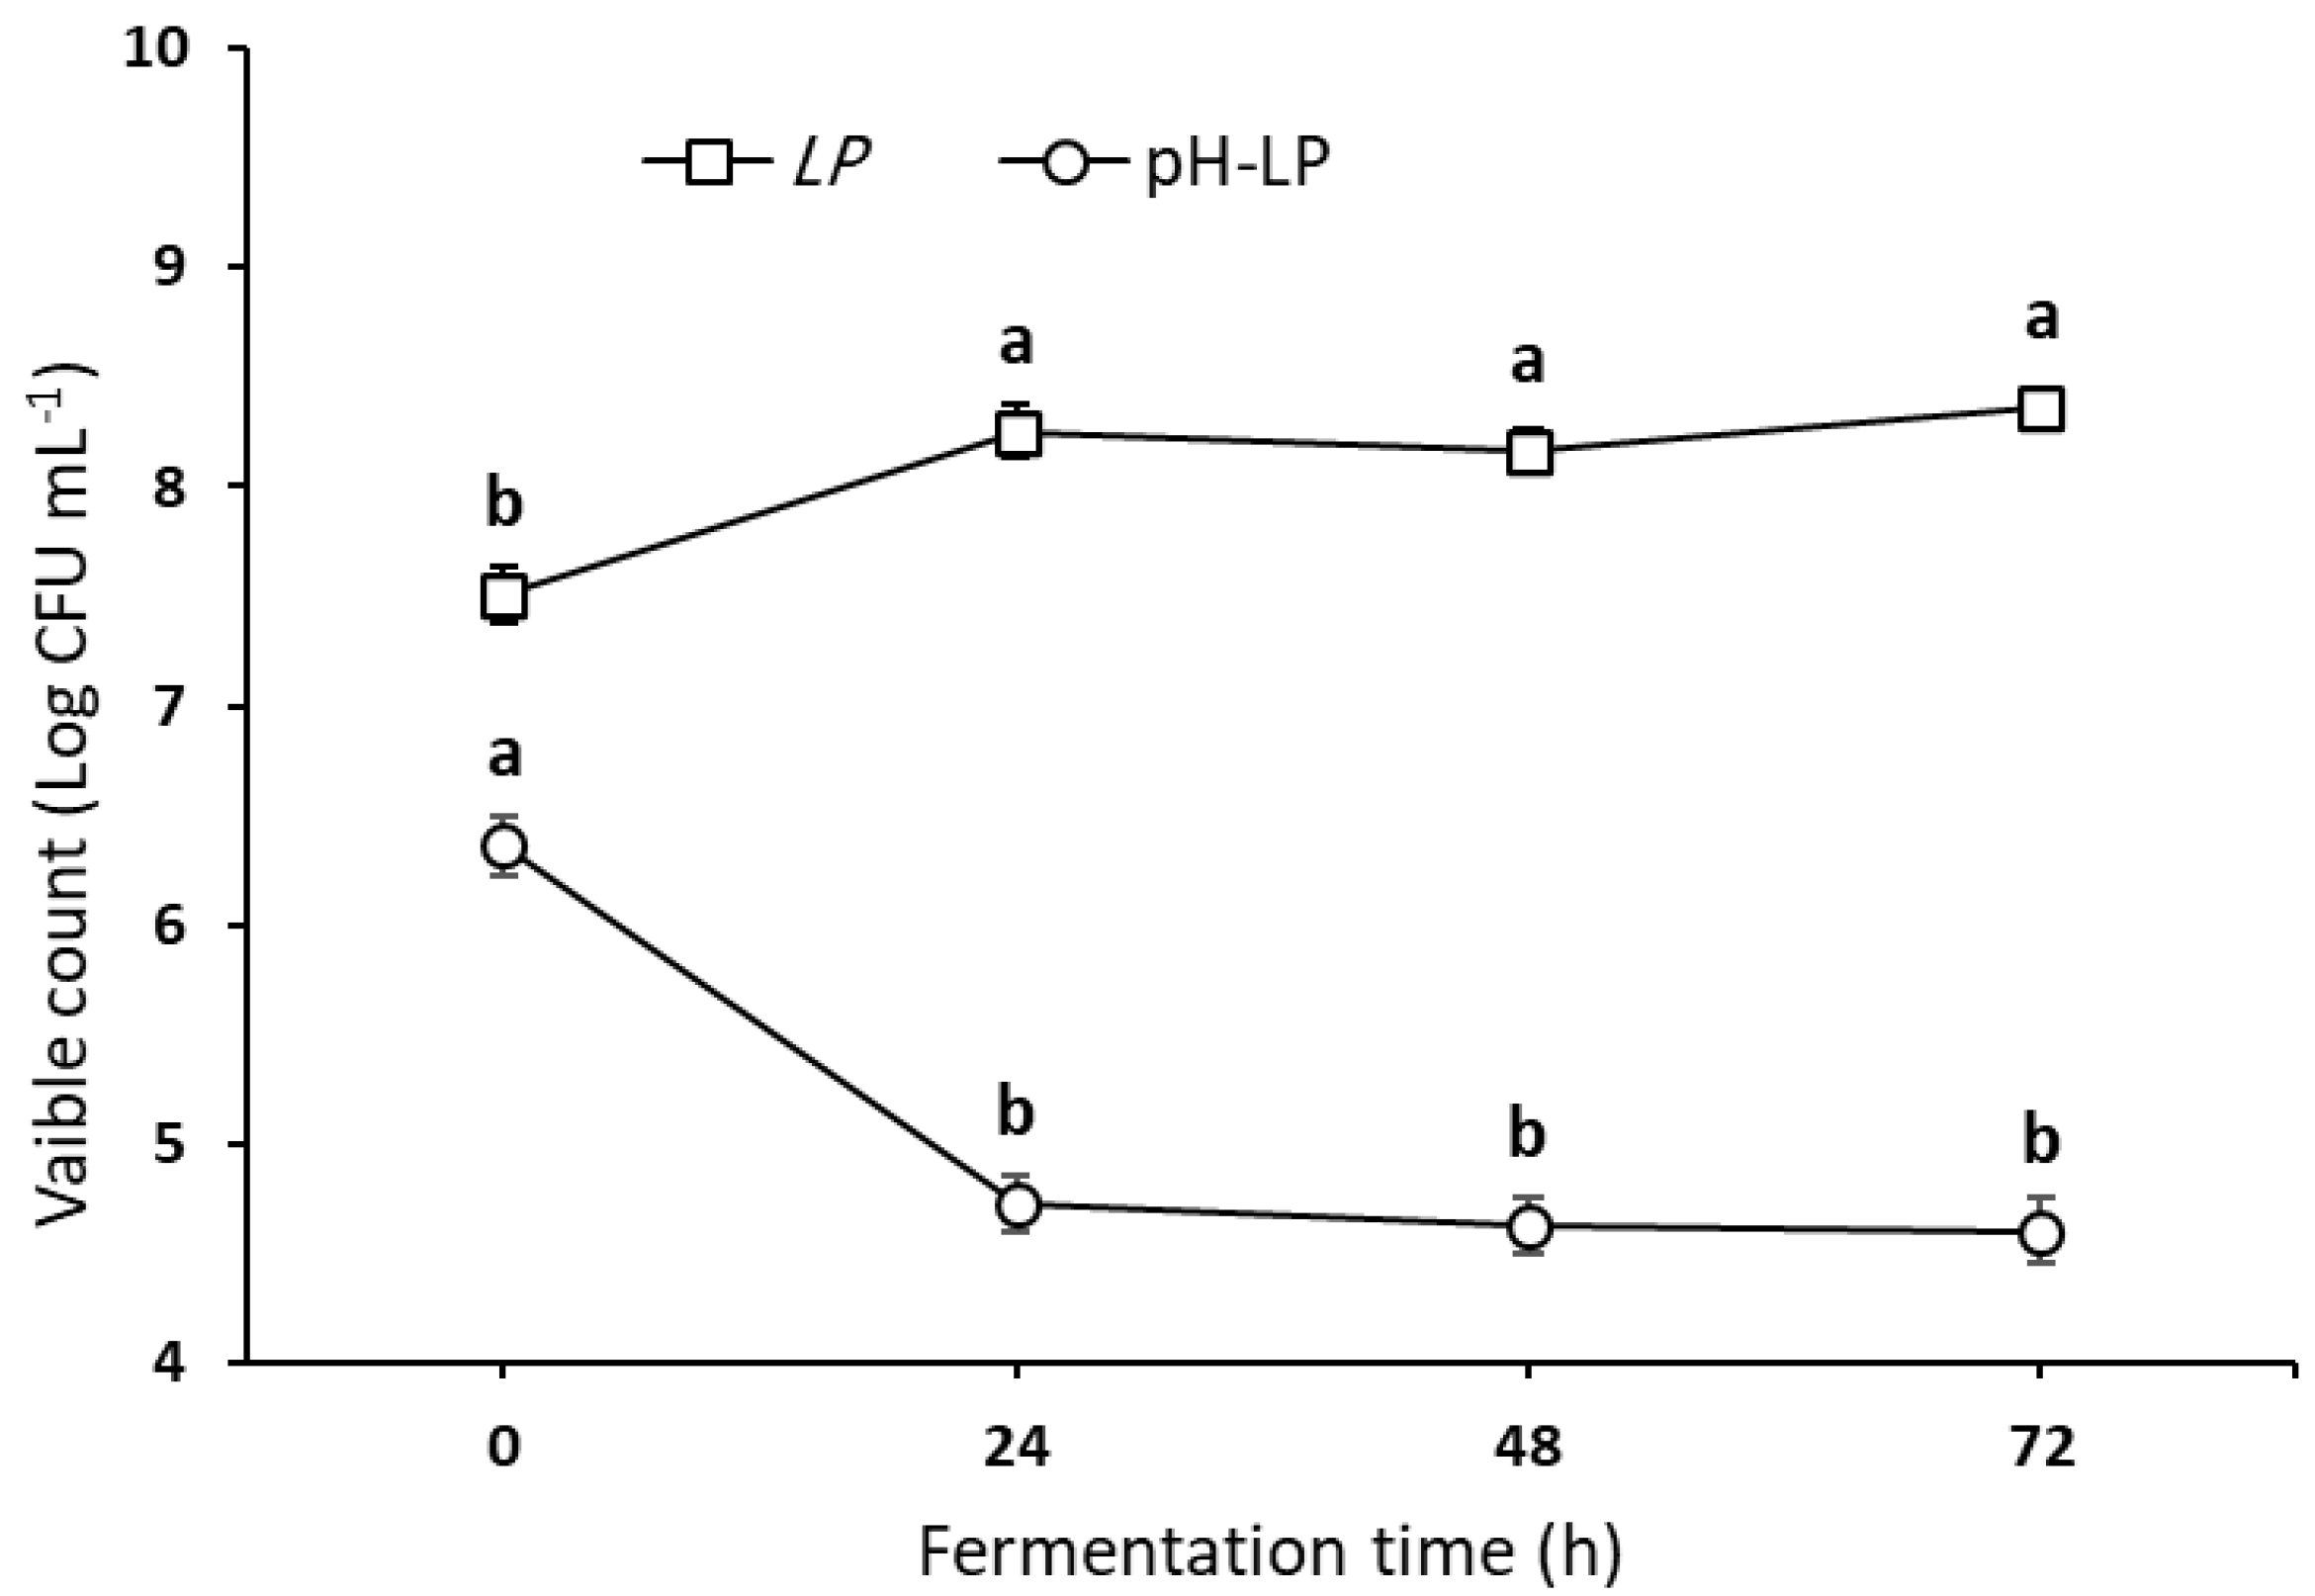
3.1. Survival of L. plantarum and Related pH Value

The current investigation used a mixture of sterilized oat flour, obtained from whole oat grains, in water at a ratio of 1:9 (w/v) as the fermentation media for L. plantarum. Immediately, L. plantarum was inoculated to reach 7.45 (CFU mL−1) using a new prepared starter culture. The growth profile, as shown in Figure 1, demonstrated that there was a significant increase in the viable count during the first 24 h (8.25 log CFU mL−1) as compared with at 0 h, with a slight decrease after 48 h (8.16 log CFU mL−1) and a slight increase after 72 h to 8.36 log CFU mL−1. With this increase in cell growth, there was a significant decrease in pH from 6.36 to 4.73 after 24 h, to 4.63 after 48 h, and a further reduction to 4.60 at 72 h. Indeed, the viable count remained relatively stable during this period confirming the steady growth of the L. plantarum.

3.2. Phytochemicals and Antioxidant Capacity

The total phenolic compounds (TPC) and related antioxidant activities were screened in the UFOE and the LFOE during fermentation times up to 72 h, as shown in Table 2. As compared with the TPC measured in the UFOE (0 h fermentation) (0.70 ± 0.08 mg GAE g−1), the TPC started to increase at 48 h (0.94 ± 0.15 mg GAE g−1) and continued to increase significantly at 72 h (1.04 ± 0.08 mg GAE g−1). Consistently, the antioxidant activity measured by the DPPH and ABTS radical scavenging assays started to increase at 48 h of fermentation; for DPPH, it reached 3.19 ± 0.12 µmol of TE g−1 and 3.56 ± 0.21 µmol of TE g−1 after 48 h and 72 h, respectively, as compared with that measured at 0 h (2.14 ± 0.09 µmol of TE g−1). For ABTS, it significantly increased to 4.58 ± 0.31 and 5.27 ± 0.14 µmol of TE g−1 at 48 and 72 h, respectively, as compared with that measured at 0 h (3.47 ± 0.29 TE g−1).

3.3. Gamma-Aminobutyric Acid and β-Glucan Contents during Fermentation

The gamma-aminobutyric acid (GABA) content in the native oats, the UFOE, was 4.12 ± 0.14 mg g1 (Table 3). The content started to increase in the later stages of fermentation; after 48 h, the GABA content increased to 6.10 ± 0.52 mg g−1. After 72 h, the L. plantarum was highly active in producing GABA; it significantly reached 7.35 ± 0.40 mg g−1. The production of GABA by L. plantarum was not statistically different (p < 0.05) during the early stage of fermentation (24 h). Further, monitoring β-glucan as a bioactive component in oats during the fermentation was of interest in the present study (Table 3). There was no significant change in the β-glucan content during the first 24 h of fermentation with 2.60 ± 0.01 g 100 g−1 DW as compared with at 0 h (2.62 ± 0.02 g 100 g−1 DW). There was a slight decrease to 2.56 ± 0.03 g 100 g−1 DW after 48 h of fermentation with a non-significant difference. Only after 72 h, β-glucan content recorded 2.45 ± 0.06 g 100 g−1 DW, which differed significantly as compared with its content in fermented oat during the period of 0–48 h.

3.4. The Hypoglycemic Efficiency

The injection of STZ resulted in significant hyperglycemia in all STZ-induced rats as compared with the NR group (Table 4). This state was constant throughout the experiment for the positive control (STZ) group. The efficiency of all treatments in improving the hyperglycemia was monitored during the 6 weeks; treating with metformin at a dose of 50 mg kg−1 BW significantly attenuated the RBG levels measured during the third and the last week as compared with those measured in the STZ group (238.67 ± 30.01 mg dL−1 vs. 386.33 ± 36.6 mg dL−1, and 201.5 ± 18.49 mg dL−1 vs. 359.5 ± 49.11 mg dL−1, respectively, p < 0.05); however, these levels were significantly high as compared with those measured in the NR group (114.33 ± 3.06 mg dL−1 and 110.67 ± 2.55 mg dL−1, respectively, p < 0.05). Although metformin did attenuate the FBG levels measured at the end of the experiment to normal levels, there were no significant differences as compared with that measured in the NR group (p > 0.05). Treating with the UFOE at a dose of 7 mL was effective in attenuating the levels of RBG. However, the effectiveness of the UFOE was not observed during the middle period of the experiment, as shown in Table 4. As compared with the metformin treatment, the RBG levels of the STZ+UFOEOE group measured during the third week were significantly higher than those measured for the STZ+MET (288.17 ± 44.38 mg dL−1 vs. 238.67 ± 30.01 mg dL−1, p < 0.05). The UFOE started to show desirable effects during the last week as there were no significant differences between RBG levels of the STZ+UFO and the STZ+MET groups (p < 0.05). As well as, the FBG levels at the end of the experiment had no significant differences as compared with both the STZ+MET group and the NR group. Whereas the treatment with the LFOE at the same dose was effective in a similar manner to the metformin treatment or even better; RBG levels measured during the last week for the STZ+LFOE group were significantly attenuated as compared with those measured for STZ+MET (179.33 ± 32.09 mg dL−1 vs. 201.5 ± 18.49 mg dL−1, p < 0.05); FBG levels also had no significant differences as compared with both NR and STZ+MET groups, as shown in Table 4.

3.5. The Hypolipidemic Efficiency

As seen in Table 5, levels of TG, CHO, LDL, VLDL, and HDL in the STZ group were significantly different from the NR group (p < 0.05). An imbalance in the lipid profile was observed due to the injection of STZ. Treating with metformin at a 50 mg kg−1 BW dose for 6 weeks reversed the imbalance and significantly improved the lipid profile. Similar effects were observed with the oral administration of both the UFOE and the LFOE at a dose of 7 mL; there were no significant differences as compared with the metformin treatment (p > 0.05). The levels of TG measured for both of the STZ+UFOE and STZ+LFOE groups were significantly reduced (92.17 ± 5.85 mg dL−1 and 81.90 ± 3.95 mg dL−1, respectively) as compared with the STZ group (p < 0.05). Interestingly, the LFOE efficiency in reducing TG levels was much better than that with the UFOE; TG levels of the STZ+LFOE group reached normal levels as there were no significant differences from the NR group (81.90 ± 3.95 mg dL−1 vs. 70.71 ± 3.01 mg dL−1, p < 0.05), but that with the STZ+UFOE had the opposite. The STZ+UFOE and STZ+LFOE groups also showed a significant reduction in the levels of CHO (98.53 ± 5.54 mg dL−1 and 104.93 ± 10.79 mg dL−1, respectively), LDL (40.84 ± 4.41 mg dL−1 and 48.96 ± 12.95 mg dL−1, respectively), and VLDL (18.43 ± 1.17 mg dL−1 and 16.38 ± 0.79 mg dL−1, respectively) as compared with the STZ group (p < 0.05). The reduction in CHO and LDL levels for both of the STZ+UFOE and STZ+LFOE groups were also not significantly different as compared with the NR group (p > 0.05), but the VLDL levels did not reach the normal levels, and there were significant differences as compared with the NR group (p < 0.05), as shown in Table 5.
In contrast, HDL levels showed a significant increase for both of the STZ+UFOE and STZ+LFOE groups (39.77 ± 3.72 mg dL−1 and 40.34 ± 5.19 mg dL−1, respectively) as compared with the STZ group (p < 0.05), and there were no significant differences as compared with both the STZ+MET and NR groups (p > 0.05). Interestingly enough, the AI was significantly increased after STZ injection (STZ group) as compared with the NR group (p < 0.05). All treatments were efficient in attenuating the atherogenicity complication in the STZ-injected rats. The administration of both the UFOE and the LFOE presented superior effects that did not differed significantly from rats administrated with metformin or even normal rats (p > 0.05).

3.6. The Liver’s Functions

Table 6 shows that the untreated STZ group had a significant increase in the liver enzymes (ALT, AST, and ALP) as compared with the NR group (p < 0.05). Metformin treatment at a 50 mg kg−1 BW dose improved liver functions as compared with the STZ group (p < 0.05). The administration of the UFOE and the LFOE at a dose of 7 mL showed an improvement in the liver functions as well. Both extracts were efficient in reducing the levels of ALT enzyme; however, the results did not differ statically from the STZ group (55.09 ± 2.74 U L−1 and 54.02 ± 4.64 U L−1, respectively, vs. 68.20 ± 11.59 U L−1, p > 0.05), whereas the metformin treatment reduced the enzyme to normal levels, as there were no significant differences as compared with the NR group (p > 0.05). Nonetheless, both extracts showed favorable effects on reducing AST and ALP enzymes, and there were no significant differences as compared with the NR group (p > 0.05). The reduction in ALP levels was much better than that with the metformin treatment; ALP levels measured for the STZ+MET group did not differ statically from that measured for the STZ group (p > 0.05). Furthermore, all three treatments attenuated the levels of T. Bili to normal levels. The LFOE slightly showed more effective results. However, there were no significant differences among the treatments (p > 0.05).

3.7. The Kidneys’ Functions

As seen in Table 7, the injection of STZ resulted in a reduction in total protein, albumin, and globulin levels as compared with the NR group. Contrarily, there was a significant increase in serum creatinine, urea, and BUN levels as compared with the NR group (p < 0.05). The administration of both extracts, UFOE and LFOE, at a dose of 7 mL resulted in an increase in T. Protein, albumin, and globulin compared to the STZ group. Interestingly, the increase in T. Protein was much more significant after the administration of the UFOE. However, the LFOE was efficient in increasing the T. Protein, as levels measured for the STZ+LFOE did not differ significantly from the NR group (p > 0.05); such results were not observed with the metformin treatment. Moreover, serum creatinine, urea, and BUN levels were significantly reduced in both of the STZ+UFOE and STZ+LFOE groups as compared with the STZ group (p < 0.05), while there were no significant differences as compared with the STZ+MET group (p > 0.05).

3.8. Antioxidant Biomarkers

The oxidative stress biomarkers (GSH, CAT, SOD, and MDA) were also screened. After 6 weeks of treatment, the STZ injection significantly reduced serum GSH, CAT, and SOD and increased the MDA as compared with the NR group (p < 0.05), as Table 8; shows. All three treatments showed favorable effects in improving the antioxidant biomarkers; notably, the LFOE was more efficient in increasing levels of GSH and CAT, and the later levels did not differ significantly from the NR group (p > 0.05). Such results in CAT levels were not observed with the administration of both UFOE and metformin. As for the SOD levels, both extracts favorably showed a reduction in a better manner than metformin treatment; levels measured for both of the STZ+UFOE and STZ+LFOE groups did not differ significantly from the NR group (p > 0.05), and such results were not observed with the metformin treatment. Furthermore, serum MDA was decreased after the administration of both extracts as compared with the STZ group (p < 0.05); the efficiency of both extracts did not differ significantly from the metformin treatment, as shown in Table 8; however, results did not reach normal levels.

4. Discussion

The findings of this study have revealed that the consumption of fermented oats promotes significant antidiabetic and hypolipidemic effects. A mixture of whole oats flour in distilled water was fermented for 72 h using a starter culture of L. plantarum. The final aqueous extract was administrated orally to diabetic rats daily for 6 weeks. The results showed that both unfermented and fermented oat extracts, UFOE and LFOE, respectively, had effectively attenuated the levels of RBG monitored during the experiment (Table 4). Interestingly, the LFOE slightly showed more favorable effects, although both extracts had a significant impact in attenuating FBG measured to normal levels at the end of the experiment. Prolonged hyperglycemia is a main diabetic complication that can result in a state of abnormalities in serum lipids, known as dyslipidemia [38]. The lipid parameters, including TG, TC, HDL, LDL, and VLDL, were measured; as shown in Table 5, significant changes were observed in the rats’ serum lipids due to the injection of STZ. The administration of both extracts significantly reversed these abnormalities. After 6 weeks of administration, groups administrated with the UFOE and the LFOE had a reduction in serum TG by 18.6% and 27.6%, respectively, whereas they had a decrease in serum LDL by 55.8% and 47%, respectively. These data demonstrate that the LFOE was more effective in lowering levels of TG, while the UFOE was more effective in reducing LDL levels. However, neither significant differences between both extracts improved hyperglycemia and dyslipidemia. Some conflicting results were reported in a previous study [39]; the administration of unfermented oat-based product attenuated FBG and improved the serum lipids in diabetic rats much better than that with the fermented one. A highly possible explanation for the differing results is the short fermentation time. Gohari et al. [39] had fermented their product for 16 h only, and such a short time may not be sufficient for the bacteria’s growth. The fermentation time has been reported to be a key factor in promoting bacterial growth [11,40]. This state supports the results of our study; we screened the L. plantarum growth profile during fermentation times up to 72 h. The viable L. plantarum count increased significantly after 24 h and continuously increased after 72 h as compared with that measured at the beginning of the fermentation process (Figure 1). The increase in the viable count was accompanied by a significant decrease in pH values (Figure 1), which reflected the microbes’ activity in hydrolyzing or breaking down the nutrients fractions into end-products such as acids [16]. Some nutritional parameters were screened to assess further the effects of the L. plantarum fermentation on the nutritional quality of the oats’ aqueous extracts. One of the most substantial acids that have been significantly released due to fermentation is GABA, a four-carbon, non-protein amino acid widely distributed in animals, plants, and microorganisms [17]. In addition, it has been reported to exert antidiabetic effects via stimulating insulin secretion [18]. The production of GABA by L. plantarum in our study increased significantly in a time-dependent manner (Table 3). After 24 h, 48 h, and 72 h of fermentation, the GABA content increased by 15.8%, 48%, and 78%, respectively, as compared with the unfermented extract. This increase may explain the in vivo beneficial effects of LFOE in attenuating blood glucose levels.
Processing oats with different techniques such as germination has shown similar results in increased GABA content in a time-dependent manner [40]. A massive increase of more than 200% in the GABA content has been reported after 72 h of oats fermentation [11,40], which was much less than our results. A possible explanation might be due to the difference in the fermentation process and the selected microorganism; Cai et al. [11] had applied a soaking process for 8 h in water before a fungal fermentation, indicating that soaking was an effective technique to increase the GABA content. Moreover, the inoculation percentage may also affect the GABA yield. Our study used a 1% L. plantarum starter culture, which may not be sufficient or effective in producing higher amounts of GABA. Although, this percentage was effective in increasing the GABA by almost 80%. In addition, our in vivo investigation did show significant results in improving the hyperglycemia of the STZ-induced rats (Table 4), and such increase in the GABA content could be related to these results. Further investigations are needed to assess the suggested factors that could affect the production of GABA and the related antidiabetic effects.
Another major bioactive compound that exhibits antidiabetic effects is the soluble dietary fiber, namely β-glucan. The oats’ β-glucan is well known for its properties in maintaining the homeostasis of glycemia, insulinemia, and lipidemia [41]. It has been indicated that the fermentation process can result in a loss of the oats’ β-glucan content [42]; therefore, screening the changes in the β-glucan content during fermentation times was one of our interest. As shown in Table 3, the β-glucan content decreased by 0.8%, 2.3%, and 6.5% after 24 h, 48 h, and 72 h of fermentation, respectively. Clearly, the longer fermentation time resulted in the highest decrease in the β-glucan content. These results are consistent with previous studies [43,44]; no significant changes have been observed in β-glucan content after applying a short fermentation time (10 h) to oat-based products. The reduction in the β-glucan content has been highly attributed to the bacteria’s activity in hydrolyzing the polysaccharide fractions such as β-glucans, which have been indicated as a selective substrate for Lactobacilli species [45]. The addition of fermentable sugars was suggested to promote bacterial growth, and therefore, could stabilize the β-glucan content of the β-glucan and enhance the overall fermentation process [42]. Nonetheless, the reduction in the β-glucan did not significantly alter the effectiveness of LFOE in improving the hyperglycemia or dyslipidemia of the STZ-induced rats. However, the RBG levels did not reach normal concentrations (Table 4). In addition, the rats administrated with the UFOE had a greater reduction in LDL levels as compared with those administrated with the LFOE (Table 5). These results could be related to the decrease in the β-glucan content. The β-glucans are hydrolyzed by gut microbes in the gastrointestinal tract producing short-chain fatty acids (SCFA) as by-products, which can play beneficial roles in maintaining blood glucose levels and cholesterol levels [7,41]. Therefore, stabilizing levels of β-glucan is a key factor for providing a functional fermented oat product with the ability to improve or control diabetic complications.
Prolonged hyperglycemia can result in a state of dyslipidemia and can also result in multiple organs dysfunction [46]. In our work, the hepatoprotective and nephroprotective effects of both extracts were screened. As shown in Table 6, both the UFOE and the LFOE improved the liver’s enzymes, including ALT, AST, and ALP, as compared with the positive control group. Treating with both extracts had no significant differences from treating with metformin at a dose of 50 mg kg−1 of BW. Interestingly, the reduction in ALP enzyme activity was much more effective than the metformin treatment. Treating diabetic rats with different fermented products has showed similar results in reducing the activities of ALT, AST, and ALP enzymes [47,48]. Total bilirubin activity was also screened; the results consistently showed that administration of the LFOE was slightly more effective in reducing the activity to the normal state (Table 6). Although all treatments showed effective hepatoprotective effects, no significant differences were observed.
Furthermore, the injection of STZ resulted in abnormalities in serum proteins, including the total protein, albumin, and globulin (Table 7). Treating both extracts effectively reversed these abnormalities; total protein levels were significantly improved to normal concentrations, and such results were not observed with the metformin treatment. Moreover, creatinine, urea, and blood urea nitrogen levels were reduced significantly after administering both extracts. Similar results in improving the total protein, creatinine, and blood urea nitrogen levels have been reported in diabetic rats due to the intervention of fermented rice [49]. In our study, the intervention of the fermented oats clearly shows strong hepatoprotective and nephroprotective effects in the induced diabetic rats.
The hepatoprotective and nephroprotective effects of fermented products are highly attributed to the significant enhancement in the nutritional composition [50]. Our study screened the changes in the oats’ aqueous extracts and showed a significant and remarkable increase in total phenolic content due to the fermentation process. Similar to the findings related to the GABA and the β-glucan contents, the increase in the phenolics was significant in a time-dependent manner (Table 2). After 24 h, 48 h, and 72 h of fermentation, the total phenolics increased by 6%, 34.3%, and 48.5%, respectively, as compared with that measured in the unfermented aqueous extract. Consistently, the highest increase was observed after the longer fermentation time (72 h). Phenolic compounds are highly bioactive agents demonstrated to promote several positive health benefits [51,52,53]. In addition, they promote antioxidant activities by combating the free radicals and possess various mechanisms for alleviating oxidative stress and its complications [11,12,42]. The antioxidant capacities of both extracts in this study were measured by the DPPH and ABTS assays, as shown in Table 2. The results were consistent with the increase in the total phenolics; after 72 h of fermentation, the antioxidant capacity of the aqueous extract increased by 66.3% and 51.9%, measures by DPPH and ABTS, respectively. Such results aligned with multiple studies [12,42]; different fermented oat-based products significantly increased total phenolic content and the related antioxidant activities after 72 h of fermentation.
Furthermore, diabetic complications, mainly prolonged hyperglycemia, can result in a wide range of physiological and pathophysiological changes such as inducing oxidative stress, inflammatory infections, and altering gene expressions [46]. Oxidative stress is one of the significant complications observed in diabetic individuals [54]. In our study, the diabetic rats had significant changes in the antioxidants’ enzymes, including GSH, CAT, SOD, and MDA (Table 8). The administration of all treatments for 6 weeks resulted in a significant improvement in all of these biomarkers; levels of GSH, CAT, and SOD enzymes increased, whereas the levels of MDA decreased as compared with the positive control rats. Interestingly enough, the LFOE showed some favorable results in improving the level of CAT to normal concentrations. Such effects were not observed with the UFOE or with the metformin treatment. The nutritional enhancements in the LFOE, especially the increase in the total phenolics and its related antioxidant activity, could be attributed to such desirable effects. The dietary intake of phenolic compounds has been demonstrated to play a beneficial role in improving the oxidative stress markers due to its high antioxidant capacity [12,42]. The administration of various fermented products has shown similar results in improving the oxidative stress markers in induced-diabetic rats [47,49,55] and in obese rats fed a high-fat diet [56].

5. Conclusions

In this study, oat fermentation by L. plantarum showed significant improvement in the nutritional quality in a time-dependent manner. After 72 h of fermentation at 37 °C, the TPC, AOA, and GABA contents were significantly increased by 48.5%, 59%, and 78%, respectively. In contrast, a significant decrease in β-glucan content after 72 h was remarked. The addition of fermentable sugars or honey is strongly advised to keep the β-glucan content stable during long fermentation. Obviously, the in vivo studies revealed that the UFOE and the LFOE effectively alleviated hyperglycemia in STZ-induced diabetic rats. Both extracts improved blood parameters associated with lipid metabolism. Both extracts had hepatoprotective, nephroprotective, and antioxidant potential, as evidenced by liver and kidney functions and oxidative stress biomarkers. These findings highlighted that fermented oat have potential health benefits as a functional supplement for diabetes and attenuates its complications. Such potential health benefits are largely attributed to the nutritional enhancements during fermentation, supporting the notion that fermentation time impacts significantly. Additional research is required to evaluate other factors to develop a well-designed fermented oat-based product to assess the long-term anti-diabetic effects and elucidate the mechanism of action.

Author Contributions

Conceptualization, R.A. and H.F.A.; methodology, R.A., H.F.A. and H.B.; investigation, R.A., H.F.A. and H.B.; funding acquisition, R.A., H.F.A. and H.B.; data curation, H.B.; formal analysis, H.B.; writing—original draft preparation, R.A. and H.B.; review and editing, R.A., H.F.A. and H.B. All authors have read and agreed to the published version of the manuscript.

Funding

The researchers would like to thank the Deanship of Scientific Research, Qassim University, for funding the publication of this project.

Institutional Review Board Statement

The study was approved by the committee of Research Ethics, Deanship of Scientific Research, Qassim University (21-05-06 on 15 December 2021), Control and Supervision of Experiments govern on Animals (CPCSEA), Committee of the National Committee of BioEthics (NCBE), which implements regulations related to the ethics of research on living creatures.

Informed Consent Statement

Not applicable.

Data Availability Statement

Data is contained within the article.

Conflicts of Interest

The authors declare no conflict of interest.

Abbreviations

ABTS: 2:2’-azino-bis(3-ethylbenzothiazoline-6-sulfonic acid); ALT, Alanine aminotransferase; AOA, Antioxidant activity; AST, Aspartate aminotransferase; BHA: Butylated hydroxyanisole; CAT, Catalase; CHO, Total cholesterol; DPPH: 1,1-diphenyl-2-picryl hydrazine; dw: Dry weight; FBG, Fasting blood glucose; GA: gallic acid; GAE: gallic acid equivalent; GSH: Reduced-glutathione; HDL, High-density lipoproteins; LDL, Low-density lipoproteins; LFOE, L. planterum fermented oat extract; MDA: Malonaldehyde; QE: Quercetin equivalent; RSA: Radical scavenging activity; SE: Standard error; SOD: Superoxide dismutase; TBA, Thiobarbituric acid; TE: trolox equivalents; TF: Total flavonoids; TG, Triglycerides; TPC, Total phenolic compounds; UFOE: Unfermented oat extract; VLDL, Very Low-density lipoproteins.

References

  1. International Diabetes Federation. IDF Diabetes Atlas; International Diabetes Federation: Brussels, Belgium, 2021; Volume 102, pp. 147–148. [Google Scholar]
  2. Cole, J.B.; Florez, J.C. Genetics of Diabetes Mellitus and Diabetes Complications. Nat. Rev. Nephrol. 2020, 16, 377–390. [Google Scholar] [CrossRef] [PubMed]
  3. Bao, L.; Cai, X.; Xu, M.; Li, Y. Effect of Oat Intake on Glycaemic Control and Insulin Sensitivity: A Meta-Analysis of Randomised Controlled Trials. Br. J. Nutr. 2014, 112, 457–466. [Google Scholar] [CrossRef] [PubMed]
  4. Andrade, E.F.; Lobato, R.V.; de Araújo, T.V.; Zangerônimo, M.G.; de Sousa, R.V.; Pereira, L.J. Effect of beta-Glucans in the Control of Blood Glucose Levels of Diabetic Patients: A Systematic Review. Nutr. Hosp. 2015, 31, 170–177. [Google Scholar]
  5. Shen, X.L.; Zhao, T.; Zhou, Y.; Shi, X.; Zou, Y.; Zhao, G. Effect of Oat β-glucan Intake on Glycaemic Control and Insulin Sensitivity of Diabetic patients: A Meta-Analysis of Randomized Controlled Trials. Nutrients 2016, 8, 39. [Google Scholar] [PubMed] [Green Version]
  6. Ahmad, M.; Gul-Zaffar; Dar, Z.A.; Habib, M. A review on Oat (Avena sativa L.) as A Dual-Purpose Crop. Sci. Res. Essay 2014, 9, 52–59. [Google Scholar] [CrossRef] [Green Version]
  7. Sangwan, S.; Singh, R.; Tomar, S.K. Nutritional and Functional Properties of Oats: An Update. J. Innov. Biol. 2014, 1, 3–14. [Google Scholar]
  8. Angelov, A.; Yaneva-Marinova, T.; Gotcheva, V. Oats as A Matrix of Choice for Developing Fermented Functiona Beverages. J. Food Sci. Technol. 2018, 55, 2351–2360. [Google Scholar] [CrossRef]
  9. Boz, H. Phenolic Amides (avenanthramides) in Oats—A Review. Czech J. Food Sci. 2015, 33, 399–404. [Google Scholar] [CrossRef] [Green Version]
  10. Meydani, M. Potential Health Benefits of Avenanthramides of Oats. Nutr. Rev. 2009, 67, 731–735. [Google Scholar] [CrossRef]
  11. Cai, S.; Gao, F.; Zhang, X.; Wang, O.; Wu, W.; Zhu, S.; Zhang, D.; Zhou, F.; Ji, B. Evaluation of γ-aminobutyric Acid, Phytate and Antioxidant Activity of Tempeh-like Fermented Oats (Avena sativa L.) Prepared with Different Filamentous Fungi. J. Food Sci. Technol. 2014, 51, 2544–2551. [Google Scholar] [CrossRef] [Green Version]
  12. Sunderam, V.; Mohammed, S.S.S.; Madhavan, Y.; Dhinakaran, M.; Sampath, S.; Patteswaran, N.; Thangavelu, L.; Lawrence, A.V. Free Radical Scavenging Activity and Cytotoxicity Study of Fermented Oats (Avena sativa). Int. J. Res. Pharm. Sci. 2020, 11, 1259–1262. [Google Scholar] [CrossRef]
  13. Nkhata, S.G.; Ayua, E.; Kamau, E.H.; Shingiro, J.B. Fermentation and Germination Improve Nutritional Value of Cereals and Legumes Through Activation of Endogenous Enzymes. Food Sci. Nutr. 2018, 6, 2446–2458. [Google Scholar] [CrossRef] [Green Version]
  14. Şanlier, N.; Gökcen, B.B.; Sezgin, A.C. Health Benefits of Fermented Foods. Crit. Rev. Food Sci. Nutr. 2019, 59, 506–527. [Google Scholar] [CrossRef]
  15. Zhang, J.; Xiao, X.; Dong, Y.; Shi, L.; Xu, T.; Wu, F. The Anti-Obesity Effect of Fermented Barley Extracts with Lactobacillus plantarum dy-1 and Saccharomyces cerevisiae in Diet-Induced Obese Rats. Food Funct. 2017, 8, 1132–1143. [Google Scholar] [CrossRef] [PubMed]
  16. Saraphanchotiwitthaya, A.; Sripalakit, P. Production of γ-aminobutyric Acid from Red Kidney Bean and Barley Grain Fermentation by Lactobacillus brevis TISTR 860. Biocatal. Agric. Biotechnol. 2018, 16, 49–53. [Google Scholar] [CrossRef]
  17. Dhakal, R.; Bajpai, V.K.; Baek, K.-H. Production of GABA (γ-aminobutyric acid) by Microorganisms: A Review. Braz. J. Microbiol. 2012, 43, 1230–1241. [Google Scholar] [CrossRef] [Green Version]
  18. Adeghate, E.; Ponery, A.S. GABA in the Endocrine Pancreas: Cellular Localization and Function in Normal and Diabetic Rats. Tissue Cell 2002, 34, 1–6. [Google Scholar] [CrossRef]
  19. Sivamaruthi, B.S.; Kesika, P.; Prasanth, M.I.; Chaiyasut, C. A mini Review on Antidiabetic Properties of Fermented Foods. Nutrients 2018, 10, 1973. [Google Scholar] [CrossRef] [PubMed] [Green Version]
  20. Lindner, J.D.D.; Valentina, B. New Insights into Food Fermentation. Foods 2022, 11, 283. [Google Scholar] [CrossRef] [PubMed]
  21. Park, S.J.; Kim, D.H.; Kang, H.J.; Shin, M.; Yang, S.-Y.; Yang, J.; Jung, Y.H. Enhanced Production of γ-aminobutyric Acid (GABA) using Lactobacillus plantarum EJ2014 with Simple Medium Composition. LWT Food Sci. Technol. 2021, 137, 110443. [Google Scholar] [CrossRef]
  22. De Vries, M.C.; Vaughan, E.E.; Kleerebezem, M.; de Vos, W.M. Lactobacillus plantarum—Survival, Functional and Potential Probiotic Properties in the Human Intestinal Tract. Int. Dairy J. 2006, 16, 1018–1028. [Google Scholar] [CrossRef]
  23. Won, G.; Choi, S.-I.; Park, N.; Kim, J.-E.; Kang, C.-H.; Kim, G.-H. In Vitro Antidiabetic, Antioxidant Activity, and Probiotic Activities of Lactiplantibacillus plantarum and Lacticaseibacillus paracasei Strains. Curr. Microbiol. 2021, 78, 3181–3191. [Google Scholar] [CrossRef]
  24. Li, X.; Cai, X.; Ma, X.; Jing, L.; Gu, J.; Bao, L.; Li, J.; Xu, M.; Zhang, Z.; Li, Y. Short-and Long-Term Effects of Wholegrain OAT Intake on Weight Management and Glucolipid Metabolism in Overweight Type-2 Diabetics: A Randomized Control Trial. Nutrients 2016, 8, 549. [Google Scholar] [CrossRef] [Green Version]
  25. Vinderola, C.G.; Reinheimer, J.A. Culture Media for the Enumeration of Bifidobacterium bifidum and Lactobacillus acidophilus in the Presence of Yoghurt Bacteria. Int. Dairy J. 1999, 9, 497–505. [Google Scholar] [CrossRef]
  26. Nsimba, R.Y.; Kikuzaki, H.; Konishi, Y. Antioxidant Activity of Various Extracts and Fractions of Chenopodium quinoa and Amaranthus spp. seeds. Food Chem. 2008, 106, 760–766. [Google Scholar] [CrossRef]
  27. Lu, J.; Zhao, H.; Chen, J.; Fan, W.; Dong, J.; Kong, W.; Sun, J.; Cao, Y.; Cai, G. Evolution of Phenolic Compounds and Antioxidant Activity During Malting. J. Agr. Food Chem. 2007, 55, 10994–11001. [Google Scholar] [CrossRef]
  28. Yuwa-amornpitak, T.; Butkhup, L.; Yeunyaw, P.-N. Amino Acids and Antioxidant Activities of Extracts From Wild Edible Mushrooms From A Community Forest in the Nasrinual District, Maha Sarakham, Thailand. Food Sci. Technol. 2020, 40, 712–720. [Google Scholar] [CrossRef]
  29. Shiju, T.M.; Rajesh, N.G.; Viswanathan, P. Renoprotective Effect of Aged Garlic Extract in Streptozotocin-Induced Diabetic Rats. Indian J. Pharmacol. 2013, 45, 18. [Google Scholar] [CrossRef]
  30. Reagan-Shaw, S.; Nihal, M.; Ahmad, N. Dose Translation from Animal to Human Studies Revisited. FASEB J. 2008, 22, 659–661. [Google Scholar] [CrossRef] [Green Version]
  31. Friedewald, W.T.; Levy, R.I.; Fredrickson, D.S. Estimation of the Concentration of Low-density Lipoprotein CHOLESTEROL in Plasma, without use of the Preparative Ultracentrifuge. Clin. Chem. 1972, 18, 499–502. [Google Scholar] [CrossRef]
  32. Nwagha, U.; Ikekpeazu, E.; Ejezie, F.; Neboh, E.; Maduka, I. Atherogenic Index of Plasma as Useful Predictor of Cardiovascular Risk Among Postmenopausal Women in Enugu, Nigeria. Afr. Health Sci. 2010, 10, 248–252. [Google Scholar]
  33. Beutler, E. Improved Method for the Determination of Blood Glutathione. J. Lab. Clin. Med. 1963, 61, 882–888. [Google Scholar]
  34. Ohkawa, H.; Ohishi, N.; Yagi, K. Assay for Lipid Peroxides in Animal Tissues by Thiobarbituric Acid Reaction. Anal. Biochem. 1979, 95, 351–358. [Google Scholar] [CrossRef]
  35. Giannopolitis, C.N.; Ries, S.K. Superoxide Dismutases: I. Occurrence in Higher Plants. Plant Physiol. 1977, 59, 309–314. [Google Scholar] [CrossRef]
  36. Aebi, H. Catalase in vitro. Methods Enzymol. 1984, 105, 121–126. [Google Scholar]
  37. Steel, R.G. Principles and Procedures of Statistics A Biometrical Approach, 3rd ed.; McGraw-Hill: New York, NY, USA, 1997. [Google Scholar]
  38. Schofield, J.D.; Liu, Y.; Rao-Balakrishna, P.; Malik, R.A.; Soran, H. Diabetes dyslipidemia. Diabetes Ther. 2016, 7, 203–219. [Google Scholar] [CrossRef] [Green Version]
  39. Gohari, S.T.; El-Batawy, O.I.; Mahdy, S.M. Biological Attributes of Unfermented and Fermented Oat Milk Compared to Cow Milk in Alloxan-Induced Diabetic Rats. J. Food Dairy Sci. 2019, 10, 61–69. [Google Scholar] [CrossRef]
  40. Xu, J.G.; Hu, Q.P.; Duan, J.L.; Tian, C.R. Dynamic Changes in γ-aminobutyric Acid and Glutamate Decarboxylase Activity in Oats (Avena nuda L.) During Steeping and Germination. J. Agric. Food Chem. 2010, 58, 9759–9763. [Google Scholar] [CrossRef]
  41. Bozbulut, R.; Sanlier, N. Promising Effects of β-glucans on Glyceamic Control in Diabetes. Trends Food Sci. Technol. 2019, 83, 159–166. [Google Scholar] [CrossRef]
  42. Chen, L.; Wu, D.; Schlundt, J.; Conway, P.L. Development of a Dairy-Free Fermented Oat-Based Beverage With Enhanced Probiotic and Bioactive Properties. Front. Microbiol. 2020, 11, 609734. [Google Scholar] [CrossRef]
  43. Angelov, A.; Gotcheva, V.; Kuncheva, R.; Hristozova, T. Development of a New Oat-based Probiotic Drink. Int. J. Food Microbiol. 2006, 112, 75–80. [Google Scholar] [CrossRef] [PubMed]
  44. Gao, F.; Cai, S.; Nout, R.M.; Wang, Y.; Xia, Y.; Li, Y.; Ji, B. Production of Oat-based Synbiotic Beverage by Two-Stage Fermentation with Rhizopus oryzae and Lactobacillus acidophilus. J. Food Agric. Environ. 2012, 10, 175–179. [Google Scholar]
  45. Jaskari, J.; Kontula, P.; Siitonen, A.; Jousimies-Somer, H.; Mattila-Sandholm, T.; Poutanen, K. Oat β-glucan and Xylan Hydrolysates as Selective Substrates for Bifidobacterium and Lactobacillus strains. Appl. Microbiol. Biotechnol. 1998, 49, 175–181. [Google Scholar] [CrossRef]
  46. Giri, B.; Dey, S.; Das, T.; Sarkar, M.; Banerjee, J.; Dash, S.K. Chronic Hyperglycemia Mediated Physiological Alteration and Metabolic Distortion Leads to Organ Dysfunction, Infection, Cancer Progression and other Pathophysiological Consequences: An Update on Glucose Toxicity. Biomed. Pharmacother. 2018, 107, 306–328. [Google Scholar] [CrossRef] [PubMed]
  47. Ademiluyi, A.O.; Oboh, G. Attenuation of Oxidative Stress and Hepatic Damage by some Fermented Tropical Legume Condiment Diets in Sreptozotocin–induced Diabetes in Rats. Asian Pac. J. Trop. Med. 2012, 5, 692–697. [Google Scholar] [CrossRef] [Green Version]
  48. Zulkawi, N.; Ng, K.H.; Zamberi, N.R.; Yeap, S.K.; Satharasinghe, D.A.; Tan, S.W.; Ho, W.Y.; Rashid, N.Y.A.; Lazim, M.I.M.; Jamaluddin, A. Antihyperglycemic and Anti-inflammatory Effects of Fermented Food Paste in High-Fat Diet and Streptozotocin-Challenged Mice. Drug Des. Devel. Ther. 2018, 12, 1373. [Google Scholar] [CrossRef] [Green Version]
  49. Rajasekaran, A.; Kalaivani, M. Protective Effect of Monascus fermented Rice Against STZ-induced Diabetic Oxidative Stress in Kidney of Rats. J. Food Sci. Technol. 2015, 52, 1434–1443. [Google Scholar] [CrossRef] [Green Version]
  50. Ali, N.M.; Yusof, H.M.; Long, K.; Yeap, S.K.; Ho, W.Y.; Beh, B.K.; Koh, S.P.; Abdullah, M.P.; Alitheen, N.B. Antioxidant and Hepatoprotective Effect of Aqueous Extract of Germinated and Fermented Mung Bean on Ethanol-Mediated Liver Damage. BioMed. Res. Int. 2013, 2013, 693613. [Google Scholar]
  51. Al-Qabba, M.M.; El-Mowafy, M.A.; Althwab, S.A.; Alfheeaid, H.A.; Aljutaily, T.; Barakat, H. Phenolic Profile, Antioxidant Activity, and Ameliorating Efficacy of Chenopodium quinoa Sprouts against CCl4-Induced Oxidative Stress in Rats. Nutrients 2020, 12, 2904. [Google Scholar] [CrossRef]
  52. Santhakumar, A.B.; Bulmer, A.C.; Singh, I. A Review of the Mechanisms and Effectiveness of Dietary Polyphenols in Reducing Oxidative Stress and Thrombotic Risk. J. Hum. Nutr. Diet. 2014, 27, 1–21. [Google Scholar] [CrossRef]
  53. Lin, D.; Xiao, M.; Zhao, J.; Li, Z.; Xing, B.; Li, X.; Kong, M.; Li, L.; Zhang, Q.; Liu, Y.; et al. An Overview of Plant Phenolic Compounds and Their Importance in Human Nutrition and Management of Type 2 Diabetes. Molecules 2016, 21, 1374. [Google Scholar] [CrossRef]
  54. Alharbi, Y.M.; Sakr, S.S.; Albarrak, S.M.; Almundarij, T.I.; Barakat, H.; Hassan, M.F.Y. Antioxidative, Antidiabetic, and Hypolipidemic Properties of Probiotic-Enriched Fermented Camel Milk Combined with Salvia officinalis Leaves Hydroalcoholic Extract in Streptozotocin-Induced Diabetes in Rats. Antioxidants 2022, 11, 668. [Google Scholar] [CrossRef] [PubMed]
  55. Kim, M.J.; Ha, B.J. Antihyperglycemic and Antihyperlipidemic Effects of Fermented Rhynchosia nulubilis in Alloxan-induced Diabetic Rats. Toxicol. Res. 2013, 29, 15–19. [Google Scholar] [CrossRef] [PubMed]
  56. Guan, Q.; Ding, X.W.; Zhong, L.Y.; Zhu, C.; Nie, P.; Song, L.H. Beneficial Effects of Lactobacillus-Fermented Black Barley on High Fat Diet-Induced Fatty Liver in Rats. Food Funct. 2021, 12, 6526–6539. [Google Scholar] [CrossRef]
Figure 1. Viability of L. plantarum (CFU mL−1) and pH value during oat fermentation (mean ± SE), n = 3. a, b, Lines during the fermentation period not sharing similar letters are significantly different (p > 0.05).
Fermentation 08 00267 g001
Table 1. The experimental design of Streptozotocin-induced diabetic rats treated with the LFOE for 6 weeks.
GroupExperimental Treatment
NRNormal non-diabetic rats
STZUntreated diabetic rats
STZ+METDiabetic rats + metformin (50 mg kg−1 BW)
STZ+UFOEDiabetic rats + UFOE (7 mL)
STZ+LFOEDiabetic rats + LFOE (7 mL)
UFOE, unfermented oat extract; LFOE, L. plantarum fermented oat extract. All rats were fed standard rodent chow throughout the entire experiment.
Table 2. Total phenolic content and potential antioxidant activities in fermented oat extract during fermentation up to 72 h (mean ± SE), n = 8.
ItemFermentation Time
0 h24 h48 h72 h
TPC (mg GAE g−1)0.70 ± 0.08 b0.74 ± 0.07 b0.94 ± 0.15 a,b1.04 ± 0.08 a
DPPH (µmol of TE g−1)2.14 ± 0.09 b2.22 ± 0.11 b3.19 ± 0.12 a,b3.56 ± 0.21 a
ABTS (µmol of TE g−1)3.47 ± 0.29 c3.89 ± 0.13 c4.58 ± 0.31 b5.27 ± 0.14 a
a, b & c, No significant difference (p > 0.05) between any two means within the same row with the same superscripted letters.
Table 3. Gamma-aminobutyric acid and β-glucan contents in fermented oat extract during fermentation up to 72 h (mean ± SE), n = 8.
ItemFermentation Time
0 h24 h48 h72 h
GABA * (mg 100 g−1)4.12 ± 0.14 b4.77 ± 0.17 b6.10 ± 0.52 a,b7.35 ± 0.40 a
β-glucan (g 100 g−1)2.62 ± 0.02 a2.60 ± 0.01 a2.56 ± 0.03 a2.45 ± 0.06 b
*, Gamma-aminobutyric acid; a, b, no significant difference (p > 0.05) between any two means within the same row with the same superscripted letters.
Table 4. Effect of orally administrated fermented oat extract on RBG and FBG (mg dL−1) in Streptozotocin-induced diabetes in rats (mean ± SE), n = 8.
Groups *RBGFBG
Weak-0Weak-3Weak-6
NR113.83 ± 3.82 c,A114.33 ± 3.06 d,A110.67 ± 2.55 d,A88.79 ± 4.28 b
STZ314.17 ± 33.65 a,A386.33 ± 36.6 a,A359.5 ± 49.11 a,A260.84 ± 10.35 a
STZ+MET284.33 ± 34.90 a,b,A238.67 ± 30.01 c,B201.5 ± 18.49 b,B89.96 ± 2.5 b
STZ+UFOE260.50 ± 27.63 b,A288.17 ± 44.38 b,A232.5 ± 25.24 b,B96.54 ± 6.97 b
STZ+LFOE308.50 ± 22.13 a,A244.83 ± 28.82 c,B179.33 ± 32.09 c,C91.00 ± 8.09 b
*, Experimental groups see materials and methods, Section 2.8 (Table 1). RBG, random blood glucose; FBG, fasting blood glucose level measured in blood serum of 12-hour fasted rats. a, b, c and d, No significant difference (p > 0.05) between any two means, within the same column having the same superscripted letters. A, B, and C, No significant difference (p > 0.05) between any two means with the same superscripted letters within the same row.
Table 5. Effect of orally administrated fermented oat extract on lipid profile (mg dL−1) and the atherogenic index in Streptozotocin-induced diabetes in rats (mean ± SE), n = 8.
Groups *Lipid Profile Parameters
TGCHOHDLLDLVLDLAI
NR70.71 ± 3.01 c91.15 ± 7.88 b38.07 ± 5.56 a40.20 ± 9.79 b14.14 ± 0.60 c0.30 ± 0.08 c
STZ113.18 ± 5.44 a141.78 ± 11.25 a26.71 ± 4.07 b92.43 ± 14.04 a22.64 ± 1.09 a0.66 ± 0.07 a
STZ+MET97.39 ± 8.71 a,b103.18 ± 12.32 b36.37 ± 6.71 a47.34 ± 11.32 b19.48 ± 1.74 a,b0.48 ± 0.10 b
STZ+UFOE92.17 ± 5.85 b98.53 ± 5.54 b39.77 ± 3.72 a40.84 ± 4.41 b18.43 ± 1.17 b0.33 ± 0.05 b,c
STZ+LFOE81.90 ± 3.95 b,c104.93 ± 10.79 b40.34 ± 5.19 a48.96 ± 12.95 b16.38 ± 0.79 b0.37 ± 0.05 b,c
*, Experimental groups see materials and methods, Section 2.8 (Table 1). TG, triglycerides; CHO, total cholesterols; HDL-CHO, high-density lipoprotein cholesterol; LDL-CHO, low-density lipoprotein cholesterols; VLDL-CHO, very low-density lipoprotein cholesterol, AI, atherogenic index. a, b, and c, No significant difference (p > 0.05) between any two means within the same column with the same superscripted letters.
Table 6. Effect of orally administrated fermented oat extract on liver functions in Streptozotocin-induced diabetes in rats (mean ± SE), n = 8.
Groups *Liver’s Functions
ALT (U L−1)AST (U L−1)ALP (U L−1)T. Bili (mg dL−1)
NR44.50 ± 2.57 b58.25 ± 4.43 b74.78 ± 27.77 b0.62 ± 0.15 b
STZ68.20 ± 11.59 a90.90 ± 10.39 a149.05 ± 20.83 a0.97 ± 0.18 a
STZ+MET47.79 ± 1.80 b68.84 ± 5.74 b101.06 ± 10.58 a,b0.79 ± 0.08 a,b
STZ+UFOE55.09 ± 2.74 a,b76.07 ± 1.57 b88.22 ± 6.38 b0.71 ± 0.04 a,b
STZ+LFOE54.02 ± 4.64 a,b70.16 ± 2.44 b76.85 ± 7.74 b0.65 ± 0.08 a,b
*, Experimental groups see materials and methods, Section 2.8 (Table 1). ALT, alanine aminotransferase; AST, aspartate aminotransferase; ALP, alkaline phosphatase; T. Bili, total bilirubin. a, b, No significant difference (p > 0.05) between any two means within the same column have the same superscripted letters.
Table 7. Effect of orally administrated fermented oat extract on kidneys’ functions in Streptozotocin-induced diabetes in rats (mean ± SE), n = 8.
Group *Kidneys’ Functions
T. Protein
(g dL−1)
Albumin
(g dL−1)
Globulin
(g dL−1)
Creatinine
(mg dL−1)
Urea
(mg dL−1)
BUN
(mg dL−1)
NR8.81 ± 0.17 b4.11 ± 0.24 a4.70 ± 0.18 a0.77 ± 0.03 c34.18 ± 6.74 b16.07 ± 3.17 b
STZ7.20 ± 0.28 d3.53 ± 0.08 a3.67 ± 0.30 a1.28 ± 0.05 a68.66 ± 10.51 a32.27 ± 4.94 a
STZ+MET7.79 ± 0.35 c,d4.01 ± 0.31 a3.78 ± 0.57 a0.96 ± 0.07 b47.31 ± 6.04 b22.24 ± 2.84 b
STZ+UFOE9.94 ± 0.32 a4.01 ± 0.30 a4.98 ± 0.38 a0.88 ± 0.06 b,c41.04 ± 5.91 b19.29 ± 2.78 b
STZ+LFOE8.23 ± 0.40 b,c3.73 ± 0.29 a4.50 ± 0.51 a0.81 ± 0.07 b,c39.70 ± 6.86 b18.66 ± 3.22 b
*, Experimental groups see materials and methods, Section 2.8 (Table 1). a, b, c and d, No significant difference (p > 0.05) between any two means within the same column with the same superscripted letters.
Table 8. Effect of orally administrated fermented oat extract on antioxidant biomarkers in Streptozotocin-induced diabetes in rats (mean ± SE), n = 8.
Group *Antioxidant Biomarkers
GSH (µg dL−1)MDA (nmol mL−1)CAT (U L−1)SOD (U L−1)
NR75.11 ± 9.02 a14.63 ± 0.5 c74.99 ± 7.14 a59.88 ± 3.85 a
STZ36.17 ± 4.63 c20.63 ± 0.37 a48.43 ± 5.69 c,d35.63 ± 2.52 c
STZ+MET50.08 ± 5.05 b,c17.48 ± 0.63 b58.18 ± 4.84 c44.45 ± 3.2 b,c
STZ+UFOE45.56 ± 2.22 b,c16.67 ± 0.35 b62.81 ± 6.84 b53.56 ± 2.14 a,b
STZ+LFOE55.97 ± 2.71 b16.67 ± 0.29 b69.79 ± 5.05 a51.20 ± 4.10 a,b
*, Experimental groups see materials and methods, Section 2.8 (Table 1). GSH, reduced glutathione; MDA, malondialdehyde; SOD, superoxide dismutase; CAT, catalase. a, b, c and d, No significant difference (p > 0.05) between any two means within the same column with the same superscripted letters.
Publisher’s Note: MDPI stays neutral with regard to jurisdictional claims in published maps and institutional affiliations.

