Article

New Model High Temperature Pasting Analysis of Fermented Cassava Granules

1
School of Bioscience, Sutton Bonington Campus, University of Nottingham, Nottingham LE12 5RD, UK
2
School of Chemical Engineering, University of Birmingham, Edgbaston, Birmingham B15 2TT, UK
*
Author to whom correspondence should be addressed.
Fermentation 2022, 8(2), 89; https://doi.org/10.3390/fermentation8020089
Submission received: 31 December 2021 / Revised: 7 February 2022 / Accepted: 17 February 2022 / Published: 21 February 2022
(This article belongs to the Special Issue Advances in Beverages, Food, Yeast and Brewing Research)

Abstract

:
Cassava is a starchy food item eaten by millions worldwide in various forms. The product has been subjected to various analysis forms, including the viscosity capacity of different flours made from the product. In this study, cassava granules (Garri) were subjected to scanning electron microscopy (SEM) and laser diffraction particle size analysis to determine microstructure, after which the viscosity behavior was ascertained under high pressure with the new model high-temperature rapid viscosity analyzer (RVA HT 4800), which is capable of reaching a maximum of 140 °C. Viscosity comparisons were then made with the profiles obtained at 95 °C and 140 °C. The microstructure had intact starch cells and was free of extraneous materials or fungal hyphae. The granule size range was found to be 1–1800 µM. It was established that the holding, final, and setback viscosities were most affected and decreased by at least 80% when the samples were subjected to the 140 °C HT profile. The peak time at 95 °C in yellow and white Garri samples of both brands averaged nine minutes, whereas it was 5 min at 140 °C profile. The white Garri samples tolerated the high temperature better based on breakdown viscosity values and may be used for making food products that require tolerance to high temperatures. An opportunity exists to re-evaluate different Garri varieties with the new model RVA to establish behavior at very high temperatures.

1. Introduction

Cassava (Manihot esculenta Crantz) is a starchy root tuber crop widely used as human food by more than 500 million people worldwide. It is a big source of animal feed and starch in industries globally [1,2]. It is regarded as the sixth most important crop in terms of global annual production [3] and is grown mainly for its starchy tuberous roots in subtropical Africa, Asia, and South America [4]. Cassava has a very high content of starch (70–85%) [5]. Due to its high nutritional value [6], it is regarded as an emerging dominant food [7] and is usually processed into different kinds of products like Garri granules, a food staple, which is consumed in many countries in Africa. Nigeria is reported to be the largest producer of cassava [8].
According to previous reports [9,10], Garri is produced by firstly harvesting cassava tubers or roots, after which it is peeled, washed, and grated to obtain the cassava mash. The mash is then fermented for up to three days or more, during which water is squeezed out. The mash is then sieved to remove large fibrous root material and then dried or fried to get whitish granules. Palm oil is added during frying or drying to get the yellow variety. Another round of sieving may be performed to get finer granules. The particle size of food flours is important because it correlates well with different flour granules, physicochemical composition and functionality. Several investigators have reported that particle size influences the thermal, pasting properties, nutritional makeup or hydration capacity of the flour granules from oats [11], rice [12], whole wheat [13], and grass pea [14]. Although a lot of improvements have been carried out in Garri processing such that there is increased mechanization. It is still largely regarded as an artisanal product even though the product is now packaged and sold internationally. One of the main methods of preparation of Garri for consumption in West Africa is mainly by adding hot water (100 °C) followed by mashing and cooling, which causes it to form a stiff dough. The final solid state can be adjusted by adding water if a less solid marsh is preferred. The prepared product is then consumed with a variety of soups or stew.
The heating, holding, cooling, and final holding stage during RVA analysis has been studied for decades and was recently reviewed [15]. It was highlighted that RVA remains a method of choice for measuring the viscosity of a sample over a given period. Most studies on the viscosity of the product presently [16,17] have been carried out by monitoring viscosity changes up to a maximum temperature of 95 °C. This is because this was the maximum temperature that could be obtained with the RVA (rapid viscosity analyzer) kits around the world. Additionally, most literature studies on the viscosity of different flours were performed with a maximum temperature of 95 °C. Recently, a new model high temperature (HT) rapid (RVA 4800) capable of performing viscosity analysis up to 140 °C was released into the market. This brings a new opportunity to establish how previously characterized flours can behave at a very high temperature. This will be particularly useful for food manufacturers that make their products under high-temperature conditions. To ascertain the effect of this new model type of analysis, Liu et al. [18] investigated the behavior of various types of starches. They found that the holding strength and final viscosity were reduced in waxy and normal starch. Moreover, the gel hardness and pasting viscosity were affected.
To the best of the authors’ knowledge, fermented Garri granules have not been characterized with the new high-temperature model RVA 4800. Hence, this study aimed to study the pasting properties of two varieties of Garri. The particle size and the microstructure of the Garri granules used were characterized, after which the pasting properties were established using the new model profile.

2. Materials and Methods

2.1. Source of Garri Samples

The Garri samples used were purchased from three different Afro-Asian shops. The sellers advised that the product is sourced from abroad in bulk by importers and then repacked in the United Kingdom. Five samples of three brands of Garri named brands A, B, and C were sourced. Brand A and B consisted of the yellow and white variety of Garri. In contrast, only the white type was available for Brand C. Brand A and C are sold across the United Kingdom and are of industrial grade packing, sealing, and clear labeling. In contrast, brand B is only sold in the shop it was purchased and is usually packed within the shop’s premises. Bulk purchases are broken down and packed in low-density polyethylene sheets sealed with an impulse sealer.

2.2. Particle Size Analysis

Seven standardized sieves of mesh sizes 106, 250, 355, 500, 700, 1000, and 4000 µM were used. The sieves were assembled, after which 200 g of material was placed at the top in a shaker (Retsch, Verder Scientific UK Ltd., Derbyshire, England), which was set to work constantly at an amplitude of 1.5 mm/g for 10 min. After shaking, the material retained on each sieve was weighed to determine granule size composition. To determine size distribution, which includes particles that were not intact granules (<50 µM), Garri particles were analyzed with a laser diffraction particle size analyzer (Beckman Coulter LS 13 320) that had a detection range of 0.35–2000 µM using the manufacturer’s guide. The kit was switched to tornado dry powder mode for solids, and the wavelength of the main illumination source was set at 750 nm. Measure offsets and backgrounds were set to measure for 30 s, and the run length was fixed at 60 s.

2.3. SEM Analysis

The granule size 250 µM fraction was used for SEM as performed in previous studies [19] with slight modification. The modification was that samples were examined with different equipment but with the same high vacuum conditions. Samples were observed without any pretreatment. The yellow or white Garri granules were fixed on stubs with the aid of double-sided adhesive conductive carbon tabs, after which they were coated with platinum for 90 s. Analysis was carried out with Quanta 650 FEG SEM (FEI Europe) under high vacuum mode to obtain a high-resolution image of the morphology and topography of the Garri samples. The kit has an accelerating voltage range of 200 V to 30 kV and a magnification range of 6 to 1,000,000×.

2.4. Rapid Viscosity Analysis

A suspension of 3 g of µM sized yellow or white Garri granules was prepared with 25 mL of sterile water, after which pasting properties were monitored up to a maximum of 95 or 140 °C using the manufacturer’s (RVA 4800 PerkinElmer LAS (UK)Ltd., Beaconsfield, Bucks HP9 2FX, England) standard profile for both scenarios. The properties monitored included peak viscosity (cP), holding strength (cP), breakdown viscosity (cP), final viscosity (cP), setback viscosity (cP), peak time (min), pasting temperature (°C). For viscosity behavior at maximum 95 °C, continuous shear was started at 960 rpm for 10 s and then maintained at 160 rpm after that. Beginning with an initial hold at 50 °C for 60 s, the maximum temperature of 95 °C was attained within 8.5 min and then subjected to a hold of five min at this peak temperature followed by linear cooling to 50 °C in 12 min.
For the viscosity profile at a maximum of 140 °C, the canister holding part of the equipment was decoupled and replaced with the high-temperature canisters and seals, which allows a pressure of up to 100 p.s.i. The mode of the equipment was switched to high-temperature analysis as per the manufacturer’s guide. Suspensions of Garri and water were subjected to the same initial shear rate and temperatures mentioned above. Heating was linear and was ramped up from 50 to 140 °C in 8.5 min and then held for three min before cooling linearly from 140 to 50 °C in 9.5 min.

2.5. Statistical Analysis

One way analysis of variance (ANOVA) of the peak viscosity, descriptive statistics, test for equality of variances (Levene’s), quantile-quantile (Q-Q) plot for normality, and post hoc (Tukey) comparisons were carried out using JASP statistical software version 0.16 (University of Amsterdam, Amsterdam, The Netherlands).

3. Results

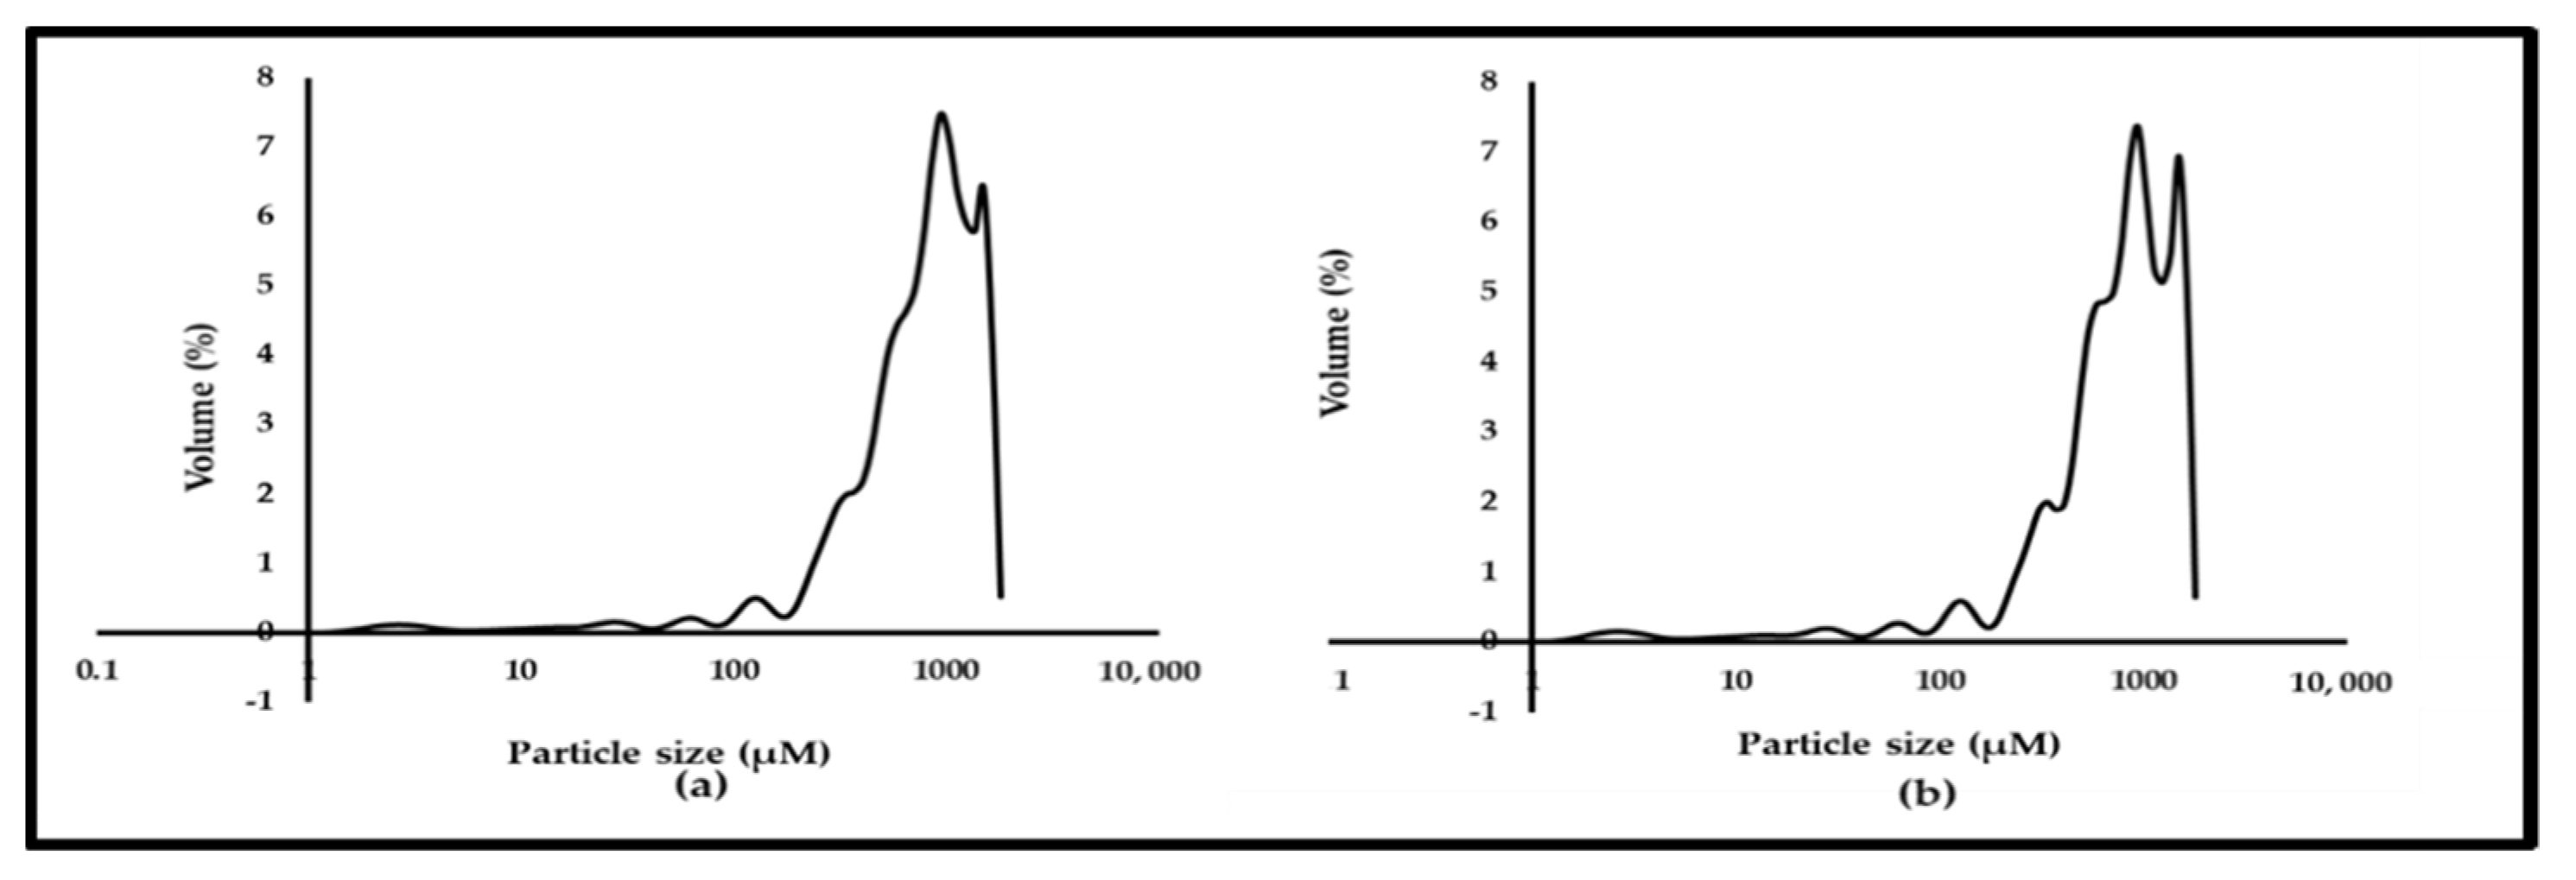
3.1. Particle Size Distribution

To get an overview of the particle distribution in the various brands of Garri samples, a set of mechanical sieves that ranged from 106–4000 µM were used. It was found that only brand B yellow and white Garri samples (Figure 1) had granules greater or equal to 4000 µM and had the highest amount retained on the 1000 µM sieve. For all samples, 70% of the granules were retained between the 500 and 1000 µM sieves. The white Garri variety retained more granules on the 1000 µM sieve than the yellow one. Since it was not possible to establish the smallest particle size in all samples with the mechanical sieves, granules were analyzed with a more sensitive laser diffraction particle analyzer. The distribution curve obtained is shown in Figure 2, and it was found that for all samples, the highest volume (about 7%) was for granule sizes of approximately 1000 µM. Overall, the particle size of Garri granules in this study ranged from 1–1800 µM.

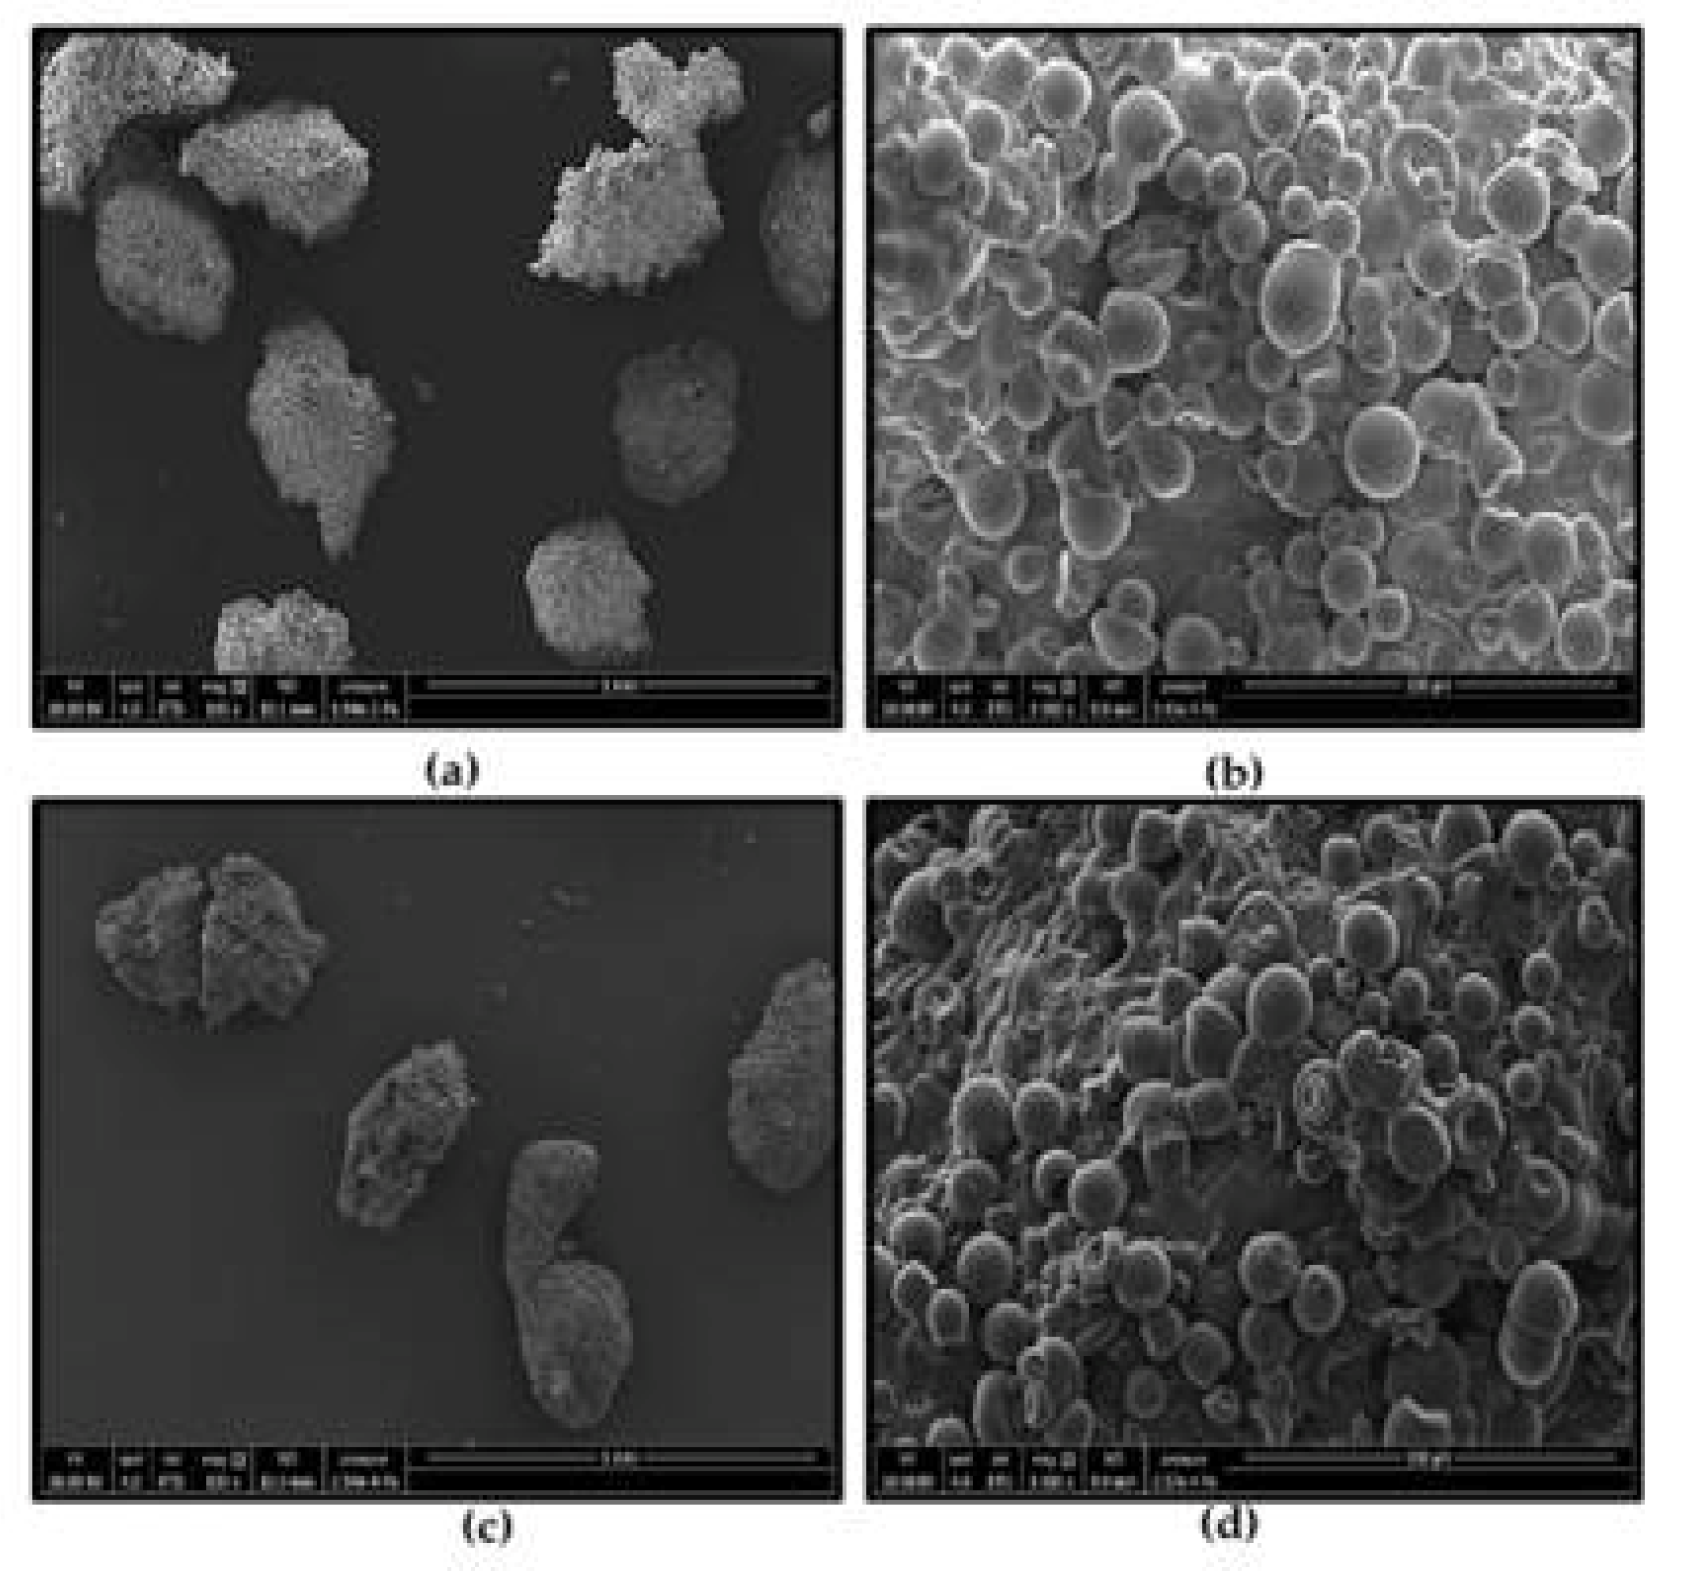
3.2. Microstructure of Yellow and White Garri

To gain more insights into the microstructure of the Garri particles, SEM was used to probe the structure of 106 µM granules of the yellow and white varieties. When yellow Garri (Figure 3a) was viewed at 100× magnification, a spongy appearance in clumps was observed, whereas under the 500× magnification (Figure 3b), intact Garri starchy granules were seen. The granules were mainly ellipsoidal, smooth, or spherically shaped. They were free of fungal hyphae or spores, indicating no significant fungi colonization and further fermentation during storage. The same observations were found for the white Garri variety at 100× (Figure 3c) and 500× (Figure 3d).

3.3. High-Temperature RVA Analysis

The effect of change in maximum temperatures on the pasting properties of the Garri samples was noted. In addition to analysis at a 95 °C temperature maximum profile normally performed for most RVA analysis, the HT 140 °C was also carried out to ascertain Garri granules (500 µM) behavior at very high temperature. The pasting curve of the Brands A and B yellow and white Garri samples at both temperature profiles is shown in Figure 4. At the lower temperature maximum (panels A and C), the standard classic RVA curve associated with starchy products was maintained, whereas, in panels B and D, the viscosity curve was altered directly under the cold temperature portion of the temperature curve. Moreover, it is indicated that gelatinization set in earlier in less than five minutes for samples ramped up to 140 °C (panels B and D). An examination and analysis of the actual data output showed that the holding, final, and setback viscosity were most affected and decreased by at least 80% when the samples were subjected to the 140 HT °C profile (Table 1). This level of decrease was consistent for all samples. Increases were observed for all samples in the breakdown viscosity, whereas the time to peak viscosity was reduced for all samples. The pasting temperature varied among the samples when the temperature was ramped up from 95 to 140 °C.
When the brand (A and B) pairs of yellow and white samples were compared (Table 1), it was found that peak viscosity was higher in white samples in both temperature profiles analyzed. Variations were found in the holding strength viscosity of both profiles because at 95 °C profile it was higher in white Garri granules of Brand A than the yellow samples, while it was vice versa at 140 °C. The breakdown, final, and setback viscosity were lower in the yellow samples of both brands at both temperature profiles. The peak time at 95 °C in yellow and white Garri samples of both brands averaged nine minutes, whereas it was 5 min at 140 °C profile. The pasting time was lower in white samples of both brands at both temperature profiles analyzed. There were significant peak viscosity differences (p < 0.001) between the three brands of Garri and between the temperature profiles used (Table A1 in Appendix A) after ANOVA analysis. The descriptive statistics are shown in Table A2, and the test assumptions of homogeneity of variance were not violated since Levene’s test (Table A3) was not significant (p < 0.150). Assumptions of normality were confirmed with the Q-Q plot (Figure A1), and no deviations were noted. The post hoc analysis with Tukey’s correction showed the detailed differences (most at p < 0.001) between brands and temperature profile used (Table A4).

4. Discussion

4.1. Particle Size of Yellow and White Garri

To ensure that the particle size does not greatly influence the pasting properties of the Garri granules analyzed during analysis at 95 or 140 °C maximum temperature profiles, characterization was carried out, after which one particle size (500 µM) was used for all the analysis. This satisfied the protocol outlined by the RVA 4800 kit manufacturers, which recommended using a particle size less than 1 mm to avoid problems with consistency. The range of particle size of the Garri granules is within the range found in other studies. An investigation [20] reported a range of 0.53 mm and 0.63 mm when Garri was manufactured with rotary driers and a larger size of 0.7 mm when a traditional fryer was used. In another study, Ahiakwo et al. [21] reported a range of 0.2–1.77 mm. The small amount of 4 mm samples in Brand B samples in this study indicates issues with the sieving of the freshly fermented marsh during processing. It could also be that the traditional fryer used was not very effective, which resulted in larger sizes, as pointed out in the aforementioned [20]. Furthermore, human error may also be a factor because the frying process in the manufacture of Garri requires constant stirring; otherwise, lumps may develop. Overall, the data in this study gives a complete range of Garri particle sizes and indicates that most samples in trade are below 2 mm.

4.2. Microstructure of Garri Granules

Cell intactness and the starch state impact hot swelling and cold pasting properties of starch material [22], and the nature of the starch granules can vary in size, shape, and smoothness of the surface due to its botanical origin [23]. To support the particle size characterization, cassava Garri granules were subjected to SEM analysis to confirm that the granules were intact and establish any qualitative discrepancies between the two types of the granules analyzed. The microstructure of yellow and white was typical of starch granules and showed no distortion that could reasonably impact the pasting properties of the Garri granules. The shape observed were similar to starch granules shown by others [24,25,26]. The fact that the granules were free of extraneous materials and fungal hyphae suggests that SEM could be a quality control tool for industrial Garri processing.

4.3. HT RVA 4800 Analysis

The new HT RVA 4800 is revolutionary in that researchers who have analyzed different granules for decades at a maximum temperature of 95 °C can now perform new studies by ramping up the temperature to up to 140 °C to gain more insights into the behaviors of flours at higher temperatures. The implication for new product development is huge as high thermal pasting investigations can be quickly carried out, facilitating manufacturing decisions. The main finding of this study was that at a temperature of 140 °C, the cassava (Garri) starch granules hold, final, and set back viscosity were drastically reduced by up to 80%. This agrees with the comprehensive work carried out by Liu et al. [18], where the behavior of several starches was investigated with the new model HT RVA 4800. Though Garri granules were not specifically analyzed in that study, a normal starch, tapioca, known to be obtained from cassava roots with 29% amylose, was analyzed, and an 87% reduction in hold viscosity was obtained. They attributed this phenomenon to thermal degradation and the thixotropic breakdown of starch molecules.
The tapioca starch’s peak viscosity and pasting temperature remained the same at 95 and 140 °C. The same trend was seen in this study for pasting temperature, but at 140 °C, the time to peak viscosity was reduced by an average of 40%. It has been demonstrated that peak viscosity correlates with peak time [27]. It is common knowledge that with increasing temperature in the presence of water, faster breakdown of intermolecular starch molecules occurs with loss of the partial crystalline structure, which causes the viscosity of the solution to increase. Hence, it is most likely that the shortened time to peak viscosity observed in samples analyzed at 140 °C is due to the high temperature. Lu et al. [28] reported that heat stress increased the swelling power of maize starch, while Rittenauer et al. [29] explained that starch under certain conditions could undergo rapid starch pasting and result in the generation of viscosity-increasing starch fragments. The full history of the tapioca starch used by Liu et al. [18] was not outlined, and that of Garri used in this study is unknown because the samples were purchased; hence it will be difficult to establish all factors that could definitively affect the peak time. Although two maximum temperature profiles were analyzed, the linear increase made it possible to have an overview of viscosity behavior between 95 and 140 °C (Figure 4). More detailed studies of temperature settings at a maximum of 110, 120, and 130 should be carried out to establish different degradation and pasting behaviors.
If new product development with Garri granules is required with high-temperature manipulation of the granules, then the observed changes in RVA cooking stages at 140 °C could be utilized. Of note is the setback viscosity of the Garri granules, which was lower at 140 °C. The setback viscosity indicates starch retrogradation when disaggregated amylose and amylopectin chains in a gelatinized starch mixture re-associate to form more ordered structures [30,31]. This is a desirable feature of food products like cereals; hence, the use of Garri for the development of such products may be better at 95 °C. However, the breakdown viscosity was found to be better at 140 °C. Since breakdown viscosity values indicate how quickly swollen starch granules can be disintegrated [32,33], we posit that the white Garri, in particular, may be used for making food products that require tolerance to high temperatures.

4.4. Factors That May Affect Garri Structure and Functionality at High Temperature

It appears that the palm oil added to cassava to produce the yellow variety affects the functionality of starch polymers. For some parameters, there was consistency in results in both varieties of Garri at both temperature profiles studied, but in some others, viscosity was lower in yellow than white Garri and vice versa. There will be the need to carry out more studies from farm to fork to ensure the full history of cassava granules can be verified. There is a consensus among many investigators that the final product may also depend on the local practices of the geographical region where the product is processed. Variation in pasting results of Garri or cassava granules is exemplified when the results in this study at 95 °C temperature profile are compared with other studies. The pasting temperature range (Table 1) is within the range reported by others [16,34] in Garri samples and raw starch from cassava [35,36]. However, this study’s time to peak viscosity was higher than the aforementioned Garri and cassava studies [16,35,36]. Variations may also come from starch differences between cultivars [37,38] and the fermentation period of the cassava marsh [39]. Fermentation normally affects the degrading of starch, and thus starch before and after fermentation are expected to behave differently. The effects of spontaneous and backstopped fermentation have been studied [16]. It was established that the production time for Garri production was reduced with an increase in quantity and no effect on quality.
The fact Garri granules are obtained by roasting before use makes it a pregelatinized product. A study [40] of pasting properties of pregelatinized starch after spray drying showed that good granule shape was maintained, but it became distorted when drum dried and had the low hot paste viscosity observed in this study. It was concluded that the methods used to obtain pregelatinized starch affected its flour product quality. Another study [41] pointed out that the short-range ordered molecular structure and crystalline structure of cassava starch can be disrupted in the presence of ultrasonic sound. The role of the crystalline and molecular structure of starch biofilms has been investigated [42], and it was found that degradation occurred faster in larger molecules. Other factors that can cause variation in starch properties include meteorological factors [43], planting conditions, methods of harvest, and processing, nutrient retention [44], and storage time [45]. Textural properties like mouldability or elasticity [46] and the evolution of microbiota [47] have also been mentioned as factors that can affect the behavior of starch molecules.

5. Conclusions

This study investigated the pasting profile of cassava Garri granules using the new model HT RVA 4800 capable of reaching a maximum temperature of 140 °C. In conclusion, the peak time, hold, and final viscosity decreased compared to the 95 °C profile, whereas the breakdown viscosity increased. Apart from knowledge gained on the behavior of Garri granules under a high temperature, there is an opportunity to re-characterize other flours studied for decades to ascertain where changes in viscosity at higher temperatures begin.

Author Contributions

Conceptualization, methodology, and investigation O.N.; validation, formal analysis, resources, data curation, O.N. and H.O.; writing—original draft preparation, writing—review and editing, O.N. and H.O. All authors have read and agreed to the published version of the manuscript.

Funding

This research received no external funding.

Data Availability Statement

Publicly available datasets were analyzed in this study. Data sets can be found here: doi: 10.17632/sbnw7dkmf9.1.

Acknowledgments

Authors acknowledge Tim Foster’s support.

Conflicts of Interest

The authors declare no conflict of interest.

Appendix A

Table A1. ANOVA-Viscosity.
CasesSum of SquaresdfMean SquareFp
Brand1.191 × 10 −791.323 × 10−6327.170<0.001
Residuals80,866.000204043.300
Note. Type III Sum of Squares.
Table A2. Descriptives-Viscosity.
BrandMeanSDN
Aw1404686.66798.6373
Aw954471.00026.5143
Ay1403251.00016.5233
Ay952982.33324.9873
Bw13529.00074.3443
Bw953696.00075.4393
By1402955.33368.1493
By952612.00076.9743
Cw1403954.00065.0233
Cw953619.00055.5703
Table A3. Test for Equality of Variances (Levene’s).
Fdf1df2p
1.7209.00020.0000.150
Figure A1. Q-Q Plot.
Fermentation 08 00089 g0a1
Table A4. Post Hoc Comparisons-Brand.
Mean DifferenceSEtptukey
Aw140Aw95215.66751.9194.1540.014
Ay1401435.66751.91927.652<0.001
Ay951704.33351.91932.827<0.001
Bw1401157.66751.91922.298<0.001
Bw95990.66751.91919.081<0.001
By1401731.33351.91933.347<0.001
By952074.66751.91939.960<0.001
Cw140732.66751.91914.112<0.001
Cw951067.66751.91920.564<0.001
Aw95Ay1401220.00051.91923.498<0.001
Ay951488.66751.91928.673<0.001
Bw140942.00051.91918.144<0.001
Bw95775.00051.91914.927<0.001
By1401515.66751.91929.193<0.001
By951859.00051.91935.806<0.001
Cw140517.00051.9199.958<0.001
Cw95852.00051.91916.410<0.001
Ay140Ay95268.66751.9195.1750.001
Bw140−278.00051.919−5.3550.001
Bw95−445.00051.919−8.571<0.001
By140295.66751.9195.695<0.001
By95639.00051.91912.308<0.001
Cw140−703.00051.919−13.540<0.001
Cw95−368.00051.919−7.088<0.001
Ay95Bw140−546.66751.919−10.529<0.001
Bw95−713.66751.919−13.746<0.001
By14027.00051.9190.5201.000
By95370.33351.9197.133<0.001
Cw140−971.66751.919−18.715<0.001
Cw95−636.66751.919−12.263<0.001
Bw140Bw95−167.00051.919−3.2170.095
By140573.66751.91911.049<0.001
By95917.00051.91917.662<0.001
Cw140−425.00051.919−8.186<0.765
Cw95−90.00051.919−1.733<0.001
Bw95By140740.66751.91914.266<0.001
By951084.00051.91920.879<0.001
Cw140−258.00051.919−4.9690.002
Cw9577.00051.9191.4830.884
By140By95343.33351.9196.613<0.001
Cw140−998.66751.919−19.235<0.001
Cw95−663.66751.919−12.783<0.001
By95Cw140−1342.00051.919−25.848<0.001
Cw95−1007.00051.919−19.396<0.001
Cw140Cw95335.00051.9196.452<0.001
Note. p-value adjusted for comparing a family of 10.

References

  1. Ferraro, V.; Piccirillo, C.; Pintado, M. Cassava (Manihot esculenta Crantz) and Yam (Discorea spp.) Crops and Their Derived Foodstuffs: Safety, Security and Nutritional Value. Crit. Rev. Food Sci. Nutr. 2016, 56, 2714–2727. [Google Scholar] [CrossRef] [PubMed]
  2. El-Sharkawy, M.A. Cassava biology and physiology. Plant Mol. Biol. 2004, 56, 481–501. [Google Scholar] [CrossRef] [PubMed]
  3. Burns, A.; Gleadow, R.; Cliff, J.; Zacarias, A.; Cavagnaro, T. Cassava: The Drought, War and Famine Crop in a Changing World. Sustainability 2010, 2, 3572–3607. [Google Scholar] [CrossRef] [Green Version]
  4. Chandrasekara, A.; Josheph Kumar, T. Roots and Tuber Crops as Functional Foods: A Review on Phytochemical Constituents and Their Potential Health Benefits. Int. J. Food Sci. 2016, 2016, 3631647. [Google Scholar] [CrossRef] [PubMed] [Green Version]
  5. Adejumo, O.; Okoruwa, V.; Abass, A.; Salman, K. Post-harvest technology change in cassava processing: A choice paradigm. Sci. Afr. 2020, 7, e00276. [Google Scholar] [CrossRef]
  6. Montagnac, J.A.; Davis, C.R.; Tanumihardjo, S.A. Nutritional Value of Cassava for Use as a Staple Food and Recent Advances for Improvement. Compr. Rev. Food Sci. Food Saf. 2009, 8, 181–194. [Google Scholar] [CrossRef]
  7. Bayata, A. Review on Nutritional Value of Cassava for Use as a Staple Food. Sci. J. Anal. Chem. 2019, 7, 83. [Google Scholar] [CrossRef] [Green Version]
  8. Ogbo, F.C.; Okafor, E.N. The resistant starch content of some cassava based Nigerian foods. Niger. Food J. 2015, 33, 29–34. [Google Scholar] [CrossRef] [Green Version]
  9. Adinsi, L.; Akissoé, N.; Escobar, A.; Prin, L.; Kougblenou, N.; Dufour, D.; Hounhouigan, D.J.; Fliedel, G. Sensory and physicochemical profiling of traditional and enriched gari in Benin. Food Sci. Nutr. 2019, 7, 3338–3348. [Google Scholar] [CrossRef] [Green Version]
  10. Laya, A.; Koubala, B.B.; Kouninki, H.; Nchiwan Nukenine, E. Effect of harvest period on the proximate composition and functional and sensory properties of gari produced from local and improved cassava (Manihot esculenta) varieties. Int. J. Food Sci. 2018, 2018, 6241035. [Google Scholar] [CrossRef] [PubMed] [Green Version]
  11. Gu, Y.; Qian, X.; Sun, B.; Ma, S.; Tian, X.; Wang, X. Nutritional composition and physicochemical properties of oat flour sieving fractions with different particle size. LWT 2022, 154, 112757. [Google Scholar] [CrossRef]
  12. Qin, W.; Lin, Z.; Wang, A.; Chen, Z.; He, Y.; Wang, L.; Liu, L.; Wang, F.; Tong, L.-T. Influence of particle size on the properties of rice flour and quality of gluten-free rice bread. LWT 2021, 151, 112236. [Google Scholar] [CrossRef]
  13. Bressiani, J.; Santetti, G.S.; Oro, T.; Esteres, V.; Biduski, B.; de Miranda, M.Z.; Gutkoski, L.C.; de Almeida, J.L.; Gularte, M.A. Hydration properties and arabinoxylans content of whole wheat flour intended for cookie production as affected by particle size and Brazilian cultivars. LWT 2021, 150, 111918. [Google Scholar] [CrossRef]
  14. Bala, M.; Handa, S.; Mridula, D.; Singh, R.K. Physicochemical, functional and rheological properties of grass pea (Lathyrus sativus L.) flour as influenced by particle size. Heliyon 2020, 6, e05471. [Google Scholar] [CrossRef] [PubMed]
  15. Balet, S.; Guelpa, A.; Fox, G.; Manley, M. Rapid Visco Analyser (RVA) as a Tool for Measuring Starch-Related Physiochemical Properties in Cereals: A Review. Food Anal. Methods 2019, 12, 2344–2360. [Google Scholar] [CrossRef]
  16. Awoyale, W.; Oyedele, H.; Adenitan, A.A.; Alamu, E.O.; Maziya-Dixon, B. Comparing the functional and pasting properties of gari and the sensory attributes of the eba produced using backslopped and spontaneous fermentation methods. Cogent Food Agric. 2021, 7, 1883827. [Google Scholar] [CrossRef]
  17. da Costa Nunes, E.; Uarrota, V.G.; Moresco, R.; Maraschin, M. Physico-chemical profiling of edible or sweet cassava (Manihot esculenta Crantz) starches from Brazilian germplasm. Food Biosci. 2021, 43, 101305. [Google Scholar] [CrossRef]
  18. Liu, S.; Yuan, T.Z.; Wang, X.; Reimer, M.; Isaak, C.; Ai, Y. Behaviors of starches evaluated at high heating temperatures using a new model of Rapid Visco Analyzer—RVA 4800. Food Hydrocoll. 2019, 94, 217–228. [Google Scholar] [CrossRef]
  19. Nwaiwu, O.; Lad, M.; Davis, A.; Foster, T.; Rees, C. Preliminary Analysis of Structure and Chemical Composition of Extracellular Polymeric Substance Produced by Listeria Monocytogen. In International Symposium on Problem of Listeriosis; Universidade Católica Portuguesa: Porto, Portugal, 2010; p. 144. [Google Scholar]
  20. Olaosebikan, Y.O.; Aregbesola, O.A.; Sanni, L.A. Assessment of Quality of Garri Produced from a Conductive Rotary Dryer. Food Sci. Qual. Manag. 2016, 50, 94–102. [Google Scholar]
  21. Ahiakwo, A.A.; Simonyan, K.J.; Eke, A.B. Effects of sieve aperture modification on dewatered cassava mash sieving process. Niger. J. Technol. 2019, 38, 512. [Google Scholar] [CrossRef]
  22. Noordraven, L.E.C.; Bernaerts, T.; Mommens, L.; Hendrickx, M.E.; Van Loey, A.M. Impact of cell intactness and starch state on the thickening potential of chickpea flours in water-flour systems. LWT 2021, 146, 111409. [Google Scholar] [CrossRef]
  23. Jane, J.-L.; Kasemsuwan, T.; Leas, S.; Zobel, H.; Robyt, J.F. Anthology of Starch Granule Morphology by Scanning Electron Microscopy. Starch-Stärke 1994, 46, 121–129. [Google Scholar] [CrossRef]
  24. Monroy, Y.; Rivero, S.; García, M.A. Microstructural and techno-functional properties of cassava starch modified by ultrasound. Ultrason. Sonochem. 2018, 42, 795–804. [Google Scholar] [CrossRef] [PubMed]
  25. He, R.; Fu, N.-F.; Chen, H.-M.; Ye, J.-Q.; Chen, L.-Z.; Pu, Y.-F.; Zhang, W.-M. Comparison of the structural characterizatics and physicochemical properties of starches from sixteen cassava germplasms cultivated in China. Int. J. Food Prop. 2020, 23, 693–707. [Google Scholar] [CrossRef] [Green Version]
  26. Oyeyinka, S.A.; Adeloye, A.A.; Olaomo, O.O.; Kayitesi, E. Effect of fermentation time on physicochemical properties of starch extracted from cassava root. Food Biosci. 2020, 33, 100485. [Google Scholar] [CrossRef]
  27. Higley, J.S.; Love, S.L.; Price, W.J.; Nelson, J.E.; Huber, K.C. The Rapid Visco Analyzer (RVA) as a tool for differentiating potato cultivars on the basis of flour pasting properties. Am. J. Potato Res. 2003, 80, 195–206. [Google Scholar] [CrossRef]
  28. Lu, D.; YANG, H.; SHEN, X.; LU, W. Effects of high temperature during grain filling on physicochemical properties of waxy maize starch. J. Integr. Agric. 2016, 15, 309–316. [Google Scholar] [CrossRef] [Green Version]
  29. Rittenauer, M.; Gladis, S.; Gastl, M.; Becker, T. Gelatinization or Pasting? The Impact of Different Temperature Levels on the Saccharification Efficiency of Barley Malt Starch. Foods 2021, 10, 1733. [Google Scholar] [CrossRef] [PubMed]
  30. Wang, S.; Li, C.; Copeland, L.; Niu, Q.; Wang, S. Starch Retrogradation: A Comprehensive Review. Compr. Rev. Food Sci. Food Saf. 2015, 14, 568–585. [Google Scholar] [CrossRef]
  31. Chang, Q.; Zheng, B.; Zhang, Y.; Zeng, H. A comprehensive review of the factors influencing the formation of retrograded starch. Int. J. Biol. Macromol. 2021, 186, 163–173. [Google Scholar] [CrossRef]
  32. Oke, M.O.; Bolarinwa, I.F. Effect of Fermentation on Physicochemical Properties and Oxalate Content of Cocoyam (Colocasia esculenta) Flour. ISRN Agron. 2012, 2012, 978709. [Google Scholar] [CrossRef] [Green Version]
  33. Kaur, M.; Singh, N. Studies on functional, thermal and pasting properties of flours from different chickpea (Cicer arietinum L.) cultivars. Food Chem. 2005, 91, 403–411. [Google Scholar] [CrossRef]
  34. Alozie, Y.E.; Ndaeyo, E.N. Proximate Compositions, Physicochemical and Sensory Properties of Gari Fortified with Soybean, Melon Seed and Moringa Seed Flours. Int. J. Nutr. Food. Sci. 2017, 6, 105–110. [Google Scholar] [CrossRef] [Green Version]
  35. Zhang, Y.; Nie, L.; Sun, J.; Hong, Y.; Yan, H.; Li, M.; You, X.; Zhu, L.; Fang, F. Impacts of Environmental Factors on Pasting Properties of Cassava Flour Mediated by Its Macronutrients. Front. Nutr. 2020, 7, 272. [Google Scholar] [CrossRef]
  36. Chisenga, S.M.; Workneh, T.S.; Bultosa, G.; Laing, M. Characterization of physicochemical properties of starches from improved cassava varieties grown in Zambia. AIMS Agric. Food 2019, 4, 939–966. [Google Scholar] [CrossRef]
  37. Devi, A.; Sindhu, R.; Khatkar, B.S. Morphological, pasting, and textural characterization of starches and their sub fractions of good and poor cookie making wheat varieties. J. Food Sci. Technol. 2019, 56, 846–853. [Google Scholar] [CrossRef]
  38. Kumar, R.; Khatkar, B.S. Thermal, pasting and morphological properties of starch granules of wheat (Triticum aestivum L.) varieties. J. Food Sci. Technol. 2017, 54, 2403–2410. [Google Scholar] [CrossRef] [PubMed]
  39. Ukhun, M.; Nkwocha, F. The hydrocyanic acid (HCN) content of garri flour made from cassava (Manihot spp.) and the influence of length of fermentation and location of source. Food Chem. 1989, 33, 107–113. [Google Scholar] [CrossRef]
  40. Ma, H.; Liu, M.; Liang, M.; Zheng, X.; Sun, L.; Dang, W.; Li, J.; Li, L.; Liu, C. Research progress on properties of pre-gelatinized starch and its application in wheat flour products. Grain Oil Sci. Technol. 2022; in press. [Google Scholar] [CrossRef]
  41. Wang, X.; Hongwei, W.; Song, J.; Zhang, Y.; Zhang, H. Understanding the structural characteristics, pasting and rheological behaviours of pregelatinised cassava starch. Int. J. Food Sci. Technol. 2018, 53, 2173–2180. [Google Scholar] [CrossRef]
  42. Li, M.; Witt, T.; Xie, F.; Warren, F.J.; Halley, P.J.; Gilbert, R.G. Biodegradation of starch films: The roles of molecular and crystalline structure. Carbohydr. Polym. 2015, 122, 115–122. [Google Scholar] [CrossRef] [PubMed] [Green Version]
  43. Siloko, I.U.; Ukhurebor, K.E.; Siloko, E.A.; Enoyoze, E.; Bobadoye, A.O.; Ishiekwene, C.C.; Uddin, O.O.; Nwankwo, W. Effects of some meteorological variables on cassava production in Edo State, Nigeria via density estimation. Sci. Afr. 2021, 13, e00852. [Google Scholar] [CrossRef]
  44. Bechoff, A.; Tomlins, K.I.; Chijioke, U.; Ilona, P.; Westby, A.; Boy, E. Physical losses could partially explain modest carotenoid retention in dried food products from biofortified cassava. PLoS ONE 2018, 13, e0194402. [Google Scholar] [CrossRef] [PubMed] [Green Version]
  45. Kayode, B.I.; Kayode, R.M.O.; Abiodun, O.A.; Nwosu, C.; Karim, O.R.; Oyeyinka, S.A. Chemical, functional and physicochemical properties of flour from cassava stored under freezing. J. Stored Prod. Res. 2021, 92, 101816. [Google Scholar] [CrossRef]
  46. Ndjouenkeu, R.; Ngoualem Kegah, F.; Teeken, B.; Okoye, B.; Madu, T.; Olaosebikan, O.D.; Chijioke, U.; Bello, A.; Oluwaseun Osunbade, A.; Owoade, D.; et al. From cassava to gari: Mapping of quality characteristics and end-user preferences in Cameroon and Nigeria. Int. J. Food Sci. Technol. 2021, 56, 1223–1238. [Google Scholar] [CrossRef]
  47. Marcos Valle, F.J.; Castellari, C.; Yommi, A.; Pereyra, M.A.; Bartosik, R. Evolution of grain microbiota during hermetic storage of corn (Zea mays L.). J. Stored Prod. Res. 2021, 92, 101788. [Google Scholar] [CrossRef]
Figure 1. Granule size distribution (%) after sieving of yellow (y) and white (w) Garri brands (A, B, C). The percentage shown is the quantity that was retained on each sieve ( Fermentation 08 00089 i001 = ≥ 1000 μM; Fermentation 08 00089 i002 = ≥ 710 μM; Fermentation 08 00089 i003 = ≥ 500 μM; Fermentation 08 00089 i004 = ≥ 355 μM; Fermentation 08 00089 i005 = ≥ 250 μM; Fermentation 08 00089 i006 = ≥ 106 μM; Fermentation 08 00089 i007 = ≥ 4000 μM). Sieving was carried out with a set of sieves under automated shaking.
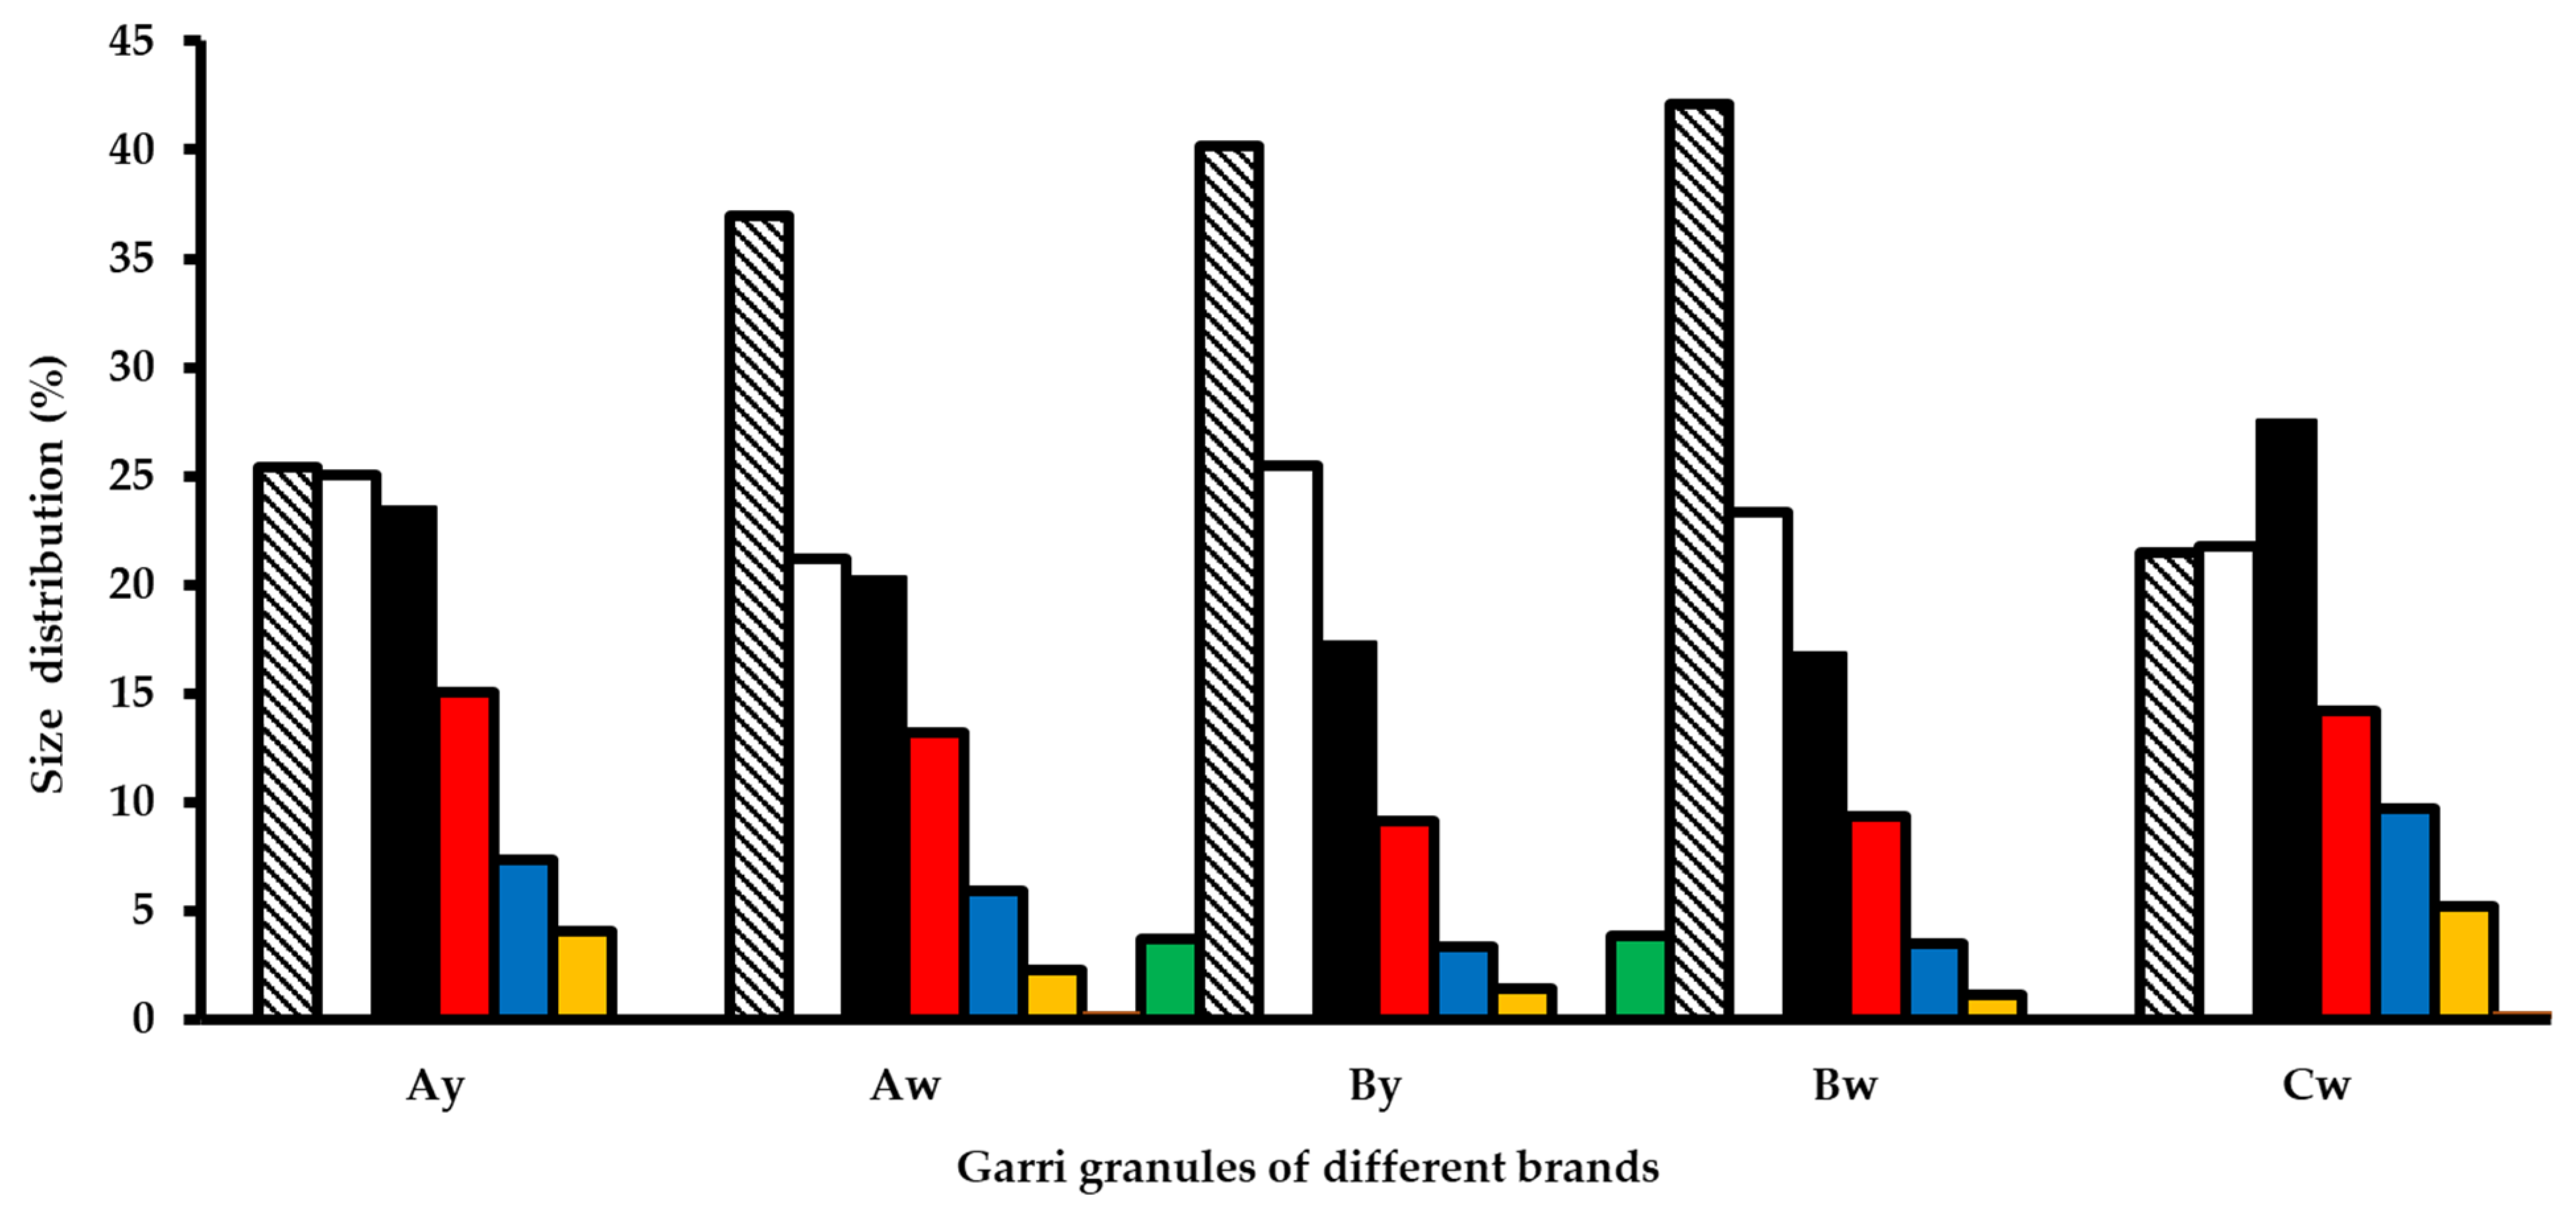
Fermentation 08 00089 g001
Figure 2. Representative brand A Garri samples particle size curve for yellow (a) and white (b) after analysis with laser diffraction analyzer.
Fermentation 08 00089 g002
Figure 3. SEM images of brand A Garri granules before analysis. Micrographs show yellow Garri at 100× (a) and 500× (b) magnification. White Garri samples are also shown at the same magnifications 100× (c) and 500× (d).
Fermentation 08 00089 g003
Figure 4. The pasting curve of the Brand A –yellow Garri at a maximum temperature of 95 °C (A) and 140 °C (B). The profile of the white variety of the same brand at 95 °C maximum temperature is shown in panel (C), whereas the profile of 140 °C is shown in panel (D).
Fermentation 08 00089 g004
Table 1. RVA parameters for Garri samples. Analysis was carried out under two temperature maximums of 95 and 140 °C to determine the holding strength, breakdown, final, peak, and set back viscosities. The peak time and pasting temperature were also ascertained (Y = yellow Garri; w = white Garri).
ParameterBrand A-yBrand A-wBrand B-yBrand B-wBrand C-w
Peak viscosity (cP)
95 °C profile2982 ± 24.994471 ± 26.512612 ± 76.973696 ± 75.433619 ± 55.56
140 °C profile3251 ± 16.524666 ± 98.642955 ± 68.153529 ± 74.343954 ± 65.02
Difference (%)9513−59
Holding strength (cP)
95 °C2180 ± 79.192786 ± 80.312054 ± 97.132037 ± 42.572051 ± 66.09
140 °C346 ± 8.19327 ± 7.09262 ± 16.70305 ± 16.17304 ± 15.18
Difference (%)−84−88−87−85−85
Breakdown viscosity (cP)
95 °C802 ± 59.231684 ± 60.01558 ± 28.611659 ± 86.431568 ± 60.12
140 °C2905 ± 20.524360 ± 75.732693 ± 71.143224 ± 63.613650 ± 80.03
Difference (%)26215938394193
Final viscosity (cP)
95 °C3166 ± 61.704818 ± 57.002793 ± 26.903936 ± 33.713698 ± 87.50
140 °C867 ± 41.43933 ± 9.71707 ± 22.19752 ± 26.10824 ± 20.52
Difference (%)−73−81−75−81−78
Setback viscosity (cP)
95 °C986 ± 60.342032 ± 73.52739 ± 72.101899 ± 56.661647 ± 65.33
140 °C521 ± 48.91606 ± 6.08445 ± 29.30448 ± 34.43520 ± 20.90
Difference (%)−47−70−40−76−68
Peak time (min)
95 °C9.49 ± 0.039.44 ± 0.1110.33 ± 0.069.76 ± 00.128.37 ± 00.13
140 °C5.44 ± 0.225.77 ± 0.116.0 ± 0.025.85 ± 0.035.40 ± 0.17
Difference (%)−43−39−42−40−35
Pasting temperature (°C)
95 °C82.62 ± 01.2676.51 ± 0.4590.16 ± 0.6074.12 ± 0.2771.60 ± 00.48
140 °C76.46 ± 00.1075.50 ± 0.4091.00 ± 0.2877.23 ± 0.1777.37 ± 0.44
Difference (%)−7−1−148
Publisher’s Note: MDPI stays neutral with regard to jurisdictional claims in published maps and institutional affiliations.

