Article

Preventing Overflow Metabolism in Crabtree-Positive Microorganisms through On-Line Monitoring and Control of Fed-Batch Fermentations

Institute of Chemical Technologies, HES-SO—Haute école d’ingénierie et d’architecture Fribourg, Boulevard de Pérolles 80, CH-1700 Fribourg, Switzerland
*
Author to whom correspondence should be addressed.
Fermentation 2018, 4(3), 79; https://doi.org/10.3390/fermentation4030079
Submission received: 30 August 2018 / Revised: 14 September 2018 / Accepted: 15 September 2018 / Published: 18 September 2018
(This article belongs to the Special Issue Bioprocess and Fermentation Monitoring)

Abstract

:
At specific growth rates above a particular critical value, Crabtree-positive microorganisms exceed their respiratory capacity and enter diauxic growth metabolism. Excess substrate is converted reductively to an overflow metabolite, resulting in decreased biomass yield and productivity. To prevent this scenario, the cells can be cultivated in a fed-batch mode at a growth rate maintained below the critical value, µcrit. This approach entails two major challenges: accurately estimating the current specific growth rate and controlling it successfully over the course of the fermentation. In this work, the specific growth rate of S. cerevisiae and E. coli was estimated from enhanced on-line biomass concentration measurements obtained with dielectric spectroscopy and turbidity. A feedforward-feedback control scheme was implemented to maintain the specific growth rate at a setpoint below µcrit, while on-line FTIR measurements provided the early detection of the overflow metabolites. The proposed approach is in line with the principles of Bioprocess Analytical Technology (BioPAT), and provides a means to increase the productivity of Crabtree-positive microorganisms.

1. Introduction

The shift from a purely respiratory to a fermentative metabolism in Crabtree-positive facultative anaerobic microorganisms occurs in oxygen-limited conditions or in response to the presence of excess carbon substrates saturating the respiratory bottleneck. Many strains of the primary hosts used in the industrial production of recombinant protein, bioproducts or biofuels, including Escherichia coli and Saccharomyces cerevisiae, undergo the Crabtree effect and produce various overflow metabolites. The restricted respiratory capacity of Crabtree-positive strains and the resulting overflow metabolism can have significant implications in terms of inhibited growth, decreased productivity, and suboptimal product quality [1,2,3,4,5,6].
Overcoming the drawbacks related to the Crabtree effect usually involves the implementation of fed-batch cultures, where either the carbon substrate concentration [6,7], the undesired overflow metabolite itself [8,9], or the specific growth rate [3,4,5,10] are maintained below a certain critical value. For this reason, among others, fed-batch cultures have become an important and widely applied production strategy in bioprocessing [1,11]. The major challenge of controlled fed-batch cultivations lies in selecting a suitable on-line monitoring technique for the appropriate control variable and in developing an effective control strategy with sufficient simplicity and robustness to render industrial implementation feasible [11].
Controlling the specific growth rate (µ) is particularly interesting because product formation is often strongly related to the growth profile of the biomass [2,5,12,13]. Thus, apart from managing overflow metabolism, this approach can also contribute to an overall process optimization. Since μ cannot be measured directly, its value must be derived in real-time from other on-line measurements such as the oxygen uptake rate (OUR) [3,5], heat produced by the cells (calorimetry) [4,14,15], or biomass concentration estimations [2,10,16]. The resulting on-line specific growth rate signal is often oscillatory and very noisy, which leads to controller performance issues. In addition, the inherent nonlinear nature of bioprocesses makes it difficult to apply traditional control algorithms such as the proportional-integral-derivative (PID) controller without an appropriate adaptation mechanism [5,10,12].
In a previous study, Dabros et al. [10] implemented a simple and robust feedforward-feedback control scheme designed to run fed-batch microbial cultures at different values of the specific growth rate. The methodology was developed with Kluyveromyces marxianus and then tested on several other yeast strains to confirm robustness and general applicability. In this work, this methodology was applied to fed-batch cultures of Crabtree-positive microbial strains with the aim to maximize the growth rate while preventing overflow metabolism from occurring. Specific growth rate was estimated in real-time from the on-line biomass concentration measurements obtained with dielectric (capacitance) spectroscopy and with a turbidity probe. In parallel, a Fourier-transfer mid-infrared (FTIR) spectrometer was used to detect the formation of the overflow metabolite and to establish the critical growth rate threshold, µcrit, below which the cells must to be cultivated to minimize the Crabtree effect. Two organisms, Saccharomyces cerevisiae and Escherichia coli, were studied to assess the effectiveness of the proposed control strategy.

2. Materials and Methods

2.1. Cell Strains and Culture Conditions

The wild-type organisms used in this study were the CBS 8066 strain of S. cerevisiae and the B and K12 strains of E. coli. The culture inoculum was obtained by suspending source cells in a one-liter Erlemneyer flask containing 100 mL of a sterile, complex pre-culture medium (20 g/L glucose, 10 g/L yeast extract and 10 g/L peptone) and incubating the flask for 24 h at 200 rpm and 30 °C for S. cerevisiae and 37 °C for E. coli. The pre-culture was then centrifuged, the supernatant medium was removed, and the cells were re-suspended in a sterile solution of 9 g/L NaCl for inoculation.
The cultures were grown in controlled temperature and pH conditions (30 °C and pH 5 for S. cerevisiae; 37 °C and pH 7 for E. coli) in a 3.7-liter, fully automated benchtop bioreactor (KLF, Bioengineering AG, Wald, Switzerland). Aeration was set between 1.0 and 1.6 vvm and dissolved oxygen was monitored to ensure sufficient oxygenation throughout the process. A 2 M KOH solution was used for pH control; no acid control was necessary. A sterile 1.5% solution of silicone was used for antifoam control. The cells were first grown in the batch mode until depletion of the carbon source, at which point the fed-batch mode was initiated. The peristaltic pump used to add the feed medium was controlled by LabVIEW (National Instruments, Austin, TX, USA). Table 1 outlines the composition of the batch and feed media, which were sterilized by filtration and adjusted to the desired pH prior to inoculation.
Samples were taken at regular intervals for off-line reference analysis. Biomass concentration was measured using optical density (at 600 nm) and confirmed with dry cell weight measurements. In the S. cerevisiae experiments, glucose and ethanol were quantified by HPLC (Agilent 1100 Series) with a refractive index (RI) detector, maintained at 60 °C, and an ion exchange chromatography column (Supelco H 9 μm, 300 mm × 4.6 mm). The mobile phase was composed of a 0.02 M H2SO4 solution made with MilliQ water with a flow rate of 0.6 mL/min. In the E. coli experiments, glucose was quantified by HPLC (Thermo Ultimate 3000) with an evaporative light scattering detector (ELSD), maintained at 50 °C, and a Prevail Carbohydrates ES 5 μm, 150 mm × 4.6 mm column. The mobile phase was composed of acetonitrile–MilliQ water (75:25) with a flow rate of 1 mL/min. Acetate was determined with an automated enzymatic analyzer (Cedex Bio Analyzer, Roche, Basel, Switzerland).

2.2. On-Line Process Monitoring

Biomass concentration was measured on-line using dielectric (capacitance) spectroscopy (FUTURA, ABER Instruments, Aberystwyth, UK) and turbidity (DENCITEE, Hamilton, Bonaduz, Switzerland). The dielectric instrument was equipped with a 12 mm in situ probe. A linear calibration was established based on prior experiments between the biomass dry cell weight and dual-frequency capacitance values obtained at 10 MHz and 500 kHz for S. cerevisiae and 15 MHz and 100 kHz for E. coli, respectively. The turbidity instrument, also equipped with a 12 mm in situ probe, measured optical density at 880 nm. This signal was also correlated linearly to off-line dry biomass weight measurements.
Medium components (glucose, ethanol, acetate, ammonium, phosphates, yeast extract, and peptone) were monitored on-line using a Fourier-transform mid-infrared (FTIR) spectrometer (MATRIX-MF, Bruker Optics, Fällanden, Switzerland). The instrument was calibrated using 49 synthetic standards prepared according to a 7-level multivariate design proposed by Muñoz and Brereton [17]. A PLS model was built using MATLAB (The MathWorks Inc., Natick, MA, USA) and optimized with respect to the spectral range and the number of principal components used for each analyte.

2.3. Specific Growth Rate Estimator

The instantaneous specific growth rate, μ(t), was estimated from the on-line biomass concentration measurements, X(t), which were obtained with either the dielectric or the turbidity probe. Assuming ideal exponential growth dynamics, the following equation was used to estimate μ(t):
  μ ( t ) = l n ( X ( t ) / X ( t Δ t ) ) Δ t  
The time interval, Δt, was adjusted by striking a compromise between maximizing noise reduction while minimizing signal delay. Typically, a 20-min interval was used for the capacitance measurements and a 6-min interval was used for the turbidity signal.

2.4. Control Strategy

The control strategy was based on the feedforward-feedback controller design proposed by Dabros et al. [10]. The feedforward part of the controller provides the baseline feed profile, FFF(t), by reflecting the exponential cell growth:
  F F F ( t ) = F 0 e x p ( μ s p t )  
The initial flow rate is given by:
  F 0 = X 0 V 0 μ s p Y X / S 1 S F  
where X0 and V0 are the biomass concentration and reactor volume at the start of the fed-batch mode, respectively; YX/S is the biomass-to-substrate mass yield; and SF is the substrate concentration in the feed solution.
The feedback component is a variation on the classical proportional-integral (PI) controller, where the proportional and integral terms are included in the exponential term to account for the exponentially evolving system dynamics. The function of the feedback module is to correct for any deviation of the instantaneous specific growth rate (μ(t)) from the current setpoint, μsp(t). The complete feedforward-feedback control law is expressed by the following equation:
  F ( t ) = F 0 e x p ( ( μ s p ( t ) + K p ε ( t ) + K i 0 t ε ( t ) dt ) t )  
Here, ε(t) is the tracking error equal to μsp(t)-μ(t), and Kp and Ki are the proportional and integral controller gains, respectively. The values of the gains were chosen experimentally following manual tuning methods.

2.5. Implementation and Methodology

As outlined above, in each culture, the cells were first grown in the batch mode until depletion of the carbon source, at which point the fed-batch mode was initiated. During the fed-batch stage, the cells were grown at different setpoint values of the specific growth rate, with the feedforward or the feedforward-feedback controller regulating the feed flow rate. The principal aims of the experiments were to determine the critical growth rate at which the overflow metabolite made its appearance and to show that by running the process below µcrit, overflow metabolism could be avoided. Finally, the biomass-to-substrate mass yield was calculated at each specific growth rate setpoint.

3. Results and Discussion

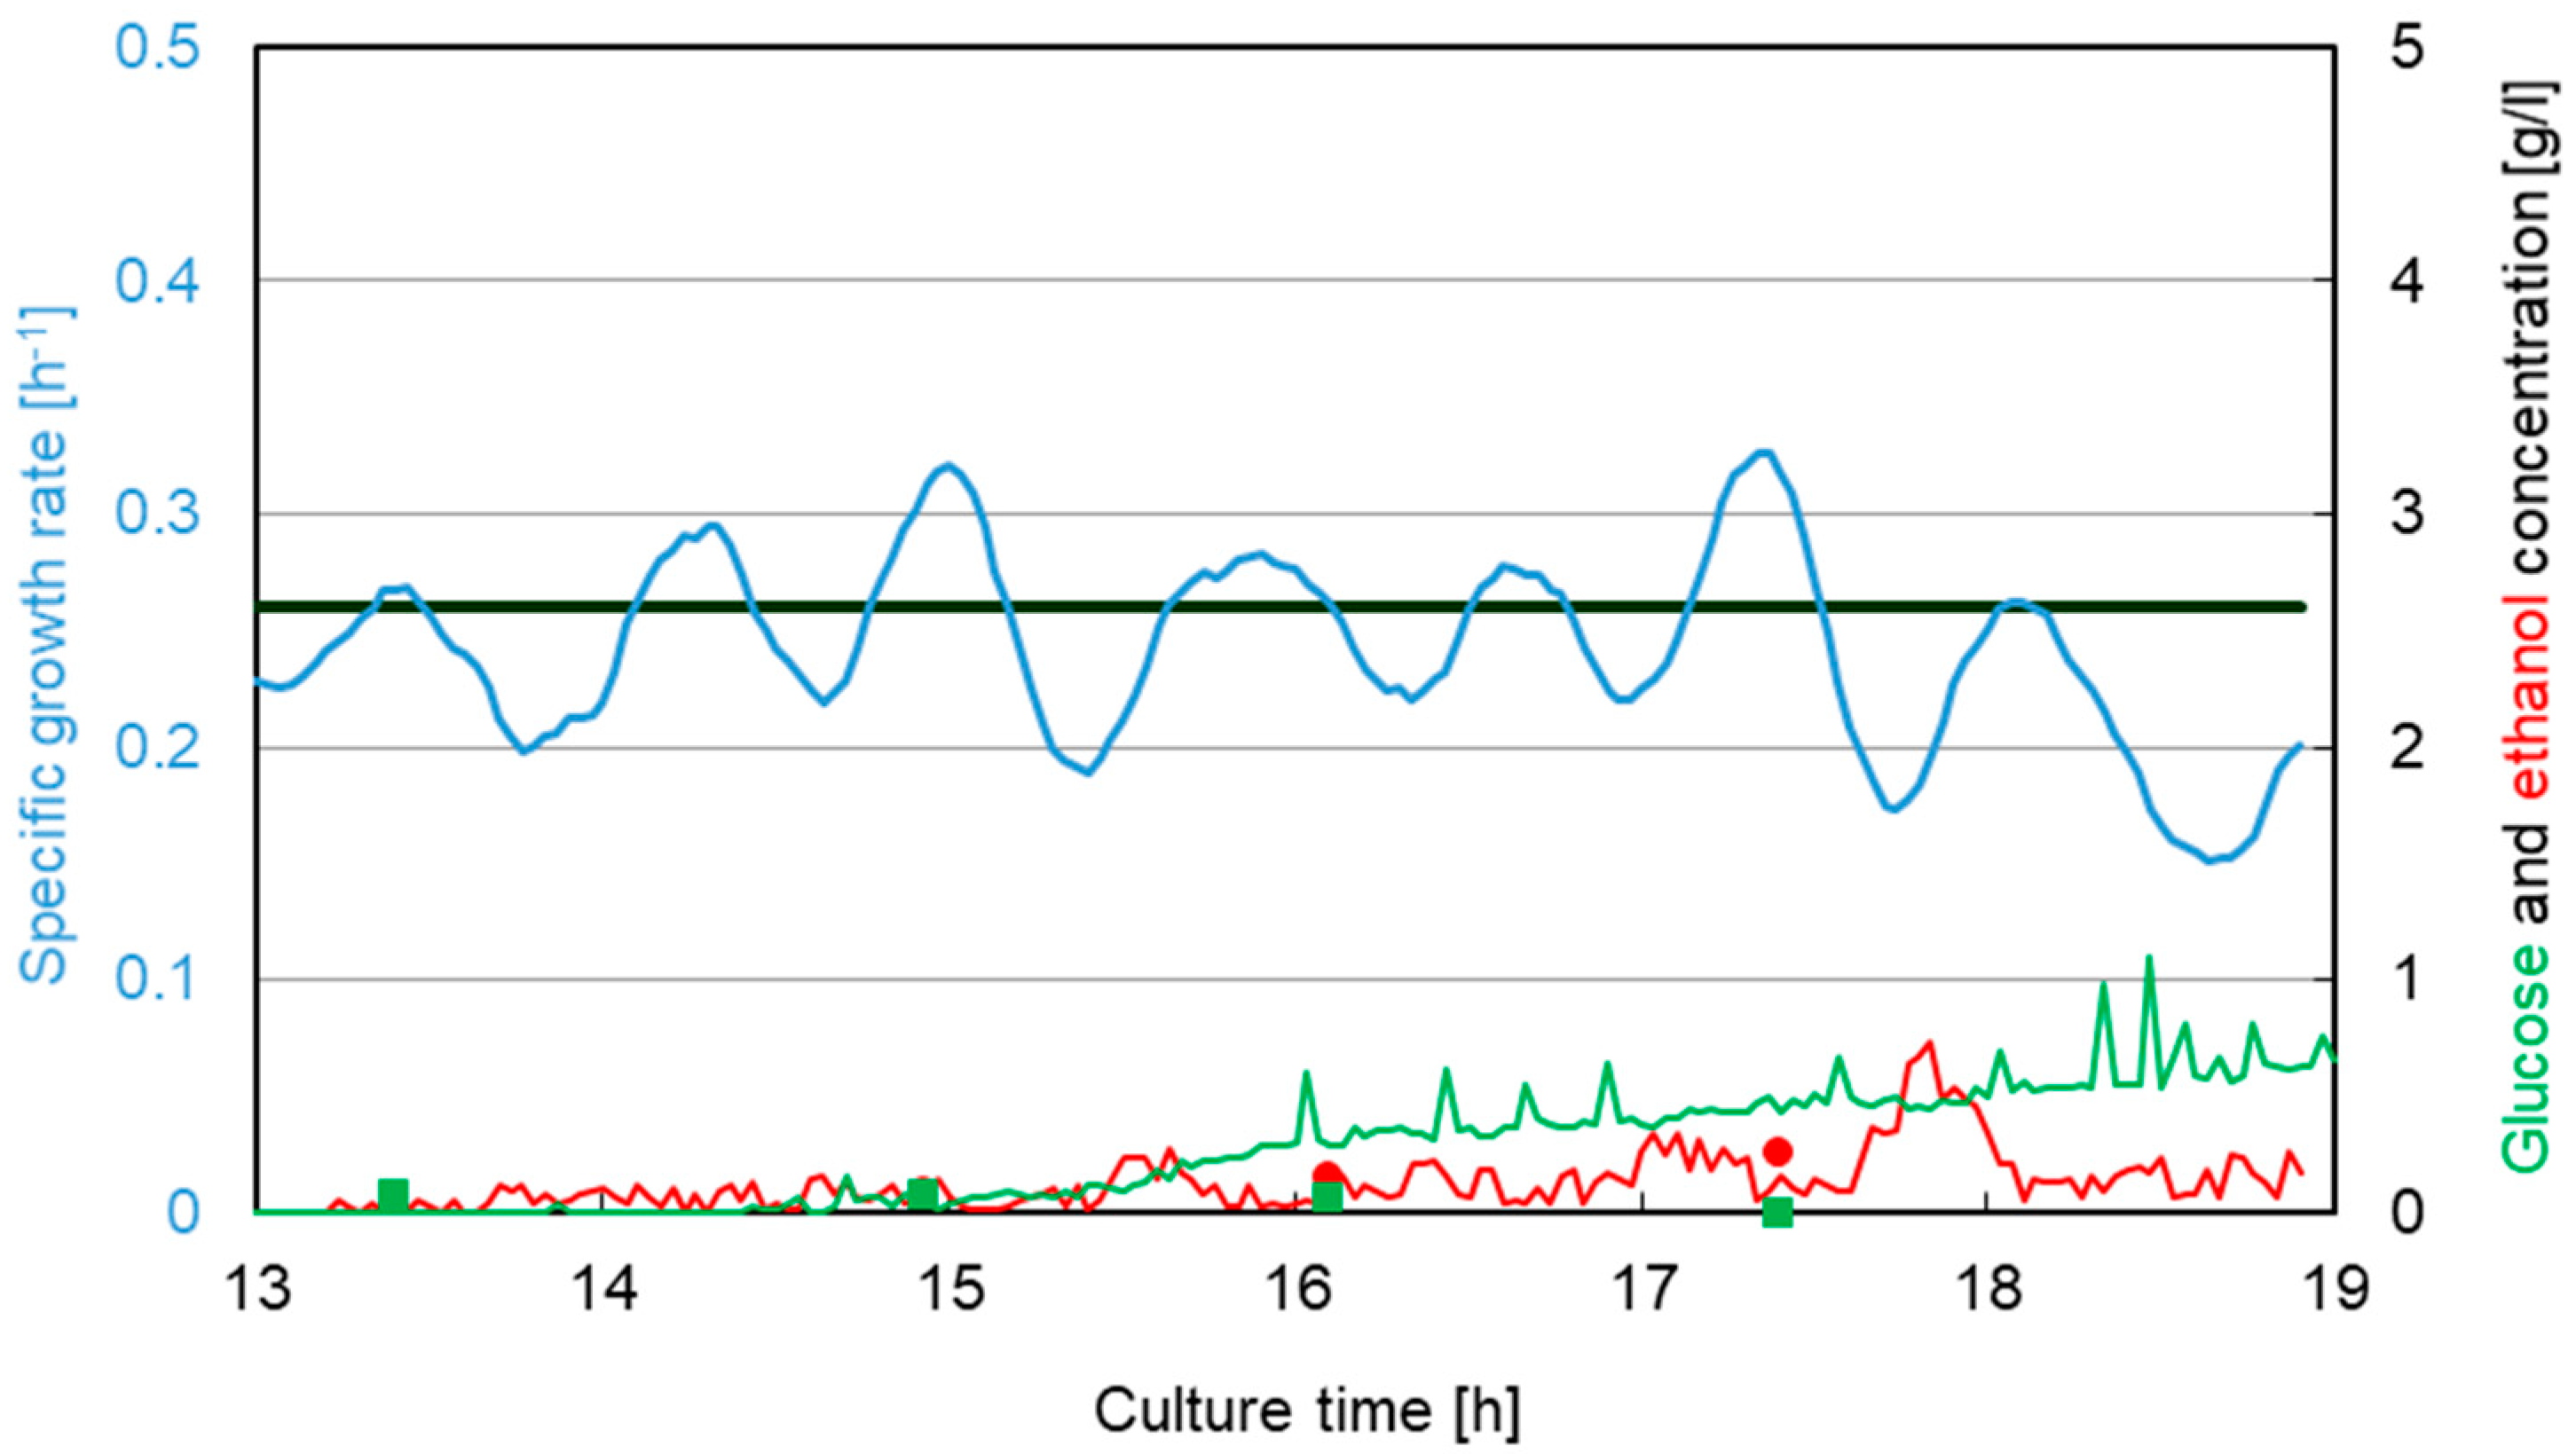
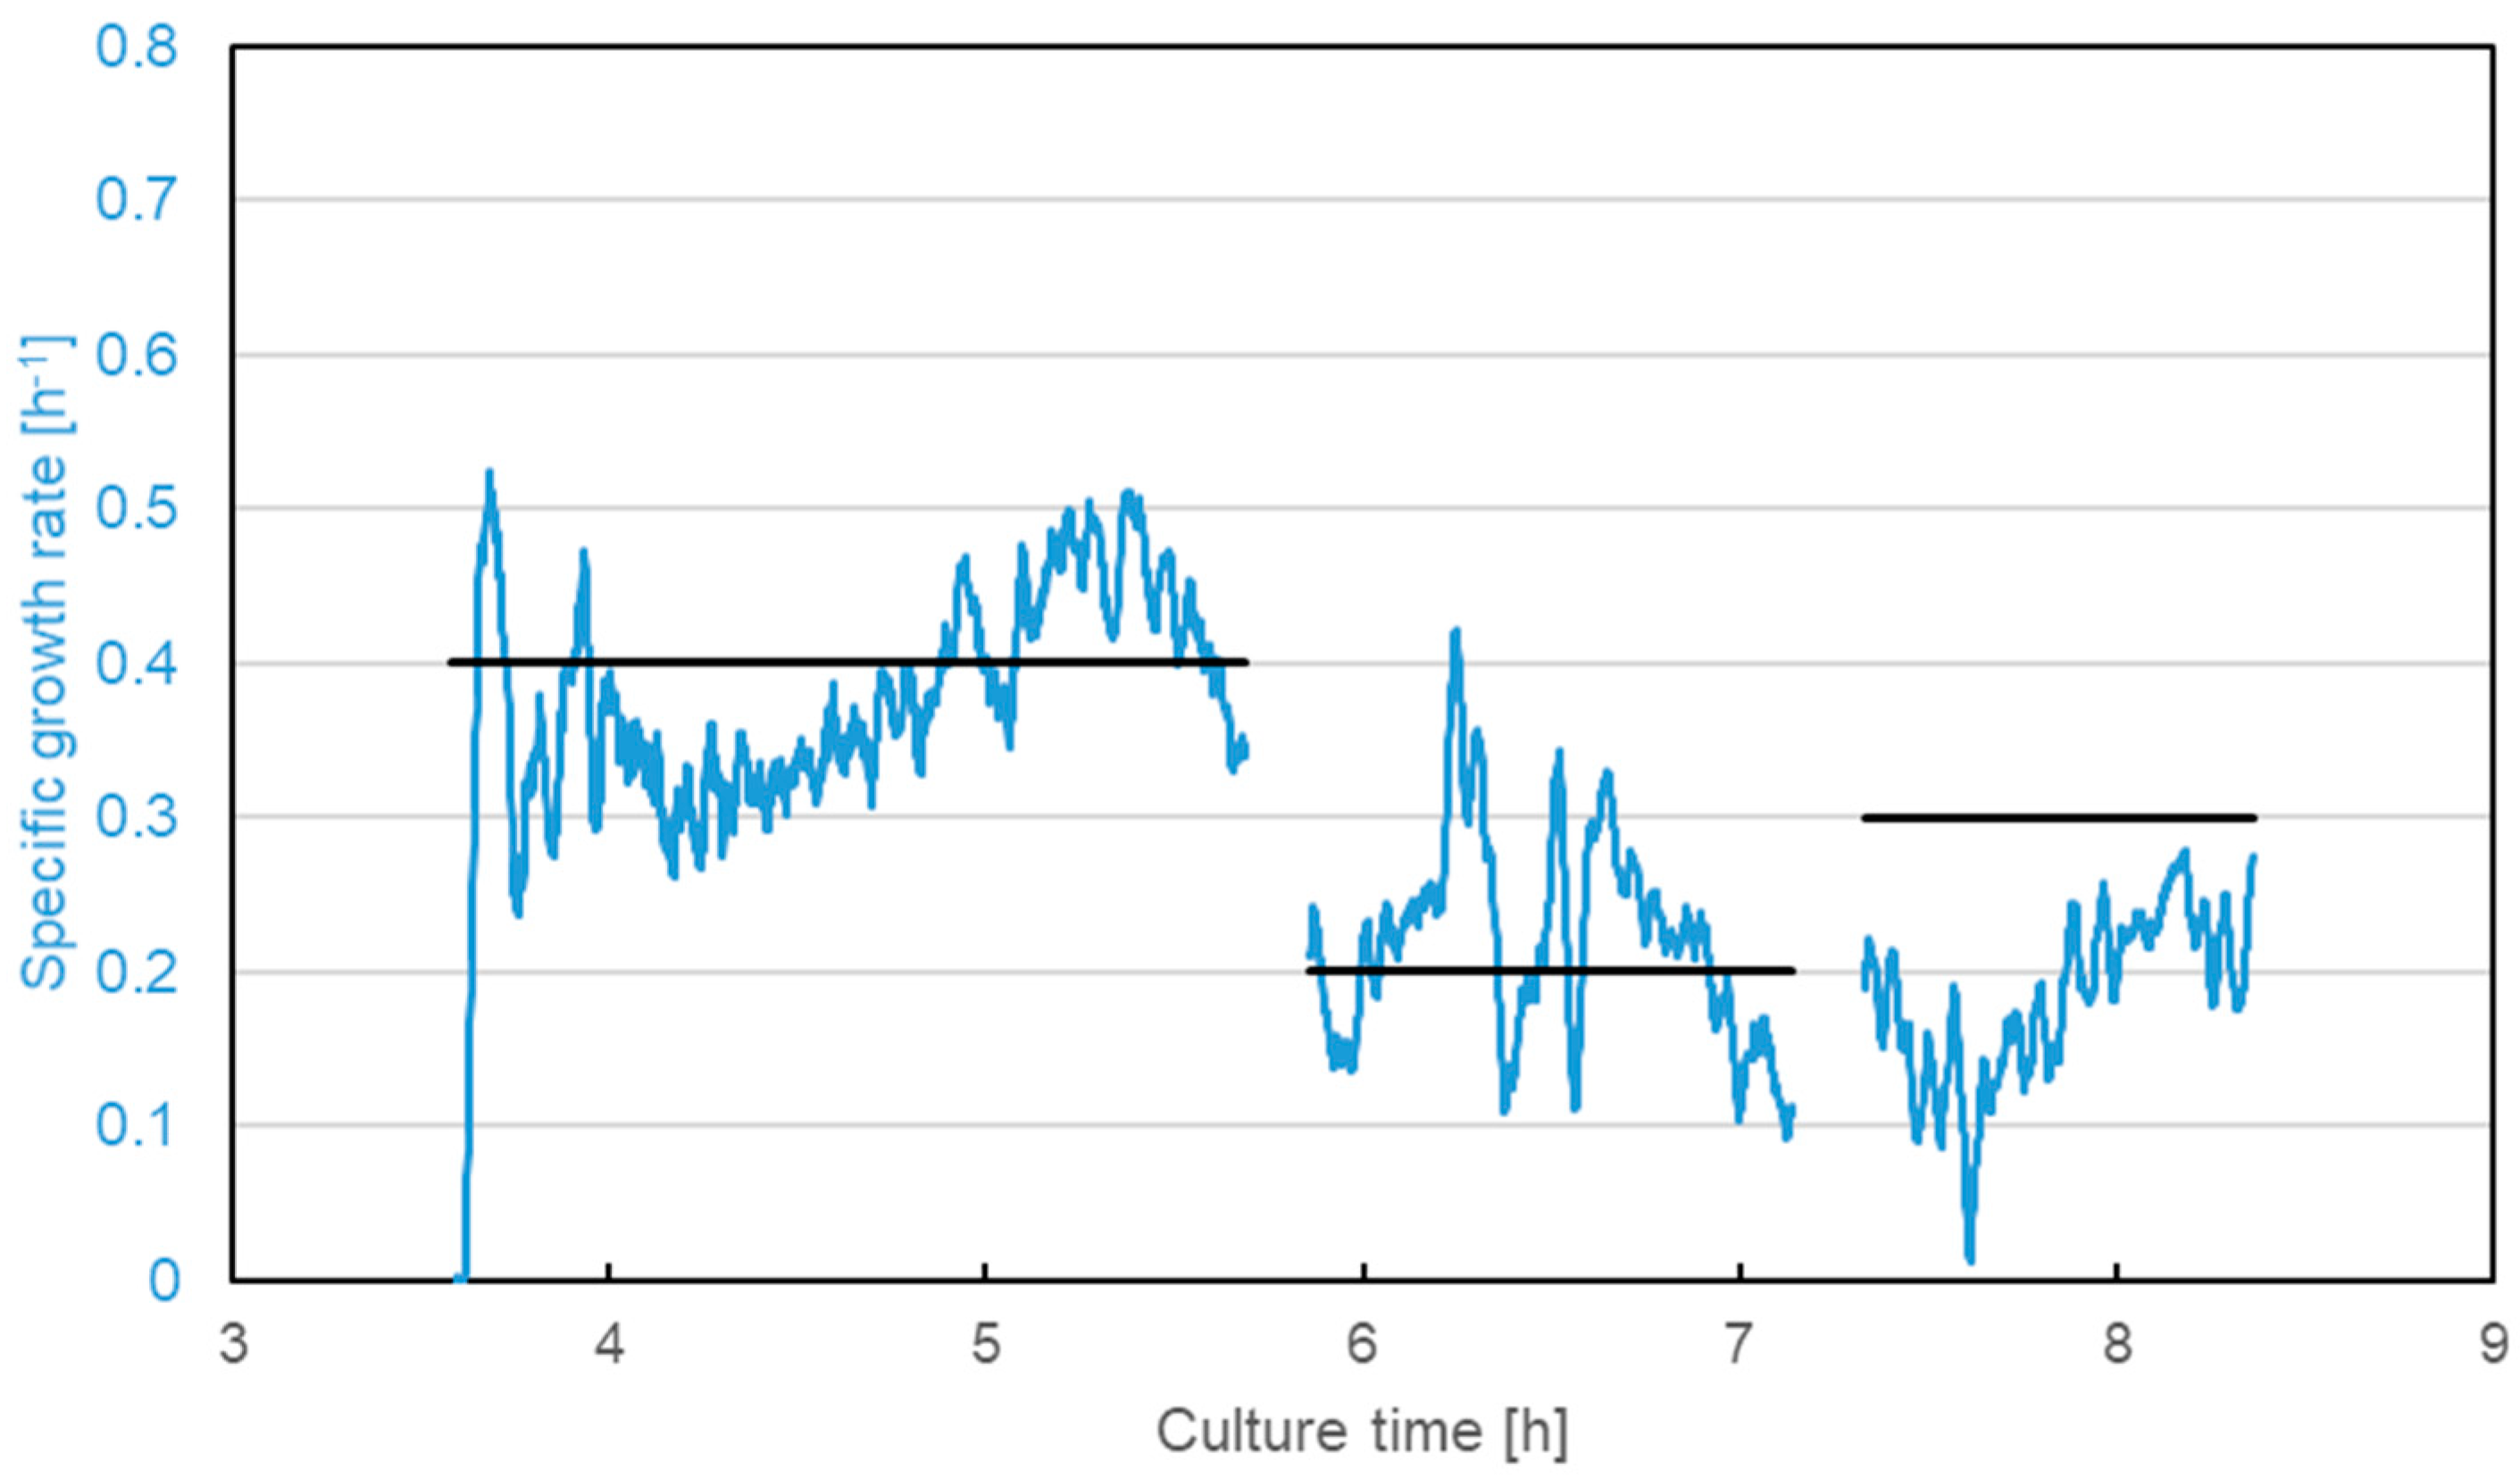
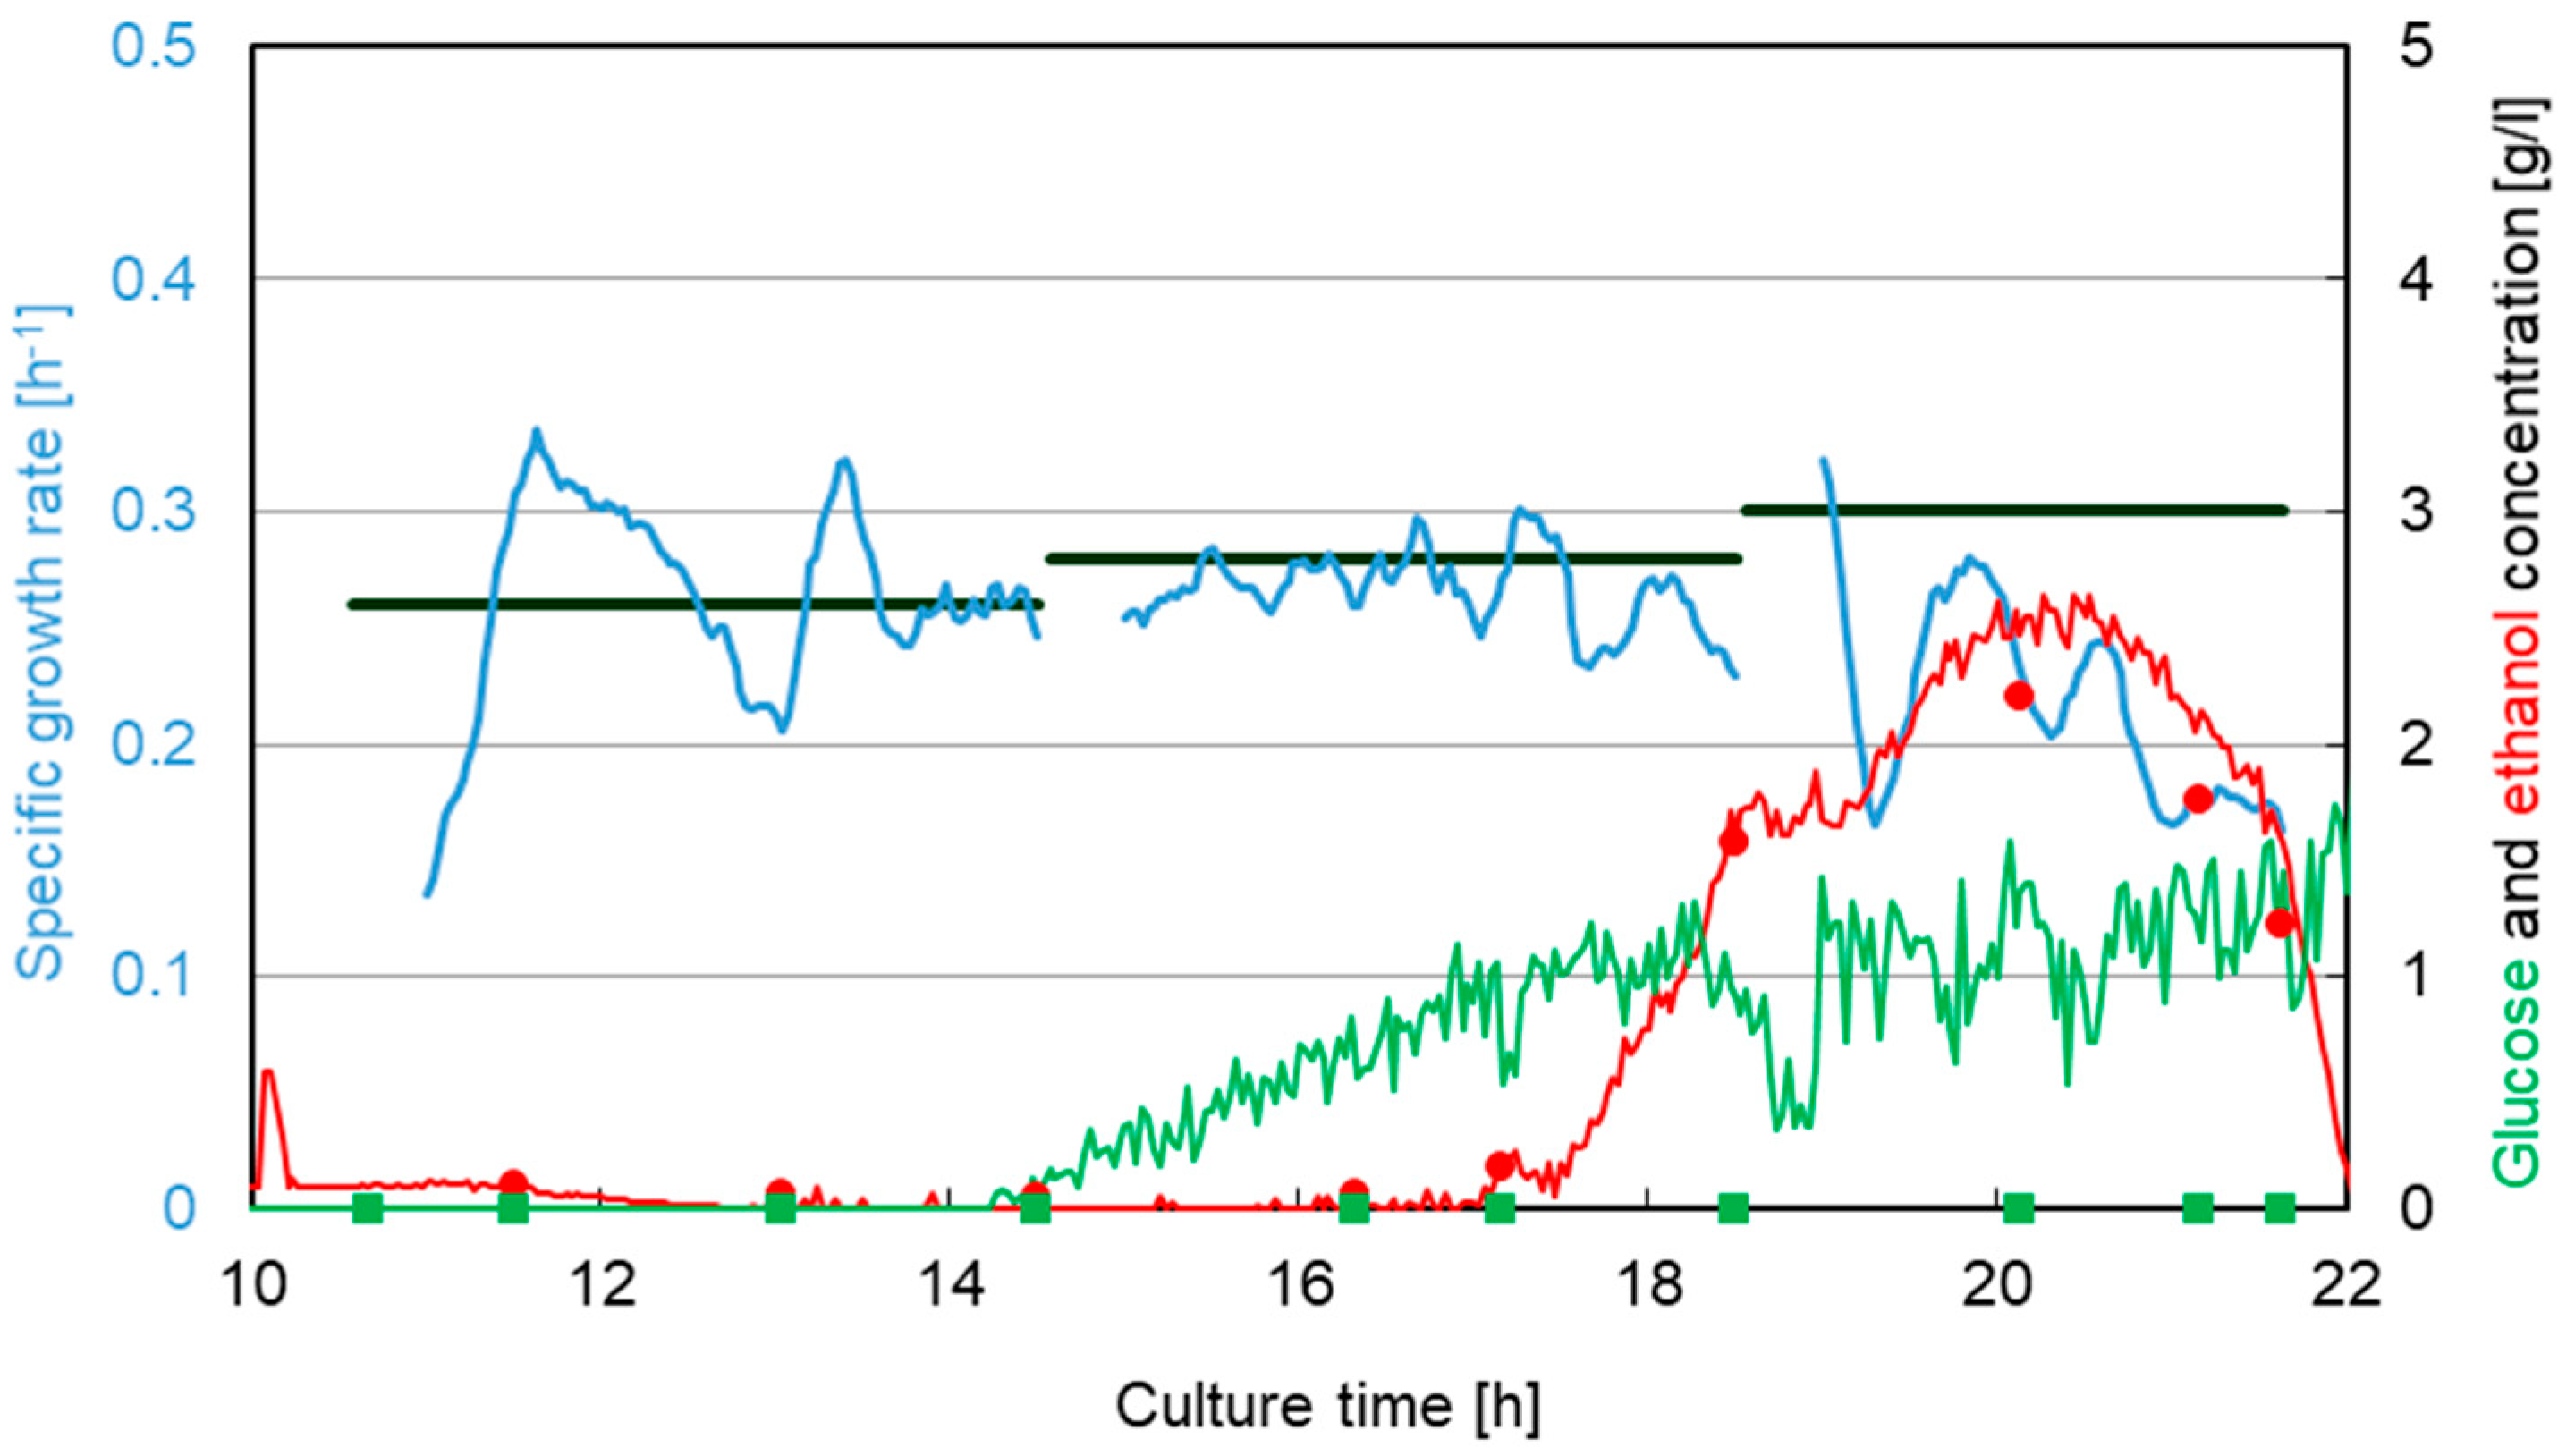
3.1. Saccharomyces cerevisiae

The methodology was initially tested on two fed-batch cultures of S. cerevisiae using the feedforward-feedback controller. Figure 1 shows the results of the first experiment, where the setpoint values for μ were increased incrementally from 0.26 to 0.28 and 0.30 h−1 and ethanol (the overflow metabolite) was monitored on-line using FTIR and off-line by HPLC. The specific growth rate was estimated on-line from the biomass measurements obtained with dielectric spectroscopy.
It can be observed that the onset of ethanol formation occurred towards the later stages of the second setpoint, at μsp = 0.28 h−1. Once the setpoint was changed to 0.30 h−1, the estimated cell growth rate briefly increased, but as the ethanol production advanced further, it began to inhibit the growth of the cells and a significant drop in the specific growth rate was observed soon after. Interestingly, the drop in μ halted the overflow metabolism and, between culture time 20 and 22 h, the cells were able to consume the residual ethanol. The on-line FTIR analysis showed a slight accumulation of residual glucose (about 1 g/L), though this was not detected by off-line HPLC measurements.
In the second experiment, the cells were grown over a period of six hours in fed-batch mode below the threshold of overflow metabolism, at the setpoint value of μsp = 0.26 h−1. The measured specific growth rate and the ethanol concentration during the fed-batch stage are shown in Figure 2.
By maintaining the specific growth rate at a setpoint below the critical value, the overflow metabolism was effectively avoided. Noise in the estimated values of μ and the measurement lag caused by the moving-average filtering remained problematic from the control point of view. As can be seen in Figure 2, the specific growth rate briefly exceeded 0.30 h−1 at the culture time of 15 h and shortly after 17 h, provoking a slight increase in ethanol concentration, which, in turn, resulted in a subsequent drop in the measured μ and a minor accumulation of residual glucose.

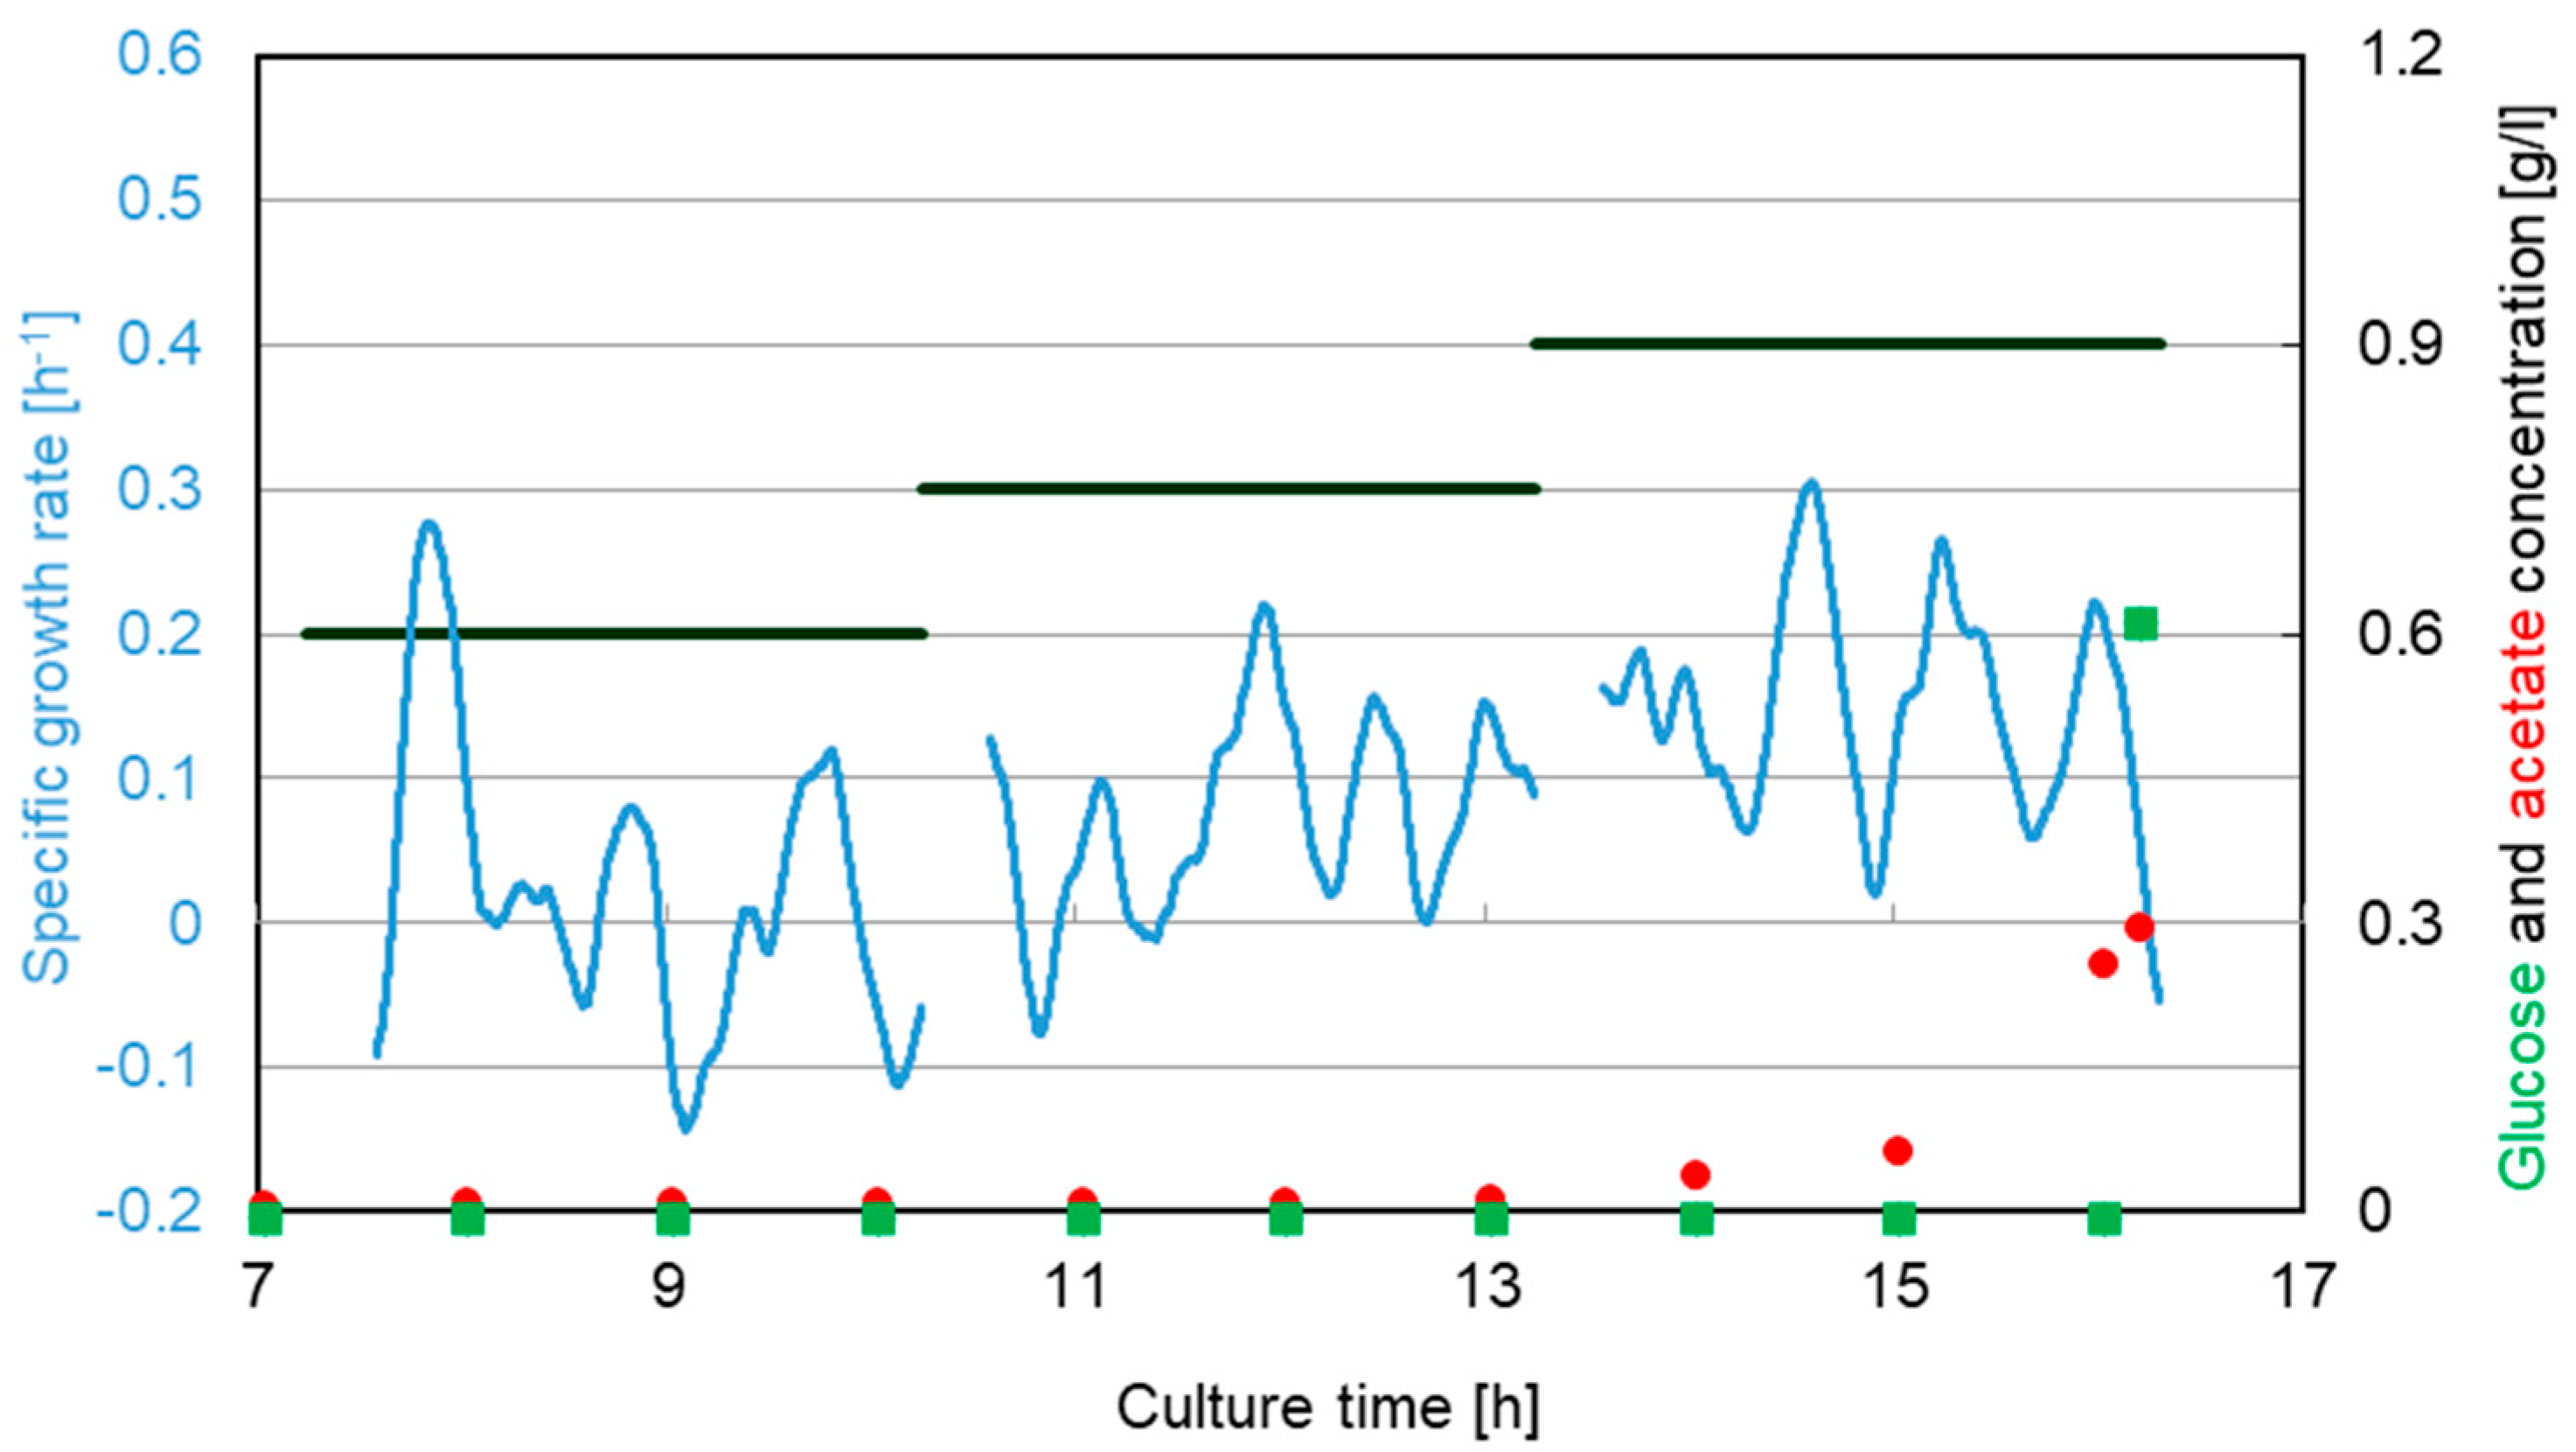
3.2. Escherichia coli

The approach was then applied to two fed-batch cultures of E. coli and revealed a set of additional challenges with respect to process monitoring and control. In principle, the faster growth kinetics of the bacteria call for a narrower signal-filtering window in the estimation of the specific growth rate. This, however, leads to significantly more noise in the on-line values of μ, which, in turn, has a negative impact on controller performance. In addition, the relatively small size of the cells has an impact on the effective limit of detection. Capacitance and turbidity were attempted as tools for biomass monitoring and both methods showed high sensitivity to noise.
Figure 3 shows the results of the first experiment with the B strain of E. coli. Three setpoint values for μ were tested sequentially: 0.40 to 0.20, and 0.30 h−1. The specific growth rate was estimated on-line from biomass measurements obtained with turbidity. The main aim of this experiment was to assess the performance of the feedforward-feedback controller, thus, the production of the overflow metabolite (acetate) was not monitored.
Despite the significant noise in the specific growth rate estimates, the process showed good overall setpoint tracking. The integral term of the controller, responsible for correcting any potential steady-state offsets, increased the amplitude of signal oscillations, particularly between the culture time of 6 and 7 h. Towards the end of the experiment, a limitation in the feed pump capacity prevented the signal from reaching the final setpoint of 0.3 h−1.
Figure 4 shows the results of the second experiment, performed with the K-12 strain of E. coli, in which acetate production was monitored. In an attempt to minimize the effect of signal noise and its amplification by the feedback mechanism (especially the integral term, as above-mentioned), only the feedforward controller was applied. Three setpoint values for μ were tested: 0.20, 0.30, and 0.40 h−1 and the specific growth rate was estimated on-line from the biomass measurements obtained with the capacitance probe. Acetate was monitored on-line using FTIR, while reference measurements were done off-line using enzymatic analysis.
Significant noise and oscillations were still present in the specific growth rate signal but, due to the lack of feedback control, the oscillations manifested themselves at a lower frequency than in the previous experiment. Regarding the specific growth rate control, a steady-state error persisted at all three setpoint values, indicating that the feed flow rate profile calculated with the feedforward controller was systematically underestimated (most likely due to inaccuracies in the values of X0 and YX/S in Equation (3)). The onset of acetate production, accompanied by an accumulation of residual glucose, appeared at μsp = 0.40 h−1. The on-line FTIR measurements of glucose and of acetate were inconclusive as the concentrations were below the instrument’s limit of detection.

3.3. Effect on Biomass Yield

A slight but noticeable effect of the specific growth rate on the biomass-to-substrate mass yield was noted for all three strains investigated. Table 2 outlines the results from which it can be seen that the yield dropped off once the specific growth rate setpoint exceeded the critical threshold, μcrit.

4. Conclusions and Perspectives

The application of a simple feedforward-feedback control scheme aimed at preventing overflow metabolism in fed-batch cultivations of two Crabtree-positive strains was successfully demonstrated. By monitoring the concentration of the overflow metabolite in parallel, it was possible to establish, for each strain, the critical specific growth rate at which the process should be run to maximize the growth kinetics while preventing the Crabtree effect from occurring. The inherent simplicity of the methodology makes it generally applicable and robust, thereby satisfying the criteria laid out by the FDA for the industrial application of (bio) Process Analytical Technology [2].
Several aspects of the methodology remain challenging, the most important of which is the accurate and precise on-line estimation of the specific growth rate. In situ turbidity measurements of biomass were in general less noisy and allowed the application of a narrower moving-average window, thereby reducing control lag. On the other hand, capacitance measurements were found to be less sensitive to air bubbles and to changes in medium conductivity (which were caused by the addition of base, antifoam, and feed). Combining turbidity and/or capacitance data with other measurements such as OUR, dissolved oxygen variations, or base consumption rates could improve the reliability of the specific growth rate estimations.
The effect of the specific growth rate on the biomass-to-substrate yield was assessed in this work, but the results should be confirmed with more exhaustive studies. More importantly still, the impact of growth rate controlled fed-batch cultures on the productivity of the strains and on the quality of the product deserves a thorough investigation. This may be of particular interest in controlling multiple-phase fed-batch processes such as the recombinant protein production strategy with Pichia pastoris reported by Mattanovich et al. [1]. On-line monitoring of medium metabolites with, for example, FTIR could further enhance the control strategy, provided that the measurements are done above the limit of detection.

Author Contributions

L.H. and K.R.C. performed the experiments with E. coli. M.D. performed the experiments with S. cerevisiae, organized the data, and wrote the paper.

Funding

The Science Foundation of Ireland is acknowledged for financial support of the work with S. Cerevisiae, which was carried out at Dublin City University. Experiments with E. coli were performed at the HES-SO—Haute école d’ingénierie et d’architecture de Fribourg (Switzerland) and funded locally by the school.

Acknowledgments

The bioFactory Competence Center SA (BCC, Fribourg, Switzerland) is respectfully acknowledged for providing the K12 E. coli strain as well as the equipment and support necessary for the enzymatic analysis of acetate.

Conflicts of Interest

The authors declare no conflict of interest.

References

  1. Mattanovich, D.; Jungo, C.; Wenger, J.; Dabros, M.; Maurer, M. Yeast suspension culture. In Industrial Scale Suspension Culture of Living Cells; Wiley: Hoboken, NJ, USA, 2014. [Google Scholar]
  2. Schuler, M.M.; Marison, I.W. Real-time monitoring and control of microbial bioprocesses with focus on the specific growth rate: Current state and perspectives. Appl. Microbiol. Biotechnol. 2012, 94, 1469–1482. [Google Scholar] [CrossRef] [PubMed]
  3. Rocha, I.; Veloso, A.C.A.; Carneiro, S.; Costa, R.; Ferreira, E.C. Implementation of a specific rate controller in a fed-batch E. coli fermentation. IFAC Proc. Vol. 2008, 41, 15565–15570. [Google Scholar] [CrossRef]
  4. Biener, R.; Steinkamper, A.; Horn, T. Calorimetric control of the specific growth rate during fed-batch cultures of saccharomyces cerevisiae. J. Biotechnol. 2012, 160, 195–201. [Google Scholar] [CrossRef] [PubMed]
  5. Soons, Z.; van Straten, G.; van der Pol, L.A.; van Boxtel, A.J.B. Online automatic tuning and control for fed-batch cultivation. Bioprocess. Biosyst. Eng. 2008, 31, 453–467. [Google Scholar] [CrossRef] [PubMed]
  6. Chopda, V.R.; Rathore, A.S.; Gomes, J. Maximizing biomass concentration in baker’s yeast process by using a decoupled geometric controller for substrate and dissolved oxygen. Bioresour. Technol. 2015, 196, 160–168. [Google Scholar] [CrossRef] [PubMed]
  7. Tippmann, S.; Scalcinati, G.; Siewers, V.; Nielsen, J. Production of farnesene and santalene by saccharomyces cerevisiae using fed-batch cultivations with rq-controlled feed. Biotechnol. Bioeng. 2016, 113, 72–81. [Google Scholar] [CrossRef] [PubMed]
  8. Cannizzaro, C.; Valentinotti, S.; von Stockar, U. Control of yeast fed-batch process through regulation of extracellular ethanol concentration. Bioprocess. Biosyst. Eng. 2004, 26, 377–383. [Google Scholar] [CrossRef] [PubMed]
  9. Hocalar, A.; Turker, M. Model based control of minimal overflow metabolite in technical scale fed-batch yeast fermentation. Biochem. Eng. J. 2010, 51, 64–71. [Google Scholar] [CrossRef]
  10. Dabros, M.; Schuler, M.M.; Marison, I.W. Simple control of specific growth rate in biotechnological fed-batch processes based on enhanced online measurements of biomass. Bioprocess. Biosyst. Eng. 2010, 33, 1109–1118. [Google Scholar] [CrossRef] [PubMed]
  11. Mears, L.; Stocks, S.M.; Sin, G.; Gernaey, K.V. A review of control strategies for manipulating the feed rate in fed-batch fermentation processes. J. Biotechnol. 2017, 245, 34–46. [Google Scholar] [CrossRef] [PubMed]
  12. Jenzsch, M.; Simutis, R.; Luebbert, A. Generic model control of the specific growth rate in recombinant escherichia coli cultivations. J. Biotechnol. 2006, 122, 483–493. [Google Scholar] [CrossRef] [PubMed]
  13. Schenk, J.; Balazs, K.; Jungo, C.; Urfer, J.; Wegmann, C.; Zocchi, A.; Marison, I.W.; von Stockar, U. Influence of specific growth rate on specific productivity and glycosylation of a recombinant avidin produced by a pichia pastoris mut(+) strain. Biotechnol. Bioeng. 2008, 99, 368–377. [Google Scholar] [CrossRef] [PubMed]
  14. Sivaprakasam, S.; Schuler, M.M.; Hama, A.; Hughes, K.M.; Marison, I.W. Biocalorimetry as a process analytical technology process analyser; robust in-line monitoring and control of aerobic fed-batch cultures of crabtree-negative yeast cells. J. Therm. Anal. Calorim. 2011, 104, 75–85. [Google Scholar] [CrossRef]
  15. Schuler, M.M.; Sivaprakasam, S.; Freeland, B.; Hama, A.; Hughes, K.-M.; Marison, I.W. Investigation of the potential of biocalorimetry as a process analytical technology (pat) tool for monitoring and control of crabtree-negative yeast cultures. Appl. Microbiol. Biotechnol. 2012, 93, 575–584. [Google Scholar] [CrossRef] [PubMed]
  16. Horta, A.C.L.; da Silva, A.J.; Sargo, C.R.; Cavalcanti-Montano, I.D.; Galeano-Suarez, C.A.; Velez, A.M.; Santos, M.P.; Goncalves, V.M.; Giordano, R.C.; Zangirolami, T.C. On-line monitoring of biomass concentration based on a capacitance sensor: Assessing the methodology for different bacteria and yeast high cell density fed-batch cultures. Braz. J. Chem. Eng. 2015, 32, 821–829. [Google Scholar] [CrossRef]
  17. Munoz, J.A.; Brereton, R.G. Partial factorial designs for multivariate calibration: Extension to seven levels and comparison of strategy. Chemom. Intell. Lab. Syst. 1998, 43, 89–105. [Google Scholar] [CrossRef]
Figure 1. Specific growth rate of S. cerevisiae during the fed-batch culture phase. Three setpoint values of the specific growth rate were tested: 0.26, 0.28, and 0.30 h−1. Glucose and ethanol concentration was monitored on-line by FTIR (continuous lines) and off-line by HPLC (dots).
Fermentation 04 00079 g001
Figure 2. Specific growth rate of S. cerevisiae during the fed-batch culture phase run at a constant setpoint value of the specific growth rate of 0.26 h−1. Glucose and ethanol concentration was monitored on-line by FTIR (continuous lines) and off-line by HPLC (dots).
Fermentation 04 00079 g002
Figure 3. Specific growth rate of E. coli (B strain) during the fed-batch culture phase. Three μ setpoint values were tested: 0.40, 0.20, and 0.30 h−1.
Fermentation 04 00079 g003
Figure 4. Specific growth rate of E. coli (K-12 strain) controlled with the feedforward controller during the fed-batch culture phase. Three setpoint values of the specific growth rate were applied: 0.20, 0.30, and 0.40 h−1. The concentration of glucose and acetate, measured by HPLC enzymatic analysis, respectively, is shown with dots.
Fermentation 04 00079 g004
Table 1. Batch and feed medium composition. The media for the S. cerevisiae cultures were additionally supplemented with trace elements and vitamins as prescribed by Cannizzaro et al. [8].
S. cerevisiaeE. coli (B strain)E. coli (K12 strain)
Batch (g/L)Feed (g/L)Batch (g/L)Feed (g/L)Batch (g/L)Feed (g/L)
Glucose43001506150
(NH4)2SO45501.15015
KH2PO432512512.5
MgSO4 x 7H2O0.531510.5
Yeast Extract--113.511.2
Peptone--112.611.2
Table 2. Biomass-to-substrate mass yields as a function of the specific growth rate setpoint during the fed-batch phases of the cultivations. The dashed line indicates the position of μcrit.
S. cerevisiaeE. coli (B strain)E. coli (K12 strain)
μSP (h−1)YX/S (g g−1)μSP (h−1)YX/S (g g−1)μSP (h−1)YX/S (g g−1)
0.260.430.200.210.200.30
0.280.420.300.220.300.44
0.300.410.400.170.400.29

