Article

Hydrogen-Cycling during Solventogenesis in Clostridium acetobutylicum American Type Culture Collection (ATCC) 824 Requires the [NiFe]-Hydrogenase for Energy Conservation

1
US Army Research Laboratory, RDRL-SEE-B, 2800 Powder Mill Road, Adelphi, MD 20783, USA
2
US Army Research Laboratory, Aberdeen Proving Ground, MD 21005, USA
3
General Technical Services, 1451 Route 34 South, Suite 301, Wall Township, NJ 07727, USA
4
Survice Engineering, 4695 Millennium Drive, Belcamp, MD 21017, USA
*
Authors to whom correspondence should be addressed.
Fermentation 2018, 4(3), 55; https://doi.org/10.3390/fermentation4030055
Submission received: 20 June 2018 / Revised: 8 July 2018 / Accepted: 17 July 2018 / Published: 19 July 2018
(This article belongs to the Special Issue Ethanol and Value-Added Co-Products)

Abstract

:
Clostridium acetobutylicum has traditionally been used for production of acetone, butanol, and ethanol (ABE). Butanol is a commodity chemical due in part to its suitability as a biofuel; however, the current yield of this product from biological systems is not economically feasible as an alternative fuel source. Understanding solvent phase physiology, solvent tolerance, and their genetic underpinning is key for future strain optimization of the bacterium. This study shows the importance of a [NiFe]-hydrogenase in solvent phase physiology. C. acetobutylicum genes ca_c0810 and ca_c0811, annotated as a HypF and HypD maturation factor, were found to be required for [NiFe]-hydrogenase activity. They were shown to be part of a polycistronic operon with other hyp genes. Hydrogenase activity assays of the ΔhypF/hypD mutant showed an almost complete inactivation of the [NiFe]-hydrogenase. Metabolic studies comparing ΔhypF/hypD and wild type (WT) strains in planktonic and sessile conditions indicated the hydrogenase was important for solvent phase metabolism. For the mutant, reabsorption of acetate and butyrate was inhibited during solventogenesis in planktonic cultures, and less ABE was produced. During sessile growth, the ΔhypF/hypD mutant had higher initial acetone: butanol ratios, which is consistent with the inability to obtain reduced cofactors via H2 uptake. In sessile conditions, the ΔhypF/hypD mutant was inhibited in early solventogenesis, but it appeared to remodel its metabolism and produced mainly butanol in late solventogenesis without the uptake of acids. Energy filtered transmission electron microscopy (EFTEM) mapped Pd(II) reduction via [NiFe]-hydrogenase induced H2 oxidation at the extracelluar side of the membrane on WT cells. A decrease of Pd(0) deposits on ΔhypF/hypD comparatively to WT indicates that the [NiFe]-hydrogenase contributed to the Pd(II) reduction. Calculations of reaction potentials during acidogenesis and solventogenesis predict the [NiFe]-hydrogenase can couple NAD+ reduction with membrane transport of electrons. Extracellular oxidation of H2 combined with the potential for electron transport across the membrane indicate that the [NiFe}-hydrogenase contributes to proton motive force maintenance via hydrogen cycling.

1. Introduction

Solventogenic Clostridia have been used to produce the commodity chemicals acetone, butanol, and ethanol from renewable feedstocks via the acetone, butanol, and ethanol (ABE) fermentation process [1,2]. The model solventogenic organism is Clostridium acetobutylicum, which ferments a variety of carbohydrates that is prevalent in biomass [3]. In batch culture, the organism’s metabolism proceeds from an initial acidogenic phase, producing mostly acetate and butyrate, to a solventogenic phase, where acetate and butyrate are reabsorbed, and along with a carbohydrate, are converted to acetone, butanol, and ethanol [1]. The redox state of the organism is important for the relative distribution of acids and solvents produced [4]. Hence, there have been numerous demonstrations of altering metabolic output by manipulation of electron flow via metabolic inhibitors, feedstock selection, and genetic engineering [4,5,6,7].
An important mechanism for maintaining redox balance in C. acetobutylicum is the production of H2 [8]. Electron flow through H2 in Clostridium spp. is primarily controlled by two types of hydrogenases: H2-evolving hydrogenases and H2-uptake/respiratory hydrogenases [9]. [FeFe]-hydrogenases are responsible for the production of H2, whereas [NiFe]-hydrogenases are involved in H2 oxidation and possibly the production of NADH/NAD(P)H [9].
Internal production of H2 by the [FeFe]-hydrogenase increases intracellular pH (via proton reduction) and it provides oxidized ferredoxin for central metabolism [8,10]. Oxidized ferredoxin is required for the major pyruvate decarboxylating enzyme, pyruvate ferredoxin oxidoreductase (PFOR), and the butyryl-CoA dehydrogenase (BCD), which is essential for butyrate and butanol production [1,11]. There are two HydA [FeFe]-hydrogenase genes in C. acetobutylicum: HydA1, which is constitutively expressed, and HydA2, which is induced during solventogenesis [10,12]. While the HydA1 operates primarily in the direction of H2 production during batch fermentations, the enzyme reaction is reversible and it is important for the H2 dependent reduction of nitroaromatic compounds [5,10].
The [NiFe]-hydrogenase is the lesser studied hydrogenase of Clostridia, pervasive among the different species, and is believed to be involved in H2 uptake [9]. An siRNA knock down of the [NiFe]-hydrogenase in C. saccharoperbutylacetonicum N1, to our knowledge the only published study of Clostridial [NiFe]-hydrogenase activity, showed a marked decrease in butanol production, thereby indicating physiological evidence of hydrogen uptake [13]. A bioinformatics analysis of Clostridial hydrogenases indicates that C. acetobutylicum ATCC 824 encodes probable a group 1 [NiFe]-hydrogenase, and the maturation factors genes are located on both the chromosome and pSol megaplasmid [9]. The predicted protein sequences are similar to the C. saccharoperbutylacetonicum N1 [NiFe]-hydrogenase, and previous studies have shown C. acetobutylicum mRNA expression from the corresponding genes is induced during solventogenesis [12]. Increased expression during solvent phase suggests the C. acetobutylicum [NiFe]-hydrogenase is important for solventogenic growth phase, but its exact role is not understood.
In this report, we begin to elucidate the function of C. acetobutylicum’s [NiFe]-hydrogenase and associated maturation factors. Interruption of the [NiFe]-hydrogenase maturation factor hypF homolog gene ca_c0810, and the subsequent gene in the operon, hypD homolog ca_c0811, inhibited hydrogenase activity, thereby indicating their role in maturation. The hypF/hypD mutant displayed altered metabolism, as consistent with a defect in hydrogen uptake, resulting in decreased ABE output and altered product ratios in early solventogenesis. Palladium nanoparticle formation at the site of hydrogen gas oxidation identified that the [NiFe]-hydrogenase is membrane localized with the catalytic subunit facing the extracellular side of the membrane. Calculated net reduced cofactor production over time for WT and mutant strains indicate a role in NADH production for the [NiFe]-hydrogenase during solventogenesis. Together with energetic calculations and sequence analysis, the results indicate the [NiFe]-hydrogenase likely couples H2 oxidation with electron transport and intracellular NAD+ reduction, thereby acting as a crude proton pump that conserves energy via hydrogen cycling.

2. Materials and Methods

2.1. Bacterial Strain Propagation

Clostridium acetobutylicum ATCC 824 (Wild type, or WT) was obtained from American Type Culture Collection (ATCC), and Clostridium acetobutylicum M5 (M5), which lacks the pSol megaplasmid, was provided by the Papoutsakis laboratory [14]. Wild type and derivative strains were maintained as anaerobic spore suspensions at room temperature in potato glucose medium (PGM) containing: 150.0 g·L−1 potato (grated), 10.0 g·L−1 glucose, 0.5 g·L−1 (NH4)2SO4, and 3.0 g·L−1 CaCO3 [15]. The media was boiled for one hour, strained, and then autoclaved. M5 was maintained under anaerobic conditions on Clostridial growth medium (CGM) agarose plates, as previously described [6,16]. C. acetobutylicum strains were propagated in CGM or P2 medium containing 6.0% glucose, as previously described [12]. Cultures were grown in a Coy anaerobic chamber (Coy Lab Products) at 37 °C in an atmosphere of 5.0% H2, 5.0% CO2, and 90.0% N2.

2.2. Construction of HypF/HypD Mutant

The hypF annotated gene, ca_c0810, was disrupted using a group II intron based system (ClosTron) [17]. An intron insertion site was predicted at 153|154s in the sense sequence using the TargeTron Gene Knockout System website (MilliporeSigma, St. Louis, MO, USA) [18]. The target insert was designed using the intron prediction primers, obtained from Biobasic, and cloned into pMTL007C-E2 (Table S2) (GenBank accession no. HQ263410.1) [19]. pMTL007C-E2: CachypF was transformed into WT C. acetobutylicum ATCC 824, mutants were screened as previously described, and then confirmed via PCR and southern blot [20,21] (see Table S1 and Figure S1). One mutant was verified to have integration in ca_c0810 and was designated CacATCC824-hypF:CT(ΔhypF/hypD).

2.3. Construction of Complement Strains

The ca_c0810/ca_c0811 complement plasmid was designed using the phosphotransbutyrylase promoter (ptb) sequence followed by the full ca_c0810/ca_c0811 genetic sequence, position 935667 to 939040 on the WT C. acetobutylicum ATCC 824 genome, and was synthesized by Biobasic (Genbank accession nos. NP_347446 and NC_003030.1). The sequence was cloned into the AscI/SbfI sites of pMTL007C-E2, retaining the repH, catP, ColEI, and traJ elements and designated pMTL007C-E2: PtbhypFhypD. pMTL007C-E2:PtbhypFhypD was transformed into the ΔhypF/hypD strain and control complement strains were created by the addition of an empty pMTL007C-E2 plasmid into ΔhypF/hypD and WT C. acetobutylicum ATCC 824, as previously described [21]. The complement strains were designated CacATCC824-hypF:PtbhypFhypD (ΔhypF/hypD:p-hypF/hypD), CacATCC824-hypF:pMTL(ΔhypF/hypD:pMTL), and CacATCC824:pMTL(WT:pMTL).

2.4. Sample Collection for RNA Seq Data

Static planktonic cultures were grown in P2 medium containing 6.0% glucose, as previously described [12]. Twenty milliliters of overnight cultures of WT C. acetobutylicum and ΔhypF/hypD were grown to OD600 of 0.8. Two milliliters of the overnight culture was then sub-cultured in triplicate to glass bottles containing 60.00 mL glucoseP2 medium. Two milliliters samples of planktonic cultures were collected at 24 h post sub-culture, which is the time point Liu et al. described to have the highest expression level of the genes of interest [12]. Samples were treated with a final concentration of 30 µg·mL−1 rifampicin, incubated for 10 min on ice, and then treated with RNA protect (Qiagen, Hilden, Germany), as previously described [16].

2.5. RNA Extraction, Purification, and rRNA Depletion

Total RNA was isolated using the miRNeasy Mini Kit (Qiagen, Hilden, Germany), according to the manufacturer’s protocol, with an additional homogenization and mechanical disruption step using a bead beater (BioSpec, Bartlesville, OK, USA) with Zirconia/Silica beads (BioSpec). RNA quality was assessed using the 2100 BioAnalyzer (Agilent Technologies, Santa Clara, CA, USA), quantified with a Qubit fluorimeter (Thermo Fisher Scientific, Waltham, MA, USA), and then stored at −80 °C prior to DNase treatment. DNA was removed using the TURBO DNA-free kit (Thermo Fisher Scientific), according to the manufacturer’s protocol. RNA was again quantified and quality assessed, as stated above. Ribosomal RNA was removed using the Ribo-Zero rRNA Removal Kit for Gram-Positive Bacteria (Illumina, San Diego, CA, USA), according to the manufacturer’s protocol. The quality of rRNA depleted samples was assessed once more prior to processing for sequencing library generation.

2.6. Sequencing Library Preparation

TruSeq Stranded mRNA Sample Preparation Kit (Illumina) was used to prepare the rRNA depleted RNA for sequencing, according to the manufacturer’s protocol. Libraries were quantified using the Kapa Library Quantification Kit (KapaBiosystems, Wilmington, MA, USA), according to the manufacturer’s instructions, then normalized and pooled for sequencing, according to the Denature and Dilute Libraries Guide for the NextSeq 500 (Illumina, San Diego, CA, USA). Pooled libraries were paired end sequenced on a NextSeq 500 (Illumina, San Diego, CA, USA).

2.7. RNA-Seq Data Analysis

Samples had an average of 20 million reads each, were assessed for quality using FastQC, and then trimmed to remove Illumina adaptors and low quality bases using Trimmomatic [22]. Operon structure predictions were performed using Rockhopper [23].

2.8. Hydrogenase Zymogram

Hydrogenase assay steps were performed under anaerobic conditions. Five milliliters cultures of ΔhypF/hypD, WT, M5, and ΔhypF/hypD:P-hypF/hypD were grown in CGM containing 6.0% glucose at 37 °C to an OD600 of 1.2. Cells were isolated via centrifugation (6000 rpm for 10 min in a Corning LSE centrifuge) and the resulting pellets were subsequently washed twice with 10 mL of PBS (MilliporeSigma, St. Louis, MO, USA), isolating cells between washes by centrifugation, as above. The pellets were then suspended in 800 µL CelLytic™ B Plus (MilliporeSigma, St. Louis, MO, USA), 1.0% dodecyl maltoside, and benzonase, and then subjected to 10 consecutive 15 s intervals of sonication on ice. The lysates were subjected to non-denaturing PAGE on Mini-PROTEAN® TGX™ gels (Bio-Rad Laboratories Inc., Hercules, CA, USA). Hydrogenase activity was visualized by incubation of gel in 50.0 mM MOPs buffer (pH 8.0), 1.0 mM benzyl viologen (BV), and 2.0 mM 2,3,5,-triphenyltetrazolium chloride (TTC), as previously described by Pinske et al. [24].

2.9. Growth and Metabolite Studies

Agitated and static planktonic culture studies were performed in CGM containing 5% glucose and grown in DasGip (Eppendorf, Hamburg, Germany) bioreactors (Eppendorf) for 48 h. Two hundred milliliters overnight cultures of WT and ΔhypF/hypD were grown to OD600 of 0.8 in CGM containing 5.0% glucose under anaerobic conditions. Thirty milliliters were then sub-cultured into 1 L of CGM containing 5.0% glucose in DasGip (Eppendorf, Hamburg, Germany) bioreactors under anaerobic conditions with Rushton impellors running at either 400 rpm or 0 rpm, in duplicate. The headspace of the bioreactors were flushed with N2. Samples for metabolite analysis were taken every 24 h. The samples were clarified via filtration through a 0.2 μm PES syringe filter (Corning, NY, USA) and stored at −20 °C.
Sessile culture studies were performed in comparison to static planktonic cultures in P2 medium containing 6.0% glucose in glass bottles, as previously described [12]. Twenty milliliters overnight cultures of WT and ΔhypF/hypD were grown to OD600 of 0.8. Two milliliters were then sub-cultured into glass bottles under anaerobic conditions (without N2 headspace flushing) containing 60.0 mL P2 medium, with either 2 g of autoclaved cotton balls for sessile studies, or without cotton balls for static planktonic culture studies, both in triplicate. The complement strains, ΔhypF/hypD:p-hypF/hypD, ΔhypF/hypD:pMTL, and WT:pMTL were grown overnight in similar conditions, except the overnight cultures contained final concentrations of 30 µg·mL−1 chloramphenicol for all strains and 40 µg·mL−1 for the ΔhypF/hypD:p-hypF/hypD and ΔhypF/hypD:pMTL strains. Two milliliters of the overnight complement strains were then sub-cultured into glass bottles under anaerobic conditions (without N2 headspace flushing) containing 60.0 mL P2 medium and a final concentration of 30 µg·mL−1 chloramphenicol, with either 2 g of autoclaved cotton balls for sessile studies, or without cotton balls for static planktonic culture studies, all in triplicate. The cultures were spiked with a final concentration of 30 µg·mL−1 of chloramphenicol every 48 h to maintain the plasmids. Samples for metabolite analysis were taken every 24 h for 144 h. Metabolite samples were clarified via filtration through a 0.2 μm PES syringe filter (Corning) and then stored at −20 °C. HPLC analysis of samples for metabolite concentrations was performed on an Agilent 1200, as previously described [6,25]. Samples were injected into the HPLC system, eluted isocratically, and quantified using an external calibration curve of pure known components as standards.

2.10. Reduction of Palladium

To determine location of the NiFe hydrogenases, 20 mL WT C. acetobutylicum ATCC 824, heat killed (1 h at 80 °C) WT C. acetobutylicum ATCC 824, pSol null C. acetobutylicum M5, and [NiFe]-hydrogenase mutant C. acetobutylicum Δ810/811 grown to OD600 of 1.5 in 6.0% glucose CGM were centrifuged for 15 min at 6000 RPM (Corning LSE centrifuge) in anaerobic conditions, and then the supernatant was removed. The pellets were washed twice with 20 mL of 20 mM MOPS buffer (pH 7.2) and re-suspended with 20 mL of the same buffer. The resting cells were sparged with oxygen free nitrogen (OFN) for 10 min. Two millimolar Pd(II) solution was made by dissolving sodium tetrachloropalladate (Na2PdCl4) in 0.01 M HNO3, pH 2.3 [26]. The Pd(II) solution was degassed for 10 min, then flushed with OFN for 10 min. The Pd(II) solution was added to the suspension of resting cells to give a mass ration of 1:4 Pd(II): dry biomass. The mixture was incubated for 30 min at 37 °C, with occasional shaking to allow for initial absorption of Pd(II). Pd(II) reduction was initiated by flushing the mixture with H2 gas for 2 h at 37 °C.

2.11. Sample Preparation for TEM

The Pd loaded bacteria were rinsed twice with 20 mL distilled water, fixed in 1 mL of 2.5% (w/v) glutaraldehyde for 30 min, centrifuged, resuspended in 0.5 mL 0.1 M phosphate buffer (pH 7), and stained in a final concentration of 1% osmium tetroxide in 0.1 M phosphate buffer (pH 7) for 60 min. The bacteria after staining were centrifuged and the pellets were freeze-dried. The dried bacterial samples were embedded in epoxy resin (low viscosity embedding kit) (Electron Microscopy Sciences, Hatfield, PA, USA) and cured overnight at 60 °C in the oven. Samples for TEM were prepared using a Leica EM UC7 ultramicrotome with a Diatome 35° wet diamond knife (Leica Microsystems, Buffalo Grove, IL, USA). Sections were cut from the embedded samples at room temperature to a thickness of approximately 200 nm. Sections were then coated with a 2 nm carbon film using a Leica Microsystems EM ACE600 high vacuum sputter coater equipped with a carbon thread coater (Leica Microsystems, Buffalo Grove, IL, USA).

2.12. TEM Imaging of Samples

The scanning transmission electron microscopy (STEM) mode of a JEOL JEM-2100F TEM (JEOL USA Inc., Peabody, MA, USA) equipped with a Gatan 806 high-angle annular dark field (HAADF) detector (Gatan, Pleasanton, CA, USA) was used to collect STEM-HAADF images from each sample. The microscope was operated at 200 kV, with a spot size of 0.2 nm, and a 40 μm condenser aperture that gave a convergence angle of 8.3 mrad. The STEM-HAADF collection angle range was 48–148 mrad. Gatan Microscopy Suite version 1.85 with DigiScan was used to collect the images.

2.13. Energy Filtered TEM

Energy Filtered TEM (EFTEM) jump ratio and elemental map images were acquired from C-K, O-K, and Pd-L edges using Gatan’s suggested energy windows. For each filtered image, ten images were acquired at a hardware binned value of 8 to give 256 × 256 pixel images at an exposure that minimized drift effects. Individual image exposures were typically 5 s.

2.14. Reduction Potential Calculations

Total reaction potentials for a range of external pH values were calculated by summing the potentials of individual oxidoreduction reactions and electron transport across the membrane. All of the calculations assumed standard conditions and an H2 concentration of 1 bar. Previously determined pH-dependent membrane potentials, proton motive force (pmf), and intracellular vs. extracellular pH values were utilized [27]. Reduction potentials for NAD+/NADH and NADP+/NADPH were calculated for solvent phase cells using the Nernst equation and intracellular concentrations reported by Amador-Noguez et al. [28]. Electron transport values were obtained using the previously reported membrane potentials and assumed transport of two electrons [27]. Additional details of the calculations are available in the supplemental material Figure S4.

3. Results

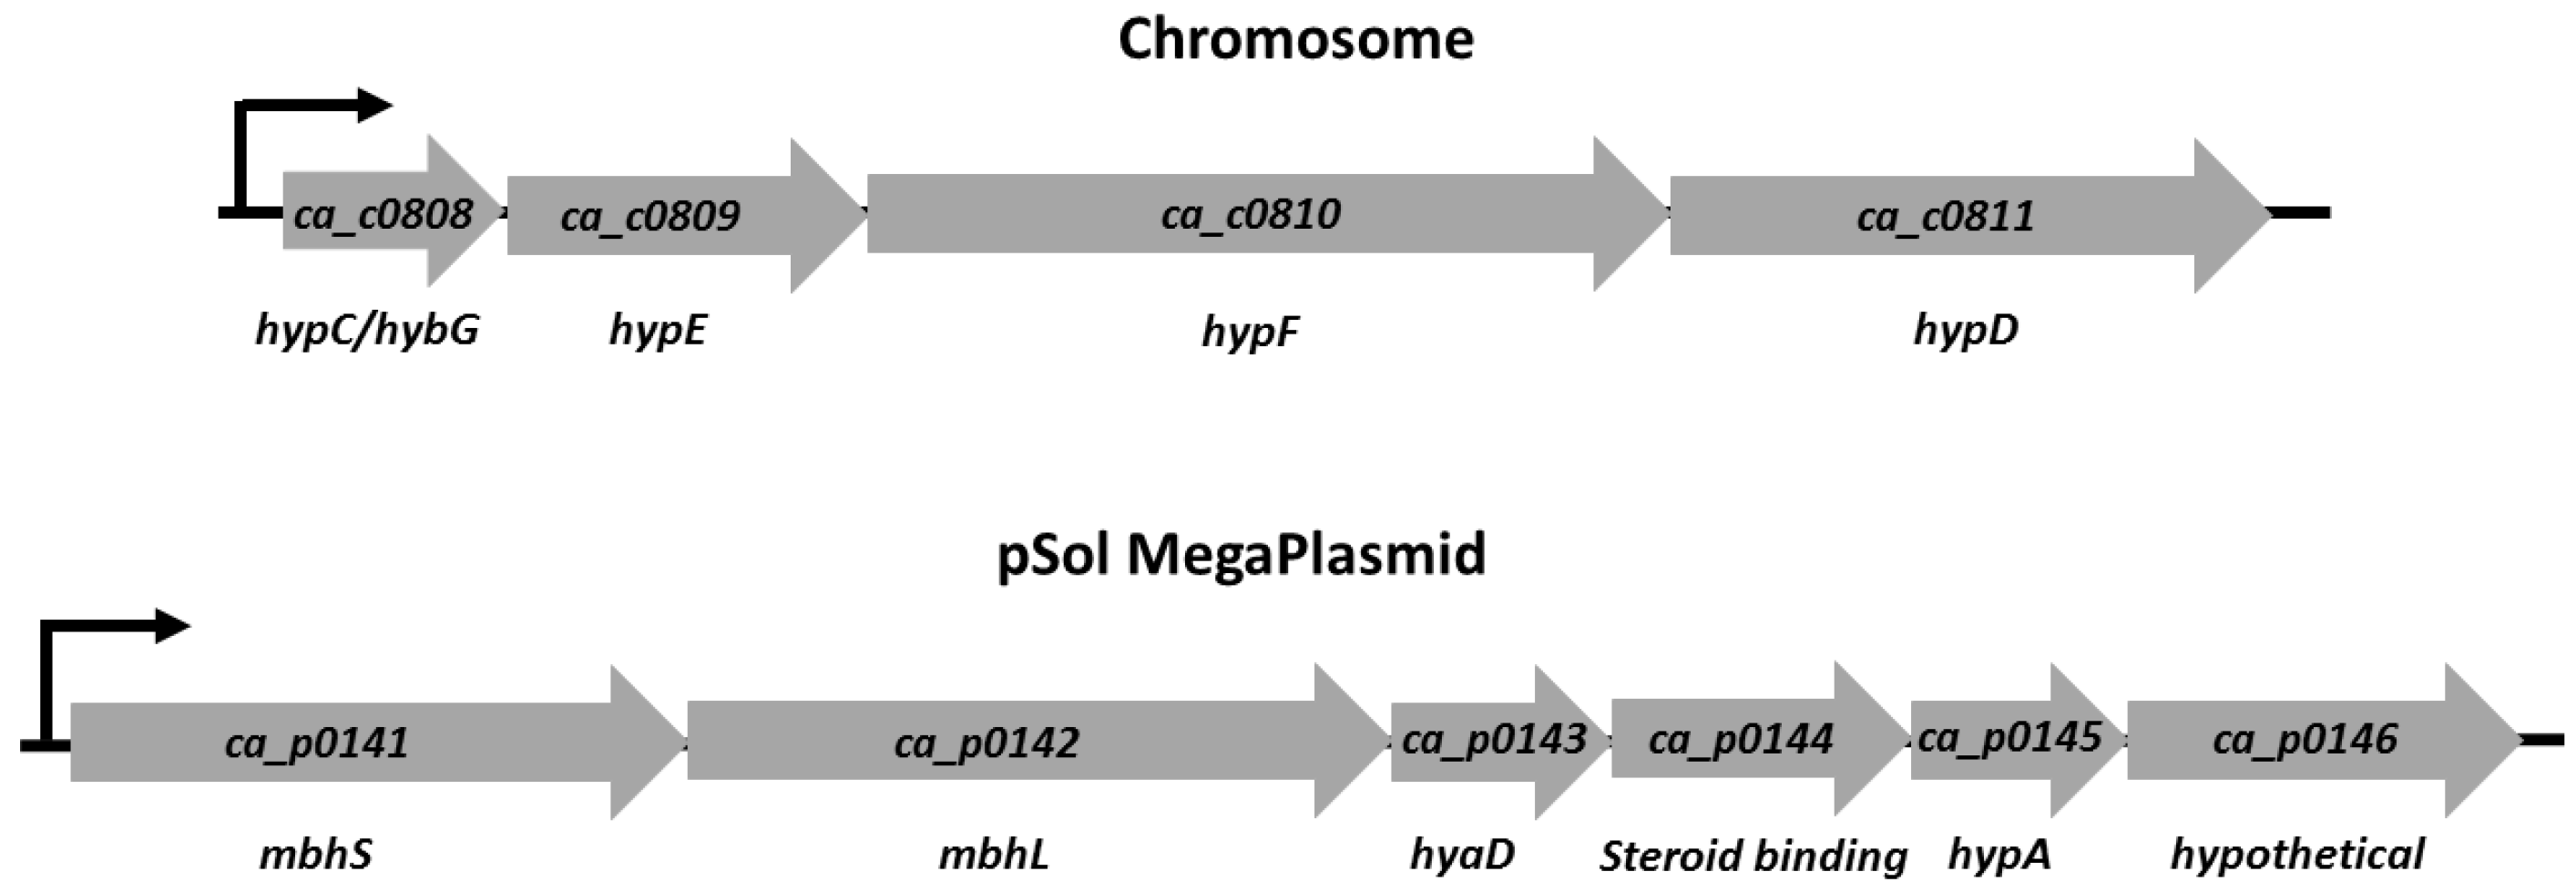
3.1. [NiFe]-Hydrogenase Operon Structure

The operon structures of the [NiFe]-hydrogenase and putative maturation factor genes, as shown in Figure 1, were determined by DOOR2 predictions and Rockhopper analysis of RNA-Seq data (Figure S1), Data available upon request) [23,29,30,31]. The analysis indicated that the chromosomally based genes ca_c0808 through ca_c0811 were transcribed as a single operon (Figure 1), which is inconsistent with MetaCyc predictions where ca_c0808 was predicted to be in a separate operon [23,30,32]. The pSol located genes ca_p0141 through ca_p0146 were also part of a single operon (Figure 1) [23,29,30]. The putative functions of ca_p0144 and ca_p0146 are unknown, but a BLASTP analysis of the ca_p0144 derived amino acid sequence indicated that it contains a putative heme binding domain, which could bind a cofactor that is involved in electron transfer from the hydrogenase to other redox enzymes that are similar to other organisms [9,33,34,35]. A BLASTP analysis of the ca_p0146-derived amino acid sequence indicates that it is similar to HypF, but the amino acid sequence does not contain the conserved zinc binding motif found in other HypF proteins, suggesting ca_p0146 is a truncated HypF1-like protein, which has been found in other organism, such as Ralstonia eutrophia [36,37]. While HypF1 seems to be functional in R. eutrophia, the purpose of two HypF paralogs in C. acetobutylicum is not known.

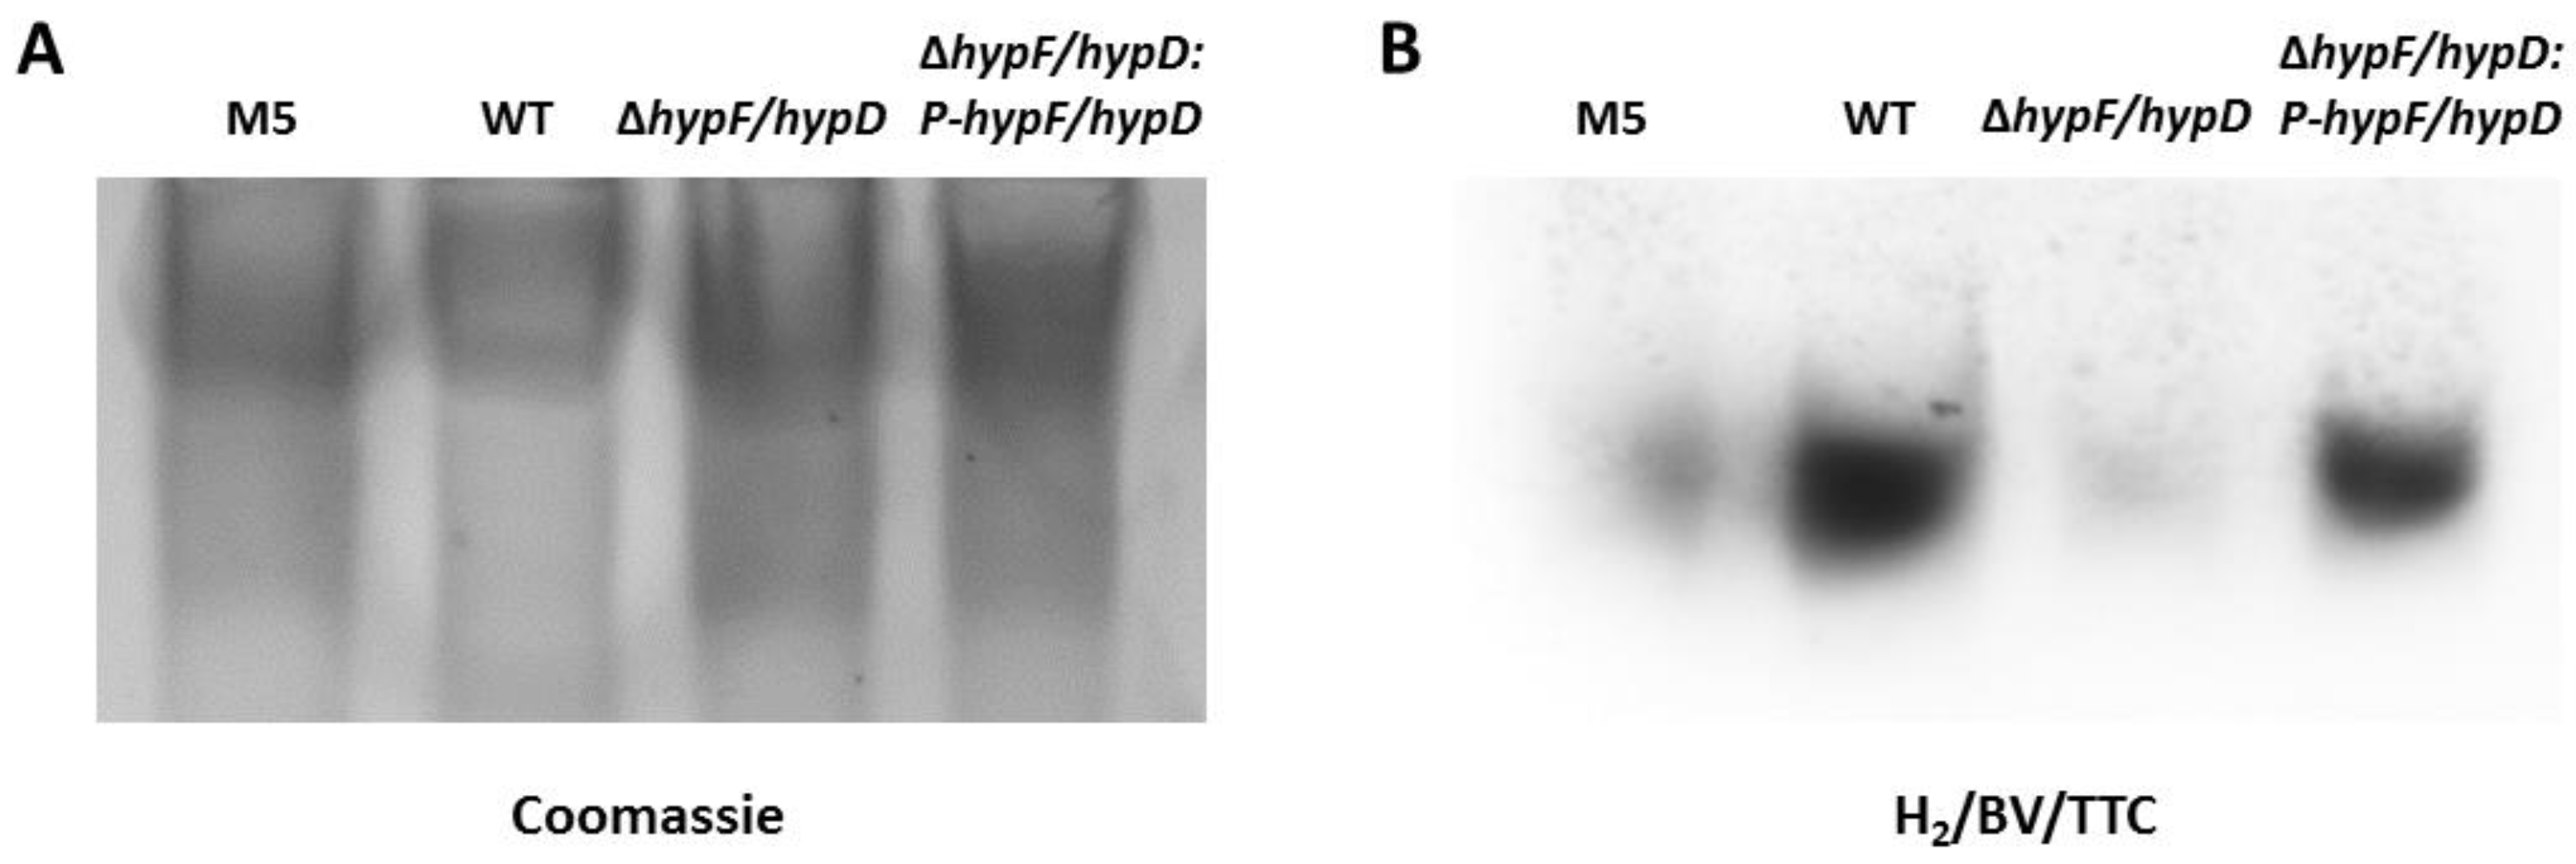
3.2. Disruption of [NiFe]-Hydrogenase Maturation

Preceding studies have shown [NiFe]-hydrogenase activity inhibition through partial disruption by siRNA in C. saccharoperbutylacetonicum [13]. In the current study, [NiFe]-hydrogenase activity in C. acetobutylicum was knocked out by interruption of the maturation factor hypF gene, ca_c0810, through the use of the ClosTron type II intron, which also interrupted transcription of hypD (ca_c0811) (Figure S2). Analysis of hydrogenase activities with zymograms, Figure 2, showed a reduction of hydrogenase activity in the ΔhypF/hypD mutant when compared to WT. The activity profile was similar to the [NiFe]-hydrogenase null C. acetobutylicum M5 strain, which lacks the pSol plasmid containing the ca_p0141-0146 operon, indicating that the lowered hydrogenase activity is due to the loss of active [NiFe]-hydrogenase [24]. The [NiFe]-hydrogenase activity was recovered by complementation of the ΔhypF/hypD mutant with a plasmid containing the ca_c0810 and ca_c0811 genes expressed using the phosphotransbutyrylase promoter (ΔhypF/hypD:p-hypF/hypD). Residual hydrogenase activity in both the M5 and mutant strain is likely due to activity of the [FeFe]-hydrogenases.

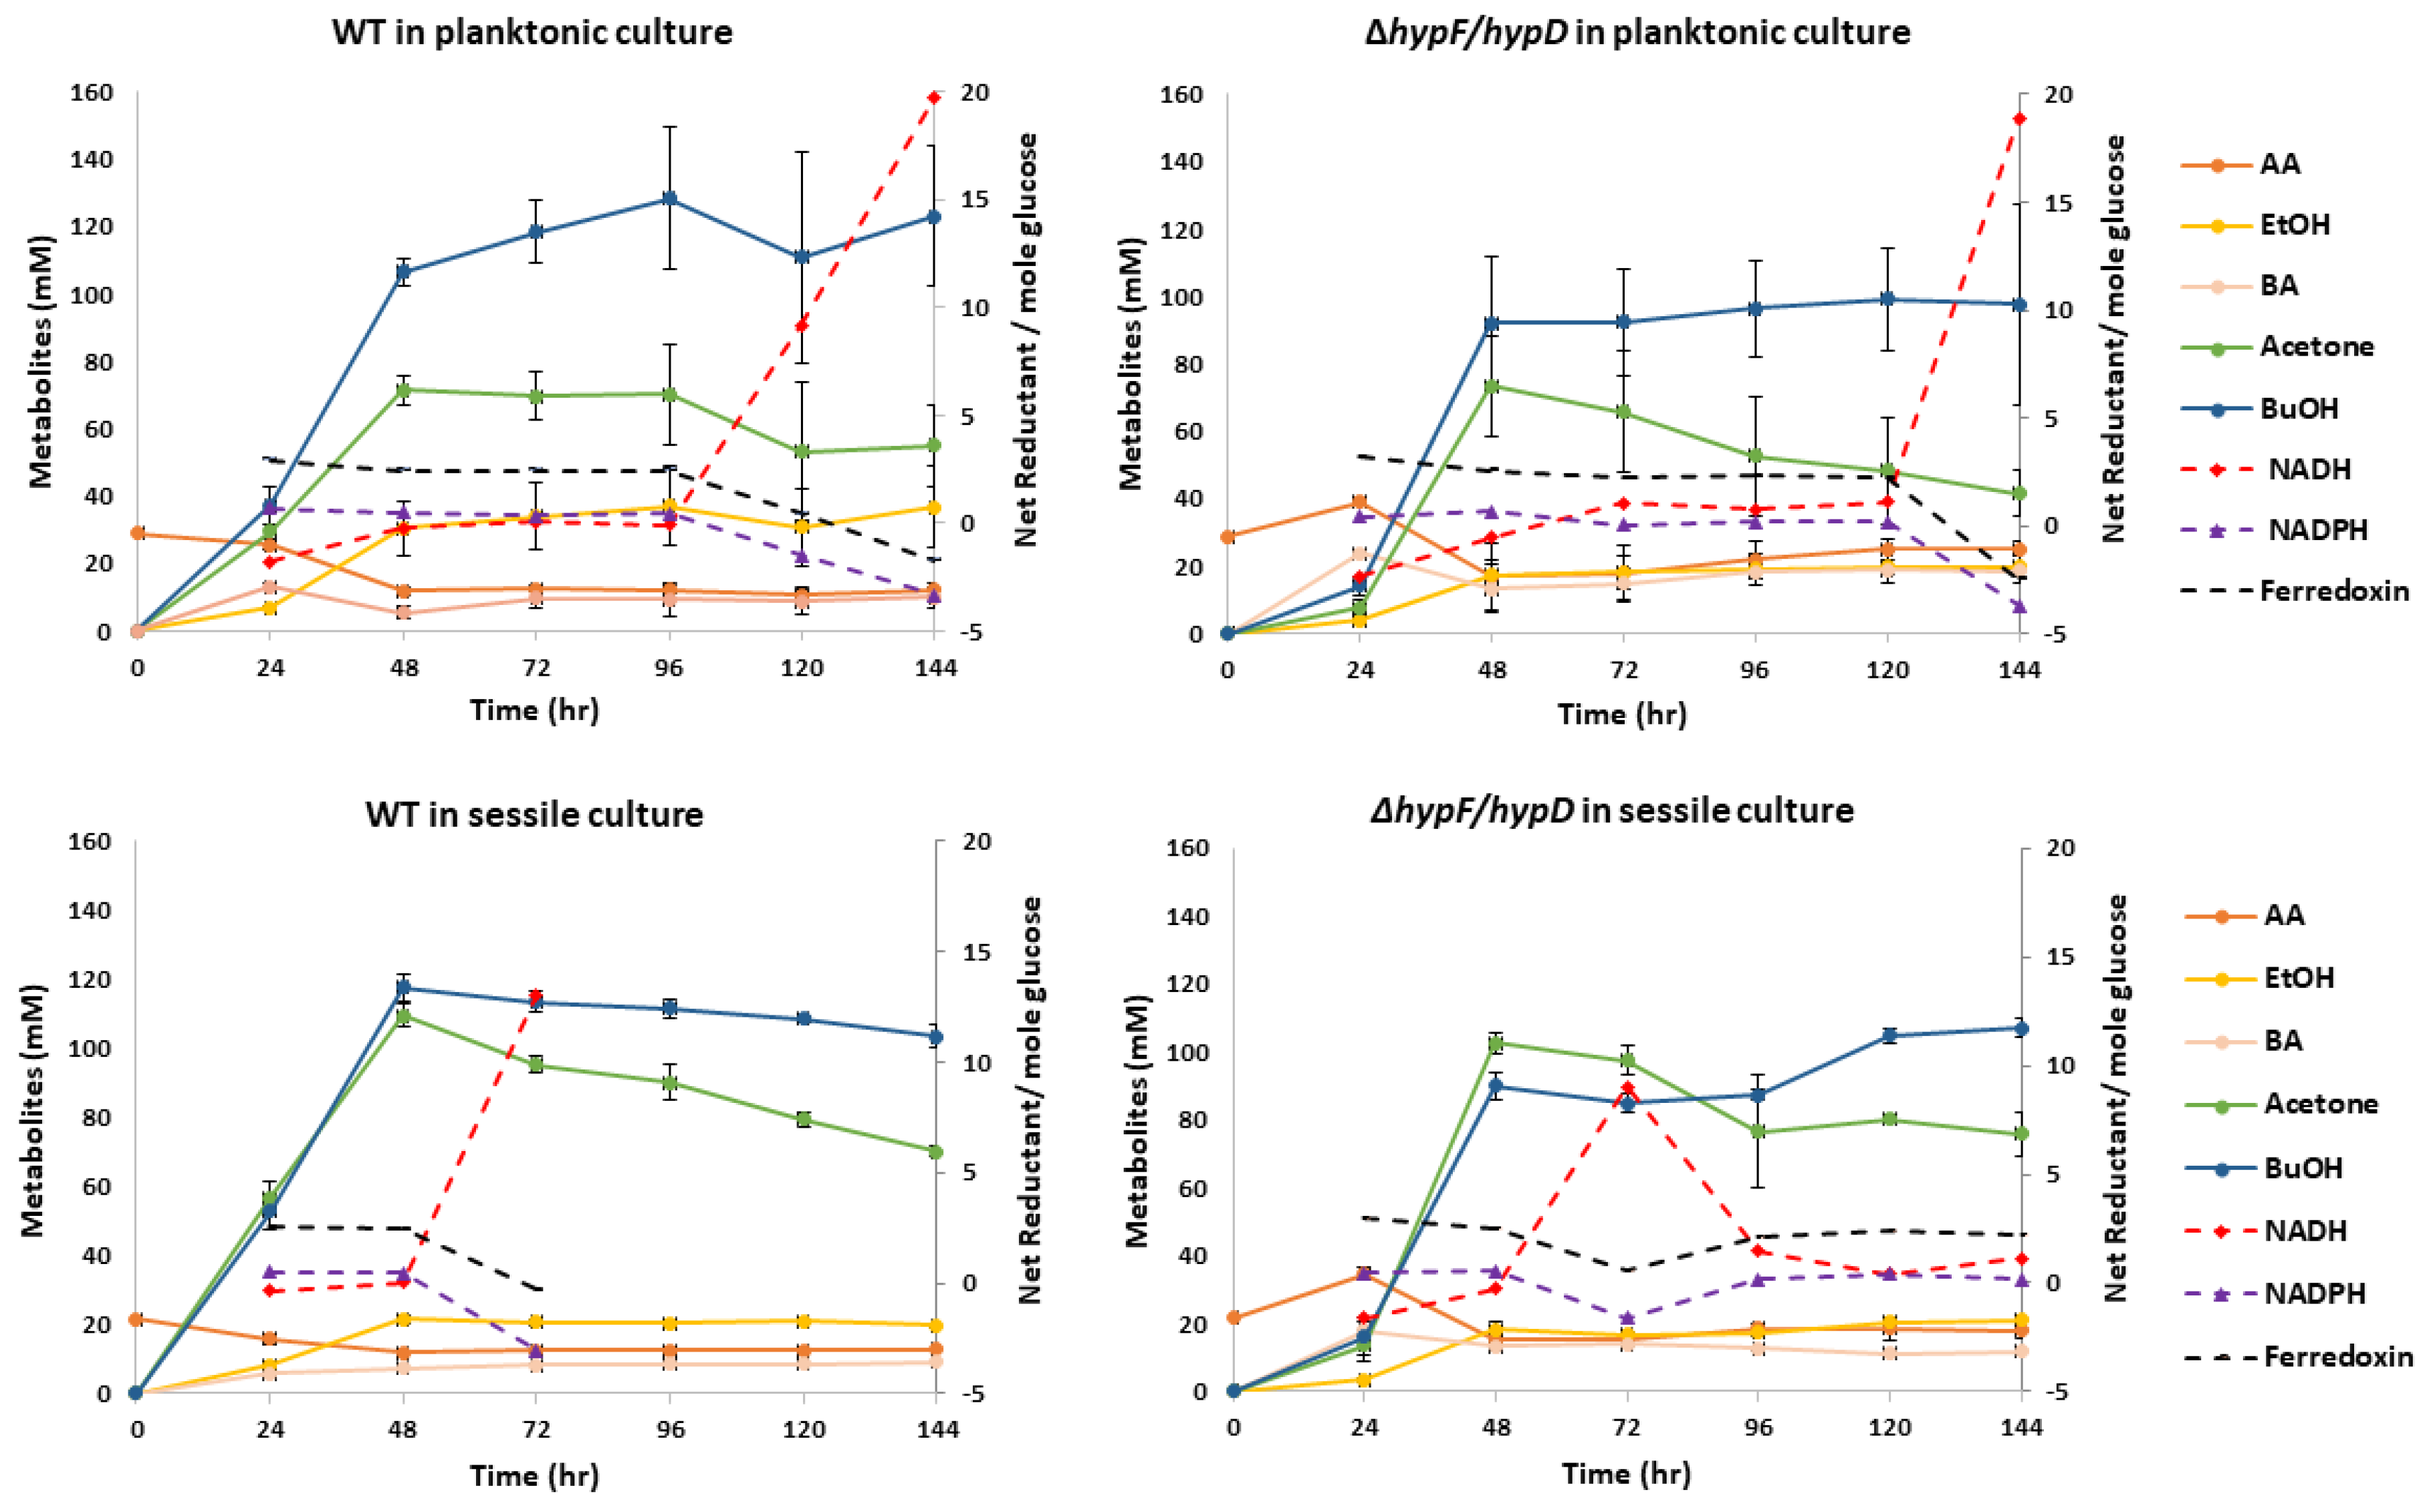
3.3. Contribution of [NiFe]-Hydrogenase to Metabolic Output

Previous bioinformatics analysis indicated that the C. acetobutylicum [NiFe]-hydrogenase could be used for H2 uptake [9]. Another study showed increased mRNA levels for the [NiFe]-hydrogenase and maturation factor genes during the solvent phase in sessile and planktonic cells [12]. To determine whether the [NiFe]-hydrogenase is important for solvent phase growth, metabolic outputs of WT and the ΔhypF/hypD mutant were compared under several growth conditions. The first experiment compared growth in bioreactors on rich medium with agitated and static cultures. Similar to previous experiments, the agitated cultures were expected to have lower dissolved gas (H2 and CO2) concentrations when compared to the static cultures [6]. After 24 h of growth in agitated cultures, WT and the ΔhypF/hypD mutant produced similar quantities of acetate, butyrate, and ethanol. There was slightly more butanol, ~5.7 mM vs. 1.6 mM, in WT cultures when compared to the ΔhypF/hypD mutant. After 24 h, WT and the ΔhypF/hypD mutant static bioreactor cultures had produced similar amounts of acetate and butyrate (Table 1). WT produced more ethanol than the ΔhypF/hypD mutant, ~5.4 mM vs. 2.8 mM, respectively. The largest difference in metabolic output was for butanol; where, after 24 h of growth in the static bioreactors, WT produced ~36.4 mM of butanol as compared to ~5.3 mM produced by the ΔhypF/hypD mutant.
Further metabolic studies were performed during growth in minimal medium in static planktonic and sessile cultures, since previous studies revealed that these conditions showed an increase in expression of mRNA for the [NiFe]-hydrogenase [12]. Analysis of the ΔhypF/hypD mutant’s metabolic output when compared to WT showed a decrease in total solvent concentrations in planktonic cultures, delayed entry into solventogenesis, and higher acetone to butanol ratios for sessile cultures at 48 h (Figure 3). The decrease in planktonic culture ABE production, from ~14.0 g·L−1 in WT to ~10.6 g·L−1 in the mutant, corresponded to a decrease in sugar utilization in the mutant cultures. Final ABE outputs of sessile cultures were similar between the two strains; however, low ABE concentrations for the mutant, when compared to WT, after 24 h showed there was a delayed entry into solventogenesis by the mutant (Figure 3). ΔhypF/hypD cultures initially produced higher acetone to butanol ratios than WT in sessile cultures. Between 48 h and 72 h, the metabolism of the ΔhypF/hypD cultures stalled, as indicated by decreased glucose utilization, and they incurred a metabolic switch, after which glucose consumption and butanol formation resumed. There was a loss in acetone from both cultures in this timeframe, which was likely due to evaporation or stripping. The solvent phase metabolic switch in the sessile ΔhypF/hypD cultures corresponded to an increase in calculated net NADH produced per mole glucose consumed, and a decrease in net ferredoxin and NADPH production. This was seen in the other cultures when glucose consumption stopped. End point residual concentrations of acetate and butyrate in the ΔhypF/hypD mutant planktonic cultures, ~25.1 mM and ~17.1 mM, are almost double that of WT planktonic cultures, ~12.5 mM and ~10.1 mM (Figure 3). Additionally, acetate concentrations in the mutant sessile cultures were higher than that of WT sessile cultures, pointing towards an inability of the ΔhypF/hypD mutant to reabsorb acids during solventogenesis. The shift towards residual oxidized product in the ΔhypF/hypD mutant, when compared to WT, is consistent with a loss in the ability to uptake hydrogen.
Complementation of WT and the mutant with either an empty pMTL plasmid or a ca_c0810/ca_c0811 operon and a ptb promoter on a plasmid, ΔhypF/hypD:pMTL, WT:pMTL, and ΔhypF/hypD:p-hypF/hypD, showed a significant decrease in alcohol formation in planktonic cultures when compared to the non-complemented strains, with ΔhypF/hypD:p-hypF/hypD not being able to recover alcohol formation equivalent to WT:pMTL (Figure S3). Alcohol formation in pMTL strains were lower in sessile conditions as well; however, complementation of the mutant strain with the ca_c0810/ca_c0811 operon recovered alcohol production in sessile conditions. Higher acetone concentrations were not seen in the sessile ΔhypF/hypD cultures complemented with the empty pMTL, likely due to the presence of the plasmid. High ethanol concentrations in all complement cultures were due to the addition of chloramphenicol dissolved in ethanol for plasmid maintenance.

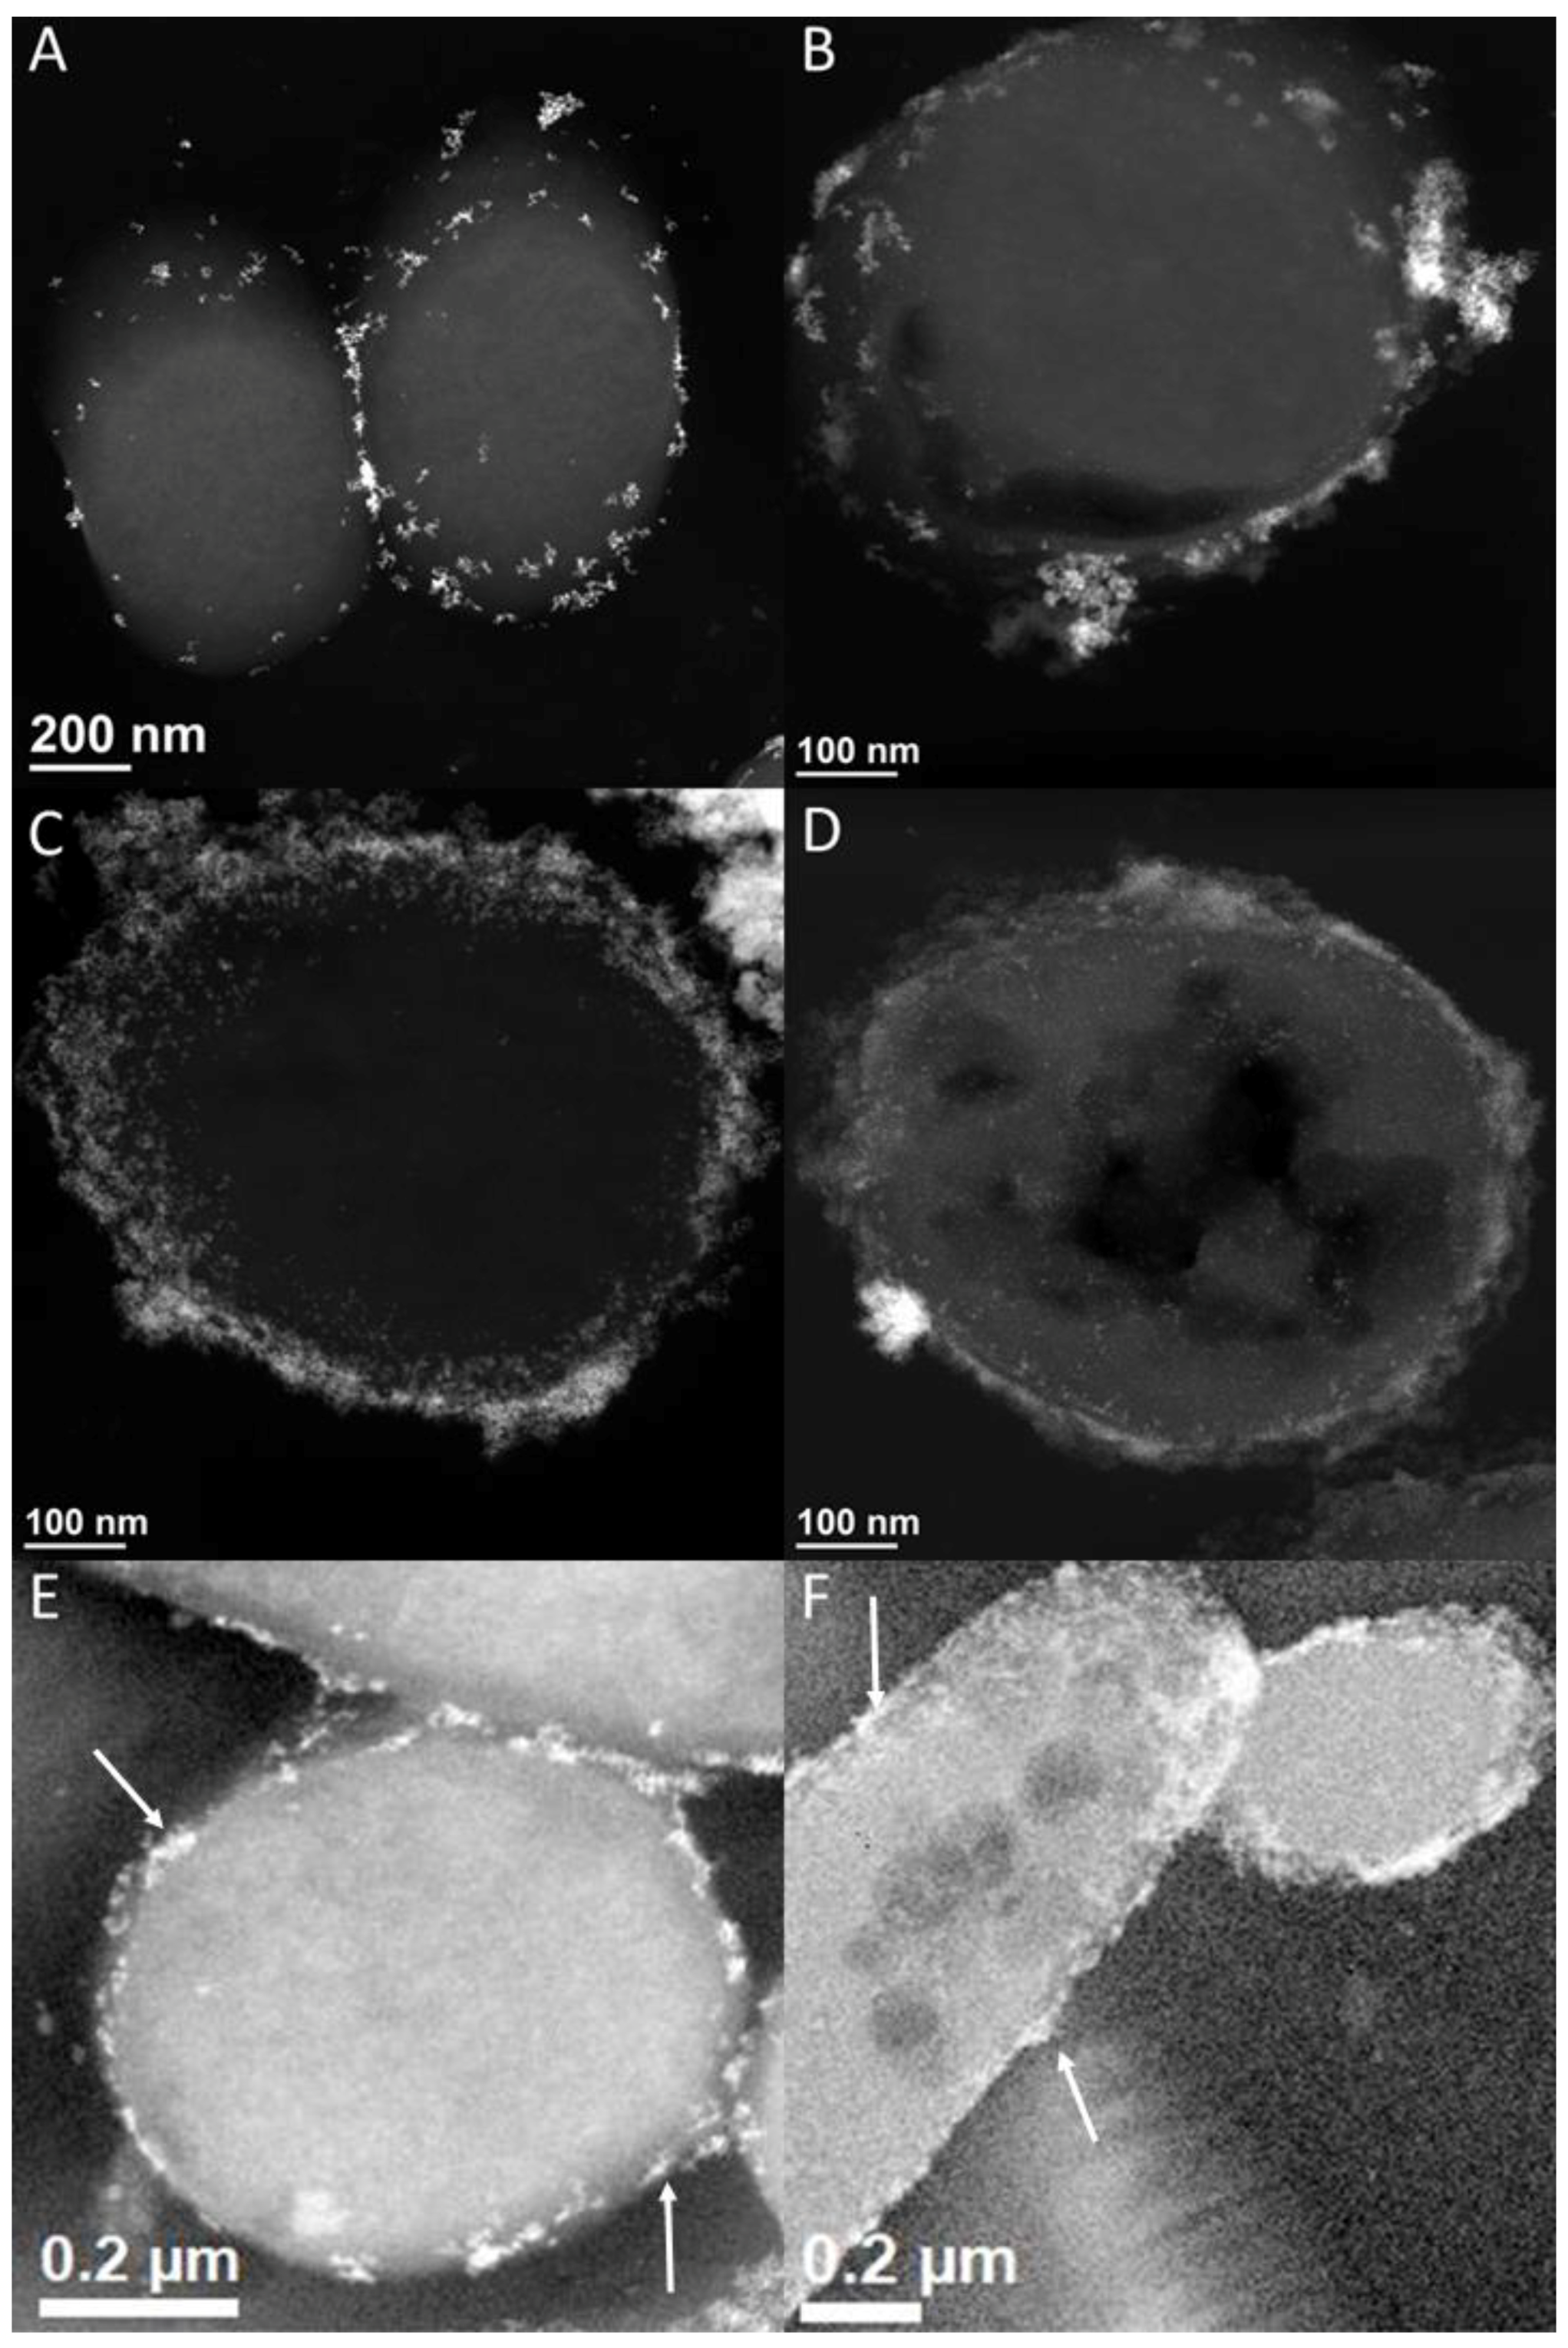
3.4. [NiFe]-Hydrogenase Location

[NiFe]-hydrogenases are classified into groups based on their function, reduction of NAD+ or NADP+, and location- either soluble membrane associated interior or membrane associated exterior. Although the C. acetobutylicum ATCC 824 [NiFe]-hydrogenase is classified as a group 1 [NiFe]-hydrogenase periplasmic enzyme [9], it was not clear how a periplasmic enzyme would play a role in hydrogen cycling based on calculated reduction potentials and whether the classification was correct.
In order to identify the [NiFe]-hydrogenase location, palladium(II) reduction at the catalytic site of the hydrogenase via H2 gas oxidation was identified based on the formation of palladium nanoparticles. Transmission Electron Microscopy images (TEM) in Figure 4 comparing ΔhypF/hypD, WT, M5, and dead (heat killed) WT cells showed the formation of palladium nanoparticles at the surface of the cell (Figure 4A–D). EFTEM mapping indicates these particles are on the exterior of the cell, with a decrease in formation nanoparticles in the mutant and the M5 [NiFe]-hydrogenase null strain (Figure 4E,F), demonstrating that the [NiFe]-catalytic subunits are exposed to the extracelluar side of the membrane. The presence of some nanoparticles indicate there may be some functional [NiFe]-hydrogenase activity, another redundant protein with the capability to oxidize H2, or nonspecific reduction of some of the Pd(II) occurring at the membrane.

3.5. Possible [NiFe]-Hydrogenase Function

The fate of electrons from hydrogen uptake by C. acetobutylicum’s [NiFe]-hydrogenase during solventogenesis is unknown. It is unlikely that ferredoxin is reduced during H2 uptake. The reduction potential of ferredoxin is too low to accept electrons from H2 without additional input of energy, since the [FeFe]-hydrogenase (ferredoxin dependent) is likely operating in the direction of H2 production. Therefore, H2 uptake by the [NiFe]-hydrogenase is probably coupled to the reduction of a higher potential electron acceptor, such as NAD+ or NADP+. If the [NiFe]-hydrogenase on the extracellular membrane face oxidizes H2 and electrons are transported across the membrane to internal electron acceptors, this would lead to energy conservation via H2 cycling (Figure 5A), similar to sulfate reducing bacteria [38]. To theoretically determine whether external H2 oxidation could be coupled to internal NAD+ or NADP+ reduction and the transport of two electrons, the reduction potentials of the reaction at various pHs were calculated, as described in the materials and methods, and the results are shown in Figure 5B. At high pH values, NAD+ reduction is not favorable, but at pH 4.5 the reaction potential is slightly above zero, indicating that it is favorable and it would be very responsive to changes in reactant/product concentrations. Values for electron transport coupled to NADP+ reduction were well below zero for all of the conditions examined, indicating that the reaction is not favorable.

4. Discussion

Control of electron flow is essential to engineer metabolism for the production of desired outputs [39]. Key enzymes for maintaining redox balance are the hydrogenases, which can direct electron flow to proton reduction. Hydrogenases can produce and/or consume H2, depending on metabolic state and/or the electron carrying cofactors used. In C. acetobutylicum, the majority of hydrogenase studies have focused on the [FeFe]-hydrogenases, which are important for ferredoxin recycling and the reduction of xenobiotic compounds [1,5]. The saccharolytic nature of C. acetobutylicum and the associated high metabolic flux through PFOR leads to a strong demand for ferredoxin oxidation by the [FeFe]-hydrogenase in growth conditions important for solvent formation [40]. While it has been demonstrated that the [FeFe]-hydrogenase oxidizes H2 in vitro, the physiologically relevant need for ferredoxin oxidation indicates that its primary role is H2 production [10]. During acidogenesis, the H2/CO2 ratio is approximately 1.2, but this decreases to ~0.7 during solventogenesis as a result of rerouting the electron flow from H2 to alcohol formation [5,6]. Reduction of carbohydrates and carboxylic acids to alcohols during solventogenesis changes the requirements for reduced cofactors, increasing the demand for NADH and NADPH.
A bioinformatics based classification of Clostridia hydrogenases indicated C. acetobutylicum encodes a probable group 1 membrane associated [NiFe]-hydrogenase implicated in hydrogen uptake [9]. Increased transcript levels for the C. acetobutylicum [NiFe]-hydrogenase and maturation genes were observed during late solventogenesis in sessile cells, and evidence of H2 uptake by the [NiFe]-hydrogenase in a related solventogenic organism indicated a solvent phase role for the C. acetobutylicum [NiFe]-hydrogenase [12,13]. C. acetobutylicum is unique because the hydrogenase genes and maturation factor genes are located on different genetic elements [9]: the chromosome and pSol megaplasmid, respectively (Figure 1). In the current study, the [NiFe]-maturation pathway was disrupted via interruption of ca_c0810, hypF, using the ClosTron type II intron system. A likely consequence of the hypF mutation was reduced HypD expression because the hypD gene is downstream of hypF in a polycistronic operon. Zymograms were used to show hydrogenase activity was similarly reduced in the ΔhypF/hypD mutant and M5 strain, providing evidence that chromosomally encoded HypF and HypD are important for the maturation of the megaplasmid encoded [NiFe]-hydrogenase. Furthermore, maturation of [FeFe]-hydrogenases requires a different set of maturation factors, so a disruption of [NiFe]-maturation was not expected to alter functional [FeFe]-hydrogenase production.
Acid and ABE formation were examined under several growth conditions to begin elucidating the [NiFe}-hydrogenase’s metabolic role. The first condition comprised cultures subject to agitation in bioreactors, where the headspace was flushed with N2. Under these growth conditions, levels of dissolved H2 would be comparatively lower than other conditions examined, reducing impacts from potential loss of H2 uptake in the ΔhypF/hypD mutant [6]. WT and the ΔhypF/hypD mutant in the first condition produced very little solvents and similar amounts of acetate and butyrate, indicating the [NiFe]-hydrogenase was not necessary for acidogenesis. The second condition examined planktonic cultures in bioreactors with zero agitation, where the headspace was flushed with N2. This would lead to relatively higher dissolved H2 levels as compared to agitated cultures. Under these conditions, the [NiFe]-hydrogenase appeared to be important for solvent production, since the ΔhypF/hypD mutant produced fewer solvents than the WT after 24 h, as shown in Table 1. A third condition, static planktonic growth in defined medium in an anaerobic chamber without N2 headspace flushing, exacerbated this effect. In the static planktonic conditions the ΔhypF/hypD mutant produced higher butyrate and lower butanol levels when compared to WT, thereby indicating the mutant was defective in reduction of butyrate to butanol or was less tolerant to butanol accumulation. The reduced capacity to produce butanol could be due to low NADH and NADPH availability, as reduction of butyryl-CoA to butanol is thought to require one NADH and one NADPH [1]. The apparent lack of reduced cofactor availability in the ΔhypF/hypD mutant during static planktonic growth indicates that the [NiFe]-hydrogenase is important for reducing NAD+ and/or NADP+ via hydrogen uptake.
To further test if the [NiFe]-hydrogenase was important for solvent formation, metabolite output was examined under a fourth growth condition consisting of sessile cultures grown in a defined medium in an anaerobic chamber without N2 headspace flushing. A recent study showed that growth in sessile conditions enhanced butanol production and that the [NiFe]-hydrogenase genes were induced during these conditions [41]. The ΔhypF/hypD mutant exhibited delayed growth, as indicated by the small changes in metabolite concentrations between 0 and 24 h shown in Figure 3. The ΔhypF/hypD mutant was ultimately able to recover, and during early solventogenesis the mutant had a higher acetone to butanol ratio than the WT, which is consistent with the inability to uptake H2 for the reduction of butyryl-CoA to butanol. This is in agreement with a recent study showing a lack of reduced NAD(P)H availability increased acetone output in solvent phase [42]. Solventogenesis stalled in the sessile ΔhypF/hypD mutant cultures between 48 h and 72 h, but resumed thereafter, presumably due to a shift in metabolism. During the solventogenic stall there was an increase in calculated net NADH formed from acid production when normalized to glucose consumption, suggesting there was compensation due to disruption of an NADH production pathway in the ΔhypF/hypD mutant. In the latter stages of solventogenesis of the sessile ΔhypF/hypD mutant cultures there was an increase in butanol, but not acetone or ethanol, and there was little to no net uptake of acetate and butyrate. This altered output/uptake profile suggests the ΔhypF/hypD mutant has a different electron flow for maintaining redox balance when compared to WT.
In order to determine the [NiFe]-hydrogenase’s location, EFTEM Pd elemental mapping was used to identify locations of Pd(0) nanoparticles that were formed by C. acetobutylicum strains using H2 gas as an electron donor. Pd(II) would be reduced to palladium(0) nanoparticles at the catalytic site of H2 oxidation and thus identify the location of the hydrogenase [43]. Comparisons of the EFTEM mapping results between the strains indicated that the [NiFe]-hydrogenase is membrane localized with the catalytic subunit facing the extracellular side of membrane. This is evidenced by the decrease of Pd(0) nanoparticle deposits on the ΔhypF/hypD and M5 pSol megaplasmid null strain, when compared to wild type.
It was not possible to definitively determine the electron acceptor of the [NiFe]-hydrogenase based upon sequence analysis, but the putative heme binding protein encoded by ca_p0144 is a strong candidate. A common mechanism for hydrogen uptake [NiFe]-hydrogenases is reduction of a cytochrome during H2 oxidation [44]. The reduced cytochrome then serves as an electron shuttle to move electrons from the hydrogenase to other enzyme systems. The location of the [NiFe]-hydrogenase on the extracellular face of the membrane suggests that a mechanism likely exists for transfer of electrons to and intracellular enzyme system. Based upon previously measured cellular parameters, it was calculated that NAD+ reduction could be coupled to membrane transport of two electrons. The calculations were performed assuming 1 bar of H2. Planktonic cultures can be supersaturated for H2, resulting in an increase of reaction potentials, which could make some of the reactions, that were calculated to be slightly below zero, favorable [45].
Evidence presented above shows it is likely the [NiFe]-hydrogenase that allows for extracellular H2 oxidation coupled to reduction of an intracellular electron acceptor. This activity, combined with the [FeFe]-hydrogenase actvity, allows for hydrogen cycling, which could serve as a crude proton pump (see Figure 5B), similar to the mechanism of hydrogen cycling characterized in Desulfovibrio [38]. Butanol has been shown to disrupt the pmf of C. acetobutylicum, and the [NiFe]-hydrogenase could counter this disruption during solvent production [46]. In this scenario, the [NiFe]-hydrogenase could improve the efficiency of pmf maintenance through hydrogen cycling while providing the NADH needed for alcohol production. It is plausible that disruption of hydrogenase maturation, resulting in an inability to maintain pmf, was responsible for the initial stalling in solvent phase growth of the sessile ΔhypF/hypD mutant cultures.
During solventogenesis the [NiFe]-hydrogenase could generate the required NADH, but an NADPH source would still be required for butanol dehydrogenase. NADPH could be supplied by the ferredoxin:NAD(P) reductase. A recent report indicated augmented ferredoxin:NAD(P) reductase expression during the solvent phase increases relative butanol output, presumably by redirecting electron flow from H2 production [41,47]. An alternative NADPH source could be NADP-dependent glyceraldehyde-3-phosphate dehydrogenase (GapN) [48]. A previous study showed that the gapN and [NiFe]-hydrogenase genes were induced during growth in sessile cultures, while genes for the glyceraldehyde-3-phosphate and phosphoglycerate kinase were repressed [12]. This suggests the route through glycolysis could be altered to compensate for increased NADPH demand. Calculations of reduction potentials using previously measured NAD+/NADH, NADP/NADP+, and internal pH values (see supplemental information) indicated the physiologic reduction potential is ~−260 mV for NAD+/NADH and ~−320 mV for NADP/NADP+. Due to this disparity, it is plausible that the cells have separate mechanisms to recycle the two cofactors.
This study demonstrates, to the best of our knowledge, the first evidence of hydrogen cycling as a potential energy conserving mechanism in Clostridium. C. acetobutylicum encodes for a group 4 [NiFe]-hydrogenase, not a group 1, that participates in hydrogen cycling to maintain the pmf for energy conservation and most likely produce NADH. The work highlights the need to improve knowledge of electron flow and membrane energetics in C. acetobutylicum in order to guide engineering strategies for directing product formation. Additionally, understanding how the ΔhypF/hypD mutant re-routed its metabolism during the latter phases of solventogenesis, when the major output was butanol, could lead to new strategies for the selective production of butanol.

Supplementary Materials

The following are available online at https://www.mdpi.com/2311-5637/4/3/55/s1

Author Contributions

K.L.G. performed zymograms, generated the ΔhypF/hypD mutant and complement strain, performed growth studies, performed palladium reduction studies, analyzed data, and wrote the manuscript. S.L. performed HPLC analysis of metabolites. E.S.G. performed growth studies, confirmed the ΔhypF/hypD mutant, performed palladium reduction studies, and edited the manuscript. R.L.R. performed RNAseq sample handling and analysis. M.D.S. performed experiments to establish knock out via southern blot and identify if there was nonspecific integration. T.N.K.Z. performed growth studies. H.D. performed sample embedding for TEM. A.M.S. performed microtome sample preparation and data collection for TEM and EFTEM. S.D.W performed EFTEM mapping for palladium location. C.J.S. conceived of the project, analyzed data, and wrote the manuscript.

Funding

This research received no external funding.

Conflicts of Interest

The authors declare no conflict of interest.

References

  1. Jones, D.T.; Woods, D.R. Acetone-butanol fermentation revisited. Microbiol. Rev. 1986, 50, 484–524. [Google Scholar] [PubMed]
  2. Gapes, J.R. The economics of acetone-butanol fermentation: Theoretical and market considerations. J. Mol. Microbiol. Biotechnol. 2000, 2, 27–32. [Google Scholar] [PubMed]
  3. Keis, S.; Shaheen, R.; Jones, D.T. Emended descriptions of Clostridium acetobutylicum and Clostridium beijerinckii, and descriptions of Clostridium saccharoperbutylacetonicum sp. nov. and Clostridium saccharobutylicum sp. nov. Int. J. Syst. Evol. Microbiol. 2001, 51, 2095–2103. [Google Scholar] [CrossRef] [PubMed]
  4. Girbal, L.; Croux, C.; Vasconcelos, I.; Soucaille, P. Regulation of metabolic shifts in Clostridium-acetobutylicum ATCC-824. FEMS Microbiol. Rev. 1995, 17, 287–297. [Google Scholar] [CrossRef]
  5. Cai, X.; Servinsky, M.; Kiel, J.; Sund, C.; Bennett, G.N. Analysis of redox responses during TNT transformation by Clostridium acetobutylicum ATCC 824 and mutants exhibiting altered metabolism. Appl. Microbiol. Biotechnol. 2013, 97, 4651–4663. [Google Scholar] [CrossRef] [PubMed]
  6. Servinsky, M.D.; Liu, S.; Gerlach, E.S.; Germane, K.L.; Sund, C.J. Fermentation of oxidized hexose derivatives by Clostridium acetobutylicum. Microb. Cell Fact. 2014, 13, 139. [Google Scholar] [CrossRef] [PubMed]
  7. Lutke-Eversloh, T.; Bahl, H. Metabolic engineering of Clostridium acetobutylicum: Recent advances to improve butanol production. Curr. Opin. Biotechnol. 2011, 22, 634–647. [Google Scholar] [CrossRef] [PubMed]
  8. Girbal, L.; Vasconcelos, I.; Soucaille, P. Transmembrane pH of Clostridium acetobutylicum is inverted (more acidic inside) when the in vivo activity of hydrogenase is decreased. J. Bacteriol. 1994, 176, 6146–6147. [Google Scholar] [CrossRef] [PubMed]
  9. Calusinska, M.; Happe, T.; Joris, B.; Wilmotte, A. The surprising diversity of clostridial hydrogenases: A comparative genomic perspective. Microbiology 2010, 156, 1575–1588. [Google Scholar] [CrossRef] [PubMed]
  10. Demuez, M.; Cournac, L.; Guerrini, O.; Soucaille, P.; Girbal, L. Complete activity profile of Clostridium acetobutylicum [FeFe]-hydrogenase and kinetic parameters for endogenous redox partners. FEMS Microbiol. Lett. 2007, 275, 113–121. [Google Scholar] [CrossRef] [PubMed]
  11. Yoo, M.; Bestel-Corre, G.; Croux, C.; Riviere, A.; Meynial-Salles, I.; Soucaille, P. A quantitative system-scale characterization of the metabolism of Clostridium acetobutylicum. mBio 2015, 6, e01808–e01815. [Google Scholar] [CrossRef] [PubMed]
  12. Liu, D.; Xu, J.; Wang, Y.; Chen, Y.; Shen, X.; Niu, H.; Guo, T.; Ying, H. Comparative transcriptomic analysis of Clostridium acetobutylicum biofilm and planktonic cells. J. Biotechnol. 2016, 218, 1–12. [Google Scholar] [CrossRef] [PubMed]
  13. Nakayama, S.; Kosaka, T.; Hirakawa, H.; Matsuura, K.; Yoshino, S.; Furukawa, K. Metabolic engineering for solvent productivity by downregulation of the hydrogenase gene cluster hupCBA in Clostridium saccharoperbutylacetonicum strain N1-4. Appl. Microbiol. Biotechnol. 2008, 78, 483–493. [Google Scholar] [CrossRef] [PubMed]
  14. Clark, S.W.; Bennett, G.N.; Rudolph, F.B. Isolation and characterization of mutants of Clostridium acetobutylicum ATCC 824 deficient in acetoacetyl-coenzyme a: Acetate/butyrate: Coenzyme a-transferase (EC 2.8. 3.9) and in other solvent pathway enzymes. Appl. Environ. Microbiol. 1989, 55, 970–976. [Google Scholar] [PubMed]
  15. Al-Shorgani, N.K.N.; Kalil, M.S.; Ali, E.; Yusoff, W.M.W.; Hamid, A.A. Enhancement of biobutanol production by butyric acid addition using Clostridium saccharoperbutylacetonicum N1-4 (ATCC 13564). Biotechnology 2012, 11, 326–332. [Google Scholar]
  16. Servinsky, M.D.; Kiel, J.T.; Dupuy, N.F.; Sund, C.J. Transcriptional analysis of differential carbohydrate utilization by Clostridium acetobutylicum. Microbiology 2010, 156, 3478–3491. [Google Scholar] [CrossRef] [PubMed]
  17. Heap, J.T.; Pennington, O.J.; Cartman, S.T.; Carter, G.P.; Minton, N.P. The clostron: A universal gene knock-out system for the genus clostridium. J. Microbiol. Methods 2007, 70, 452–464. [Google Scholar] [CrossRef] [PubMed]
  18. Perutka, J.; Wang, W.; Goerlitz, D.; Lambowitz, A.M. Use of computer-designed group II introns to disrupt Escherichia coli DExH/D-box protein and DNA helicase genes. J. Mol. Biol. 2004, 336, 421–439. [Google Scholar] [CrossRef] [PubMed]
  19. Heap, J.T.; Kuehne, S.A.; Ehsaan, M.; Cartman, S.T.; Cooksley, C.M.; Scott, J.C.; Minton, N.P. The clostron: Mutagenesis in clostridium refined and streamlined. J. Microbiol. Methods 2010, 80, 49–55. [Google Scholar] [CrossRef] [PubMed]
  20. Servinsky, M.D.; Julin, D.A. Effect of a recd mutation on DNA damage resistance and transformation in Deinococcus radiodurans. J. Bacteriol. 2007, 189, 5101–5107. [Google Scholar] [CrossRef] [PubMed]
  21. Tyurin, M.; Padda, R.; Huang, K.X.; Wardwell, S.; Caprette, D.; Bennett, G.N. Electrotransformation of Clostridium acetobutylicum ATCC 824 using high-voltage radio frequency modulated square pulses. J. Appl. Microbiol. 2000, 88, 220–227. [Google Scholar] [CrossRef] [PubMed]
  22. Bolger, A.M.; Lohse, M.; Usadel, B. Trimmomatic: A flexible trimmer for illumina sequence data. Bioinformatics 2014, 30, 2114–2120. [Google Scholar] [CrossRef] [PubMed]
  23. McClure, R.; Balasubramanian, D.; Sun, Y.; Bobrovskyy, M.; Sumby, P.; Genco, C.A.; Vanderpool, C.K.; Tjaden, B. Computational analysis of bacterial RNA-Seq data. Nucleic Acids Res. 2013, 41, e140. [Google Scholar] [CrossRef] [PubMed]
  24. Pinske, C.; Jaroschinsky, M.; Sargent, F.; Sawers, G. Zymographic differentiation of [NiFe]-hydrogenases 1, 2 and 3 of Escherichia coli K-12. BMC Microbiol. 2012, 12, 1. [Google Scholar] [CrossRef] [PubMed]
  25. Finch, A.S.; Mackie, T.D.; Sund, C.J.; Sumner, J.J. Metabolite analysis of Clostridium acetobutylicum: Fermentation in a microbial fuel cell. Bioresour. Technol. 2011, 102, 312–315. [Google Scholar] [CrossRef] [PubMed]
  26. Yong, P.; Rowson, N.A.; Farr, J.P.G.; Harris, I.R.; Macaskie, L.E. Bioreduction and biocrystallization of palladium by Desulfovibrio desulfuricans NCIMB 8307. Biotechnol. Bioeng. 2002, 80, 369–379. [Google Scholar] [CrossRef] [PubMed]
  27. Huang, L.; Gibbins, L.N.; Forsberg, C.W. Transmembrane pH gradient and membrane potential in Clostridium acetobutylicum during growth under acetogenic and solventogenic conditions. Appl. Environ. Microbiol. 1985, 50, 1043–1047. [Google Scholar] [PubMed]
  28. Amador-Noguez, D.; Feng, X.J.; Fan, J.; Roquet, N.; Rabitz, H.; Rabinowitz, J.D. Systems-level metabolic flux profiling elucidates a complete, bifurcated tricarboxylic acid cycle in Clostridium acetobutylicum. J. Bacteriol. 2010, 192, 4452–4461. [Google Scholar] [CrossRef] [PubMed]
  29. Mao, F.L.; Dam, P.; Chou, J.; Olman, V.; Xu, Y. Door: A database for prokaryotic operons. Nucleic Acids Res. 2009, 37, D459–D463. [Google Scholar] [CrossRef] [PubMed]
  30. Dam, P.; Olman, V.; Harris, K.; Su, Z.C.; Xu, Y. Operon prediction using both genome-specific and general genomic information. Nucleic Acids Res. 2007, 35, 288–298. [Google Scholar] [CrossRef] [PubMed]
  31. Tjaden, B. De novo assembly of bacterial transcriptomes from RNA-Seq data. Genome Biol. 2015, 16, 1. [Google Scholar] [CrossRef] [PubMed]
  32. Caspi, R.; Billington, R.; Ferrer, L.; Foerster, H.; Fulcher, C.A.; Keseler, I.M.; Kothari, A.; Krummenacker, M.; Latendresse, M.; Mueller, L.A.; et al. The metacyc database of metabolic pathways and enzymes and the biocyc collection of pathway/genome databases. Nucleic Acids Res. 2016, 44, D471–D480. [Google Scholar] [CrossRef] [PubMed]
  33. Boratyn, G.M.; Schaffer, A.A.; Agarwala, R.; Altschul, S.F.; Lipman, D.J.; Madden, T.L. Domain enhanced lookup time accelerated BLAST. Biol. Direct 2012, 7, 12. [Google Scholar] [CrossRef] [PubMed] [Green Version]
  34. Johnson, M.; Zaretskaya, I.; Raytselis, Y.; Merezhuk, Y.; McGinnis, S.; Madden, T.L. NCBI BLAST: A better web interface. Nucleic Acids Res. 2008, 36, W5–W9. [Google Scholar] [CrossRef] [PubMed]
  35. Muller, A.; MacCallum, R.M.; Sternberg, M.J.E. Benchmarking PSI-BLAST in genome annotation. J. Mol. Biol. 1999, 293, 1257–1271. [Google Scholar] [CrossRef] [PubMed]
  36. Altschul, S.F.; Gish, W.; Miller, W.; Myers, E.W.; Lipman, D.J. Basic local alignment search tool. J. Mol. Biol. 1990, 215, 403–410. [Google Scholar] [CrossRef]
  37. Paschos, A.; Bauer, A.; Zimmermann, A.; Zehelein, E.; Bock, A. Hypf, a carbamoyl phosphate-converting enzyme involved in [NiFe]-hydrogenase maturation. J. Biol. Chem. 2002, 277, 49945–49951. [Google Scholar] [CrossRef] [PubMed]
  38. Odom, J.M.; Peck, H.D., Jr. Hydrogenase, electron-transfer proteins, and energy coupling in the sulfate-reducing bacteria Desulfovibrio. Annu. Rev. Microbiol. 1984, 38, 551–592. [Google Scholar] [CrossRef] [PubMed]
  39. Wang, Y.; San, K.-Y.; Bennett, G.N. Cofactor engineering for advancing chemical biotechnology. Curr. Opin. Biotechnol. 2013, 24, 994–999. [Google Scholar] [CrossRef] [PubMed] [Green Version]
  40. Vasconcelos, I.; Girbal, L.; Soucaille, P. Regulation of carbon and electron flow in Clostridium-acetobutylicum grown in chemostat culture at neutral ph on mixtures of glucose and glycerol. J. Bacteriol. 1994, 176, 1443–1450. [Google Scholar] [CrossRef] [PubMed]
  41. Liu, D.; Chen, Y.; Li, A.; Ding, F.Y.; Zhou, T.; He, Y.; Li, B.B.; Niu, H.Q.; Lin, X.Q.; Xie, J.J.; et al. Enhanced butanol production by modulation of electron flow in Clostridium acetobutylicum B3 immobilized by surface adsorption. Bioresour. Technol. 2013, 129, 321–328. [Google Scholar] [CrossRef] [PubMed]
  42. Liu, D.; Yang, Z.J.; Wang, P.; Niu, H.Q.; Zhuang, W.; Chen, Y.; Wu, J.L.; Zhu, C.J.; Ying, H.J.; Ouyang, P.K. Towards acetone-uncoupled biofuels production in solventogenic clostridium through reducing power conservation. Metab. Eng. 2018, 47, 102–112. [Google Scholar] [CrossRef] [PubMed]
  43. Mikheenko, I.P.; Rousset, M.; Dementin, S.; Macaskie, L.E. Bioaccumulation of palladium by Desulfovibrio fructosivorans wild-type and hydrogenase-deficient strains. Appl. Environ. Microbiol. 2008, 74, 6144–6146. [Google Scholar] [CrossRef] [PubMed]
  44. Frielingsdorf, S.; Schubert, T.; Pohlmann, A.; Lenz, O.; Friedrich, B. A trimeric supercomplex of the oxygen-tolerant membrane-bound [NIFE]-hydrogenase from ralstonia eutropha H16. Biochemistry 2011, 50, 10836–10843. [Google Scholar] [CrossRef] [PubMed]
  45. Pauss, A.; Andre, G.; Perrier, M.; Guiot, S.R. Liquid-to-gas mass transfer in anaerobic processes: Inevitable transfer limitations of methane and hydrogen in the biomethanation process. Appl. Environ. Microbiol. 1990, 56, 1636–1644. [Google Scholar] [PubMed]
  46. Terracciano, J.S.; Kashket, E.R. Intracellular conditions required for initiation of solvent production by Clostridium acetobutylicum. Appl. Environ. Microbiol. 1986, 52, 86–91. [Google Scholar] [PubMed]
  47. Magnan, D.T.C.; San, K.Y.; Bennett, G.N. Modification of butyrate and butanol production in Clostridium acetobutylicum by introduction of a ferredoxin oxidoreductase. In Proceedings of the Rice University: SIMB Annual Meeting, New Orleans, LA, USA, 24–28 July 2016. [Google Scholar]
  48. Iddar, A.; Valverde, F.; Serrano, A.; Soukri, A. Expression, purification, and characterization of recombinant nonphosphorylating NADP-dependent glyceraldehyde-3-phosphate dehydrogenase from Clostridium acetobutylicum. Protein Expr. Purif. 2002, 25, 519–526. [Google Scholar] [CrossRef]
Figure 1. Genetic maps of [NiFe]-hydrogenase subunit and maturation factor operons. Black arrows denote transcriptional start sites for operons indicated by DOOR2 and Rockhopper using RNA-Seq data (Figure S2) [22,28]. One operon is located on the chromosome and includes genes for maturation factors HypC/HybG, HypE, HypF, and HypD; annotated ca_c0808, ca_c0809, ca_c0810, and ca_c0811, respectively. The second operon is located on the pSol megaplasmid, and it includes genes for the two hydrogenase subunits, the HyaD protease, a putative heme binding protein, possible HypA maturation factor, and a hypothetical truncated HypF like protein; annotated ca_p0141, ca_p0142, ca_p0143, ca_p0144, ca_p0145, and ca_p0146, respectively.
Fermentation 04 00055 g001
Figure 2. Zymogram of hydrogenase activity showing HypF/HypD is required for H2 dependent reduction of 2.0 mM 2,3,5,-triphenyltetrazolium chloride (TTC) by the [NiFe]-hydrogenase. Sixty micrograms of total protein derived from M5, WT, ΔhypF/hypD, and ΔhypF/hypD: p-hypF/hypD grown anaerobically in Clostridial growth medium (CGM) containing 6.0% glucose was subjected to non-denaturing PAGE. (A) Image of gel containing cell lysates stained with Coomassie Simply Blue; (B) Image of the gel containing cell lysates stained under a hydrogen atmosphere with benzyl viologen (BV) and TTC as electron acceptors.
Fermentation 04 00055 g002
Figure 3. Metabolite profiles of planktonic and sessile cultures grown in minimal medium containing 6.0% glucose from an N = 3 experiment. Metabolite concentrations and calculated reduced cofactor formation vs. time for WT and ΔhypF/hypD cultures. The left Y axes correspond to metabolite concentrations in mM for acetate (AA), ethanol (EtOH), butyrate (BA), acetone, and butanol (BuOH). The right Y axes correspond to calculated reduced cofactors (NADH, NADPH, and ferredoxin) formed from consumption/production of acetyl-CoA calculated from changes in metabolite concentrations from the previous time point. Total calculated reduced cofactors were normalized to glucose utilization for the same time period and expressed as net reductant/mol glucose. These calculations are not included for time points after glucose utilization ceased.
Fermentation 04 00055 g003
Figure 4. Scanning transmission electron microscopy high-angle annular dark field (STEM-HAADF) dark field images and energy filtered transmission electron microscope (EFTEM) Pd elemental maps comparing Pd(0) nanoparticle formation in different C. acetobutylicum strains. STEM-HAADF images of Pd(II)-challenged C. acetobutylicum strains with H2 gas as an electron donor demonstrate localization of Pd(0) nanoparticle formation on the surface of (A) ΔhypF/hypD; (B) M5; (C) WT; and, (D) dead WT cells (heat killed); EFTEM Pd elemental map of (E) ΔhypF/hypD and (F) WT reveal palladium(0) nanoparticles are located on the extracellular side of the membrane. Palladium(0) maps as bright white particles around the cells. Nanoparticle examples are indicated with white arrows. Scale bars are 200 nm and 100 nm, respectively.
Fermentation 04 00055 g004
Figure 5. Possible physiological role of [NiFe-hydrogenase]. Panel (A) indicates NAD+ and NADP+ reduction potentials calculated for the [NiFe]-hydrogenase schematic in panel B for acidogensis and solventogensis. Details of the calculations are available in the material and methods and supplemental material; Panel (B) is a schematic of potential hydrogen cycling with the [FeFe]-hydrogenase and [NiFe]-hydrogenase. Protons are reduced to H2 intracellularly by the [FeFe]-hydrogenase and the H2 can freely cross the membrane. The [NiFe]-hydrogenase is localized on the extracellular membrane face, converting H2 to protons externally. Electrons are transported via an electron transport molecule to a cytoplasmic-facing NAD+ reductase.
Fermentation 04 00055 g005
Table 1. Metabolic output of wild type (WT) and mutant strains in static planktonic (stat.) and agitated (agit.) cultures grown on CGM containing 5.0% glucose in anaerobic bioreactors.
Glucose ConsumedAcetateAcetoneAcetoinEthanolButyrateButanol
WT agit.76.928.83.41.31.943.75.7
ΔhypF/hypD agit.63.431.50.00.91.941.91.6
WT stat.10624.917.92.95.427.236.4
ΔhypF/hypD stat.63.727.60.01.72.841.85.33
N = 2Concentrations in mM Time = 24 h

