Article

Characterizing the Phenotypic Responses of Escherichia coli to Multiple 4-Carbon Alcohols with Raman Spectroscopy

by
Theresah N. K. Zu
,
Ahmad I. M. Athamneh
and
Ryan S. Senger
*
Department of Biological Systems Engineering, Virginia Tech, Blacksburg, VA 24061, USA
*
Author to whom correspondence should be addressed.
Fermentation 2016, 2(1), 3; https://doi.org/10.3390/fermentation2010003
Submission received: 3 December 2015 / Revised: 14 January 2016 / Accepted: 15 January 2016 / Published: 25 January 2016
(This article belongs to the Special Issue Metabolic Engineering)

Abstract

:
The phenotypic responses of E. coli cells exposed to 1.2% (v/v) of 1-butanol, 2-butanol, isobutanol, tert-butanol, and 1,4-butanediol were studied in near real-time using Raman spectroscopy. A method of “chemometric fingerprinting” was employed that uses multivariate statistics (principal component analysis and linear discriminant analysis) to identify E. coli phenotypic changes over a 180 min post-treatment time-course. A toxicity study showed extreme variability among the reduction in culture growth, with 1-butanol showing the greatest toxicity and 1,4-butanediol showing relatively no toxicity. Chemometric fingerprinting showed distinct phenotype clusters according to the type of alcohol: (i) 1-butanol and 2-butanol (straight chain alcohols); (ii) isobutanol and tert-butanol (branched chain alcohols); and (iii) control and 1,4-butanediol (no terminal alkyl end) treated cells. While the isobutanol and tert-butanol treated cells led to similar phenotypic responses, isobutanol was significantly more toxic. In addition, the phenotypic response was found to take place largely within 60 min of culture treatment; however, significant responses (especially for 1,4-butanediol) were still occurring at 180 min post-treatment. The methodology presented here identified different phenotypic responses to seemingly similar 4-carbon alcohols and can be used to study phenotypic responses of virtually any cell type under any set of environmental conditions or genetic manipulations.

Graphical Abstract

1. Introduction

Toxicity is a major impediment to production of alcohols by fermentation, as they inhibit microbial growth and restrict product yields significantly [1,2,3,4]. For example, with production of isobutanol from E. coli, growth is retarded by concentrations as low as 1% (v/v) [4]. To maintain homeostasis and optimize the use of resources, host microbes activate several genetic programs in response to changing environmental conditions [5,6,7,8,9,10]. Previous studies have shown that the microbial response to alcohol toxicity is not universal but varies according to the host microbe and the type of alcohol [8,9,10,11,12,13,14]. Understanding the nature and dynamics of the host response to specific alcohols is essential for designing effective metabolic and process engineering solutions. In this research, Raman spectroscopy was used to explore the dynamic phenotypes of E. coli cells exposed to toxic levels of different 4-carbon alcohols.
The cellular response to alcohol toxicity is dominated by the physiochemical properties of the alcohol rather than by specific receptors [14]. Alcohols are known to cause membrane disruption by mechanisms of desiccation (alcohols with less than four carbon atoms) or intercalation (alcohols with more than four carbon atoms) of lipophilic side chains inside the membrane lipid bilayer [14,15,16]. It is generally agreed that long-chain alcohols have the ability to intercalate further into the lipid bilayer and disrupt hydrogen bonding between hydrophobic tails, causing relatively more toxicity than short-chain alcohols [17,18,19]. Alcohol toxicity causes increased cell membrane fluidity, altered regulation of internal pH, disruption of protein–lipid interactions, and decreased energy generation by the inhibition of glucose and nutrient transport [4,20,21]. The following alcohol toxicity responses have been elucidated: (i) altered cytoplasmic membrane as well as cell surface properties; (ii) altered cell envelope protein composition; (iii) changed peptidoglycan, membrane lipid, and lipopolysaccharide (LPS) compositions; and (iv) synthesis of protective metabolites and solvent efflux pumps [20,21]. In addition to isobutanol, 1-butanol (or n-butanol) remains a promising biofuel (and chemical commodity). Yet, it is one of the most toxic alcohols due to its elevated hydrophobicity (relative to other alcohols) [15], and its toxicity is strain-dependent [8,9,10,11,12,13]. Despite significant advances, many details regarding the mode of action of different alcohols as well as the nature and adaptation mechanism to alcohol exposure are still being resolved.
Recently, the application of Raman spectroscopy for near real-time phenotyping was demonstrated by the analysis of E. coli DH5α cells exposed to 1.2% (v/v) 1-butanol [22]. Raman spectral data for control and 1-butanol exposed cultures were correlated with GC-FID analyses of fatty acids. Consistent trends were observed for changes in saturated, unsaturated, and cyclopropane fatty acids with 1-butanol exposure and over a time-course. Raman bands (i.e., spectral peaks) were correlated with other standardized methods including: (i) fluorescence anisotropy measurement of membrane fluidity; (ii) Bradford assay of total protein content; and (iii) HPLC analysis of individual amino acids content. The major advantages of the approach are that (i) results are returned in near real-time; (ii) it is non-destructive to the sample; and (iii) minimal sample preparation is required (chemical label-free). Raman spectroscopy has also been applied in other biological research for purposes of (among many others) (i) species characterization [23]; (ii) studying cell differentiation [24]; (iii) identifying the mechanism of action of antimicrobial compounds [25], and fermentation monitoring [26,27,28].
In this research, we examined the dynamic phenotypic response of E. coli to several 4-carbon alcohols: (i) 1-butanol; (ii) 2-butanol; (iii) isobutanol; (iv) tert-butanol; and (v) 1,4-butanediol. 1-Butanol is produced biologically through fermentation by Clostridium (e.g., both C. acetobutylicum and C. beijerinckii) [29,30]. Metabolic pathway engineering has enabled production of isobutanol [31] and 1,4-butanediol [32]. The present study builds on the previous study with 1-butanol induced phenotypes [22], but instead of considering individual Raman bands and relating them to measurable phenotypic traits, the entire spectra were used as representatives of cell phenotypes. Comparison of these spectra involved the use multivariate statistics (i.e., principal component analysis (PCA) and linear discriminant analysis (DA)) in a method we refer to as “chemometric fingerprinting”. This method of data analysis served to identify similar and significantly different phenotypic responses of E. coli cultures over a 180 min time-course following alcohol exposure.

2. Experimental Section

2.1. Bacteria Strain and Chemicals

E. coli DH5α cells were used in all experiments and were obtained from Invitrogen Life Technologies (Grand Island, NY, USA). Frozen stock cultures were plated onto solid agar plates prior to experiments or otherwise were stored in glycerol at −80 °C. All chemicals were purchased from Sigma–Aldrich (St. Louis, MO, USA) and were of at least 99% purity.

2.2. Culture Conditions

E. coli cells were grown in LB media containing tryptone (10 g/L), yeast extract (5 g/L), and sodium chloride (10 g/L) as previously described [22]. Cultures were grown at 37 °C and agitated in a rotary shaker at 210 RPM. Culture optical density was measured at 600 nm (OD600). Subcultures were prepared by diluting 100 µL of culture with 25 mL fresh LB media. At the onset of the exponential growth phase (OD600 of 0.4–0.5), the culture was split into six equal portions (5 mL each), with one serving as the negative control. The different alcohols: 1-butanol, 2-butanol, isobutanol, tert-butanol, and 1,4-butanediol were added to respective cultures to a concentration of 1.2% (v/v), and all cultures were re-incubated for 60 min prior to sampling. Samples (250 µL) were taken every 30 min from all cultures for a total of 180 min. Cells were centrifuged at 10,000 rpm at 4 °C for 5 min and washed with chilled PBS buffer. This process was repeated five times. The cells were re-suspended in 250 µL of Type 1 purified water for analysis by Raman spectroscopy.

2.3. Raman Spectroscopy and Data Analysis

Raman spectroscopy was performed as published previously [22,25], except that the analysis required 50 µL of washed cells. In short, cells were dried at room temperature on an aluminum surface and analyzed using a Bruker Senterra dispersive Raman spectrometer, which was attached to a confocal microscope (100× magnification) and equipped with OPUS software (Bruker Optics, Billerica, MA, USA). Laser excitation of 532 nm (20 mW) was applied for 10 s and a spectral resolution of 9–15 cm−1 was used. A minimum of 50 spectra were collected from different location in each sample. All data analysis was carried out in OPUS (baseline correction) and MATAB (R2012A) (MathWorks, Natick, MA, USA). Spectra were vector normalized over the entire wavelength range of the spectra (400–3200 cm−1) [22]. PCA allowed for identification of outlier data points, which were then excluded. PCA was then used to reduce the dataset for DA. DA was then performed using the first 10 principal components, as described previously [25], in order to separate and cluster samples based on the different phenotypic responses to 4-carbon alcohol exposure.

3. Results

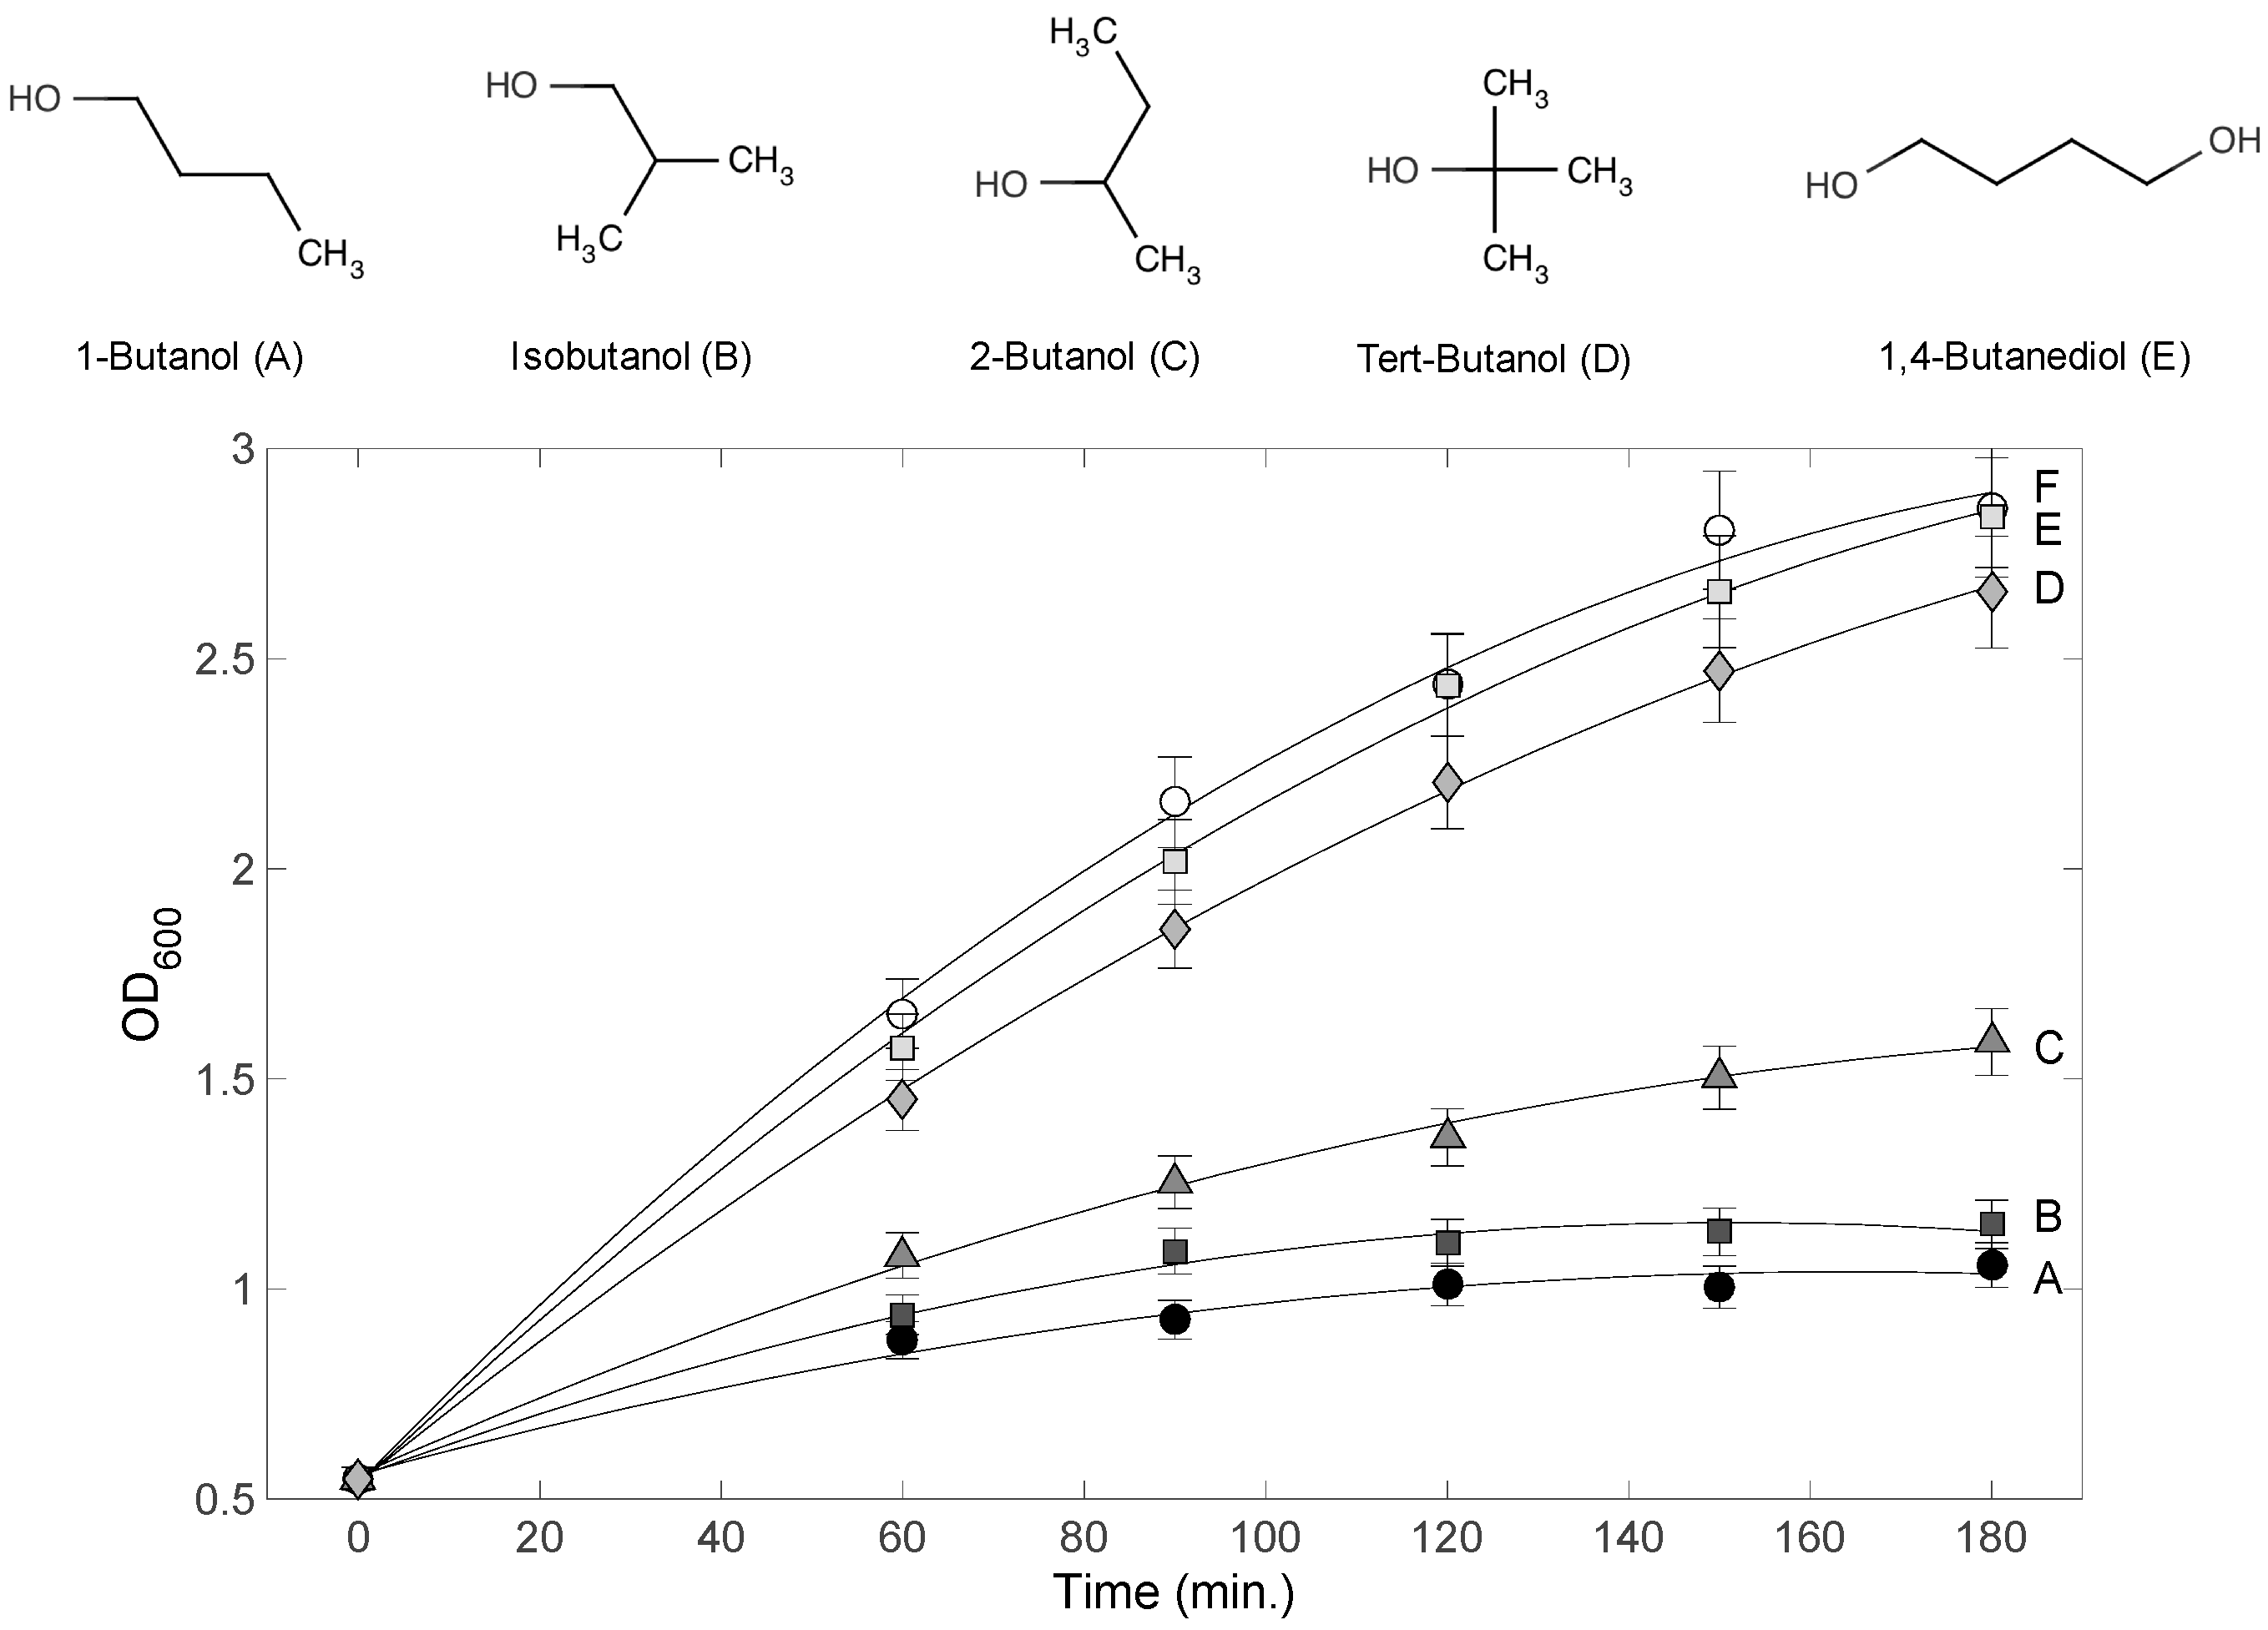
3.1. Variable Inhibitory Effect of 4-Carbon Alcohols on E. coli Cultures

To assess the inhibitory effects of the different 4-carbon alcohols on E. coli culture growth, 1-butanol, isobutanol, 2-butanol, tert-butanol, and 1,4-butanediol were applied to E. coli cultures to 1.2% (v/v) at the start of the exponential phase (OD600 = 0.5–0.6). The culture OD600 values were monitored for 180 min, and results are shown in Figure 1. Little effect on growth was observed for 1,4-butanediol and tert-butanol treated cultures compared to the control culture (no alcohol added). By contrast, drastic effects on growth were observed for the 1-butanol, isobutanol, and 2-butanol treated cultures. The highest toxicity was caused by 1-butanol, consistent with previous literature reports [15]. Although the negative effect on growth was statistically significant for these three alcohols, there was a profound difference in the magnitude of that effect. However, it was not clear whether the difference is quantitative or qualitative. In other words, it was not clear whether the difference in the degree of inhibition resulted from different modes of actions eliciting different metabolic and/or phenotypic responses. To address this question, Raman spectroscopy was used to profile these cultures during the toxicity response.
Figure 1. Chemical structures of 4-carbon alcohols and E. coli culture growth inhibition. Each alcohol was added to 1.2% (v/v) at 0 min. Each curve label (AE) corresponds to the alcohol above. Curve F corresponds to the control (no alcohol treatment). Chemical structures were drawn using ChemAxon MarvinView.
Fermentation 02 00003 g001

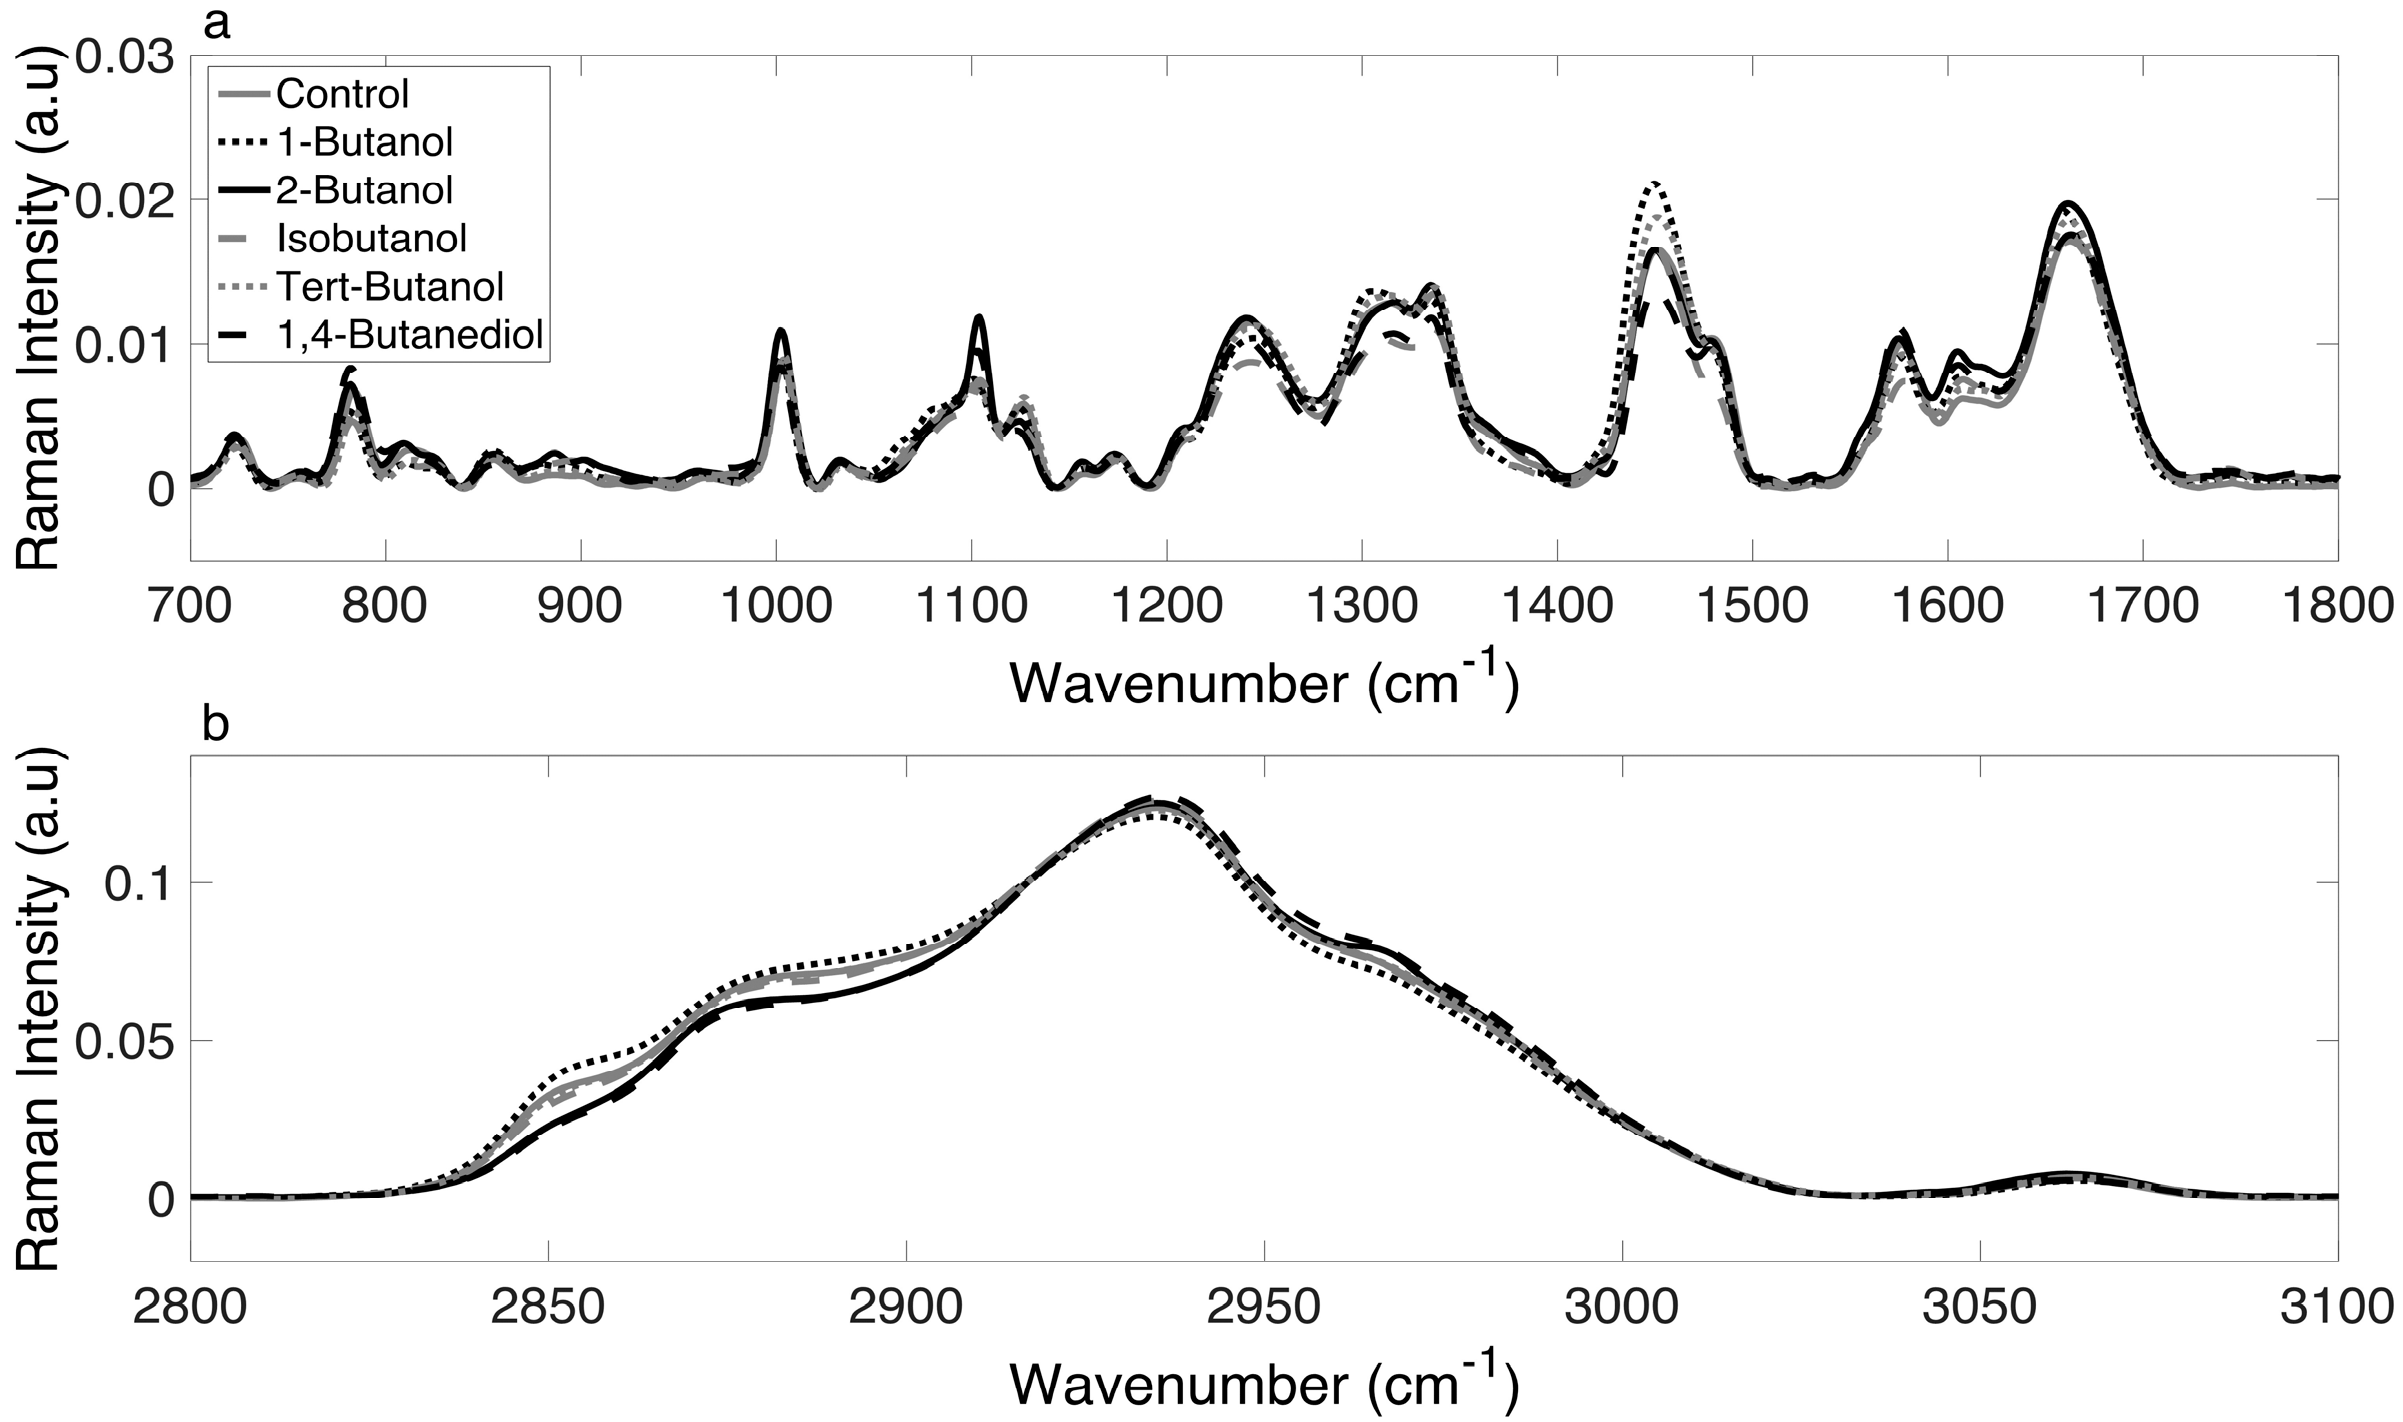
3.2. Raman Spectra of E. coli Cultures Are Consistent and Reliable

For each alcohol treatment, at least 50 spectra were collected at each of the designated time points (0, 60, 90, 120, 150 and 180 min). The mean Raman spectra (with baseline correction) for the control and alcohol-treated cultures at 180 min are shown in Figure 2. A visual inspection of the superimposed spectral data (with no statistical analysis), showed differences in regions corresponding to nucleic acids (~1070–1090 cm−1), proteins (1449 cm−1, 1655–1680 cm−1), and lipids (1320 cm−1, 1607 cm−1) [33] within the biological region (Figure 2a) and shifts in the CH region (Figure 2b). Spectra differences were qualitative as well as quantitative (i.e., there were peak shifts and not just changes in intensity). This was the first evidence that the variation in the degree of inhibition resulted from the fact that different alcohols elicit different phenotypic responses. The next step was to apply chemometric fingerprinting to test whether differences in Raman spectra were sufficient to generate distinct and identifiable metabolic profiles based on alcohol treatment.
Figure 2. Normalized and averaged Raman spectra of the control and alcohol-treated cultures at 180 min over (a) the biological range (700–1800 cm−1) and (b) the CH range (2800–3100 cm−1).
Fermentation 02 00003 g002

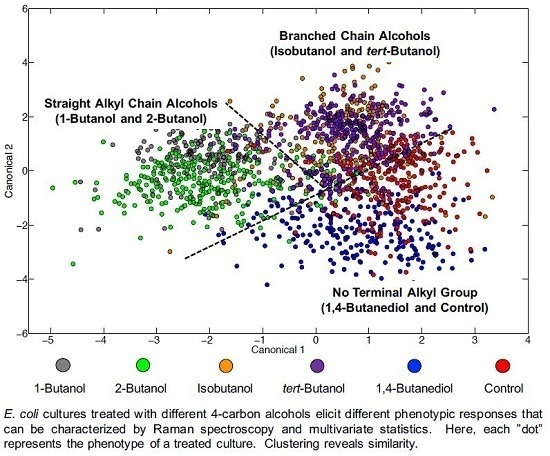
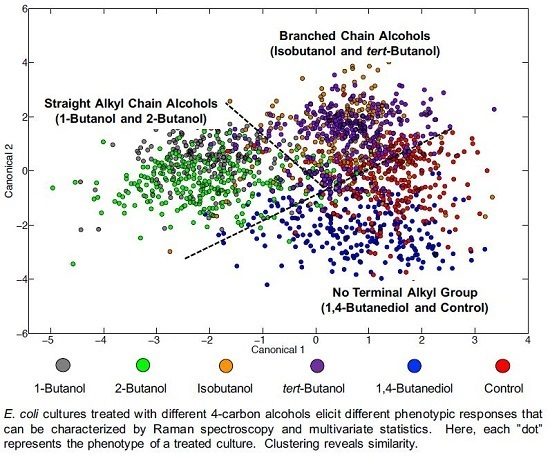
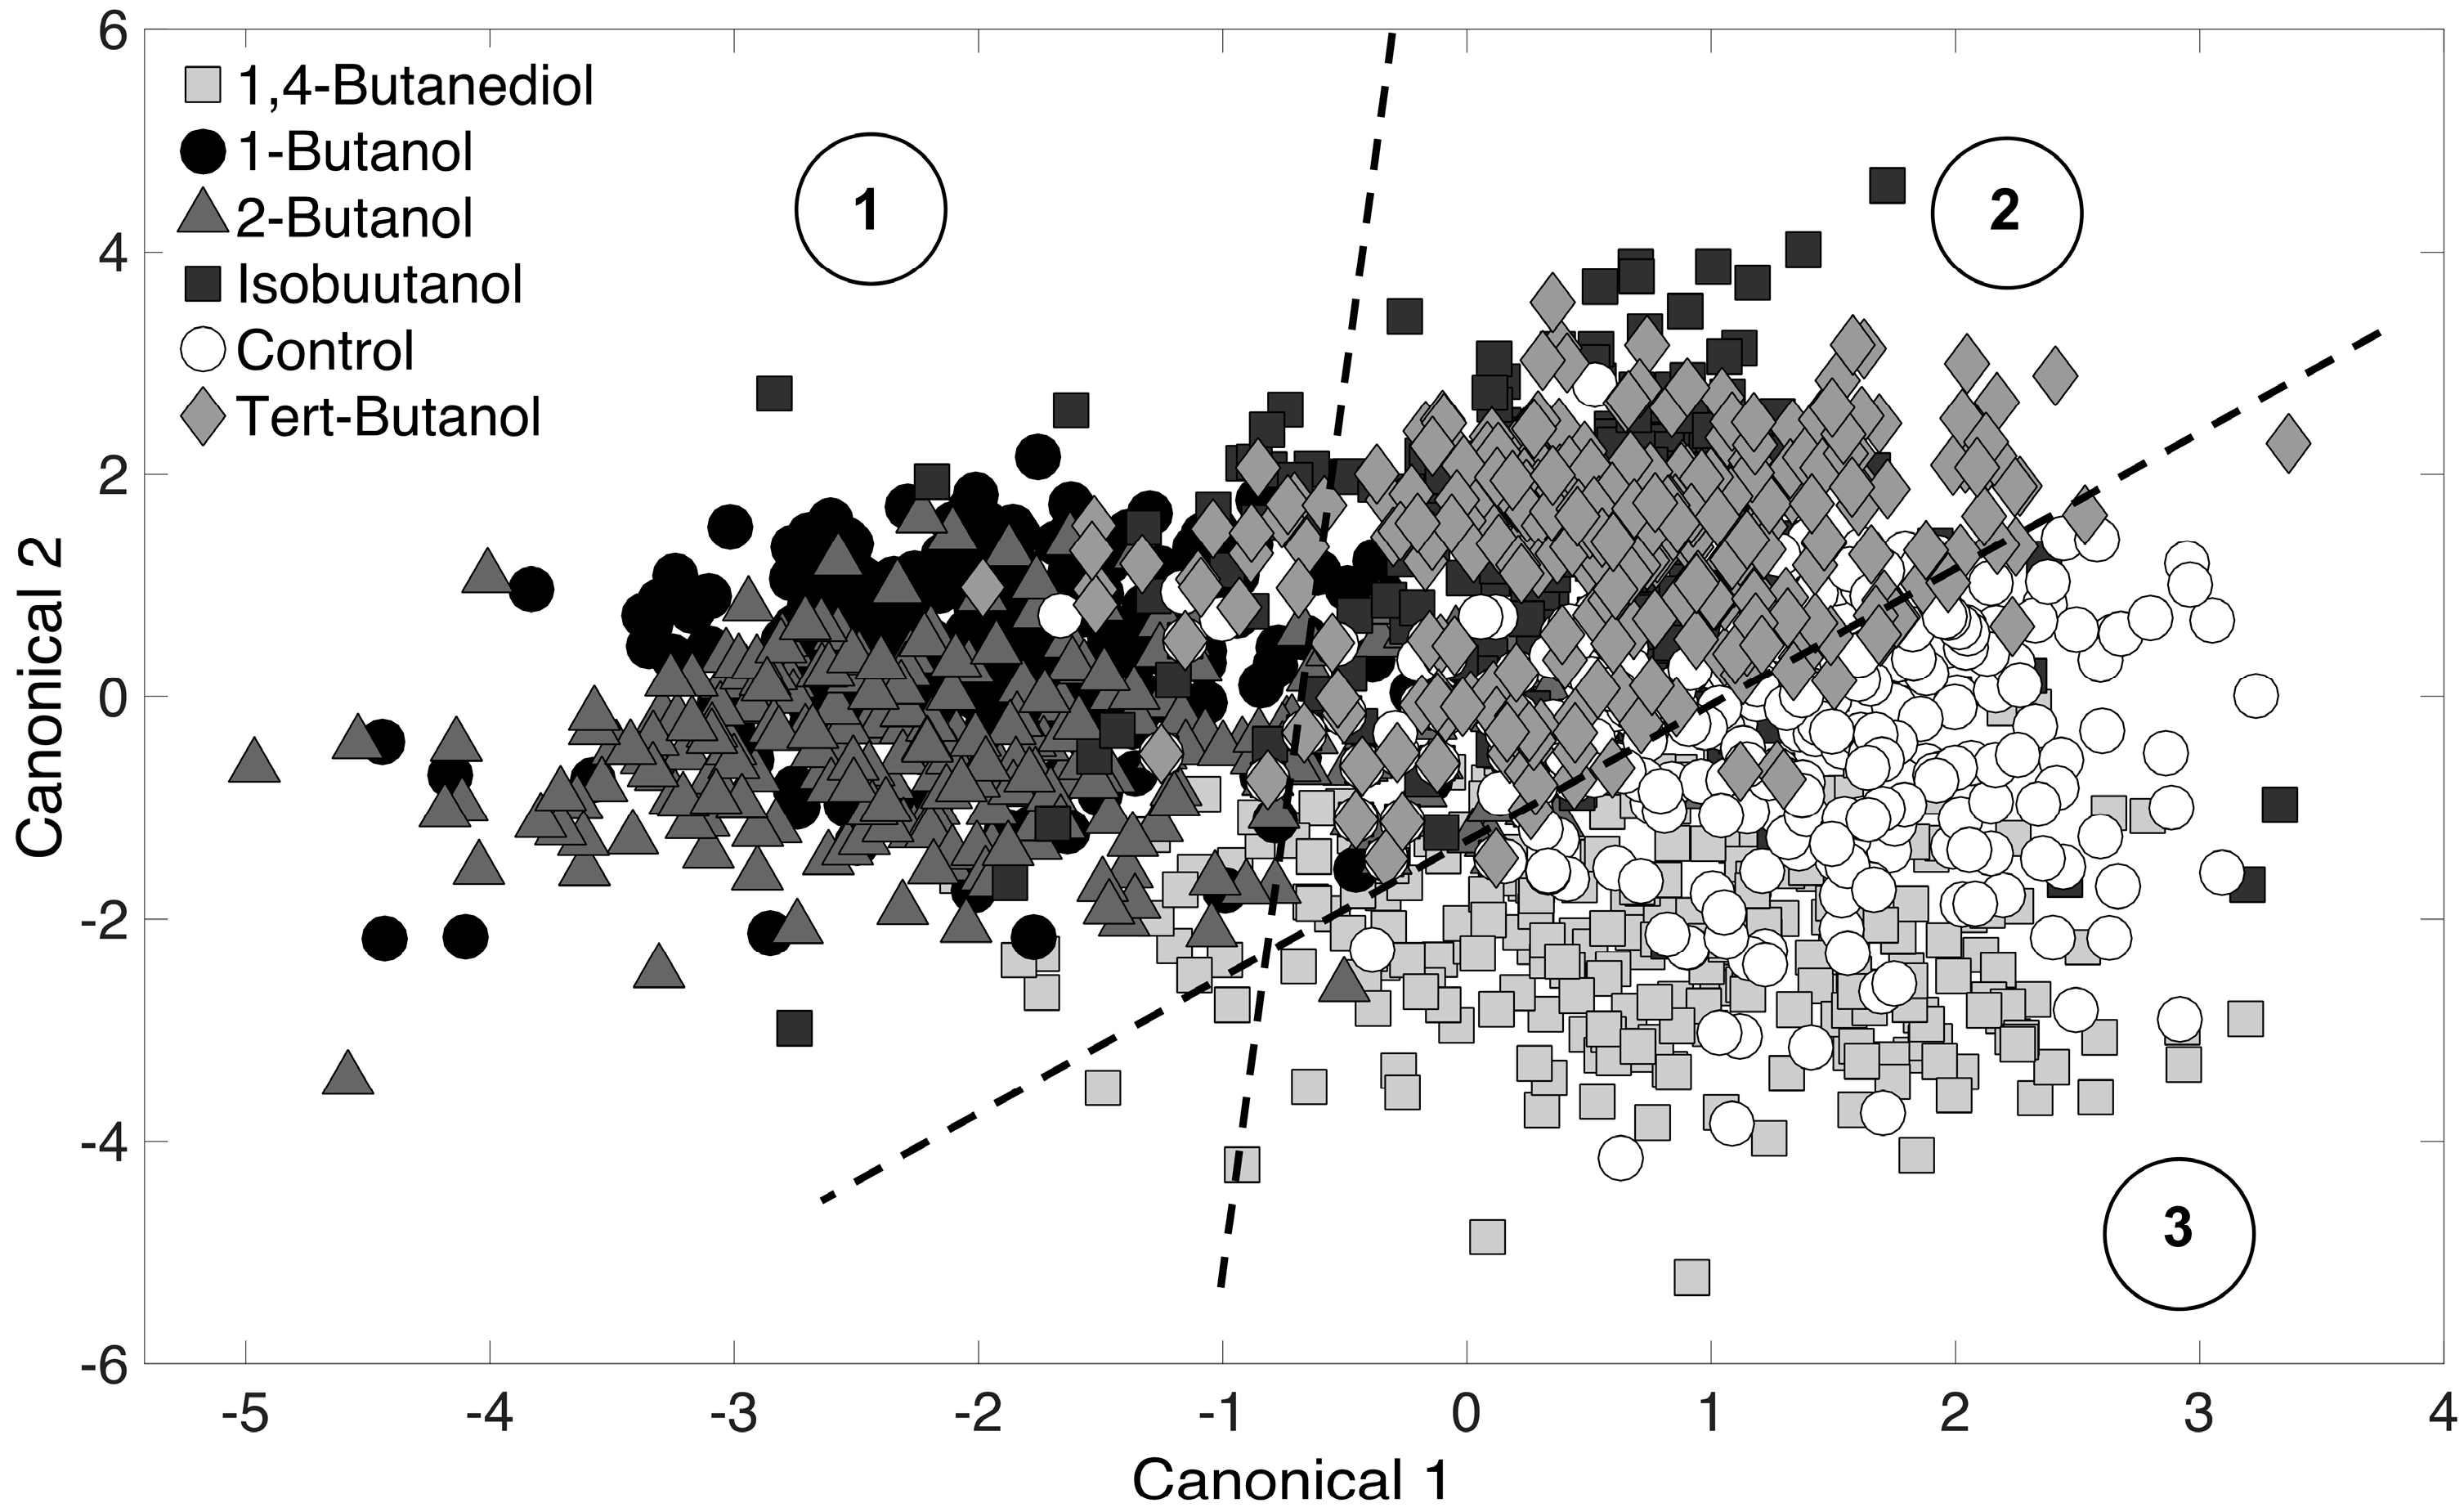
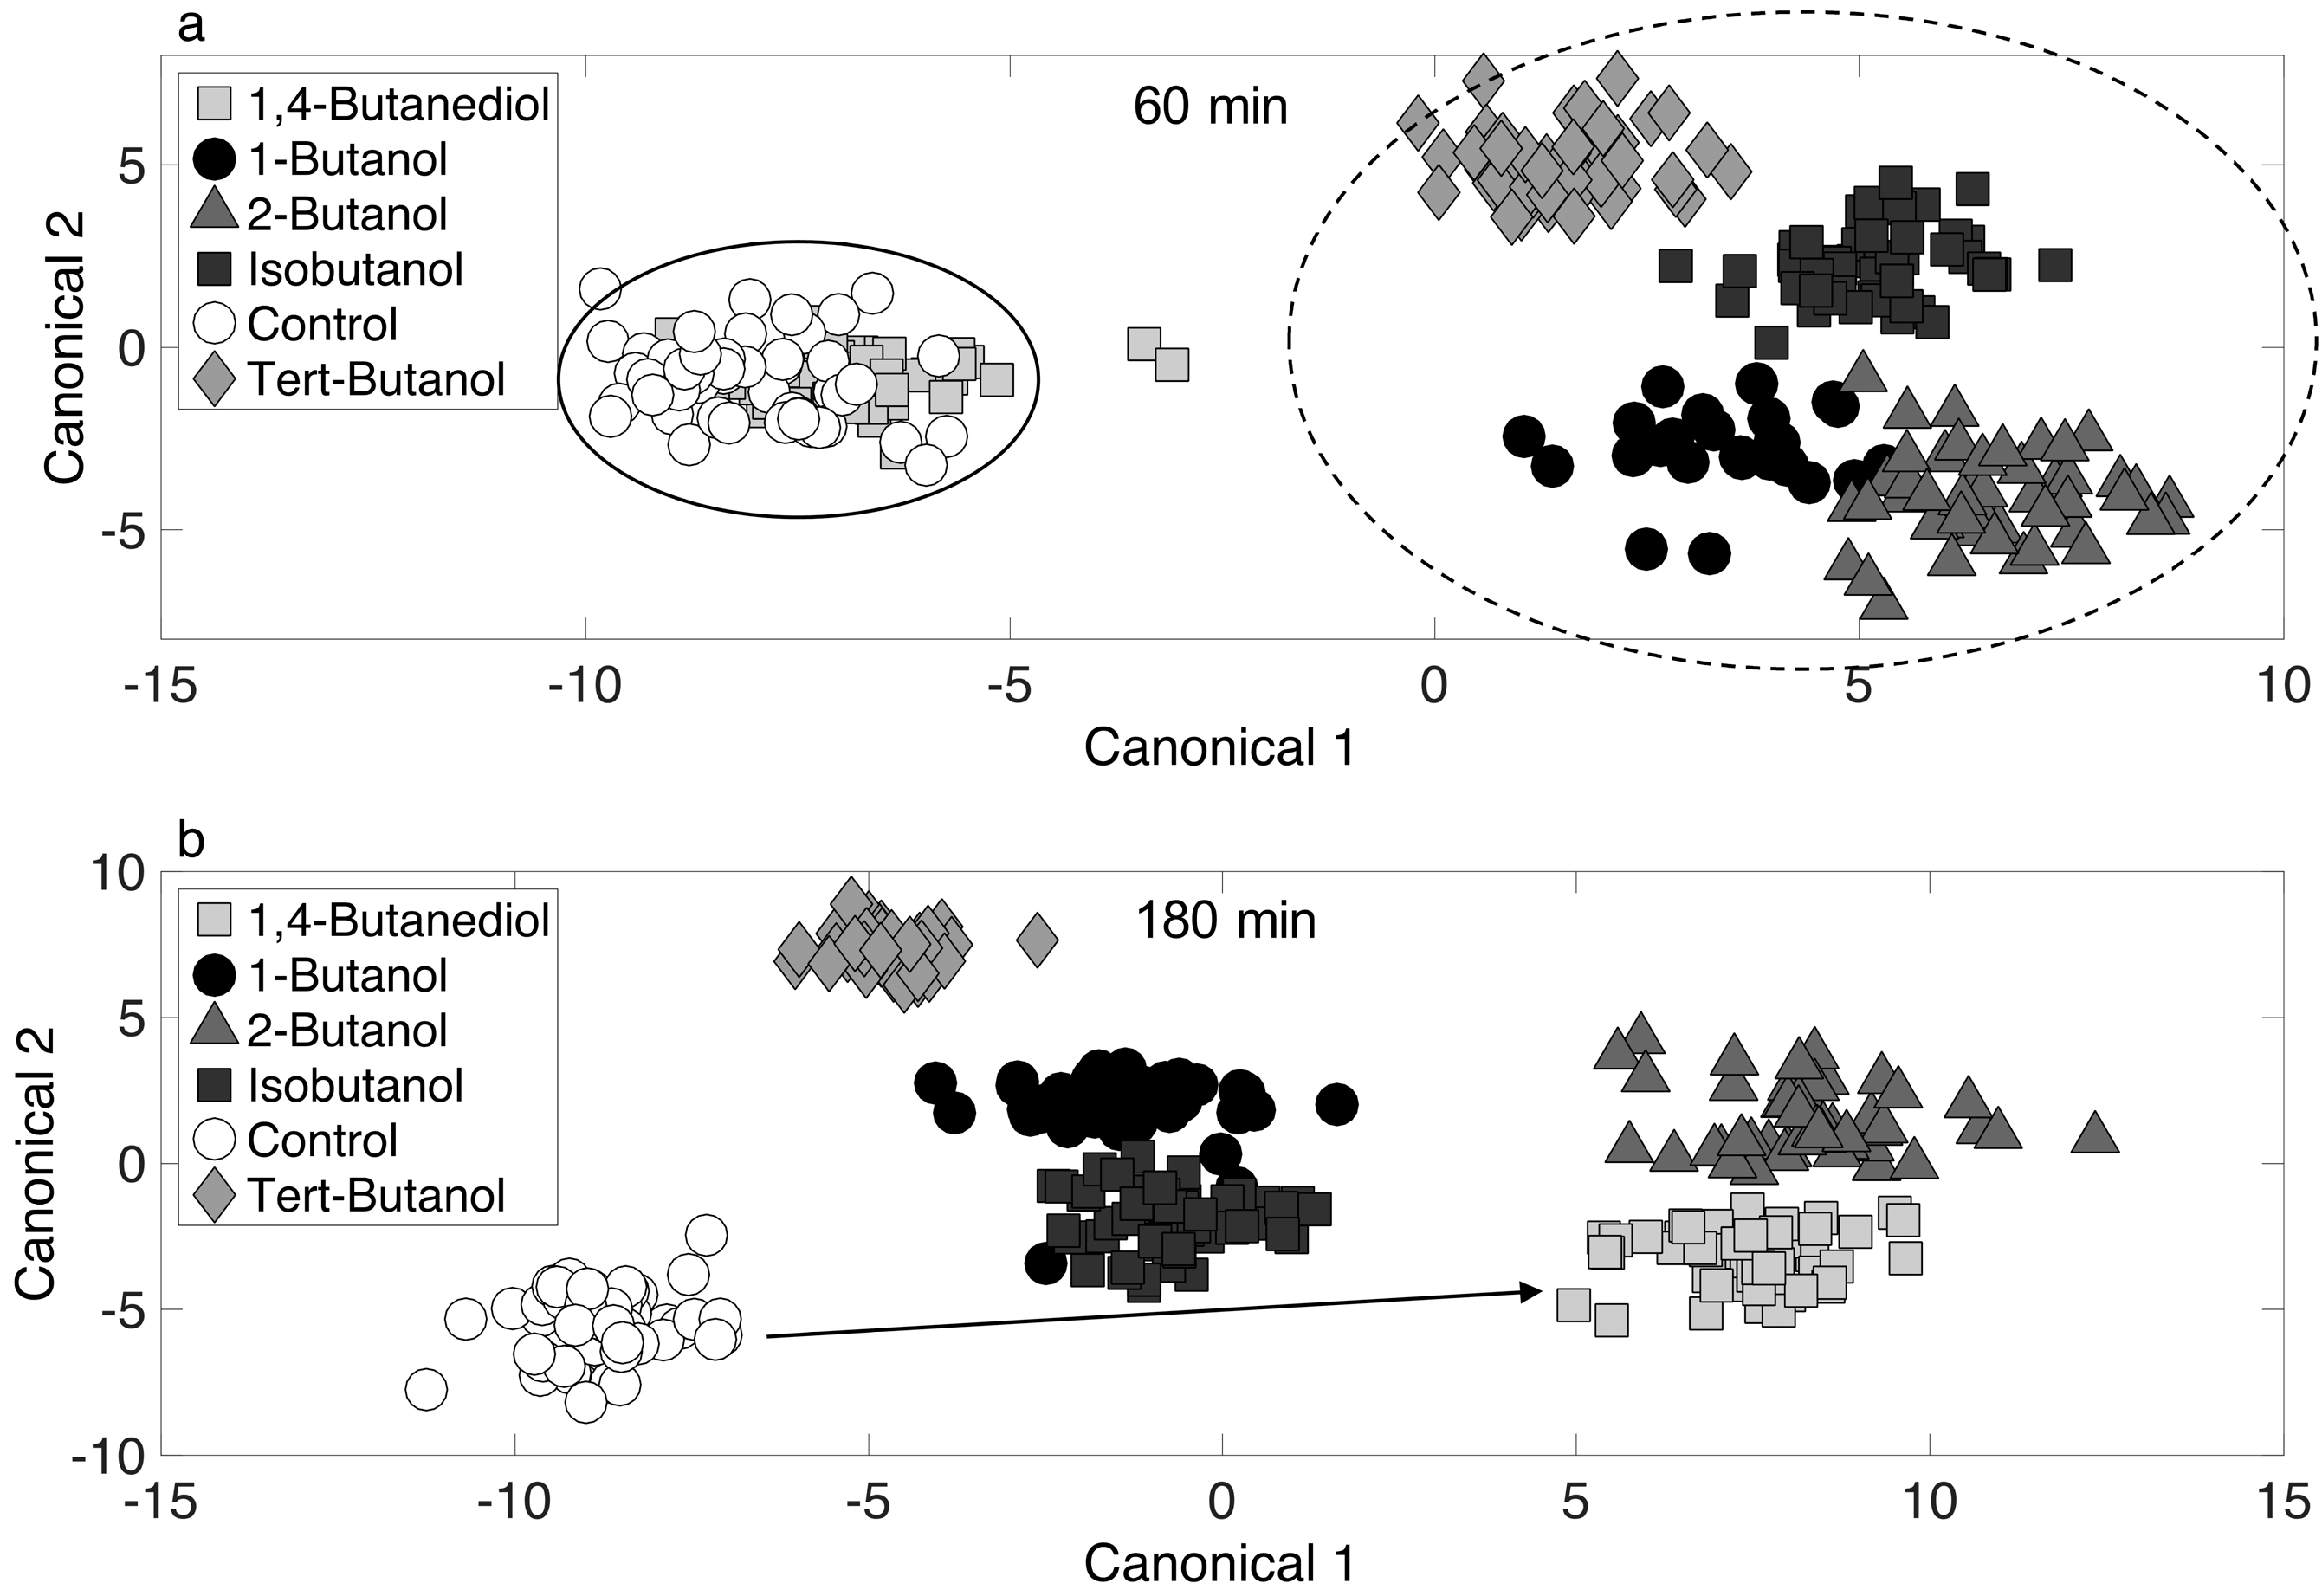
3.3. Chemometric Fingerprinting to Distinguish E. coli Phenotypes (by Alcohol)

PCA was used to reduce Raman spectra, and the first 10 principal components scores were used as inputs for DA. The purpose of DA is to detect differences among PCA-reduced Raman spectra. Results are represented in a graphical format on a two-dimensional canonical plot, where each data points represents an entire Raman spectrum. Spectra that cluster together imply similarity, and those that do not cluster are dissimilar. Here, a Raman spectrum is representative of an E. coli cell phenotype. The PCA-DA (i.e., chemometric fingerprinting) approach was first applied to distinguish phenotypes by alcohol treatment (at all time points). Results are shown in Figure 3, and the six datasets (5 alcohol-treated cultures and the control) separated into three clusters on the canonical plot. These clusters correspond to: (i) 1-butanol and 2-butanol (linear chain alcohols); (ii) isobutanol and tert-butanol (branched chain alcohols); and (iii) 1,4-butanediol and the control (no terminal alkyl end). The first cluster (1-butanol and 2-butanol) is intuitive since both alcohols are highly toxic to E. coli cultures (Figure 1). The third cluster (1,4-butanediol and the control) is also intuitive because little difference is observed in Figure 1 for these two. The second cluster consists of isobutanol and tert-butanol. IsoButanol showed significant toxicity, while tert-butanol showed much less toxicity (Figure 1). However, the phenotypic responses of exposed E. coli cells (over all time points) showed to be similar in Figure 3. This is non-intuitive and suggests that even though E. coli cells have the same phenotypic response to the branched-chain alcohols, the longer terminal alkane chain of isobutanol (by one carbon) may be responsible for the reduced cell density values observed (Figure 1).
Figure 3. Chemometric fingerprinting results to distinguish E. coli phenotypes by alcohol treatment (for all time points). Three clusters are identified and consist of (1) 1-butanol and 2-butanol; (2) isobutanol and tert-butanol; and (3) the control and 1,4-butanediol treated cultures.
Fermentation 02 00003 g003
It is obvious that the DA clustering shown in Figure 3 is not entirely clear. This is because we have included all time-points to distinguish by alcohol treatment only. Typically, DA results presented in the literature show distinct clustering with low cross-validation error rate (5%–10%). Indeed, in this study, DA showed distinct clustering with 1% cross-validation error when analysis was conducted for a specific time point. However, given the realizations of (i) the biomolecular complexity of the cell; (ii) thousands of molecules in the cell are Raman active, and (iii) the fact that DA was performed for all time-points together, it is reasonable to expect clustering that is not so distinct and a high error rate. The “leave-one-out” cross-validation error was relatively high at 29.4%. To ensure further that the clustering in Figure 3 is based on real phenotypic differences and not over-fitting based on random error, we repeated the analysis with Raman spectra randomly mislabeled. No clustering was seen in this randomized assignment test and the “leave-one-out” cross-validation error was 83.1%. In conclusion, despite the relatively high error rate, we are confident that clustering observed in Figure 3 is based on real phenotypic differences resulting from treatment with the different alcohols.

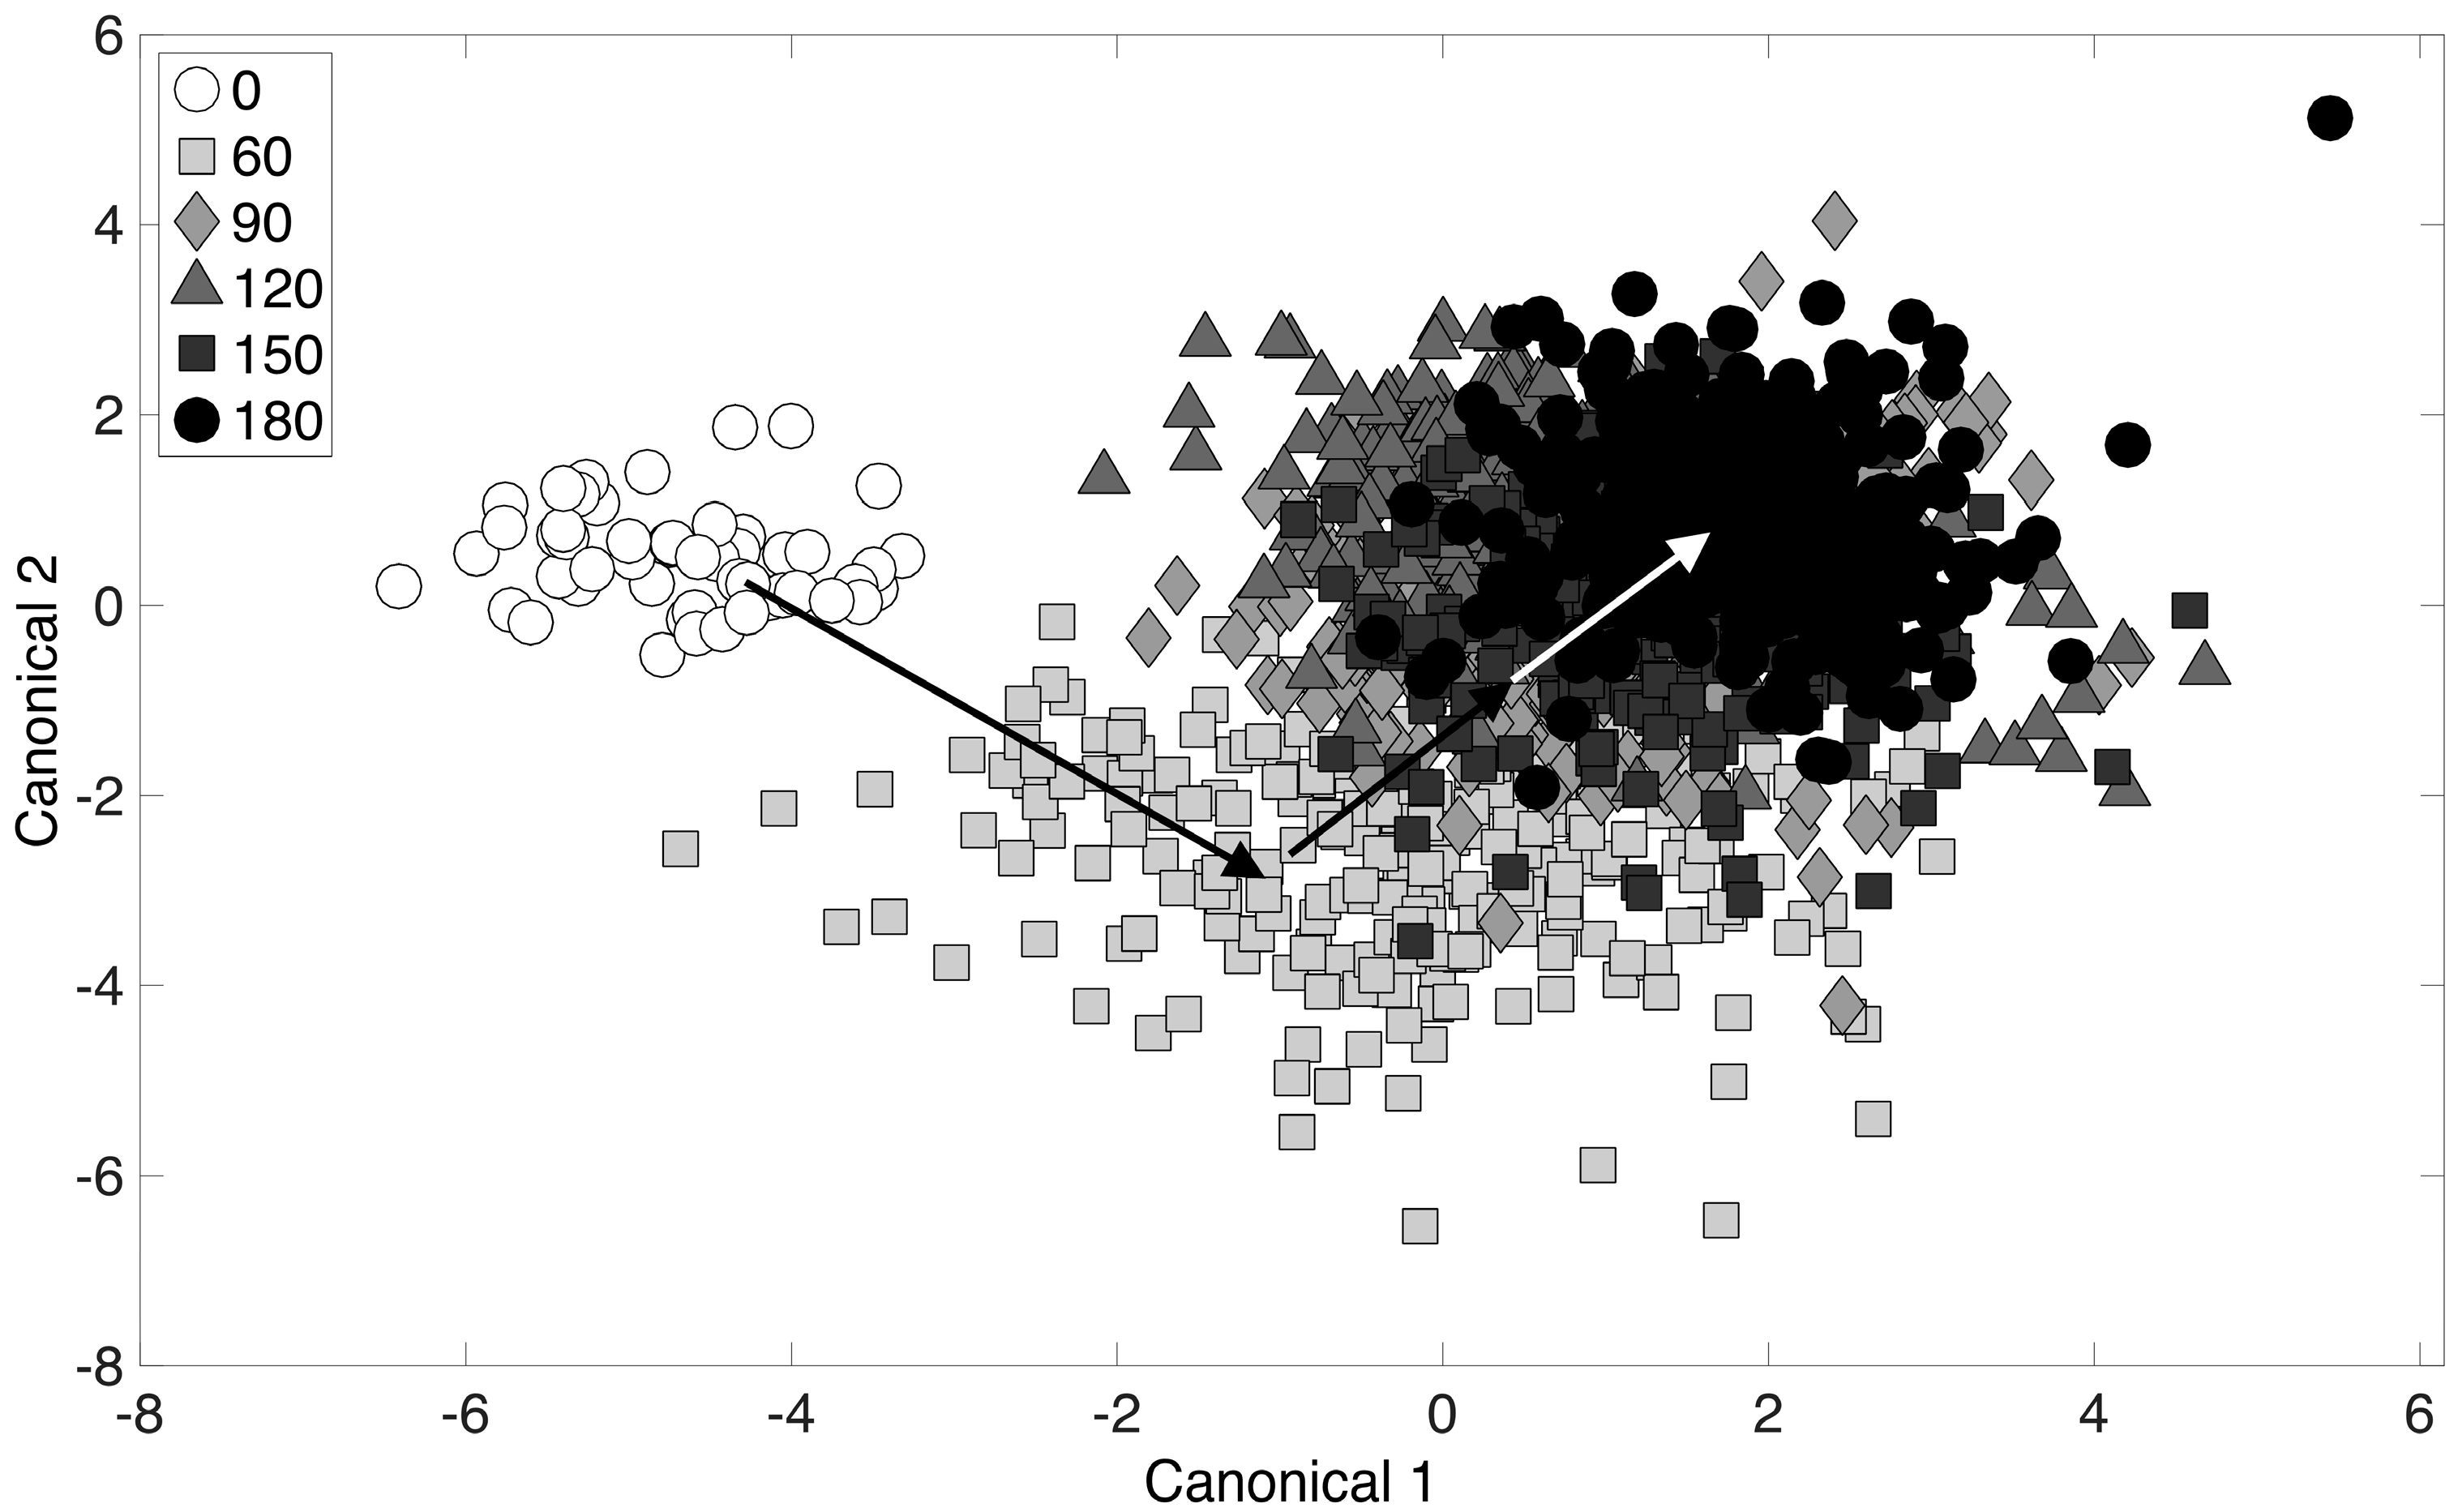
3.4. Chemometric Fingerprinting to Distinguish E. coli Phenotypes (by Time of Exposure)

Next, the chemometric fingerprinting analysis was applied to the dataset with respect to time (for all alcohol-treated cultures). The purpose of this analysis was to determine the dynamics of the phenotypic responses observed. Results are displayed using the two-dimensional canonical plot in Figure 4. The “leave-one-out” cross-validation error in this case was 23.8%, and the discussion above regarding the lack of clear clustering applies to Figure 4 as well. Cross-validation error for a repeated analysis with Raman spectra randomly mislabeled was 84.2%. The initial time point (0 min) corresponds to the point at which the 4-carbon alcohols were added to the culture (during exponential growth). Interestingly, results revealed that the culture toxicity response was almost immediate and was easily detectable within the first 60 min following exposure (Figure 4). From there, continued movement of data point clusters away from the initial time point (0 min) was observed, with the final time point (180 min) cluster being the furthest distance from the initial time point. This analysis provides a means of monitoring the dynamics of phenotype changes when the entire chemical composition of a culture (i.e., the entire Raman spectrum) is considered simultaneously. While this analysis considers all 4-carbon alcohols, the procedure was next performed on individual time points and alcohol treatments.
Figure 4. Chemometric fingerprinting results to distinguish E. coli phenotypes by time (for all alcohol treatments). The times given in the legend refer to minutes past the addition of alcohol to cultures growing in exponential phase.
Fermentation 02 00003 g004

3.5. Chemometric Fingerprinting to Distinguish E. coli Phenotypes (by Alcohol and Time)

To further illustrate the 4-carbon alcohol induced response phenotypes (and to possibly discern mechanisms), chemometric fingerprinting was applied with respect to alcohol at single time points (60 and 180 min). The resulting two-dimensional canonical plot is shown in Figure 5. At 60 min (Figure 5a), the control and 1,4-butanediol treated phenotypes cluster together, suggesting a minimal immediate response of the cultures to 1,4-butanediol. However, at 180 min (Figure 5b), these phenotypes have separated completely on the canonical plot, suggesting a distinctive long-term response, even though toxicity (i.e., growth inhibition) was not detected (Figure 1). It is unclear why this phenotype is located farther from the control culture than phenotypes resulting from toxic 1-butanol exposure on the canonical plot in Figure 5b. The short-term response (60 min, Figure 5a) shows significant separation of 1-butanol, 2-butanol, isobutanol, and tert-butanol phenotypes, suggesting distinct toxicity responses. However, none of these clustered together, which suggests the phenotypic responses to all 4-carbon alcohols were different in the short-term. It is noted that a significant short-term phenotype response was observed for tert-butanol treated cells (Figure 5a), but toxicity was much less compared to 1-butanol (Figure 1). This suggests that no direct link exists between growth inhibition (Figure 1) and phenotype dissimilarly, as determined from a canonical plot produced by PCA-DA.
Figure 5. Chemometric fingerprinting results to distinguish E. coli phenotypes by alcohol treatment at (a) 60 min and (b) 180 min.
Fermentation 02 00003 g005

4. Discussion

4.1. Monitoring Phenotypic Changes in Near Real-Time

The methods presented here provide a way of monitoring phenotypic changes of microbes in near real-time using Raman spectroscopy. In our previous publication [22], the effect of 1-butanol toxicity on the E. coli cells was studied by extracting the intensity of specific bands from a Raman spectrum and correlating these with phenotypic traits such as: (i) membrane fatty acids composition; (ii) cell membrane fluidity; and (iii) amino acids composition. In this research, chemometric fingerprinting (with PCA-DA) was used to make use of an entire Raman spectrum, which includes contributions from all chemicals comprising the sample. The Raman spectrum of a cell is complex (Figure 2) and can contain contributions from thousands of molecules. Thus, an entire Raman spectrum actually contains very detailed information about the cell-wide phenotype, and the Raman spectroscopy based methodology presented here uses this information to compare and distinguish among microbial phenotypes. In the application presented, the phenotypic responses resulting from treatment of E. coli with different 4-carbon alcohols was studied. The alcohols differed in location of the alcohol group and alkyl chain length. These resulted in significantly different toxicity levels (Figure 1), which was expected based on previously published research. However, the resulting phenotypes among the treated cultures were found to be different and dynamic.

4.2. Effects of Terminal Alkyl Chain Length

The results of this study confirm that 4-carbon alcohols with longer terminal alkyl chains have greater toxicity (primary alcohols > secondary alcohols > tertiary alcohols) to E. coli cells when applied at 1.2% (v/v). 1,4-Butanediol does not have a terminal alkyl chain, since both ends are capped with alcohol groups, and it was expected this would lead to minimal toxicity. These results were confirmed in the growth inhibition study (Figure 1), and the chemometric fingerprinting results (over all time points) revealed clustering between the control and 1,4-butanediol treated phenotypes (Figure 3). This suggests that there was relatively no phenotype change with the addition of 1,4-butanediol. However, as phenotype changes were studied at 180 min only, clear separation was observed between the control and 1,4-butanediol treated cells. Thus, it can be concluded that E. coli phenotypes do in fact respond to 1,4-butanediol, but this happens very slowly (around 180 min) and that minimal toxicity results. Overall, 1-butanol and 2-butanol treatments produced similar E. coli phenotypes (Figure 3 and Figure 5a), but 1-butanol is more toxic (Figure 1). However, at 180 min (Figure 5b), the 2-butanol treated phenotypes showed more similarity to the 1,4-butanediol phenotypes, possibly suggesting multiple responses over the time-course. Finally, isobutanol and tert-butanol clustered together in Figure 3, suggesting similarities in phenotypic responses over the entire time-course. This is interesting because isobutanol proved to be much more toxic than tert-butanol (Figure 1). With similar phenotypes, the dramatic change in toxicity levels can be attributed to the molecular structures of the alcohols themselves, which both contain branched alkyl groups. This suggests that the branched alkyl group played a role in the phenotypic response, but even an increase in the terminal alkyl chain length by one carbon can determine whether this phenotypic response thrives or fails when faced with potential toxicity. Clearly, more research is needed to determine how microbes sense their environment and induce phenotypic changes. For example, much could be learned from extending this study to include different alcohol concentrations. But, it does appear that several phenotype response programs are in place and have different levels of success for alcohols based on molecular factors such as the alkyl chain length and branching patterns.

4.3. Potential Uses

The chemometric fingerprinting approach used here to study dynamic phenotypic responses in near real-time has broad applicability. One of the drawbacks of Raman-based analyses of complex biological systems (i.e., a cell) is the ambiguity that can exist with Raman band assignments. The approach presented here eliminates this potential problem, as entire Raman spectra (not individual bands) are used in the analysis. While this may not have applicability to extract specific chemical information (e.g., fatty acids, amino acids, etc.), the approach can be used to compare among phenotypes and study the dynamics of phenotypic responses. Thus, this approach can be applied to all microbes and treatments and has additional applicability to eukaryotes and biomedical research. Observed phenotypic responses from this study with different 4-carbon alcohols could prove very useful for engineering alcohol tolerance in bacteria. By studying the observed clustering patterns, one can discern cell response mechanisms that are attributed to improved tolerance.

Acknowledgments

Research support is acknowledged from the Institute of Critical Technologies and Applied Science at Virginia Tech.

Author Contributions

Theresah N. K. Zu conceived the study, acquired experimental data, and performed all calculations. Ahmad I. M. Athamneh wrote the computer code related to chemometric fingerprinting analysis. Ryan S. Senger aided experimental design and data interpretation. Theresah N. K. Zu wrote the initial manuscript. Ahmad I. M. Athamneh and Ryan S. Senger provided edits.

Conflicts of Interest

The authors declare no conflict of interest.

References

  1. Stephanopoulos, G. Challenges in engineering microbes for biofuels production. Science 2007, 315, 801–804. [Google Scholar] [CrossRef] [PubMed]
  2. Qureshi, N.; Ezeji, T.C. Butanol,“a superior biofuel”production from agricultural residues (renewable biomass): Recent progress in technology. Biofuel Bioprod. Biorefin. 2008, 2, 319–330. [Google Scholar] [CrossRef]
  3. Dunlop, M.J.; Dossani, Z.Y.; Szmidt, H.L.; Chu, H.C.; Lee, T.S.; Keasling, J.D.; Hadi, M.Z.; Mukhopadhyay, A. Engineering microbial biofuel tolerance and export using efflux pumps. Mol. Syst. Biol. 2011, 7. [Google Scholar] [CrossRef] [PubMed]
  4. Brynildsen, M.P.; Liao, J.C. An integrated network approach identifies the isobutanol response network of Escherichia coli. Mol. Syst. Biol. 2009, 5. [Google Scholar] [CrossRef] [PubMed]
  5. Dunlop, M.J.; Keasling, J.D.; Mukhopadhyay, A. A model for improving microbial biofuel production using a synthetic feedback loop. Syst. Synth. Biol. 2010, 4, 95–104. [Google Scholar] [CrossRef] [PubMed]
  6. Nicolaou, S.A.; Gaida, S.M.; Papoutsakis, E.T. A comparative view of metabolite and substrate stress and tolerance in microbial bioprocessing: From biofuels and chemicals, to biocatalysis and bioremediation. Metab. Eng. 2010, 12, 307–331. [Google Scholar] [CrossRef] [PubMed]
  7. Sinensky, M. Homeoviscous adaptation—A homeostatic process that regulates the viscosity of membrane lipids in Escherichia coli. Proc. Natl. Acad. Sci. USA 1974, 71, 522–525. [Google Scholar] [CrossRef] [PubMed]
  8. Reyes, L.H.; Abdelaal, A.S.; Kao, K.C. Genetic determinants for n-butanol tolerance in evolved escherichia coli mutants: Cross adaptation and antagonistic pleiotropy between n-butanol and other stressors. Appl. Environ. Microbiol. 2013, 79, 5313–5320. [Google Scholar] [CrossRef] [PubMed]
  9. Winkler, J.; Kao, K.C. Transcriptional analysis of lactobacillus brevis to n-butanol and ferulic acid stress responses. PLoS ONE 2011, 6. [Google Scholar] [CrossRef] [PubMed]
  10. Winkler, J.; Rehmann, M.; Kao, K.C. Novel Escherichia coli hybrids with enhanced butanol tolerance. Biotechnol. Lett. 2010, 32, 915–920. [Google Scholar] [CrossRef] [PubMed]
  11. Collas, F.; Kuit, W.; Clément, B.; Marchal, R.; López-Contreras, A.M.; Monot, F. Simultaneous production of isopropanol, butanol, ethanol and 2,3-butanediol by Clostridium acetobutylicum ATCC 824 engineered strains. AMB Express 2012, 2. [Google Scholar] [CrossRef] [PubMed]
  12. Ingram, L.O. Ethanol tolerance in bacteria. Crit. Rev. Biotechnol. 1989, 9, 305–319. [Google Scholar] [CrossRef]
  13. Huffer, S.; Clark, M.E.; Ning, J.C.; Blanch, H.W.; Clark, D.S. Role of alcohols in growth, lipid composition, and membrane fluidity of yeasts, bacteria, and archaea. Appl. Environ. Microbiol. 2011, 77, 6400–6408. [Google Scholar] [CrossRef] [PubMed]
  14. Ingram, L.O.; Buttke, T.M. Effects of alcohols on micro-organisms. Adv. Microb. Physiol. 1984, 25, 253–300. [Google Scholar] [PubMed]
  15. Ingram, L. Microbial tolerance to alcohols: Role of the cell membrane. Trends Biotechnol. 1986, 4, 40–44. [Google Scholar] [CrossRef]
  16. Kabelitz, N.; Santos, P.M.; Heipieper, H.J. Effect of aliphatic alcohols on growth and degree of saturation of membrane lipids in acinetobacter calcoaceticus. FEMS Microbiol. Lett. 2003, 220, 223–227. [Google Scholar] [CrossRef]
  17. Ramos, J.L.; Duque, E.; Gallegos, M.T.; Godoy, P.; Ramos-Gonzalez, M.I.; Rojas, A.; Teran, W.; Segura, A. Mechanisms of solvent tolerance in Gram-negative bacteria. Annu. Rev. Microbiol. 2002, 56, 743–768. [Google Scholar] [CrossRef] [PubMed]
  18. Ingram, L.O. Adaptation of membrane lipids to alcohols. J. Bacteriol. 1976, 125, 670–678. [Google Scholar] [PubMed]
  19. Rutherford, B.J.; Dahl, R.H.; Price, R.E.; Szmidt, H.L.; Benke, P.I.; Mukhopadhyay, A.; Keasling, J.D. Functional genomic study of exogenous n-butanol stress in Escherichia coli. Appl. Environ. Microbial. 2010, 76, 1935–1945. [Google Scholar] [CrossRef] [PubMed]
  20. Reyes, L.H.; Almario, M.P.; Kao, K.C. Genomic library screens for genes involved in n-butanol tolerance in Escherichia coli. PLoS ONE 2011, 6, e17678. [Google Scholar] [CrossRef] [PubMed]
  21. Minty, J.J.; Lesnefsky, A.A.; Lin, F.; Chen, Y.; Zaroff, T.A.; Veloso, A.B.; Xie, B.; McConnell, C.A.; Ward, R.J.; Schwartz, D.R.; et al. Evolution combined with genomic study elucidates genetic bases of isobutanol tolerance in Escherichia coli. Microb. Cell Fact. 2011, 10. [Google Scholar] [CrossRef] [PubMed]
  22. Zu, T.N.K.; Athamneh, A.I.M.; Wallace, R.S.; Collakova, E.; Senger, R.S. Near real-time analysis of the phenotypic responses of Escherichia coli to 1-butanol exposure using Raman spectroscopy. J. Bacteriol. 2014, 196, 3983–3991. [Google Scholar] [CrossRef] [PubMed]
  23. Kirschner, C.; Maquelin, K.; Pina, P.; Thi, N.N.; Choo-Smith, L.P.; Sockalingum, G.; Sandt, C.; Ami, D.; Orsini, F.; Doglia, S. Classification and identification of Enterococci: A comparative phenotypic, genotypic, and vibrational spectroscopic study. J. Clin. Microbiol. 2001, 39, 1763–1770. [Google Scholar] [CrossRef] [PubMed]
  24. Chan, J.W.; Lieu, D.K.; Huser, T.; Li, R.A. Label-free separation of human embryonic stem cells and their cardiac derivatives using Raman spectroscopy. Anal. Chem. 2009, 81, 1324–1331. [Google Scholar] [CrossRef] [PubMed]
  25. Athamneh, A.I.; Alajlouni, R.A.; Wallace, R.S.; Seleem, M.N.; Senger, R.S. Phenotypic profiling of antibiotic response signatures in Escherichia coli using Raman spectroscopy. Antimicrob. Agents Chemother. 2014, 58, 1302–1314. [Google Scholar] [CrossRef] [PubMed]
  26. Ewanick, S.M.; Thompson, W.J.; Marquardt, B.J.; Bura, R. Real-time understanding of lignocellulosic bioethanol fermentation by Raman spectroscopy. Biotechnol. Biofuels 2013, 6. [Google Scholar] [CrossRef] [PubMed]
  27. Sivakesava, S.; Irudayaraj, J.; Ali, D. Simultaneous determination of multiple components in lactic acid fermentation using FT-MIR, NIR, and FT-Raman spectroscopic techniques. Process Biochem. 2001, 37, 371–378. [Google Scholar] [CrossRef]
  28. Lee, H.L.T.; Boccazzi, P.; Gorret, N.; Ram, R.J.; Sinskey, A.J. In situ bioprocess monitoring of Escherichia coli bioreactions using Raman spectroscopy. Vib. Spectrosc. 2004, 35, 131–137. [Google Scholar] [CrossRef]
  29. Milne, C.B.; Eddy, J.A.; Raju, R.; Ardekani, S.; Kim, P.J.; Senger, R.S.; Jin, Y.S.; Blaschek, H.P.; Price, N.D. Metabolic network reconstruction and genome-scale model of butanol-producing strain Clostridium beijerinckii NCIMB 8052. BMC Syst. Biol. 2011, 5. [Google Scholar] [CrossRef] [PubMed]
  30. Senger, R.S.; Papoutsakis, E.T. Genome-scale model for Clostridium acetobutylicum: Part I. Metabolic network resolution and analysis. Biotechnol. Bioeng. 2008, 101, 1036–1052. [Google Scholar] [CrossRef] [PubMed]
  31. Atsumi, S.; Hanai, T.; Liao, J.C. Non-fermentative pathways for synthesis of branched-chain higher alcohols as biofuels. Nature 2008, 451, 86–89. [Google Scholar] [CrossRef] [PubMed]
  32. Yim, H.; Haselbeck, R.; Niu, W.; Pujol-Baxley, C.; Burgard, A.; Boldt, J.; Khandurina, J.; Trawick, J.D.; Osterhout, R.E.; Stephen, R.; et al. Metabolic engineering of Escherichia coli for direct production of 1,4-butanediol. Nat. Chem. Biol. 2011, 7, 445–452. [Google Scholar] [CrossRef] [PubMed]
  33. Movasaghi, Z.; Rehman, S.; Rehman, I.U. Raman spectroscopy of biological tissues. Appl. Spectrosc. Rev. 2007, 42, 493–541. [Google Scholar] [CrossRef]

