Article

Continuous Fermentative Biohydrogen Production from Fruit-Vegetable Waste: A Parallel Approach to Assess Process Reproducibility

by
Leonardo J. Martínez-Mendoza
1,2,
Raúl Muñoz
1,2 and
Octavio García-Depraect
1,2,*
1
Institute of Sustainable Processes, University of Valladolid, Dr. Mergelina s/n., 47011 Valladolid, Spain
2
Department of Chemical Engineering and Environmental Technology, University of Valladolid, Dr. Mergelina s/n., 47011 Valladolid, Spain
*
Author to whom correspondence should be addressed.
Fermentation 2025, 11(9), 545; https://doi.org/10.3390/fermentation11090545
Submission received: 14 August 2025 / Revised: 16 September 2025 / Accepted: 18 September 2025 / Published: 19 September 2025

Abstract

Dark fermentation (DF) has gained increasing interest over the past two decades as a sustainable route for biohydrogen production; however, understanding how reproducible the process can be, both from macro- and microbiological perspectives, remains limited. This study assessed the reproducibility of a parallel continuous DF system using fruit-vegetable waste as a substrate under strictly controlled operational conditions. Three stirred-tank reactors were operated in parallel for 90 days, monitoring key process performance indicators. In addition to baseline operation, different process enhancement strategies were tested, including bioaugmentation, supplementation with nutrients and/or additional fermentable carbohydrates, and modification of key operational parameters such as pH and hydraulic retention time, all widely used in the field to improve DF performance. Microbial community structure was also analyzed to evaluate its reproducibility and potential relationship with process performance and metabolic patterns. Under these conditions, key performance indicators and core microbial features were reproducible to a large extent, yet full consistency across reactors was not achieved. During operation, unforeseen operational issues such as feed line clogging, pH control failures, and mixing interruptions were encountered. Despite these disturbances, the system maintained an average hydrogen productivity of 3.2 NL H2/L-d, with peak values exceeding 6 NL H2/L-d under optimal conditions. The dominant microbial core included Bacteroides, Lactobacillus, Veillonella, Enterococcus, Eubacterium, and Clostridium, though their relative abundances varied notably over time and between reactors. An inverse correlation was observed between lactate concentration in the fermentation broth and the amount of hydrogen produced, suggesting it can serve as a precursor for hydrogen. Overall, the findings presented here demonstrate that DF processes can be resilient and broadly reproducible. However, they also emphasize the sensitivity of these processes to operational disturbances and microbial shifts. This underscores the necessity for refined control strategies and further systematic research to translate these insights into stable, high-performance real-world systems.

1. Introduction

Food waste poses significant social, economic, and environmental challenges, contributing approximately 16% of the total greenhouse gas emissions from the EU food system [1]. Over 58 million tons are generated annually in the EU, equivalent to 131 kg per capita [2]. Globally, up to 40% of the world’s food production is lost or wasted along the value chain [3]. In this context, fruit and vegetable waste (FVW) is a major contributor, accounting for 30–50% of food production losses, largely due to its high perishability [4]. Valorizing FVW through bioconversion processes offers a sustainable pathway to produce biofuels, biochemicals, and other bio-based products, thereby advancing the circular economy, reducing reliance on fossil resources, and mitigating greenhouse gas emissions [5,6,7].
Dark fermentation (DF) is a biological process mediated by hydrolytic and acidogenic bacteria that convert organic waste into biogenic hydrogen (H2), carbon dioxide (CO2), short-chain fatty acids (SCFAs), and alcohols [8,9]. Green H2 is increasingly recognized as a key energy vector in global decarbonization strategies, with the EU targeting up to 10 million tons of renewable H2 production annually by 2030. BioH2 from DF offers a low-carbon alternative, particularly when derived from unavoidable biowaste streams such as FVW. Furthermore, as a core biorefinery technology, DF can be integrated with other processes for the co-production of medium-chain carboxylates [10], biogas [11], bioplastics [12], lipids [13,14], proteins [15], pigments [16], and more. Research on DF generally progresses through technology readiness levels (TRL) 1–5, from concept development to prototype validation under relevant conditions, with only a few studies advancing to TRL 6 for pilot-scale demonstration. The main technical challenges include improving H2 yields (HY), increasing volumetric H2 production rates (HPR), and ensuring long-term stability [8,17]. Several studies have investigated DF using FVW as feedstock [18,19,20,21,22,23]. However, to the best of the authors’ knowledge, no previous work has systematically evaluated the reproducibility of DF performance. In complex biological processes such as DF, reproducibility and predictability are fundamental for translating laboratory findings into scalable technologies. This gap is especially relevant given the multifactorial nature of DF, which requires the coordinated control of interconnected variables, including the inoculum source and pretreatment, substrate composition, operational regime, and reactor configuration [8]. Operating parameters such as hydraulic retention time (HRT), organic loading rate (OLR), pH, temperature, oxidation-reduction potential (ORP), and mixing must be carefully optimized to maximize H2 production and maintain stability [9,24], while gas–liquid transfer rates, invasive microbiota, and external perturbations can also markedly influence performance [24,25,26,27].
As with other biogas-producing microbial systems, DF consortia are highly dynamic and prone to shifts in community composition in response to environmental changes or operational stress. This complexity makes reproducing an experiment retrospectively almost impossible, as initial conditions cannot be identically recreated [28,29,30]. Moreover, whether parallel DF reactors yield identical or at least comparable outcomes, in both process performance and microbial community dynamics, has not yet been investigated. A clear understanding of reproducibility is therefore essential to distinguish inherent biological and operational variability from statistically significant changes caused by process parameters.
In this study, three parallel continuous DF systems were operated under identical conditions to assess the reproducibility of H2 production from simulated FVW. The evaluation included both soluble and non-soluble by-products, providing a comprehensive view of process performance. In parallel, microbial community dynamics were analyzed in detail to elucidate the ecological factors underpinning process stability and functionality. The results offer an integrated assessment of DF performance and microbiology under parallel operation, yielding practical insights to improve the reproducibility and predictability of DF systems for food waste valorization.

2. Materials and Methods

2.1. Biocatalyst

The inoculum source used in the start-up of the parallel fermentation system was obtained from a digestate generated by a 100 L pilot-scale anaerobic digester, which operated under mesophilic conditions while processing restaurant food waste [31]. This digestate was subjected to a 20 min heat shock at 90 °C to effectively inactivate methanogens, and the resultant H2-producing microbial consortium was subsequently stored at 4 °C. The resultant H2-producing mixed culture can facilitate two-phase fermentation of lactate, a process known as lactate-driven DF process, through the action of lactic acid bacteria (LAB) and lactate-utilizing H2-producing bacteria (LU-HPB), among others [32,33]. The inoculum was activated for 19 h under mesophilic conditions (37 °C) using a lactose medium. Additional details regarding inoculum preparation and activation can be found in Martínez-Mendoza et al. (2023) [19]. The inoculum was employed at a volatile suspended solid (VSS) concentration of 180 mg/L.
The bioaugmentation strategy employed the same starter inoculum from the parallel H2-producing system, which was cultivated in a chemostat, using a mineral medium composed of (in g/L) MgCl2·6H2O 2.5, K2HPO4 2.4, NH4Cl 2.4, KH2PO4 0.6, CaCl2·2H2O 0.15, and FeCl2·4H2O 0.035, and powdered cheese whey (PCW) as the carbon source, to ensure a fresh and highly active inoculum [19,34]. The PCW was supplied by Corquimia Industrial, S.L. (Barcelona, Spain). According to the manufacturer’s specifications, the product contained a minimum of 75% lactose and a maximum ash content of 8%. Based on laboratory analysis, the PCW consisted primarily of carbohydrates (76.5%), followed by proteins (11.5%) and lipids (0.95%). The chemostat system was a custom-built 1.4 L jacketed continuously stirred tank reactor, featuring a working volume of 0.8 L. HRT was set constant at 12 h. To maintain stable pH levels at 6.5, the reactor was equipped with a pH controller (EvopH-P5, BSV Electronic, Barcelona, Spain) and a pH electrode (BSV Electronic S.L., HO35-BSV01, Barcelona, Spain). In addition, the fermenter included gas and liquid sampling ports, along with a custom-made gas flow meter that employed the liquid displacement method to measure the cumulative gas production over fermentation time. A thermostatic bath (Tectron-Bio 20, Selecta, Barcelona, Spain) was utilized to heat the reactor to 37 ± 1 °C, while the reactor was magnetically stirred at approximately 300 rpm. At steady-state conditions, the HPR achieved was 11.5 ± 1.1 NL H2/L-d, and the bacteria density was 2.6 g VSS/L.

2.2. Substrate

To evaluate the reproducibility of the DF process, simulated FVW was used as a model substrate. The composition of the FVW substrate was prepared following the methodology outlined by Martínez-Mendoza et al. (2023) [19]. The simulated FVW consisted of the following ingredients (in % w/w): 5.4% apple, 14.5% banana, 4.7% cabbage, 5.7% capsicum, 9.7% carrot, 7.5% cucumber, 12.8% eggplant, 3.2% grape, 2.7% lemon, 7.1% onion, 3.1% orange, 6.3% potato, 2.4% pumpkin, 6.5% radish, and 8.4% tomato. This mixture was designed to simulate the heterogeneous composition of typical FVW. No pretreatment or sterilization was applied to the simulated FVW prior to its use. The substrate was processed using an electric blender (Sammic, XM-32, Azkoitia, Spain) to reduce particle size and achieve a uniform FVW slurry. No additional tap water was needed during blending. The physicochemical characteristics of the substrate were as follows: pH 4.5 ± 0.1, 114.5 ± 6.9 g total chemical oxygen demand (COD)/L, 103.6 ± 7.3 g TS (total solids)/L, 97.2 ± 7.2 g vs. (volatile solids)/L; total carbohydrates 80.1 ± 6.3% w/w (on a dry weight basis). The prepared FVW was then stored in 1 L plastic bags and frozen at −20 °C to prevent deterioration.

2.3. Setup and Experimental Conditions

The DF parallel operation of FVW was conducted in three custom-built continuously stirred tank reactors (hereafter denoted as R1, R2, and R3), each with an operating volume of 0.8 L and a headspace of 0.45 L. To maintain a stable pH, each reactor was equipped with a pH controller (EvopH-P5, BSV Electronic, Barcelona, Spain) and a pH electrode (BSV Electronic S. L., HO35-BSV01, Barcelona, Spain). A 6 M NaOH solution was used to keep pH constant. Additionally, the reactors featured gas and liquid sampling ports. Gas production was measured using a custom-made biogas flow meter that operates on the liquid displacement method. The three reactors were simultaneously operated in a temperature-controlled room set to 37 ± 1 °C, where they were magnetically agitated at approximately 300 rpm (Figure 1).
For the start-up, each of the three reactors was seeded with 10% (v/v) of the inoculum and operated in batch mode for 26 h. Following this initial phase, the reactors were continuously operated in parallel for 90 days, divided into six operational stages (I–VI), during which their performance was evaluated for comparative analysis (Table 1). The sequential changes applied in stages I–VI were introduced progressively in response to process performance, with the overall aim of improving H2 production. These adjustments involved different process strategies, including bioaugmentation, supplementation with nutrients and additional fermentable carbohydrates, and modification of pH and hydraulic retention time, which are widely used to enhance DF performance. Stage I operated at pH 7.0 and an HRT of 18 h. On day 12, the HRT was reduced to 12 h in response to a gradual decline in the HPR. In subsequent stages, various strategies were also implemented to further enhance H2 production. In stage II, the pH was set to 6.5, while the HRT and TS content were decreased from 12 to 9 h and from 5 to 3%, respectively. Subsequently, to positively influence the H2-producing bacterial community, a bioaugmentation strategy was employed in stages III and IV through the addition of a fresh, highly active H2-producing inoculum to the systems. The bioaugmentation strategy involved replacing 20% of the culture broth with fresh inoculum every 24 h. Stage IV also included supplementation with PCW at 8.5 g CODequiv./L (equivalent to 20% of the recommended concentration for H2 production [34]) to evaluate whether the process could enhance HPR and to determine if fermentation was limited by the availability of fermentable compounds. Stage V was designed to test the effect of micronutrient addition, using the same mineral medium described in Section 2.1 [19]. Between days 73 and 77 of this stage, PCW supplementation was also applied under the same conditions as in stage IV. Finally, stage VI returned to the baseline operation, with the feed adjusted to 3% TS and without micronutrient or extra carbon source supplementation.
Liquid samples were collected daily from the effluents of the three systems to monitor pH, organic acid profiles (i.e., lactate, formate, acetate, propionate, iso-butyrate, butyrate, iso-valerate, valerate, iso-caproate, hexanoate, and heptanoate), and total carbohydrate concentrations. The gas flow rate during the DF process was measured several times a day. Key performance indicators included the composition of the acidogenic off-gas produced, the volumetric biogas production rate (BPR), HPR, HY, and carbohydrate removal efficiencies. Throughout the entire operational period, a total of 60 samples were collected from the three fermenters to analyze the bacterial community composition. Samples were collected on the following days for each stage: Stage I—days 4.8, 10.2, 14.9, and 24.3; Stage II—days 31.9, 38.9, 44.8, and 52.9; Stage III—days 60, 62.8, and 63.2; Stage IV—days 65.9, 68.8, and 70.9; Stage V—days 73.9 and 79.9; and Stage VI—days 82.9, 84.9, 85.9, and 89.9.

2.4. Analytical Methods

Total carbohydrates were measured using the phenol-sulfuric acid method. Alkalinity, pH, solids, and COD were determined according to standard methods [35]. Organic acid profiles were analyzed using high-performance liquid chromatography (HPLC). The HPLC system (LC-2050, Shimadzu, Kyoto, Japan) was equipped with a UV-VIS detector (UV-2600i, Shimadzu, Japan) and a HyperREZ XP H+ column (Thermo Fisher Scientific Inc., Waltham, MA, USA). The column temperature was maintained at 75 °C. The eluent (25 mM H2SO4) was kept constant at a flow rate of 0.6 mL/min. Sodium L-lactate (Sigma-Aldrich, part number 71718, Burlington, MA, USA) and a volatile fatty acid (VFA) standard mix (Sigma-Aldrich, CRM46975, USA) were used as reference standards. The composition of biogas was determined using gas chromatography (GC-TCD) with an Agilent 8860 GC (Santa Clata, CA, USA), following the methodology outlined by Regueira-Marcos et al. (2024) [32]. The extraction and sequencing of genomic DNA were carried out in accordance with the methodology reported by Farveen et al. (2025) [36]. Genomic DNA was extracted using the FastDNA™ SPIN Kit for Soil (MP Biomedicals, Irvine, CA, USA) according to the manufacturer’s instructions and quantified using Qubit™ dsDNA HS Assay Kits (Thermo Fisher Scientific, USA). The V4-V5 hypervariable region of the 16S rRNA gene was PCR-amplified using the primer set 515F-944R and Phusion® High-Fidelity PCR Master Mix (New England Biolabs, Ipswich, MA, USA). Following purification, quantification, and library preparation of the PCR-amplified products, 250 bp paired-end reads were generated on the Illumina NovaSeq platform (Novogene, Martinsried, Bayern, Germany). Raw reads were processed to remove adaptors using Cutadapt (ver. 3.3) with default parameters and overlapping paired-end reads were merged using FLASH ver. 1.2.11 [37]. Quality filtering was performed with Fastp ver. 0.23.1, retaining reads with Q ≥ 20. Chimera detection was carried out by comparing the quality-filtered sequences against the reference database, and chimeric sequences were removed using the vsearch v2.16.0 package [38]. High-quality, chimera-free sequences were denoised to obtain amplicon sequence variants (ASVs) using DADA2, implemented within the QIIME 2 software package (ver. 202202). Taxonomic annotation was performed against the SILVA 16S rRNA database ver. 138.1 [39]. Phylogenetic relationships among annotated sequences were inferred using MUSCLE ver. 3.3.31 [40]. The raw sequence data has been deposited in the NCBI GenBank’s Sequence Read Archive (SRA) under BioProject ID number PRJNA1305726.

2.5. Data Treatment

A one-way ANOVA followed by either Tukey’s test or the Kruskal–Wallis test (p < 0.05) was used to assess statistical differences between the means of key performance indicators across the six operational stages and the three DF reactors. The Shapiro–Wilk test was applied to evaluate data normality (p > 0.05), determining the selection of parametric or non-parametric post hoc tests. A Principal Component Analysis (PCA) was also conducted to assess the relationships among operational conditions, H2 production performance, and microbial community composition. All statistical analyses were performed using Statgraphics Centurion software (version 19.2.01). The biogas volume was normalized to standard temperature and pressure conditions (0 °C and 1 atm). All tables and figures, except those related to microbiological analysis, present average values and standard deviations calculated from the three reactors.

3. Results and Discussion

3.1. H2 Production Performance

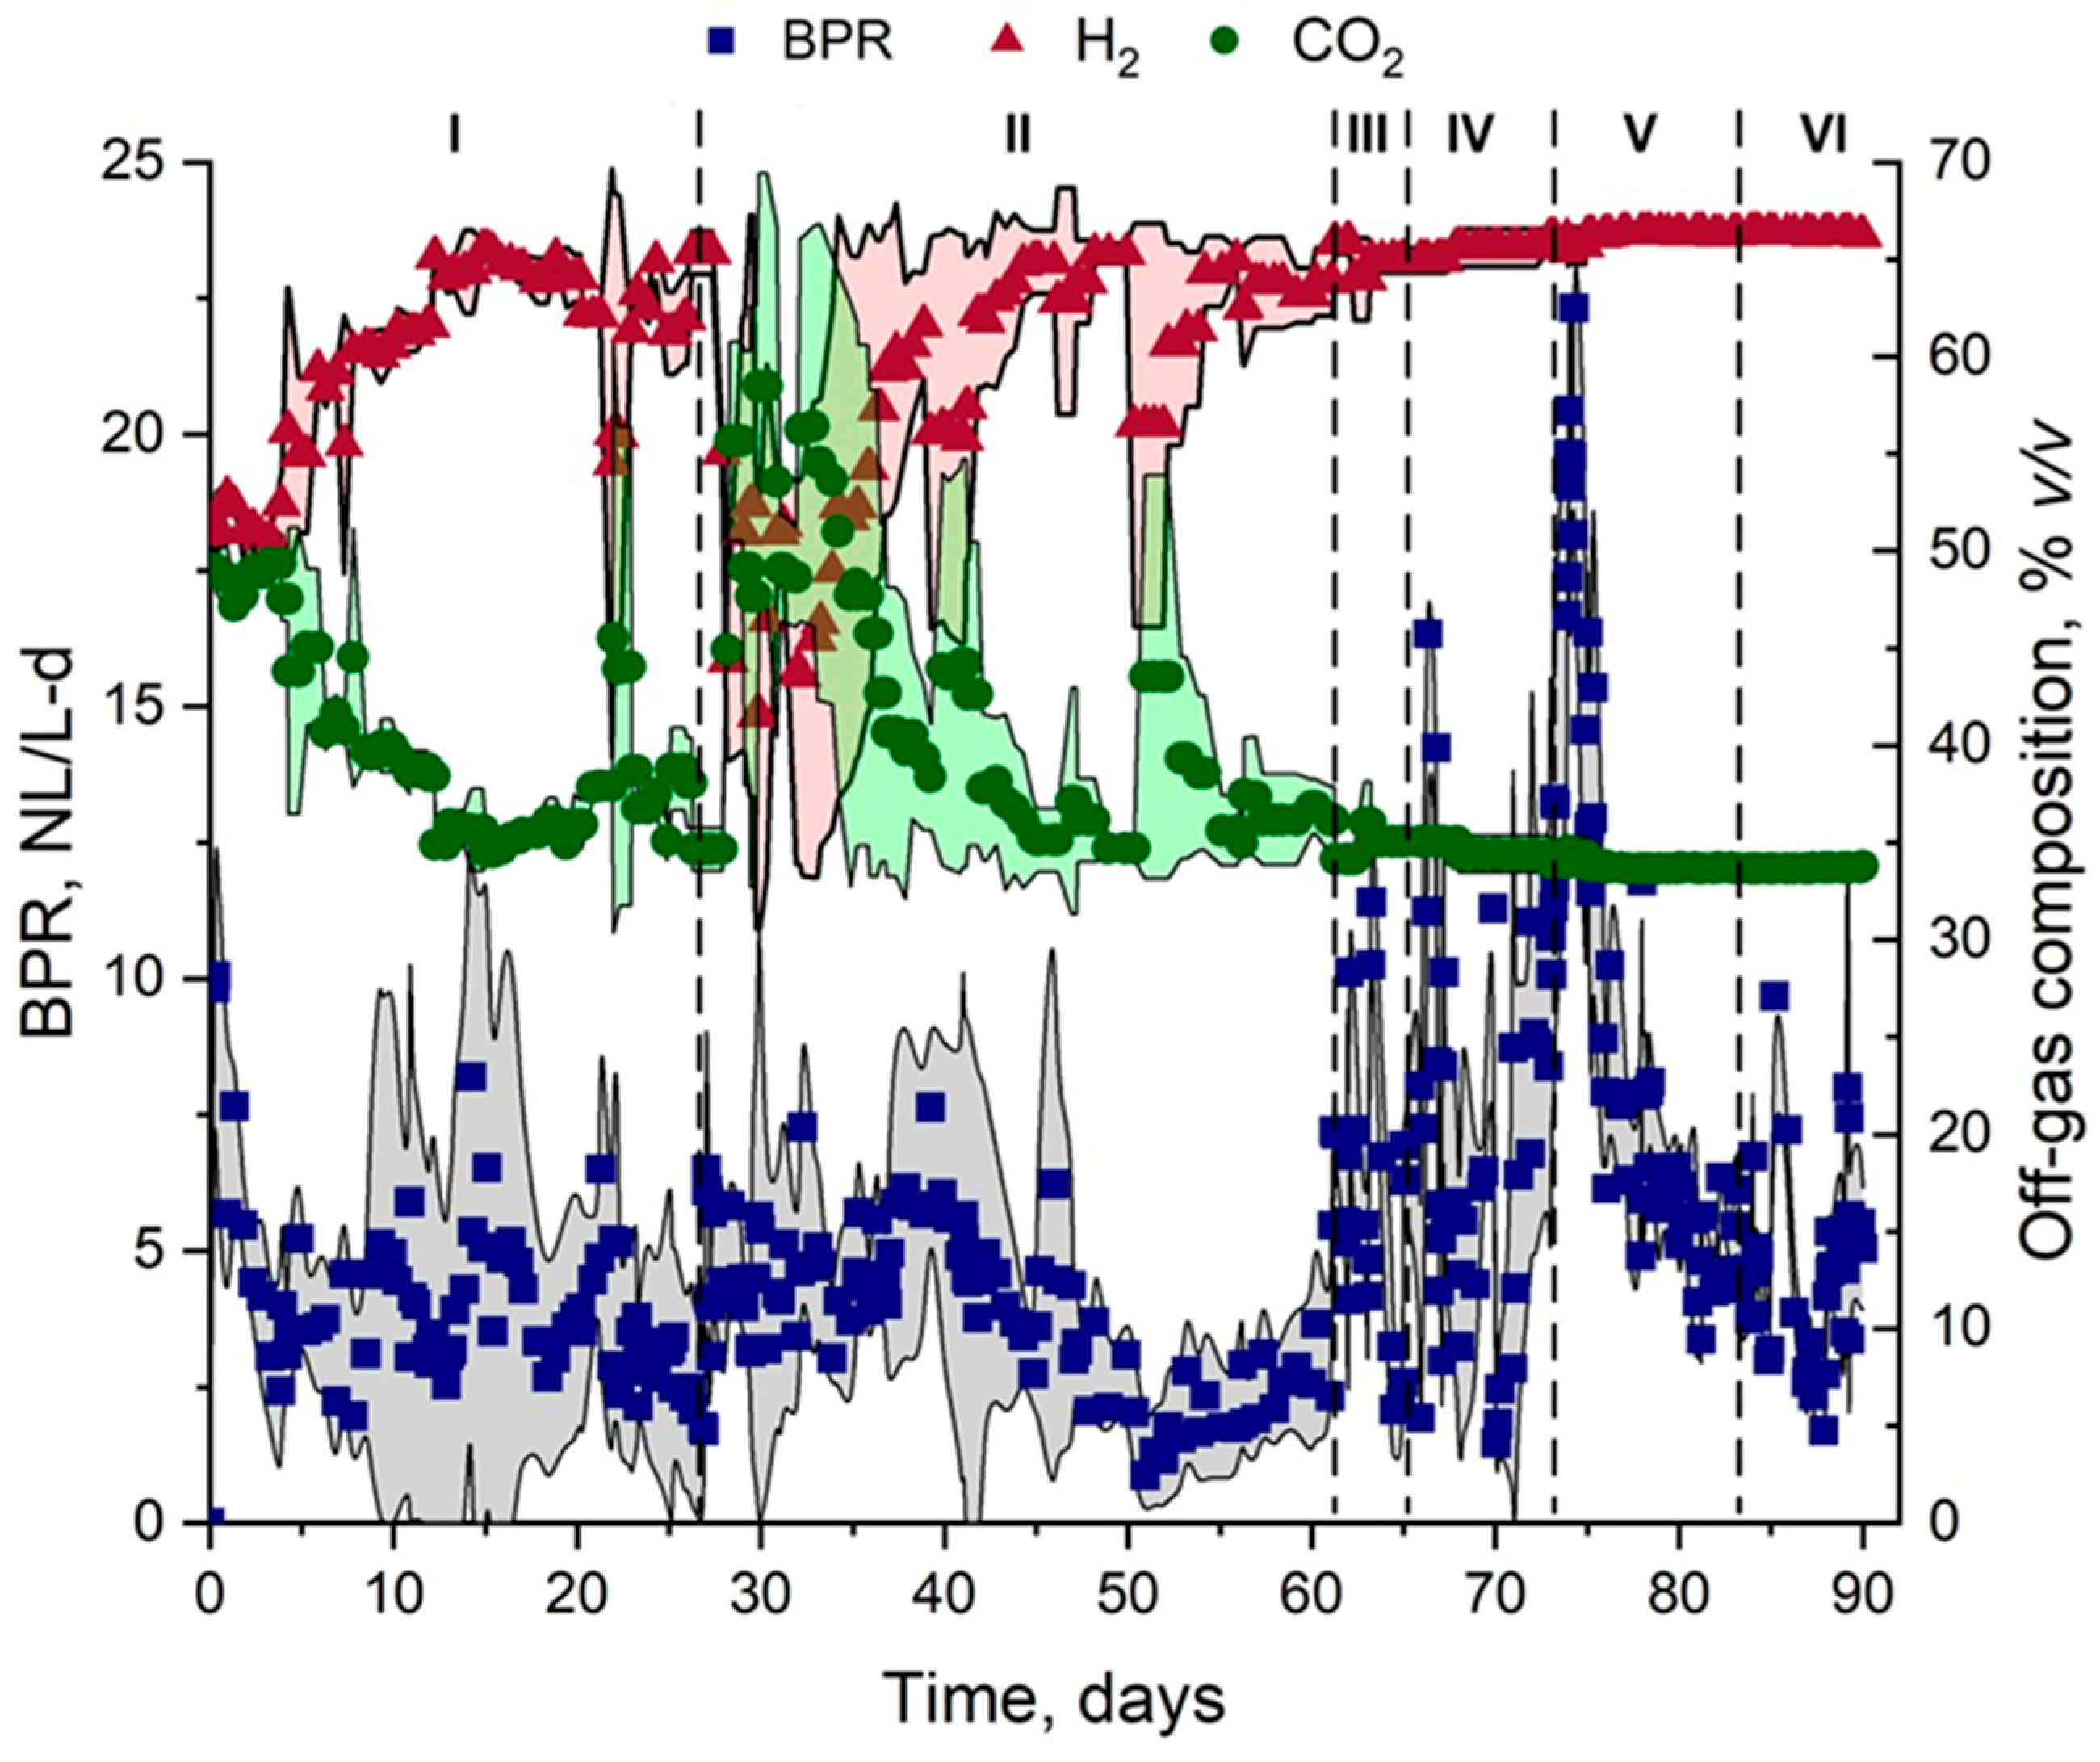
Process performance was monitored throughout the 90-day operation by tracking BPR, HPR, HY, gas composition, and carbohydrate removal efficiencies (Figure 2 and Figure 3; Table 2). Overall, the three reactors displayed a consistent temporal pattern in HPR, HY, and off-gas composition, with synchronous changes observed across operational stages. Notably, there were significant increases during stages III to V, while the H2 content remained stable, apart from the pronounced fluctuations noted in stage II. However, notable differences in absolute values and variability were evident, as indicated by the wide standard deviations in several stages for BPR, HPR, and HY. Statistical analysis revealed that differences between reactors were parameter- and stage-specific (Table 2). Significant inter-reactor differences for SCFAs profiles measured over time occurred only occasionally and were specific to individual metabolites (Table 3). This indicates that while the reactors displayed similar temporal dynamics, with concurrent and directionally consistent changes across operational stages, substantial differences remained in the absolute magnitudes of the responses. These variations may be associated with the specific microbial communities that developed in each reactor and their respective metabolic activity (as discussed in detail in Section 3.2). Here it should be noted that some reactor-specific operational issues occurred, particularly in stages I and II, which may have contributed to the observed variability. Operational issues were mitigated by restoring feeding and mixing functions, manual pH adjustment, and line flushing to resolve clogging. In detail, R1 experienced feed line clogging on days 4.8, 20.8, and 40.8. In addition, failures in the pH controller led to transient increases in pH to 10.4 on days 48.9 and 77.9, and acidification to pH 5.5 on day 71. In R2, feed line clogging occurred on days 4.8, 10.8, and 47.8. On day 21.9, agitation in the feed reservoir failed, possibly affecting substrate homogeneity. Additional issues included obstruction by crystallized NaOH on day 23.25, which required the reactor to be briefly opened, and a malfunction of the effluent pump on day 46.7, resulting in temporary broth accumulation. In R3, the reactor was briefly opened on day 27.3 to clean the outlet tubing, and a mixing failure on day 38.8 caused a pH increase to 7.1. On day 50.3, a feeding pump problem led to transient substrate famine. The pH controller failed again on days 64.6 and 65.9, causing pH drops and spikes, and on day 70, the NaOH reservoir was depleted, allowing air to enter the system. Indeed, when the operational incidents experienced were compared with the variability patterns, a large part of the variability observed in HPR coincided with the events previously described. Nevertheless, it is worth highlighting that all reactors demonstrated resilience to these operational disturbances, maintaining comparable trends across the parallel cultivation system. The following paragraphs describe and discuss in greater detail the operation of the parallel system throughout the different operational stages.
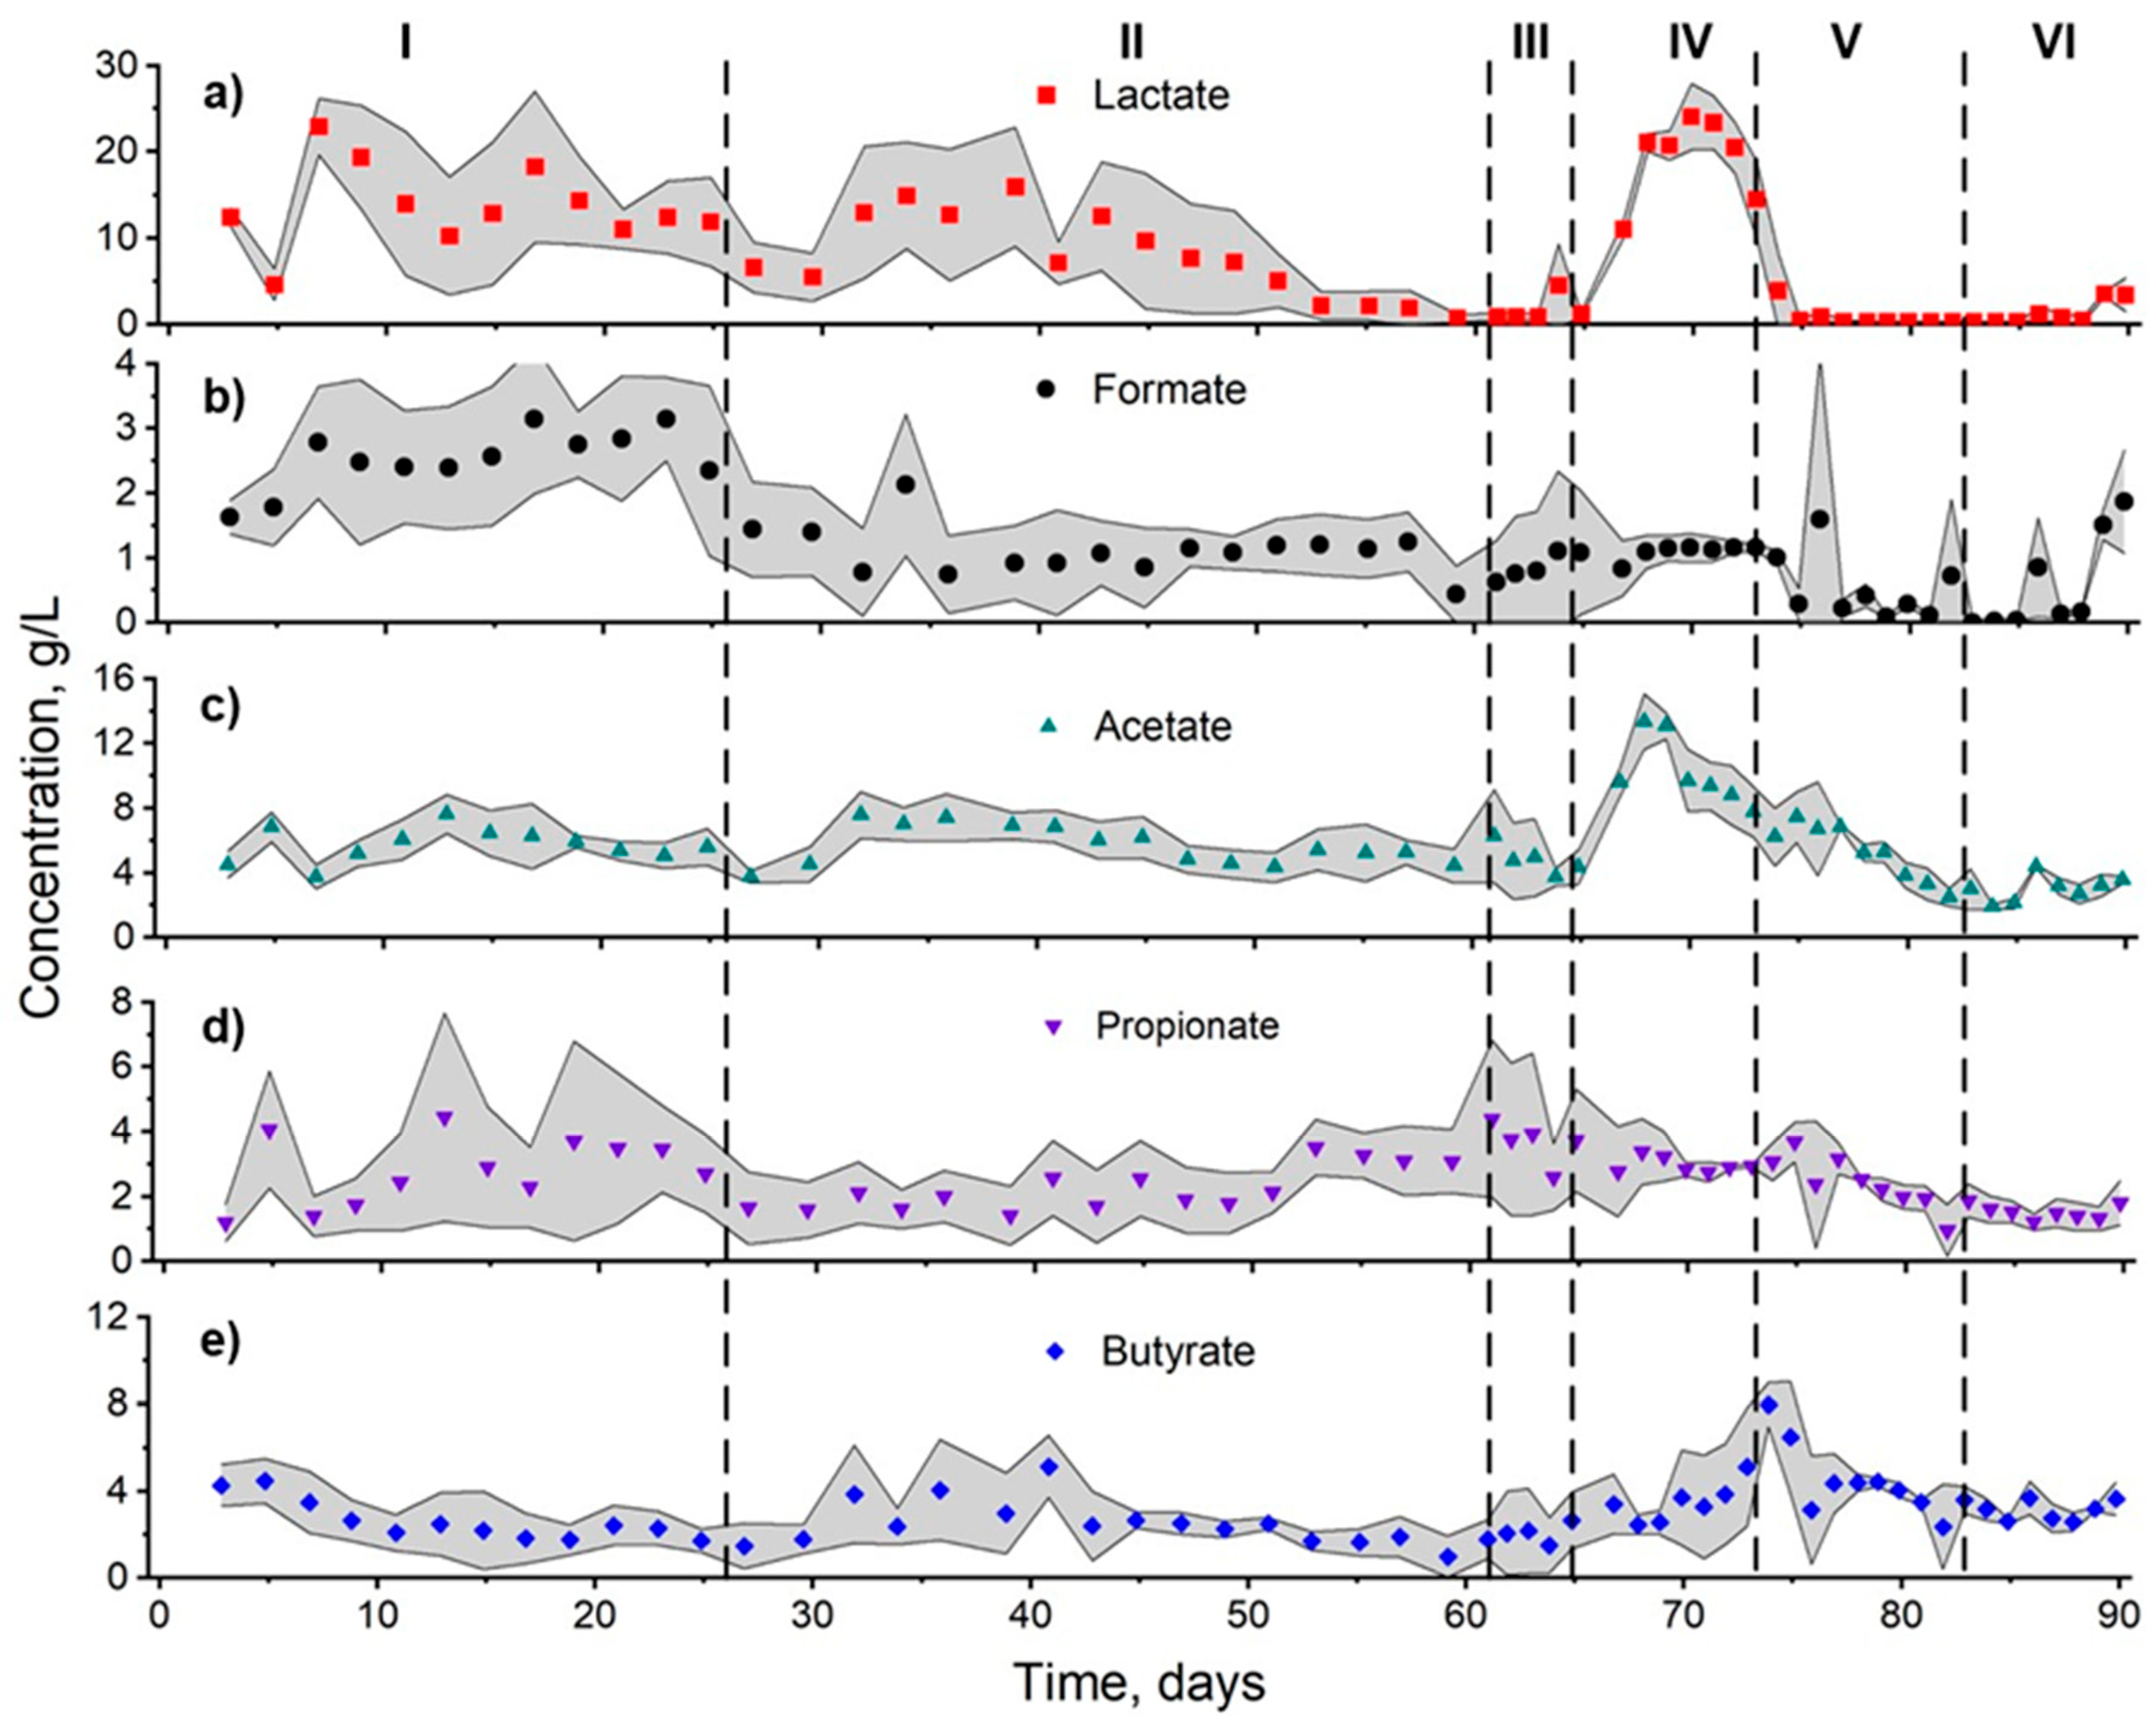
During stage I (days 0–25.8), H2 production was highly variable among reactors. HPR values ranged from 1.0 ± 0.6 NL H2/L-d in R1 to 4.5 ± 2.4 NL H2/L-d in R2, while HY spanned a broad range, from 12.6 ± 5.3 to 76.6 ± 30.6 NmL H2/g VS added. Although H2 content in the off-gas exceeded 50% in all reactors, reaching a maximum of 63.3 ± 1.2% in R2, the substantial variation observed in these process performance indicators indicates that H2-producition activity was not yet fully stabilized. Soluble metabolite profiles further support the conclusion that optimal H2 production conditions have not yet been achieved. Particularly, lactate concentrations were high in all reactors, remarkably in R1 (15.5 ± 7.6 g/L) and R3 (16.5 ± 5.2 g/L) (Figure 4 and Table 3), consistent with the dominance of LAB during early fermentation (see Section 3.2). It is well established that the accumulation of lactate in the fermentation broth during DF reflects a heightened activity of LAB [17,24]. One strategy to avoid this problem of partial or total H2 inhibition caused due to LAB metabolism is the lactate-driven DF process, a metabolic pathway in which the lactate produced is further metabolized by certain types of bacteria capable of producing H2 [24]. In this way, it is not necessary to kill LAB, which is in fact quite difficult in practice, but rather to maintain an appropriate balance between LAB and lactate-utilizing, H2-producing bacteria (LU-HPB) [24,41,42,43,44]. Conversely, acetate levels were relatively moderate and comparable between the reactors, ranging from 5.0 to 6.6 g/L on average. In contrast, butyrate concentrations remained at less than 3.5 g/L on average, indicating a limited involvement of the butyrate-type H2-producing pathway. Formate levels in the reactors remained, on average, between 1.8 and 3.1 g/L, while propionate accumulation showed greater disparity, with R1 and R2 showing the highest and lowest values (4.1 ± 1.9 g/L and 1.2 ± 0.5 g/L, respectively), indicating divergent microbial selection dynamics at this initial stage. It is well known that propionegenesis is an undesirable process in DF, functioning as an H2 sink in both scenarios when propionate is generated from carbohydrates or lactate [45].
Stage II (days 25.8–61.0) involved two critical operational adjustments aimed at enhancing H2 production: the pH was shortened from 7.0 to 6.5, and the TS concentration was reduced from 5 to 3%. These changes were implemented based on evidence suggesting that mildly acidic conditions favor lactate-driven DF [44]. The HRT was further shortened to 9 h, leading to an OLR value of 74.4 g VS/L-d. In response to these modifications, HPR only increased slightly in R1 (from 1.0 ± 0.3 to 1.8 ± 0.9 NL H2/L-d), while R2 and R3 maintained moderate levels (3.6 ± 1.9 NL H2/L-d and 1.3 ± 0.9 NL H2/L-d). BPR (2.8–7.2 NL/L-d) and H2 content in the off-gas (51.6–60.7%) varied widely across all reactors. The differences in HY also remained substantial, ranging on average from 15.4 to 42.8 NmL H2/g VS added. This variability suggests that reproducibility across reactors remains limited, likely due to the operational issues mentioned earlier. Regarding soluble by-products, stage II exhibited a marked reduction in average lactate concentrations in all reactors, dropping to 11.1 g/L in R1, 5.8 g/L in R2, and 5.4 g/L in R3. Formate, acetate, and butyrate remained relatively stable (0.7–1.3 g/L, 5.3–6.8 g/L, and 2.3–2.9 g/L, respectively). Propionate concentrations remained low and comparable across reactors. In R1, propionate decreased by ~41%, likely alleviating its role as an H2 sink and contributing to the slight enhancement in HPR.
Stages III (days 61.0–65.0) and IV (days 65.0–73.0) corresponded to the period during which a bioaugmentation strategy was applied to all reactors in an effort to enhance H2 production activity [46,47]. In this context, it has been reported that the bioaugmentation of an H2-producing mixed culture with a synthetic consortium of well-characterized H2-producing bacteria represents an effective strategy for enhancing H2 production performance under transient stresses, such as temperature fluctuations [47]. Such an approach is especially pertinent to this study, given that comparable transient stresses resulted from the unforeseen operational failures outlined earlier. The bioaugmentation strategy followed here consisted of daily replacement of 20% of the working volume with fresh inoculum enriched in H2-producing bacteria cultivated on PCW. Operational conditions remained unchanged from stage II (pH 6.5, TS 3%, HRT 9 h), allowing the isolated assessment of bioaugmentation effects. The response in terms of H2 production was immediate and highly reproducible across reactors. However, the effect of bioaugmentation was transient, in accordance with observations previously reported by Sim et al. (2024) [46]. In stage III, volumetric HPR peaked up to 11.8 NL H2/L-d in R1, 7.7 NL H2/L-d in R2, and 6.4 NL H2/L-d in R3. Interestingly, the addition of extra substrate (PCW) in stage IV, which was used to cultivate the enhanced H2-producing mixed culture, resulted in a pronounced peak in HPR, albeit to a limited extent. In stage IV, volumetric HPR peaked up to 8.7 NL H2/L-d in R1, 12.3 NL H2/L-d in R2, and 12.9 NL H2/L-d in R3. However, variability in HY was still considerable, ranging from 43.5 ± 30.4 to 71.2 ± 39.5 NmL H2/g VS added in stage I and from 62.0 ± 31.0 to 71.2 ± 57.5 NmL H2/g VS added in stage IV. One possible explanation for the temporal effect of bioaugmentation is that augmented populations were either outcompeted by resident microbiota (this microbiological explanation is further discussed in Section 3.2). In line with this, Kumar et al. (2016) mentioned that for bioaugmentation to be effective, biotic factors such as inoculum size and the physiological state of the augmenting culture are critical, as they determine the activity of the selected microorganisms and the extent of the bioaugmentation effect [48]. They also highlighted the importance of abiotic conditions, both environmental and fermentation-related, in sustaining strain viability and ensuring the stability and persistence of the bioaugmentation over time [48]. Another interesting finding was that the H2 content at this stage and onwards remained stable, exceeding 60% v/v across all reactors, which is consistent with sustained H2 production activity observed. Regarding soluble metabolite profiles, the SCFAs detected in stage III remained similar to those recorded at the end of the previous stage II. However, for stage III, a notable and consistent change was observed, mainly characterized by the increase in lactate and acetate to values of up to 17.7–21.3 g/L and 9–11.4 g/L, respectively, indicating the overrepresented activity of LAB. Butyrate levels in the fermentation broth also increased during stage IV, particularly in R2 and R3.
Stages V (days 73–83) and VI (days 83–90) were designed to assess the impact of nutrient supplementation and the addition of PCW as a co-substrate, followed by the withdrawal of these inputs. Interestingly, H2 production performance peaked during stage V, with HPR values peaking at 13.8, 15.6, and 18.2 NL H2/L-d in R1, R3 and R3, respectively. However, the observed enhancement was not maintained over time as the HPR decreased and stabilized consistently in all the reactors by day 76. The supplementation of PCW was thus discontinued on day 77. On average, HPR vales in stage V were 6.0 NL H2/L-d (R1), 7.4 NL H2/L-d (R2), and 6.7 NL H2/L-d (R3). HY also reached maximum levels, rising to 77.1 ± 41.1 NmL H2/g VS), 95.2 ± 51.9 NmL H2/g VS). The exact causes of the transient effect caused by the addition of extra nutrients remain unknown. It is possible that these nutrients provide a temporary boost to H2 producers over LAB, which may be supported by the significant reduction observed in lactate (reaching values below 1 g/L in all cases; Figure 4, Table 3). Compared with stage IV, other important changes in organic acids detected in stage V included the increase in butyrate levels accompanied by the decrease in acetate. Following the withdrawal of nutrient supplementation in stage VI, HPR declined, on average, by 40–58% relative to stage V, from 6.0 to 2.5 NL H2/L-d (R1), 7.4 to 3.6 NL H2/L-d (R2), and 6.7 to 3.3 NL H2/L-d (R3). Similarly, HY dropped by 32–55%, falling to 34.9–52.6 NmL H2/g VS added. Upon reviewing the HPR values recorded during specific days of the previous stage V, particularly from days 76 to 83, the HPR observed in stage VI was quite comparable. This observation suggests a notable degree of process reproducibility. Notably, no significant changes in the SCFAs were detected in stage VI. To contextualize the H2 production performance of the parallel DF system, the H2 production performance achieved here was evaluated against the highest values reported in the literature. The maximum HPR achieved in batch DF of the same simulated FVW was 23.4 NL H2/L-d under optimized conditions [18]. In contrast, in continuous mode, the highest HPR reported so far is 11.8 NL H2/L-d at a 9 h HRT (125.4 g VS/L-d OLR) [19]. Against this benchmark, the H2 productivities obtained in the present study are directly comparable to the best values achieved under continuous operation.
As shown in Table 2, total carbohydrate removal showed no significant differences among reactors at any stage (p < 0.05), which remained consistently high, exceeding 80% in all reactors throughout the experimental period, which indicates that H2 production activity was not limited by the capacity of microorganisms to ferment carbohydrates but rather by the microbiology imposed and its related activity. In the literature, it has been observed that carbohydrate degradation does not necessarily show a direct relationship with H2 production efficiency [19,32].

3.2. Microbial Ecology

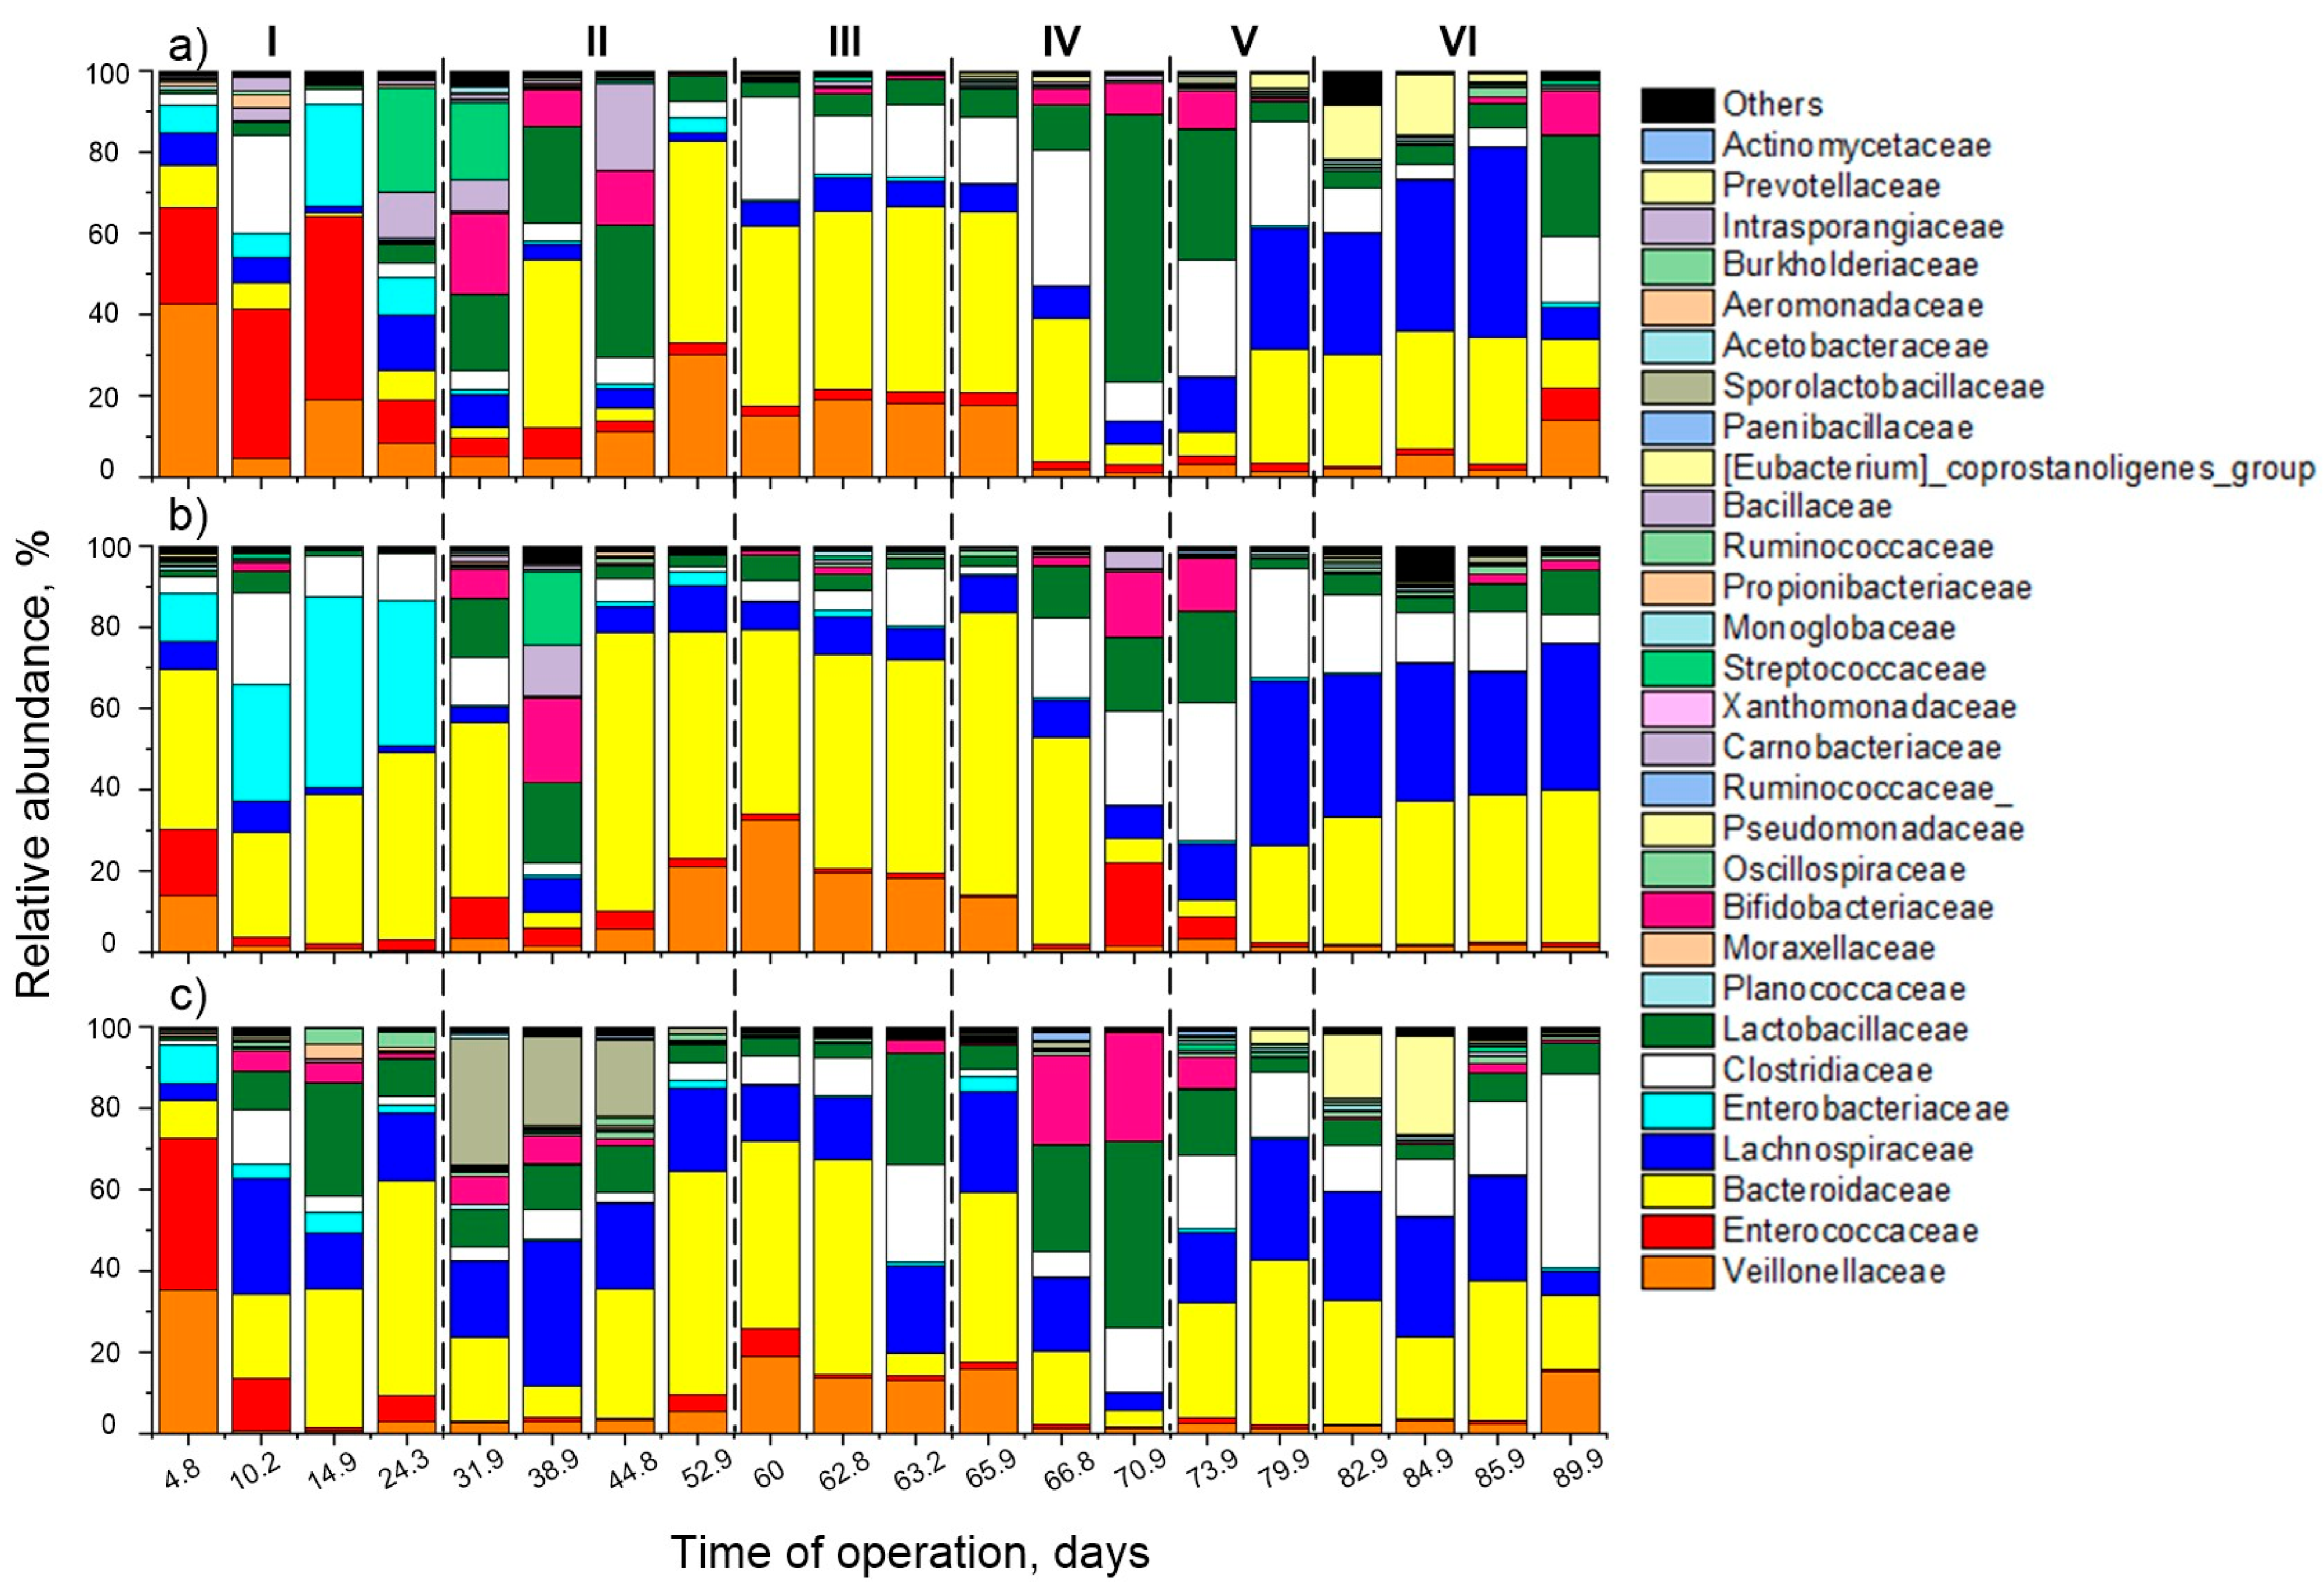
The present study aimed to assess the reproducibility of DF performance by operating three continuous stirred-tank reactors in parallel under strictly controlled and identical conditions. Each reactor was operated as an independent closed system with separate feeding, effluent, and gas lines, and samples were collected independently from each unit, although cross-contamination cannot be entirely ruled out under laboratory conditions. Despite this deliberate standardization, the microbial communities exhibited dynamic succession patterns that, while maintaining a consistent core structure, showed some reactor-specific differences. At the family level, Bacteroidaceae, Veillonellaceae, Enterococcaceae, Lachnospiraceae, Lactobacillaceae and Clostridiaceae, were consistently detected in all reactors (Figure 5). All these families have been reported in DF systems [49,50]. However, their relative abundances varied considerably among R1, R2, and R3 within the same stage. At the start of the operation (stage I), Veillonellaceae dominated R1 (42.6%) and R3 (35.3%), while in R2, its relative abundance was markedly lower (14.0%). However, its relative abundance experienced a marked decrease by the end of the stage in all the reactors (down to 8.3% in R1, 0.4% in R2, and 2.9% in R3). Enterococcaceae was also abundant in R1 (10.6–44.96%) and R3 (6.3–37.4%) but lower in R2 (1.2–16.2%). In contrast, Bacteroidaceae was most abundant in R2 (25.9–46.2%) and R3 (9.2–52.9%) compared with R1 (1.0–10.4%). Lachnospiraceae was most abundant in R3 (4.1–28.5%) compared with R1 (1.5–13.5%) and R2 (1.5–7.7%). Enterobacteriaceae also showed a fluctuating behavior across the reactors, 5.8–25.2% in R1, compared with 11.9–47.0% in R2 and 1.8–9.6% in R3. As for Lactobacillaceae, it remained relatively low in R1 (<4.5%) and R2 (<5.3%), while there was an increase in R3 (9.1–27.8%). Clostridiaceae remained below 3.6% at R1, 11.6% at R2, and 4.0% at R3, except on day 10.2, in which it peaked at 24.2% in R1, 22.5% in R2, and 13.3% in R3. These marked differences in family-level dominance across the reactors highlight the low reproducibility of the microbial community structure during start-up, likely driven by early-stage disturbances, which in turn may have generated localized microenvironmental variability.
With the transition to stage II, Bacteroidaceae exhibited a consistent upward trend over the fermentation period; its relative abundance increased to 49.7% in R1, 68.5% in R2, and 54.9% in R3. Conversely, Veillonellaceae tended to enrich in R1 (from 5.1 to 30.1%) and R2 (from 3.4 to 21.0%), while remaining low in R3 (2.6–5.4%). Lachnospiraceae exhibited inconsistent behavior across all reactors. In R1, its abundance decreased from 8 to 2%; in R2, it increased from 3.8 to 11.4%; whereas in R3, it remained notably high at 18.7 to 21.2%, peaking at 35.7% on day 10. The relative abundances of Clostridiaceae and Enterococcaceae were recorded to be relatively low regardless of the reactor type (<6.5% and 7.5% in R1, <5.8% and 10.0% in R2, and <7.3% and 4.2% in R3, respectively). In contrast, Lactobacillaceae showed an initial increase during a few days of operation, particularly in R1 and R2, before exhibiting a declining trend, which ultimately resulted in percentages of 6.2% in R1, 2.8% in R2, and 4.4% in R3. The beginning of this operational stage also coincided with a transient increase in Bifidobacteriaceae, mainly in R1 (up to 19.7%) and R2 (up to 20.7%). Finally, the relative abundance of Enterobacteriaceae remained relatively low (0.8% on average) in stage II and onwards, independent of the type of reactor. Importantly, in stage II, microbial communities showed increasing similarity across the reactors over time, as the variations in group dynamics became more constrained. Although unexpected operational disruptions likely caused some persistent differences, these factors did not overshadow the evident trend toward a synchronized pattern in microbial succession.
Moving into stage III, as shown in Figure 5, Bacteroidaceae remained abundant in all reactors (43.8–52.6%), except in R3 (day 63). Veillonellaceae was highest in R1 (18.1%) and R2 (32.5%) but decreased further in R3 (13.7%). Regarding Clostridiaceae accounted for 17.8% in R1, 14.2% in R2, and 23.97% in R3. Lactobacillaceae remained relevant in R1 (3.6–6.2%) and R3 (4.3–27.3%), whereas in R2 it dropped from 6.2 to 2.3%. Finally, the relative abundances of the families Enterococcaceae (2.4–2.8%, 6.1–8.4%, and 7.0–6.9% for R1, R2, and R3, respectively) and Lachnospiraceae (6.1–8.4% in R1 and 6.9–9.3% in R2) were found to be relatively low, with the exception of the latter family in R3, which experienced an increase from 13.5 to 21.4%. Taken together, these shifts can be partly attributed to the microbial composition of the bioaugmentation inoculum, which was heavily dominated by Clostridiaceae (54.1%) and Enterobacteriaceae (30.9%), with a notable representation of Bacteroidaceae (11.6%) (MC-2 in Figure 6). The strong prevalence of Clostridiaceae in the inoculum is consistent with its subsequent expansion across all reactors in stage III, suggesting that this family was well adapted to the prevailing operational conditions and potentially contributed to maintaining H2 production activity. In contrast, despite its high initial abundance, Enterobacteriaceae did not establish dominance post-bioaugmentation, indicating either limited competitiveness or rapid displacement by other taxa under continuous operation. The moderate proportion of Bacteroidaceae in the inoculum may have reinforced its already high abundance in the reactors from the previous stage, contributing to its persistence as a core component of the microbial community.
During stage IV, Clostridiaceae and Lactobacillaceae became dominant in all reactors, with the latter family reaching particularly high relative abundances of up to 65.8% in R1 and 45.9% in R3. Bifidobacteriaceae’s relative abundance also showed an increasing trend in this stage, from 0.3 to 7.6% in R1, 0.0 to 16% in R2, and 0.4 to 26.6% in R3. Interestingly, Bacteroidaceae experienced a consistent decline across all the reactors, from 44.5 to 5.1% in R1, 69.5 to 6.0% in R2, and 41.9 to 3.9% in R3. Veillonellaceae relative abundance shortened in all reactors from 17.7 to 1.1% in R1, 13.6 to 1.6% in R2, and 15.9 to 1.9% in R3. Enterococcaceae also remained at low levels (<2%), except in R2, which experienced a transient peak of 20.4% by the end of the stage. Finally, Lachnospiraceae remained at low relative abundances in R1 and R2, similar to stage II levels, while in R3 it dropped sharply from 24.6% to 4.3%, resulting in greater uniformity across reactors. In general, the microbial trends observed at stage IV can be partially attributed to the microbial composition of the bioaugmentation inoculum, which was notably enriched in Clostridiaceae (61.7%) and included significant proportions of Lactobacillaceae (12.1%), Prevotellaceae (11.6%), and Enterobacteriaceae (6.9%) (refer to MC-3 in Figure 6). Here it should be noted that, at the family level, the mixed cultures used for bioaugmentation were compositionally similar to each other and to the inoculum used at start-up (Figure 6). In sharp contrast, the autochthonous microbiota was dominated by Veillonellaceae (31.1%), Enterobacteriaceae (17.2%), Lachnospiraceae (16.1%), Enterococcaceae (12.4%), Clostridiaceae (10.3%), and Bacteroidaceae (7.9%) (Figure 6).
In stage V, Bacteroidaceae increased in R1 (from 5.9 to 28.0%), in R2 (from 4.2 to 23.9%), and in R3 (from 28.3 to 40.5%). Lachnospiraceae also exhibited an increasing trend across all three reactors, with percentages ranging from 13.4% to 29.8% in R1, 13.9% to 40.6% in R2, and 17.3% to 29.8% in R3. In contrast, Veillonellaceae and Enterococcaceae remained at consistently low levels (below 2.1% in all cases), similar to those observed in the preceding stage IV. In stage V, the Clostridiaceae family maintained consistently high values of 28.8%, 34.1%, and 18.1% for R1, R2, and R3, respectively. In contrast, the Lactobacillaceae family experienced a significant decline, with percentages dropping from 32 to 4.8% in R1, from 22.3 to 2.3% in R2, and from 15.9 to 3.4% in R3. Finally, Bifidobacteriaceae dropped to consistently low levels (0.6–0.3%) in all reactors during stage V.
By the final stage VI, the Bacteroidaceae family remained dominant, with relative abundances ranging from 12 to 31.2% in R1, 31.4 to 37.6% in R2, and 18.3 to 34.3% in R3. Lachnospiraceae was also dominant, showing relative abundances higher than 29.8% in R1, 30.2% in R2, and 25.7% in R3; however, by the end of the operation, it markedly decreased in R1 (7.9%) and R3 (5.8%). Clostridiaceae exhibited fluctuating behavior in R1 (3.5 to 16.3%); in R2, there was a decreasing trend over time (from 19.2 to 7.1%); whereas in R3, it demonstrated an upward trend (from 11.3 to 48.8%). Lactobacillaceae remained at low shares (3–7%) in the three reactors but increased to 24.7 and 10.9% by the end of operation in R1 and R2, respectively. Veillonellaceae rose again by the end of the operation in R1 (13.9%) and R3 (15.1%), while it remained at similarly low levels in R2 (1.8%). Enterococcaceae continued to show low relative abundances (<0.9%), except in R1, in which it reached 7.9% at the end of operation.
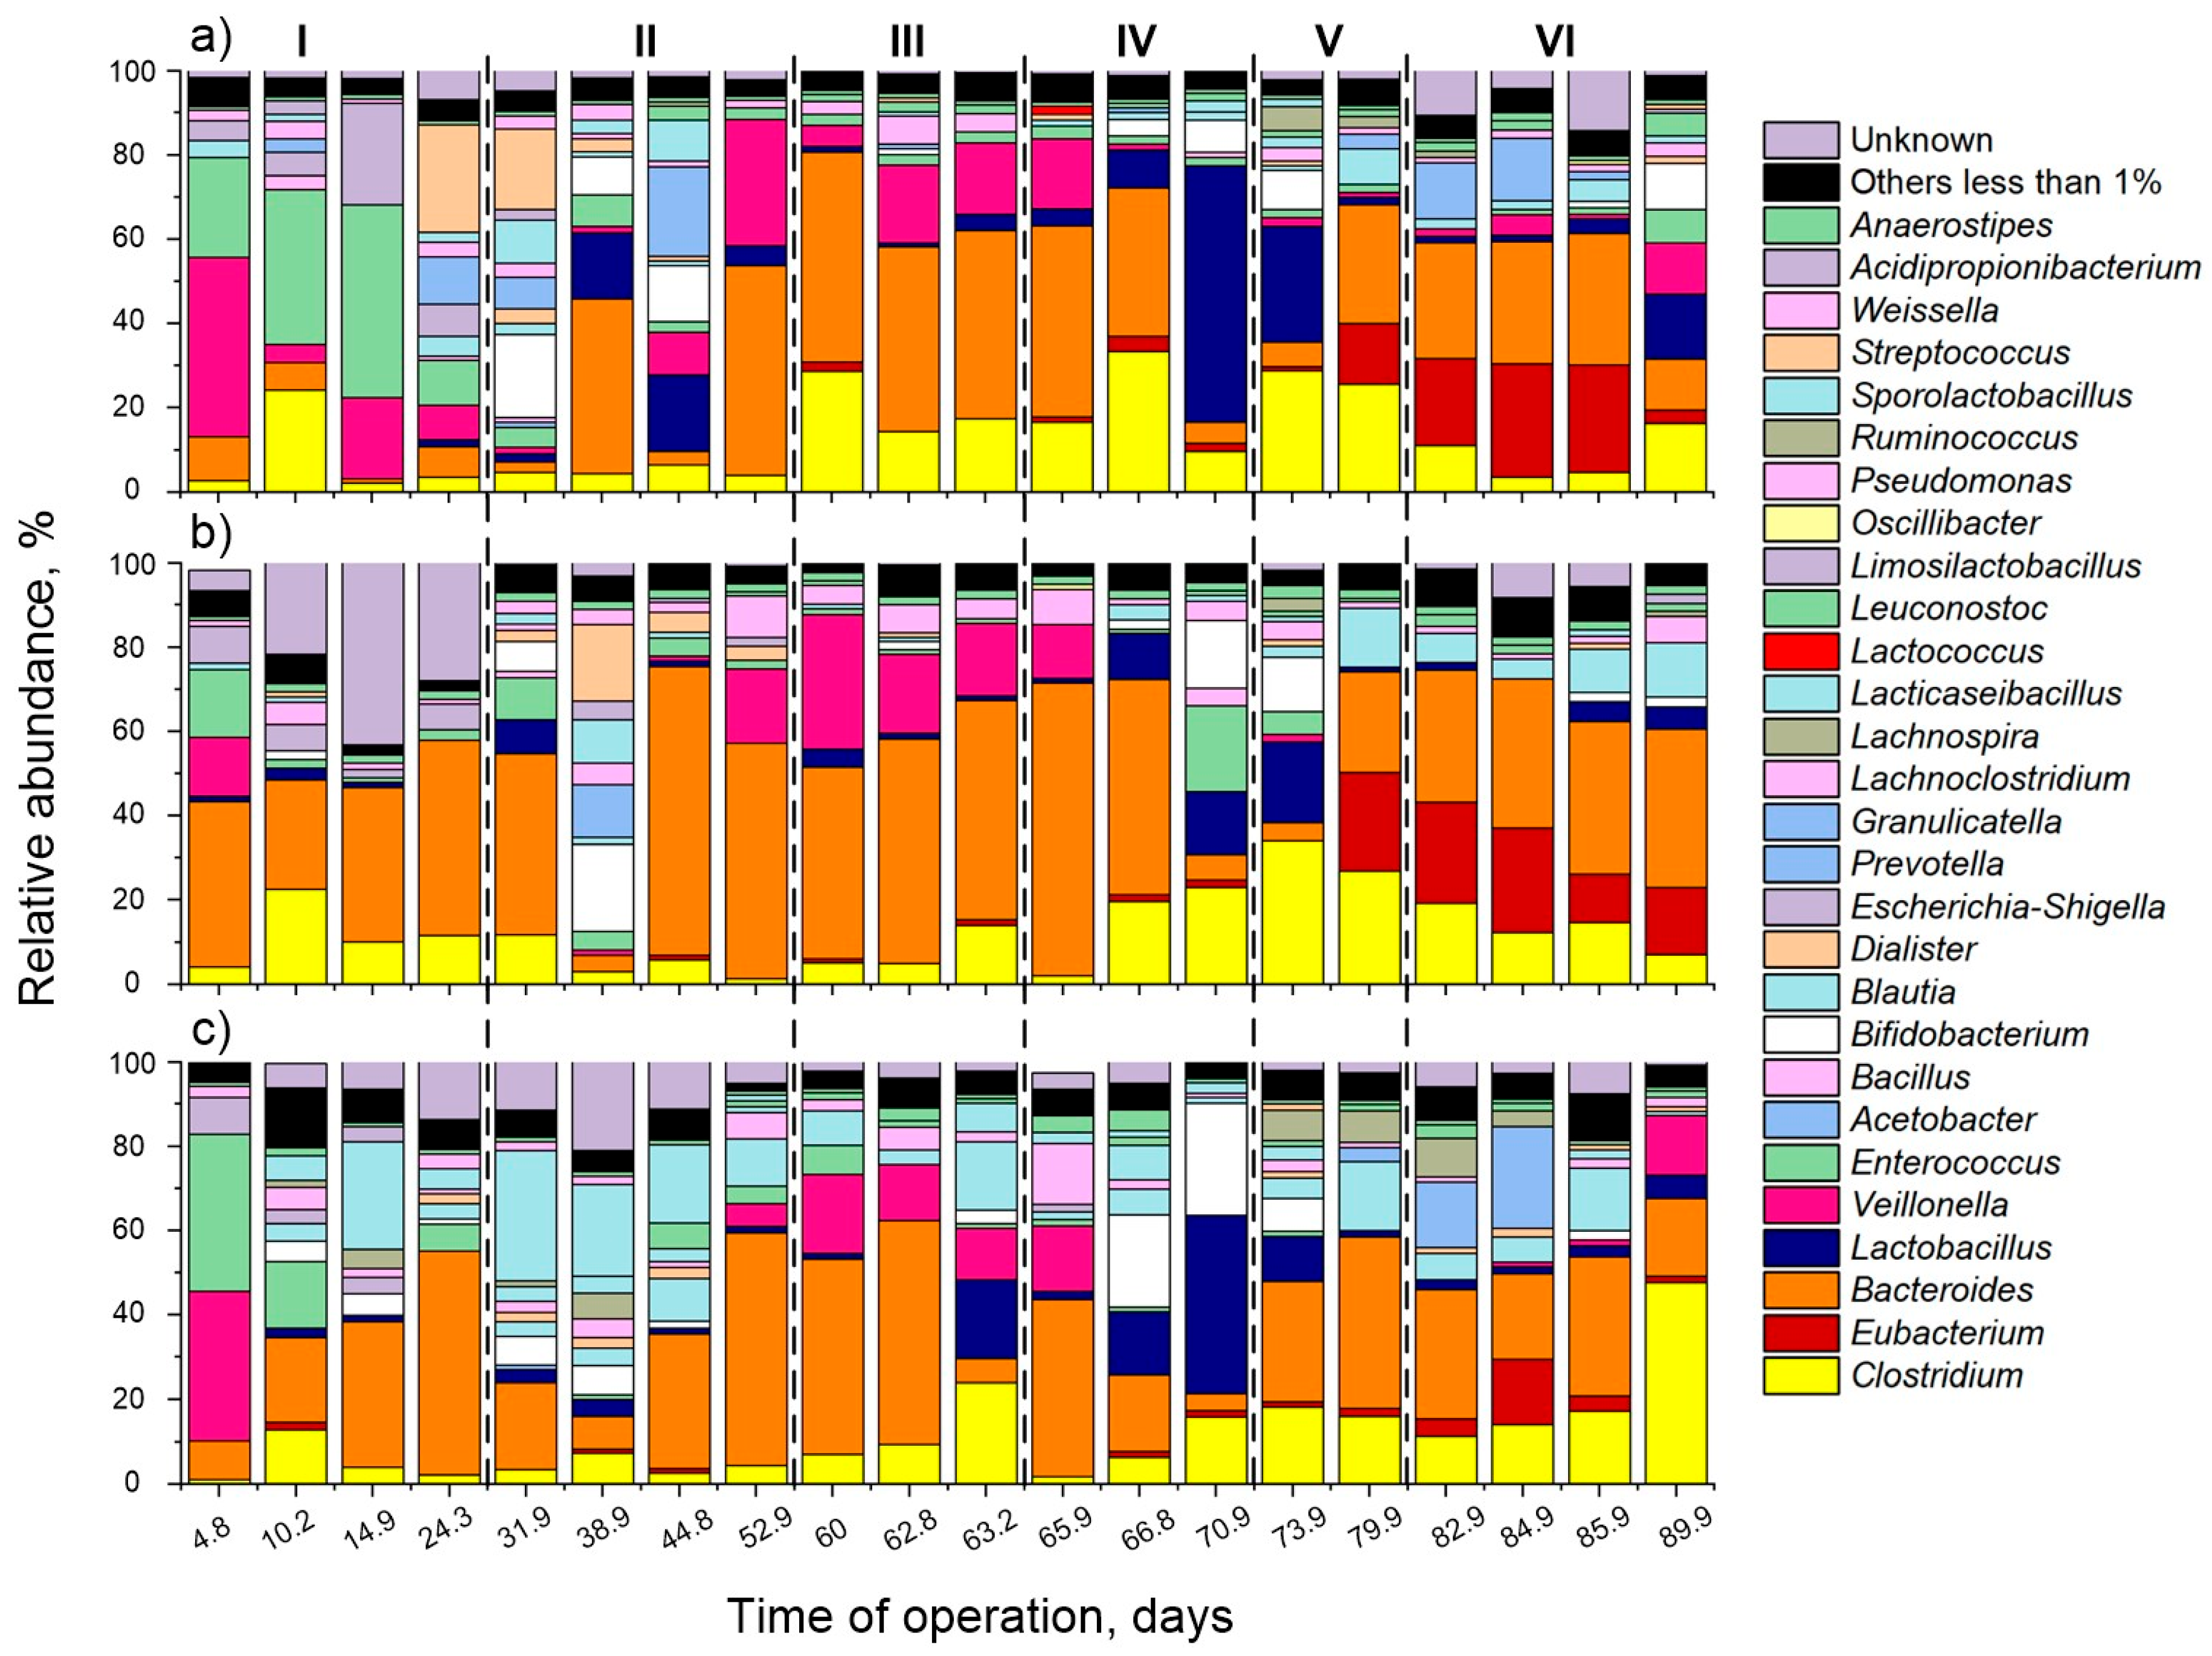
At the genus level, across all operational stages, the microbial communities were consistently dominated by a limited set of taxa, including Bacteroides, Lactobacillus, Veillonella, Enterococcus, Eubacterium, and Clostridium, which together accounted for ≥80% of the total relative abundance (Figure 7). This stable taxonomic core was detected in all reactors, indicating the reproducible enrichment of key functional guilds under the operational framework applied. Nevertheless, the proportional distribution of these genera varied considerably between stages and, in several cases, between reactors within the same stage. In operational stage I, Veillonella genus predominated in R1 and R3, accounting for 35–42% of the total community, whereas Bacteroides dominated R2 (up to 46.2%), with Enterococcus contributing substantially to R1 (10.6–45.7%) and R3 (6.4–37.4%). Clostridium genus was present in all reactors, but only R2 showed moderate relative abundances (4–22.6%) with a tendency to decline over operation time. This configuration coincided with the lowest reproducibility in HPR, which showed high temporal fluctuations and marked inter-reactor variability. Veillonella and Bacteroides have been detected in operational periods showing relatively high H2 production activity during the lactate-driven DF of real household food waste [51]. Veillonella has also been associated with propionate and acetate production as major end products from lactate fermentation [52,53]. Bacteroides have the capacity to growth on lactate, producing H2 gas, indeed, this genus is one of the most abundant bacterial genera responsible for H2 production in the colon [51,53,54]. Some species of the genus Clostridium have the capacity to perform lactate-driven DF [24]. Enterococcus is pointed to as LAB, but its wide range of metabolic activities has closely associated it with H2 production, mainly using lignocellulosic substrates [54,55]. Consistent with these observations, lactate was the most abundant carboxylate, representing > 50% of the total carboxylates detected. The divergence observed at this point may have been accentuated by start-up-related factors, including the unforeseen operational issues, as previously mentioned in Section 3.1.
As the system progressed into stage II, there was a notable restructuring of the community. Bacteroides became the predominant genus in all reactors, peaking at ~68% in R2 and exceeding 49% in R1. Lactobacillus reached ~16% in R1, while Clostridium maintained moderate levels (~6–12%). In contrast, Veillonella persisted at <5%, Enterococcus appeared sporadically at <8%, and Eubacterium remained at <5%. These changes were accompanied by a marked decrease in lactate concentrations relative to stage I, while acetate remained stable and butyrate production was moderate. This suggests more efficient lactate consumption by Bacteroides and Clostridium, resulting in a more balanced acidogenic metabolism. It is worth mentioning that an analysis of the operational incidents and the associated microbial shifts suggests that genera such as Lactobacillus, Bifidobacterium, and Eubacterium may have emerged in response to transient stresses, including pH fluctuations, substrate depletion, and brief oxygen exposure. This observation warrants further investigation in future systematic studies to elucidate the impact of such process disturbances on microbial community dynamics.
Interestingly, the first bioaugmentation imposed in stage III was one of the most convergent stages across reactors. In detail, Bacteroides maintained high abundances (>45% in R1 and R2) but was accompanied by notable increases in Clostridium (~29% in R1) and Lactobacillus (~19% in R3). Veillonella remained at ≤8%, Enterococcus at ≤3%, and Eubacterium at 2–4%. This convergence was associated with sustained HPR improvements and reduced lactate levels, accompanied by moderate butyrate and propionate production. The increase in Clostridium observed in Stage III was associated with the mixed culture used for bioaugmentation, which was dominated by Clostridium sensu stricto 1 (Figure 6), as no operational issues were recorded during this period.
Stage IV, corresponding to the second bioaugmentation, generated the highest HPR peaks of the entire study. However, these gains were short-lived and accompanied by renewed divergence in microbial composition. More particularly, Bacteroides reached its maximum relative abundance (~69%) in R2, Lactobacillus surged to ~42% in R3, and Clostridium reached ~33% in R1. Veillonella and Enterococcus remained at ≤6% and ≤4%, respectively, while Eubacterium stayed below 5%. This restructuring coincided with renewed lactate accumulation and elevated acetate concentrations, which are indicative of intensified LAB activity (Lactobacillus, Enterococcus) coupled with only partial lactate conversion by Clostridium and Bacteroides. The effect on HPR was reactor-dependent: R1 sustained relatively high HPR despite the lactate build-up, likely due to the co-dominance of Clostridium and Bacteroides, whereas R2 and R3 exhibited lower H2 productivity, consistent with LAB-dominated communities that limit H2 evolution. It is important to note that in stage IV, operational disturbances may have contributed to changes within the community. However, the occurrence of unforeseen operational issues in only a few reactors does not fully account for stage-wide changes, such as the overall increase in lactate levels
Stage V marked another major shift, with Bacteroides decreasing to 4–28% and Eubacterium emerging as a dominant genus (~23% in R2), along with Sporolactobacillus (>14% in R1 and R3). Lactobacillus ranged from 2 to 9%, Clostridium from 3 to 8%, Veillonella remained ≤6%, and Enterococcus ≤5%. SCFA profiles reflected minimal lactate accumulation, stable acetate, and some of the highest butyrate concentrations recorded during the study. Correspondingly, HPR reached some of its highest values in R2 and R3, reinforcing the link between butyrate-type fermentation and enhanced H2 production, whereas R1 maintained moderate HPR, probably due to the combined effect of the acidification event and the transient alkaline shock that unfortunately occurred in this reactor.
Finally, stage VI was characterized by a balanced and relatively stable community structure. Bacteroides persisted at 20–7%, coexisting with substantial Eubacterium (~27% in R1) and Clostridium (~19% in R3). Lactobacillus increased to ~15%, while Veillonella and Enterococcus remained ≤7% and ≤6%, respectively. This composition corresponded to low lactate levels, reduced acetate, and stable butyrate, reflecting an equilibrium between lactate producers (Lactobacillus, Enterococcus) and consumers (Bacteroides, Clostridium). HPR was moderate and uniform across reactors, suggesting that the metabolic network had stabilized.
A PCA was performed with the aim of integrating process performance, metabolite profiles, and microbial community dynamics to better understand the reproducibility patterns observed in this study (Figure 8). On one hand, PC1 (30.3% of the variance) grouped HPR and HY with Clostridium and butyrate, indicating that reproducible H2 production was mainly sustained by butyrate-type fermentation coupled with lactate consumption. In contrast, Bacteroides was located on the opposite side of PC1; however, its exact role remains less clear. Although Bacteroides has been linked to lactate conversion and H2 production, in this study its relationship with process performance appeared inconsistent. It is important to emphasize that the 16S rRNA amplicon sequencing applied here is based on DNA, providing information on community structure but not on the actual metabolic activity of the detected taxa. Consequently, associations between relative abundances of dominant populations and process performance should be interpreted with caution, and further functional analyses (e.g., shotgun metagenomics and metatranscriptomics) are required to elucidate the potential and active metabolic pathways underlying DF process reproducibility. On the other hand, PC2 (24.1% of the variance) highlighted the strong association between Lactobacillus and lactate accumulation, further linking LAB-dominated pathways with reduced H2 performance. Altogether, these findings reinforce the role of lactate as a crucial cross-feeding metabolite.

4. Conclusions

A parallel continuous DF approach utilizing FVW as a substrate was conducted under controlled operational conditions, resulting in an average HPR of 3.2 NL H2/L-d. While the reproducibility of results across reactors was not absolute, trends in HPR, HY, H2 content in the off-gas, SCFA profiles, and microbial community composition were generally consistent. However, significant inter-reactor deviations were observed at various stages. Microbial analyses revealed that Bacteroides, Lactobacillus, Veillonella, Enterococcus, Eubacterium, and Clostridium constituted a stable taxonomic core, collectively representing ≥80% of the total relative abundance across all operational stages. Despite this stability, their relative proportions shifted markedly over time and among different reactors. Unforeseen operational disturbances (including feed line clogs, pH control failures, and mixing interruptions) significantly impacted process behavior. These disturbances were temporally linked to changes in community structure and metabolite distribution, suggesting that certain genera may opportunistically thrive under stress conditions. Such shifts likely influenced SCFA patterns and HPR performance. Although the lactate-driven DF pathway emerged as the predominant metabolic route, maintaining a functional balance between LAB and LU-HPB proved highly sensitive to operational stability. Bioaugmentation temporarily altered community composition and enhanced H2 production efficiency; however, this positive effect lasted only a few days, highlighting the need for improved bioaugmentation strategies that can provide sustained, long-term benefits. The partial reproducibility observed across parallel reactors indicates that while DF systems can demonstrate predictable trends, their stability and performance remain susceptible to operational disturbances and microbiome shifts. Overall, these findings suggest that DF processes can be resilient and broadly reproducible; however, achieving high efficiency and stability in real-world applications will necessitate refined control strategies, robust contingency protocols, and a deeper mechanistic understanding of how stress events affect both microbial function and H2 production outcomes.

Author Contributions

Conceptualization, O.G.-D. and R.M.; methodology, O.G.-D. and L.J.M.-M.; software, L.J.M.-M.; validation, O.G.-D. and R.M.; formal analysis, O.G.-D. and L.J.M.-M.; investigation, L.J.M.-M.; resources, O.G.-D. and R.M.; data curation, O.G.-D. and L.J.M.-M.; writing—original draft preparation, L.J.M.-M.; writing—review and editing, O.G.-D. and R.M.; visualization, L.J.M.-M.; supervision, O.G.-D. and R.M.; project administration, O.G.-D. and R.M.; funding acquisition, O.G.-D. and R.M. All authors have read and agreed to the published version of the manuscript.

Funding

This research was funded by the research contract RYC2021-034559-I funded by MCIN/AEI/10.13039/501100011033 and by European Union NextGenerationEU/PRTR; and by the Grant PID2022-139110OA-I00, financed by MCIN/AEI/10.13039/501100011033 and by ERDF “A way of making Europe” and the European Union. Additional financial support was provided by the Department of Education of the Regional Government of Castilla y León and co-financed by the European Union through the European Regional Development Fund (ERDF) (References: CLU-2025-2-06, UIC 393).

Institutional Review Board Statement

Not applicable.

Informed Consent Statement

Not applicable.

Data Availability Statement

The original contributions presented in this study are included in the article. Further inquiries can be directed to the corresponding author.

Acknowledgments

Leonardo J. Martínez-Mendoza is gratefully acknowledged for his predoctoral contract through the UVa 2021 call, co-funded by Banco Santander; Spain. The authors would like to express their sincere gratitude for the invaluable technical support provided by Beatriz Estíbaliz Muñoz-González, Araceli Crespo-Rodríguez, Enrique José Marcos-Montero, and Daniel Fernández-Planillo. During the preparation of this manuscript, the authors used ChatGPT-4.0 (OpenAI, San Francisco, CA, USA) for the purposes of enhancing the English language quality, with a focus on improving grammar, clarity, and readability. The authors have reviewed and edited the output and take full responsibility for the content of this publication.

Conflicts of Interest

The authors declare no conflicts of interest.

References

  1. Food Waste. Available online: https://food.ec.europa.eu/food-safety/food-waste_en (accessed on 12 August 2025).
  2. Food Waste and Food Waste Prevention—Estimates. Available online: https://ec.europa.eu/eurostat/statistics-explained/index.php?title=Food_waste_and_food_waste_prevention_-_estimates (accessed on 12 August 2025).
  3. FAO. The State of Food and Agriculture 2023—Revealing the True Cost of Food to Transform Agrifood Systems; FAO: Rome, Italy, 2023. [Google Scholar]
  4. Moonsamy, T.A.; Rajauria, G.; Priyadarshini, A.; Jansen, M.A.K. Food waste: Analysis of the complex and variable composition of a promising feedstock for valorisation. Food Bioprod. Process. 2024, 148, 31–42. [Google Scholar] [CrossRef]
  5. Adamu, H.; Bello, U.; Yuguda, A.U.; Tafida, U.I.; Jalam, A.M.; Sabo, A.; Qamar, M. Production processes, techno-economic and policy challenges of bioenergy production from fruit and vegetable wastes. Renew. Sustain. Energy Rev. 2023, 186, 113686. [Google Scholar] [CrossRef]
  6. Taheri, S.; Hosseini, S.S. Waste not, want not: Comprehensive valorization of fruit and vegetable waste from single-product recovery to zero-waste strategies. Clean. Waste Syst. 2025, 11, 100300. [Google Scholar] [CrossRef]
  7. Zhu, Y.; Luan, Y.; Zhao, Y.; Liu, J.; Duan, Z.; Ruan, R. Current technologies and uses for fruit and vegetable wastes in a sustainable system: A review. Foods 2023, 12, 1949. [Google Scholar] [CrossRef]
  8. García-Depraect, O.; Vargas-Estrada, L.; Muñoz, R.; Castro-Muñoz, R. Membrane-assisted dark fermentation for integrated biohydrogen production and purification: A comprehensive review. Fermentation 2025, 11, 19. [Google Scholar] [CrossRef]
  9. Ghimire, A.; Frunzo, L.; Pirozzi, F.; Trably, E.; Escudie, R.; Lens, P.N.L.; Esposito, G. A review on dark fermentative biohydrogen production from organic biomass: Process parameters and use of by-products. Appl. Energy 2015, 144, 73–95. [Google Scholar] [CrossRef]
  10. Nascimento, T.R.; Cavalcante, W.A.; de Oliveira, G.H.D.; Zaiat, M.; Ribeiro, R. Modeling dark fermentation of cheese whey for H2 and n-butyrate production considering the chain elongation perspective. Bioresour. Technol. Rep. 2022, 17, 100940. [Google Scholar] [CrossRef]
  11. Bertasini, D.; Battista, F.; Mancini, R.; Frison, N.; Bolzonella, D. Hydrogen and methane production through two stage anaerobic digestion of straw residues. Environ. Res. 2024, 247, 118101. [Google Scholar] [CrossRef] [PubMed]
  12. Kora, E.; Patrinou, V.; Antonopoulou, G.; Ntaikou, I.; Tekerlekopoulou, A.G.; Lyberatos, G. Dark fermentation of expired fruit juices for biohydrogen production followed by treatment and biotechnological exploitation of effluents towards bioplastics and microbial lipids. Biochem. Eng. J. 2023, 195, 108901. [Google Scholar] [CrossRef]
  13. Chi, Z.; Zheng, Y.; Ma, J.; Chen, S. Oleaginous yeast Cryptococcus curvatus culture with dark fermentation hydrogen production effluent as feedstock for microbial lipid production. Int. J. Hydrogen Energy 2011, 36, 9542–9550. [Google Scholar] [CrossRef]
  14. Bettencourt, S.; Miranda, C.; Pozdniakova, T.A.; Sampaio, P.; Franco-Duarte, R.; Pais, C. Single cell oil production by oleaginous yeasts grown in synthetic and waste-derived volatile fatty acids. Microorganisms 2020, 8, 1809. [Google Scholar] [CrossRef]
  15. Zhao, W.; Zhang, J.; Hou, P.; Zhang, G.; Long, Z. Valorisation of food waste through self-fermentation and photosynthetic bacterial protein production: Efficiency, microbial dynamics and safety assessment. Bioresour. Technol. 2025, 436, 132982. [Google Scholar] [CrossRef] [PubMed]
  16. Lacroux, J.; Llamas, M.; Dauptain, K.; Avila, R.; Steyer, J.-P.; van Lis, R.; Trably, E. Dark fermentation and microalgae cultivation coupled systems: Outlook and challenges. Sci. Total Environ. 2023, 865, 161136. [Google Scholar] [CrossRef]
  17. Castello, E.; Ferraz-Junior, A.D.N.; Andreani, C.; Anzola-Rojas, M.P.; Borzacconi, L.; Buitron, G.; Carrillo-Reyes, J.; Gomes, S.D.; Maintinguer, S.I.; Moreno-Andrade, I.; et al. Stability problems in the hydrogen production by dark fermentation: Possible causes and solutions. Renew. Sustain. Energy Rev. 2020, 119, 109602. [Google Scholar] [CrossRef]
  18. Martínez-Mendoza, L.J.; Lebrero, R.; Muñoz, R.; García-Depraect, O. Influence of key operational parameters on biohydrogen production from fruit and vegetable waste via lactate-driven dark fermentation. Bioresour. Technol. 2022, 364, 128070. [Google Scholar] [CrossRef]
  19. Martínez-Mendoza, L.J.; García-Depraect, O.; Muñoz, R. Unlocking the high-rate continuous performance of fermentative hydrogen bioproduction from fruit and vegetable residues by modulating hydraulic retention time. Bioresour. Technol. 2023, 373, 128716. [Google Scholar] [CrossRef]
  20. Rodríguez-Valderrama, S.; Escamilla-Alvarado, C.; Magnin, J.-P.; Rivas-García, P.; Valdez-Vazquez, I.; Ríos-Leal, E. Batch biohydrogen production from dilute acid hydrolyzates of fruits-and-vegetables wastes and corn stover as co-substrates. Biomass Bioenergy 2020, 140, 105666. [Google Scholar] [CrossRef]
  21. Scotto di Perta, E.; Cesaro, A.; Pindozzi, S.; Frunzo, L.; Esposito, G.; Papirio, S. Assessment of hydrogen and volatile fatty acid production from fruit and vegetable waste: A case study of Mediterranean markets. Energies 2022, 15, 5032. [Google Scholar] [CrossRef]
  22. Rodríguez-Valderrama, S.; Escamilla-Alvarado, C.; Rivas-García, P.; Magnin, J.-P.; Alcalá-Rodríguez, M.; García-Reyes, R.B. Biorefinery concept comprising acid hydrolysis, dark fermentation, and anaerobic digestion for co-processing of fruit and vegetable wastes and corn stover. Environ. Sci. Pollut. Res. 2020, 27, 28585–28596. [Google Scholar] [CrossRef]
  23. Andolfi, A.; Bianco, F.; Sannino, M.; Faugno, S.; Race, M. Dark-fermentative biohydrogen production from vegetable residue using wine lees as novel inoculum. Bioresour. Technol. 2025, 429, 132495. [Google Scholar] [CrossRef] [PubMed]
  24. García-Depraect, O.; Castro-Muñoz, R.; Muñoz, R.; Rene, E.R.; León-Becerril, E.; Valdez-Vazquez, I.; Kumar, G.; Reyes-Alvarado, L.C.; Martínez-Mendoza, L.J.; Carrillo-Reyes, J.; et al. A review on the factors influencing biohydrogen production from lactate: The key to unlocking enhanced dark fermentative processes. Bioresour. Technol. 2021, 324, 124595. [Google Scholar] [CrossRef]
  25. Chezeau, B.; Fontaine, J.P.; Vial, C. Analysis of liquid-to-gas mass transfer, mixing and hydrogen production in dark fermentation process. Chem. Eng. J. 2019, 372, 715–727. [Google Scholar] [CrossRef]
  26. Palomo-Briones, R.; Celis, L.B.; Méndez-Acosta, H.O.; Bernet, N.; Trably, E.; Razo-Flores, E. Enhancement of mass transfer conditions to increase the productivity and efficiency of dark fermentation in continuous reactors. Fuel 2019, 254, 115648. [Google Scholar] [CrossRef]
  27. García-Depraect, O.; Diaz-Cruces, V.F.; Rene, E.R.; León-Becerril, E. Changes in performance and bacterial communities in a continuous biohydrogen-producing reactor subjected to substrate- and pH-induced perturbations. Bioresour. Technol. 2020, 295, 122182. [Google Scholar] [CrossRef]
  28. Mlinar, S.; Weig, A.R.; Freitag, R. Influence of mixing and sludge volume on stability, reproducibility, and productivity of laboratory-scale anaerobic digestion. Bioresour. Technol. Rep. 2020, 11, 100444. [Google Scholar] [CrossRef]
  29. Hafner, S.D.; Fruteau de Laclos, H.; Koch, K.; Holliger, C. Improving inter-laboratory reproducibility in measurement of biochemical methane potential (BMP). Water 2020, 12, 1752. [Google Scholar] [CrossRef]
  30. Lin, Q.; Li, L.; De Vrieze, J.; Li, C.; Fang, X.; Li, X. Functional conservation of microbial communities determines composition predictability in anaerobic digestion. ISME J. 2023, 17, 1920–1930. [Google Scholar] [CrossRef]
  31. Marín, D.; Méndez, L.; Suero, I.; Díaz, I.; Blanco, S.; Fdz-Polanco, M.; Muñoz, R. Anaerobic digestion of food waste coupled with biogas upgrading in an outdoors algal-bacterial photobioreactor at pilot scale. Fuel 2022, 324, 124554. [Google Scholar] [CrossRef]
  32. Regueira-Marcos, L.; García-Depraect, O.; Muñoz, R. Continuous two-stage lactate-driven dark fermentation process for enhanced biohydrogen production from food waste. J. Water Process Eng. 2024, 67, 106116. [Google Scholar] [CrossRef]
  33. Regueira-Marcos, L.; Muñoz, R.; García-Depraect, O. Continuous lactate-driven dark fermentation of restaurant food waste: Process characterization and new insights on transient feast/famine perturbations. Bioresour. Technol. 2023, 385, 129385. [Google Scholar] [CrossRef]
  34. Leroy-Freitas, D.; Muñoz, R.; Martínez-Mendoza, L.J.; Martínez-Fraile, C.; García-Depraect, O. Enhancing biohydrogen production: The role of iron-based nanoparticles in continuous lactate-driven dark fermentation of powdered cheese whey. Fermentation 2024, 10, 296. [Google Scholar] [CrossRef]
  35. Water Environmental Federation. American Public Health Association. Standard Methods for the Examination of Water and Wastewater, 21st ed.; APHA: Washington, DC, USA, 2005. [Google Scholar]
  36. Farveen, M.S.; Muñoz, R.; Narayanan, R.; García-Depraect, O. Batch and semi-batch anaerobic digestion of poly (3-hydroxybutyrate-co-3-hydroxyhexanoate) (PHBH) bioplastic: New kinetic, structural, microbiological and digestate phytotoxicity insights. Sci. Total Environ. 2025, 967, 178794. [Google Scholar] [CrossRef]
  37. Magoč, T.; Salzberg, S.L. FLASH: Fast length adjustment of short reads to improve genome assemblies. Bioinformatics 2011, 27, 2957–2963. [Google Scholar] [CrossRef]
  38. Edgar, R.C.; Haas, B.J.; Clemente, J.C.; Quince, C.; Knight, R. UCHIME improves sensitivity and speed of chimera detection. Bioinformatics 2011, 27, 2194–2200. [Google Scholar] [CrossRef]
  39. Quast, C.; Pruesse, E.; Yilmaz, P.; Gerken, J.; Schweer, T.; Yarza, P.; Peplies, J.; Glöckner, F.O. The SILVA ribosomal RNA gene database project: Improved data processing and web-based tools. Nucleic Acids Res. 2012, 41, D590–D596. [Google Scholar] [CrossRef]
  40. Edgar, R.C. MUSCLE: A multiple sequence alignment method with reduced time and space complexity. BMC Bioinform. 2004, 5, 113. [Google Scholar] [CrossRef]
  41. Roslan, E.; Mohamed, H.; Abu Hassan, S.H.; Carrere, H.; Trably, E. Effect of exogenous inoculation on dark fermentation of food waste priorly stored in lactic acid fermentation. Recycling 2025, 10, 11. [Google Scholar] [CrossRef]
  42. Tian, W.; Khan, E.; Tsang, D.C. Strategy to improve anaerobic fermentation performance of lactate-rich wastewater by combining biochar augmentation and acetate supplementation. Chem. Eng. J. 2025, 506, 159782. [Google Scholar] [CrossRef]
  43. Luo, L.; Lim, R.; Pradhan, N. Lactic acid-based fermentative hydrogen production from kitchen waste: Mechanisms and taxonomic insights. Chem. Eng. J. 2024, 488, 150854. [Google Scholar] [CrossRef]
  44. Martínez-Fraile, C.; Muñoz, R.; Simorte, M.T.; Sanz, I.; García-Depraect, O. Biohydrogen production by lactate-driven dark fermentation of real organic wastes derived from solid waste treatment plants. Bioresour. Technol. 2024, 403, 130846. [Google Scholar] [CrossRef]
  45. Fuess, L.T.; Ferraz Júnior, A.D.N.; Machado, C.B.; Zaiat, M. Temporal dynamics and metabolic correlation between lactate-producing and hydrogen-producing bacteria in sugarcane vinasse dark fermentation: The key role of lactate. Bioresour. Technol. 2018, 247, 426–433. [Google Scholar] [CrossRef]
  46. Sim, Y.-B.; Kim, D.-Y.; Ko, J.; Jung, J.-H.; Kim, S.-H. Bioaugmentation with Clostridium pasteurianum for high-yield continuous bio-hydrogen production in a dynamic membrane bioreactor. Chem. Eng. J. 2024, 497, 154709. [Google Scholar] [CrossRef]
  47. Okonkwo, O.; Escudie, R.; Bernet, N.; Mangayil, R.; Lakaniemi, A.-M.; Trably, E. Bioaugmentation enhances dark fermentative hydrogen production in cultures exposed to short-term temperature fluctuations. Appl. Microbiol. Biotechnol. 2020, 104, 439–449. [Google Scholar] [CrossRef]
  48. Kumar, G.; Bakonyi, P.; Kobayashi, T.; Xu, K.-Q.; Sivagurunathan, P.; Kim, S.-H.; Buitrón, G.; Nemestóthy, N.; Bélafi-Bakó, K. Enhancement of biofuel production via microbial augmentation: The case of dark fermentative hydrogen. Renew. Sustain. Energy Rev. 2016, 57, 879–891. [Google Scholar] [CrossRef]
  49. Detman, A.; Laubitz, D.; Chojnacka, A.; Kiela, P.R.; Salamon, A.; Barberán, A.; Chen, Y.; Yang, F.; Błaszczyk, M.K.; Sikora, A. Dynamics of dark fermentation microbial communities in the light of lactate and butyrate production. Microbiome 2021, 9, 158. [Google Scholar] [CrossRef]
  50. Etchebehere, C.; Castelló, E.; Wenzel, J.; Anzola-Rojas, M.P.; Borzacconi, L.; Buitrón, G.; Cabrol, L.; Carminato, V.M.; Carrillo-Reyes, J.; Cisneros-Pérez, C.; et al. Microbial communities from 20 different hydrogen-producing reactors studied by 454 pyrosequencing. Appl. Microbiol. Biotechnol. 2016, 100, 3371–3384. [Google Scholar] [CrossRef]
  51. Regueira-Marcos, L.; Muñoz, R.; García-Depraect, O. Biogenic hydrogen production from household food waste via lactate-driven dark fermentation: A comparative study of single-stage and two-stage configurations. J. Environ. Chem. Eng. 2025, 13, 117672. [Google Scholar] [CrossRef]
  52. Sasaki, K.; Sasaki, D.; Tsuge, Y.; Morita, M.; Kondo, A. Changes in the microbial consortium during dark hydrogen fermentation in a bioelectrochemical system increases methane production during a two-stage process. Biotechnol. Biofuels 2018, 11, 173. [Google Scholar] [CrossRef]
  53. Lu, Z.; Kong, L.; Ren, S.; Aschenbach, J.R.; Shen, H. Acid tolerance of lactate-utilizing bacteria of the order Bacteroidales contributes to prevention of ruminal acidosis in goats adapted to a high-concentrate diet. Anim. Nutr. 2023, 14, 130–140. [Google Scholar] [CrossRef] [PubMed]
  54. Mutuyemungu, E.; Singh, M.; Liu, S.; Rose, D.J. Intestinal gas production by the gut microbiota: A review. J. Funct. Foods 2023, 100, 105367. [Google Scholar] [CrossRef]
  55. Valdez-Vazquez, I.; Pérez-Rangel, M.; Tapia, A.; Buitrón, G.; Molina, C.; Hernández, G.; Amaya-Delgado, L. Hydrogen and butanol production from native wheat straw by synthetic microbial consortia integrated by species of Enterococcus and Clostridium. Fuel 2015, 159, 214–222. [Google Scholar] [CrossRef]
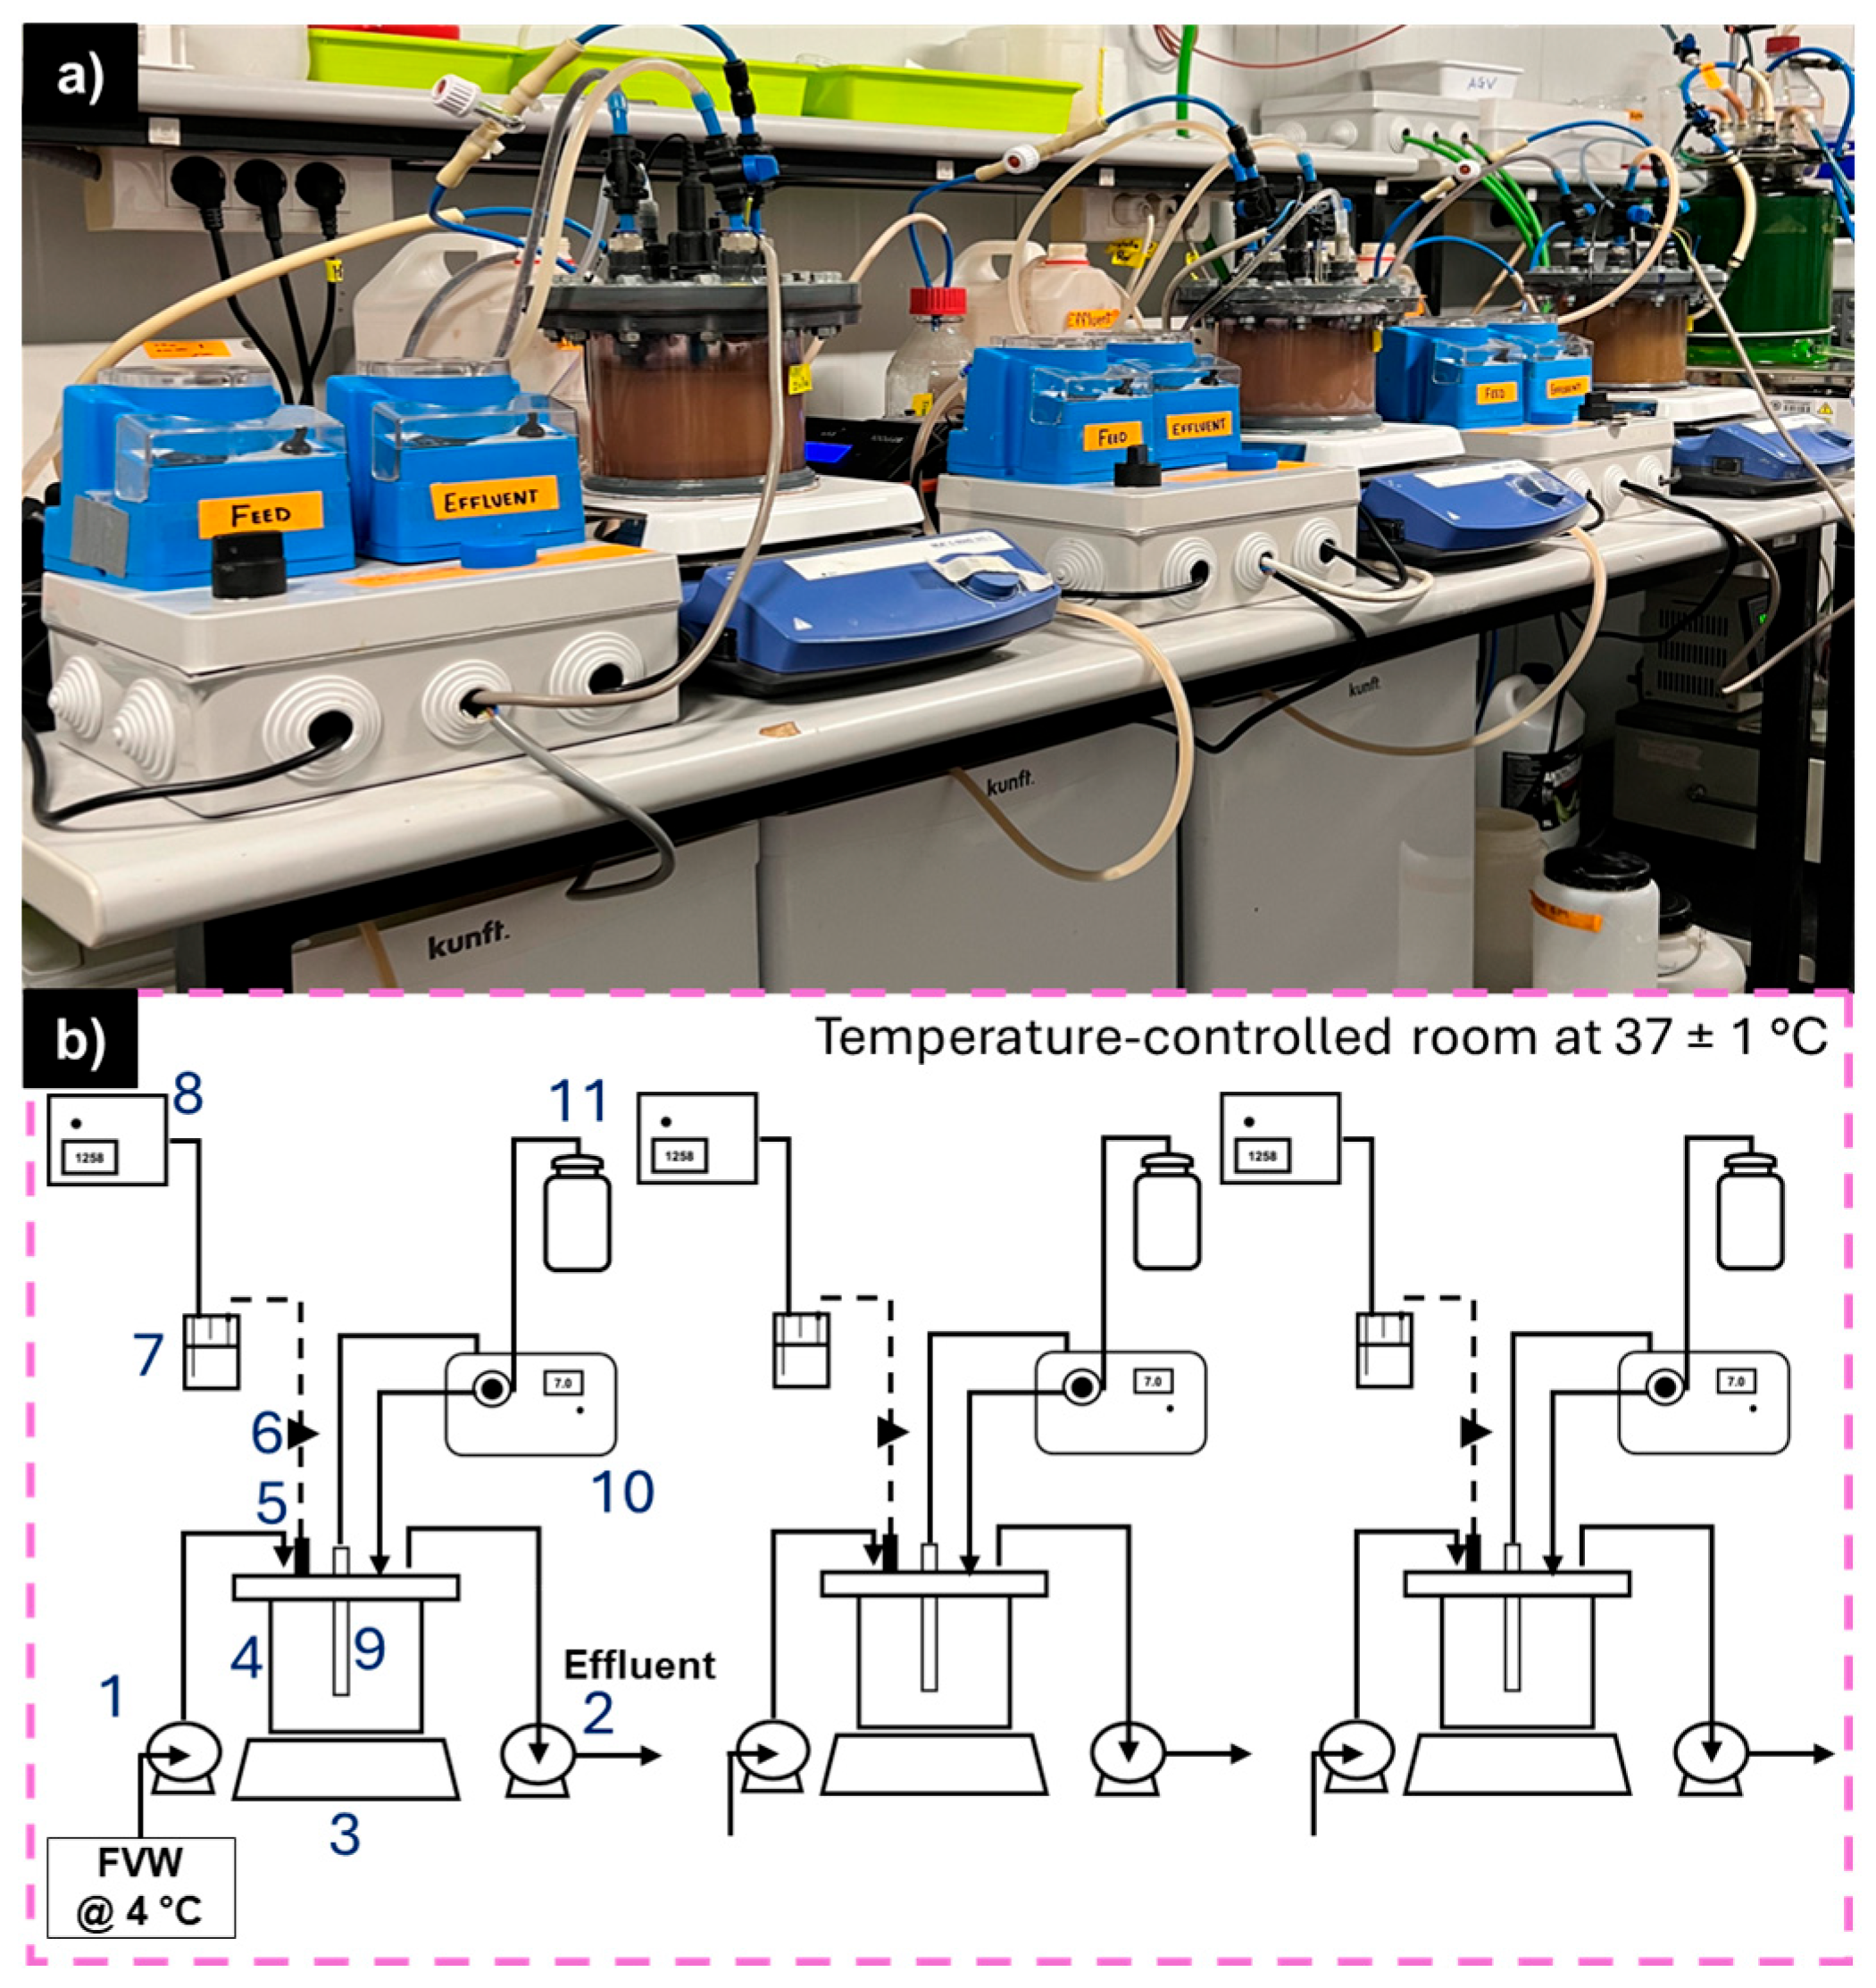
Figure 1. Parallel cultivation system for continuous DF of FVW: (a) photograph of the parallel reactor setup; (b) schematic diagram showing key components, including inlet (1) and outlet (2) peristaltic pumps, magnetic stirrer (3), reactor (4), gas outlet (5), gas sampling port (6), liquid traps for gas counter protection (7), gas counter (8), pH probe (9), pH controller (10), and NaOH solution reservoir (11).
Fermentation 11 00545 g001
Figure 2. Temporal evolution of biogas production rate (BPR) and off-gas composition (H2 and CO2) during the 90-day operation of the parallel triplicate reactor system. Vertical dashed lines indicate the six operational stages (I–VI) in which the operational period was divided. Symbols denote mean values across the three reactors, and shaded areas represent ± standard deviation.
Fermentation 11 00545 g002
Figure 3. H2 production performance in the parallel continuous DF system: (a) volumetric H2 production rate (HPR); (b) H2 yield (HY). Symbols denote mean values across the three reactors, and shaded areas represent ± standard deviation. Vertical dashed lines denote transitions between operational stages I–VI.
Fermentation 11 00545 g003
Figure 4. Profiles of short-chain fatty acids measured in the parallel continuous DF system: (a) lactate, (b) formate, (c) acetate, (d) propionate, and (e) butyrate. Symbols denote mean values across the three reactors, and shaded areas represent ± standard deviation. Vertical dashed lines denote transitions between operational stages I–VI.
Fermentation 11 00545 g004
Figure 5. Microbial community structure at the family level. (a) R1, (b) R2, and (c) R3. Vertical dotted lines indicate the transitions between operational stages I to VI.
Fermentation 11 00545 g005
Figure 6. Taxonomic composition of the autochthonous microbiota, inoculum, and bioaugmentation cultures at the family (a) and genus (b) levels. AM: autochthonous microbiota of the substrate; MC-1: mixed culture used as inoculum; MC-2 and MC-3: mixed cultures used for bioaugmentation in operational stages III and IV, respectively.
Fermentation 11 00545 g006
Figure 7. Microbial community structure at the genus level. (a) R1, (b) R2, and (c) R3. Vertical dotted lines indicate the transitions between operational stages I to VI.
Fermentation 11 00545 g007
Figure 8. Principal Component Analysis (PCA) integrating process performance indicators, metabolite profiles, and dominant microbial genera throughout the operation. Blue squares represent the operational time points, while arrows indicate the contribution of each variable to the principal components.
Fermentation 11 00545 g008
Table 1. Summary of operational conditions and experimental phases applied in the parallel continuous dark fermentation system.
Operational Stage
IIIIIIIVVVI
Time (days)0–25.825.8–61.061.0–65.065.0–73.073.0–83.083.0–90.0
Number of cycles (HRTs)17.4/25.627.0–67.810.721.326.718.7
pH76.56.56.56.56.5
HRT (h)18/1299999
TS concentration (%)55/3 a3333
OLR (g VS/L-d)62.4/93.6124.8/74.474.474.474.474.4
BioaugmentationNoNoYesYesNoNo
Nutrient supplementationNoNoNoYesYesNo
Note: HRT: hydraulic retention time; OLR: organic loading rate; TS: total solids; VS: volatile solids. a TS concentration was changed from 5 to 3% on day 36. External addition of PCW was conducted from day 65 to day 77.
Table 2. Summary of average concentrations and standard deviations of process performance indicators in the parallel cultivation system across operational stages I–VI.
ParameterReactorStage
IIIIIIIVVVI
BPR (NL/L-d)11.7 ± 1.4
1.1 ± 0.6 A (60.8/54.5)
3.4 ± 1.9 A (55.9)7.8 ± 4.3 A (55.1)7.1 ± 3.2 A (45.1)8.9 ± 6.5 A (73.0)3.6 ± 1.7 A (47.2)
27.1 ± 4.2
9.4 ± 4.1 B (59.1/43.6)
7.2 ± 6.7 B (93.0)6.1 ± 2.6 A (42.6)5.6 ± 4.4 A (78.6)11.2 ± 6.2 A (55.3)5.5 ± 3.1 B (56.3)
32.3 ± 1.3
3.3 ± 3.4 A (56.5/1)
2.8 ± 3.3 A (117.8)4.8 ± 3.3 A (68.7)7.4 ± 6.2 A (83.7)10.6 ± 6.2 A (58.5)4.9 ± 1.7 B (34.6)
H2 content (% v/v)160.5 ± 2.8
62.7 ± 1.5 A (4.6/2.4)
59.4 ± 5.5 A (9.2)65.3 ± 0.8 A (1.2)65.6 ± 0.5 A (0.8)66.1 ± 0.7 A (1.1)66.3 ± 0.1 A (0.2)
259.6 ± 4.8
63.3 ± 1.2 A (8.0/1.9)
60.7 ± 6.8 A (11.2)64.9 ± 1.9 A (2.9)66.0 ± 0.4 A (0.6)66.3 ± 0.1 A (0.2)66.3 ± 0.1 A (0.2)
355.7 ± 15.9
60.1 ± 8.1 B (28.5/13.4)
51.6 ± 12.2 B (23.6)64.8 ± 0.8 A (1.2)64.5 ± 0.3 A (0.5)66.1 ± 0.3 A (0.5)66.3 ± 0.1 A (0.2)
HPR (NLH2/L-d)11.0 ± 0.6
1.0 ± 0.3 A (60/30)
1.8 ± 0.9 A (50)5.7 ± 2.9 A (50.1)4.4 ± 1.8 A (40.9)6.0 ± 3.2 A (53.3)2.5 ± 1.1 A (44)
24.5 ± 2.4
4.2 ± 1.3 B (53.3/30.9)
3.6 ± 1.9 B (52.7)3.9 ± 1.8 B (46.1)4.5 ± 2.0 A (44.4)7.4 ± 3.5 A (47.2)3.6 ± 2.0 A (55.5)
31.2 ± 0.8
1.9 ± 1.9 A (66.6/100)
1.3 ± 0.9 A (69.2)3.3 ± 2.0 B (60.6)5.1 ± 4.1 A (80.3)6.7 ± 4.1 A (61.2)3.3 ± 1.2 A (36.3)
HY
(NmL H2/g VS added)
119.9 ± 4.7
12.6 ± 5.3 A (23.6/42.1)
24.0 ± 13.7 A (57.1)71.2 ± 39.5 A (55.466.4 ± 26.9 A (40.5)77.1 ± 41.1 A (53.3)34.9 ± 16.1 A (46.1)
2113.5 ± 88.1
76.6 ± 30.6 B (77.6/39.9)
42.8 ± 24.2 B (56.5)55.7 ± 24.1 A (43.2)62.0 ± 31.0 A (50)101.7 ± 44.3 A (43.5)52.6 ± 26.5 B (50.3)
333.1 ± 9.1
22.3 ± 11.1 A (27.4/49.7)
15.4 ± 11.6 A (75.3)43.5 ± 30.4 A (69.8)71.2 ± 57.5 A (80.7)95.2 ± 51.9 A (54.5)47.2 ± 17.1 B (36.2)
Carbohydrates removal (%)184.2 ± 3.0
85.0 ± 0.8 A (3.6/0.9)
85.1 ± 1.3 A (1.5)86.7 ± 0.4 A (0.5)87.8 ± 0.8 A (0.9)92.5 ± 1.9 A (2.0)94.8 ± 0.6 A (0.6)
282.6 ± 2.2
83.8 ± 1.4 A (2.7/1.7)
86.4 ± 1.7 A (1.9)89.6 ± 0.6 A (0.7)89.2 ± 1.0 A (1.1)92.4 ± 1.6 A (1.7)95.4 ± 1.8 A (1.9)
384.5 ± 3.2
84.5 ± 1.7 A (3.8/2.0)
85.8 ± 2.3 A (2.6)87.7 ± 1.4 A (1.6)89.4 ± 1.4 A (1.6)91.7 ± 1.2 A (1.3)95.6 ± 1.3 A (1.4)
Data are presented as mean ± standard deviation, with values in parentheses indicating the relative standard deviation (RSD, %). For each process performance parameter, different superscript letters within the same operational stage indicate statistically significant differences between reactors (p < 0.05), while identical letters denote no significant difference. For instance, in Stage II, HPR values in reactors R1 and R3 did not differ significantly, whereas R2 was significantly higher (p < 0.05).
Table 3. Summary of average concentrations and standard deviations of short-chain organic acids in the parallel cultivation system across operational stages I–VI.
StageReactorLactate
(g/L)
Formate
(g/L)
Acetate
(g/L)
Propionate
(g/L)
Butyrate
(g/L)
I115.5 ± 7.6 A (49.0)2.9 ± 0.6 A (20.7)5.0 ± 1.0 A (20.0)4.1 ± 1.9 A (46.3)1.9 ± 0.7 A (36.8)
29.4 ± 5.8 A (61.7)3.1 ± 0.8 A (25.8)5.9 ± 1.3 A (22.0)1.2 ± 0.5 B (41.7)3.5 ± 1.0 B (28.6)
316.5 ± 5.2 A (31.5)1.8 ± 0.6 A (33.3)6.6 ± 1.3 A (19.7)3.5 ± 1.4 B (40.0)2.2 ± 1.2 B (54.5)
II111.1 ± 8.0 A (72.1)1.2 ± 0.3 AB (25.0)5.3 ± 1.5 A (28.3)2.4 ± 1.7 A (70.8)2.3 ± 1.4 A (60.9)
25.8 ± 6.1 B (105.2)1.3 ± 0.7 A (53.8)5.3 ± 1.6 A (30.2)2.8 ± 0.9 A (32.1)2.6 ± 0.9 B (34.6)
35.4 ± 3.5 B (64.8)0.7 ± 0.7 B (100)6.8 ± 1.1 B (16.2)2.1 ± 0.8 A (38.1)2.9 ± 1.8 AB (62.1)
III11.7 ± 0.9 A (52.9)2.0 ± 0.3 A (15)5.2 ± 2.2 A (42.3)5.2 ± 1.5 A (28.9)3.5 ± 0.6 B (17.1)
20.8 ± 0.5 A (62.5)0.0 ± 0.0 B (0)3.2 ± 0.2 A (6.3)1.9 ± 0.2 B (10.5)1.0 ± 0.2 B (20.0)
34.0 ± 5.2 A (130)1.0 ± 0.5 C (50)4.7 ± 0.6 A (12.8)3.2 ± 0.8 AB (25.0)2.1 ± 1.5 B (71.4)
IV119.0 ± 5.2 A (27.4)1.1 ± 0.1 A (9.1)10.3 + 1.8 A (17.5)3.0 ± 0.4 A (13.3)3.1 ± 1.2 AB (38.7)
221.3 ± 5.3 A (24.9)1.1 ± 0.3 A (27.3)11.4 ± 2.3 A (20.2)3.0 ± 1.1 A (36.7)2.3 ± 0.5 A (21.7)
317.7 ± 5.0 A (28.2)1.1 ± 0.2 A (18.2)9.0 ± 2.7 A (30.0)2.9 ± 0.3 A (20.7)5.0 ± 2.2 B (44.0)
V10.3 ± 0.0 A (0)0.2 ± 0.2 A (100)4.5 ± 2.0 A (44.4)2.5 ± 1.2 A (48.0)4.0 ± 0.5 A (12.5)
20.5 ± 0.4 A (80)0.2 ± 0.2 A (100)5.9 ± 2.2 A (37.3)2.3 ± 0.5 A (21.7)4.9 ± 1.9 A (38.8)
30.3 ± 0.1 A (33.3)0.9 ± 1.5 A (166.7)4.3 ± 2.0 A (46.5)2.1 ± 1.2 A (57.1)3.2 ± 1.7 A (53.1)
VI11.9 ± 2.2 A (115.8)0.9 ± 0.8 A (88.9)2.9 ± 0.9 A (31.0)1.1 ± 0.2 A (18.2)2.9 ± 0.6 A (20.6)
21.2 ± 1.2 A (100)0.6 ± 0.6 A (100)3.2 ± 0.9 A (28.1)1.4 ± 0.1 A (9.1)3.6 ± 0.7 A (19.4)
31.7 ± 1.2 A (70.6)0.8 ± 1.1 A (137.5)3.5 ± 0.7 A (20.0)1.9 ± 0.4 B (21.1)2.8 ± 0.4 A (14.3)
Data are presented as mean ± standard deviation, with values in parentheses indicating the relative standard deviation (RSD, %). For each process performance parameter, different superscript letters within the same operational stage indicate statistically significant differences between reactors (p < 0.05), while identical letters denote no significant difference.
Disclaimer/Publisher’s Note: The statements, opinions and data contained in all publications are solely those of the individual author(s) and contributor(s) and not of MDPI and/or the editor(s). MDPI and/or the editor(s) disclaim responsibility for any injury to people or property resulting from any ideas, methods, instructions or products referred to in the content.