Article

Use of Lachancea thermotolerans and Metschnikowia pulcherrima to Improve Acidity and Sensory Profile of Verdejo Wines from Different Vine Management Systems

1
Department of Chemistry and Food Technology, Escuela Técnica Superior de Ingeniería Agronómica, Alimentaria y de Biosistemas, Universidad Politécnica de Madrid, 28040 Madrid, Spain
2
Department of Biotechnology and Plant Biology, Escuela Técnica Superior de Ingeniería Agronómica, Alimentaria y de Biosistemas, Universidad Politécnica de Madrid, 28040 Madrid, Spain
*
Author to whom correspondence should be addressed.
Fermentation 2025, 11(9), 541; https://doi.org/10.3390/fermentation11090541
Submission received: 28 July 2025 / Revised: 7 September 2025 / Accepted: 15 September 2025 / Published: 18 September 2025
(This article belongs to the Section Fermentation for Food and Beverages)

Abstract

A proper understanding of viticultural and oenological strategies is essential to adapt to climate change and consumer demands. The objective of this study was to evaluate the impact of different viticultural treatments and yeast strains on the chemical composition and sensory perception of wine. Two Verdejo musts, a control must (Must O) and one obtained with innovative viticultural strategies (Must E), were fermented with Saccharomyces cerevisiae, Lachancea thermotolerans, and a co-incubation of Lachancea thermotolerans with Metschnikowia pulcherrima. Fermentations with L. thermotolerans increased lactic acid content, reducing pH (a decrease of 0.2 points compared to controls) and having a positive impact on the perception of freshness. Wines fermented from Must E showed better colour parameters and a higher production of fermentative volatile compounds, but higher ethanol content and lower acidity. In contrast, wines fermented from Must O exhibited a more balanced aromatic profile, with fewer carbonyl compounds and higher alcohols (a 30% reduction in carbonyl compounds in wines fermented with non-Saccharomyces), which made them more harmonious in the sensory evaluations. The results highlight the importance of a good selection of viticultural and oenological strategies to achieve a desirable sensory profile under changing climatic conditions, highlighting the positive impact of non-Saccharomyces yeasts in improving acidity and aromatic profile.

1. Introduction

In recent years, due to global warming, wineries in warm areas have encountered musts with a higher sugar profile, higher pH and lower malic acid concentration. These characteristics pose a risk to the stability of wine. They also decrease the perception of freshness, producing flat wines with low acidity and little fruity and floral aromas [1]. A very high sugar content can lead to stability problems by favouring the proliferation of spoilage or undesirable microorganisms such as Botrytis cinerea [2]. High sugar content also results in a very alcoholic wine, which reduces the perception of freshness and hinders the selection of fermenting yeasts [1].
Similarly, high pH poses a risk for the proliferation of spoilage microorganisms and moulds such as Candida tropicalis, Candida albicans, Brettanomyces/Dekkera, Hanseniaspora or various species of Pichia [3]. Moreover, the increase in pH, together with the low concentration of malic acid, reduces the sensation of acidity and freshness, resulting in a less desirable profile for white wine consumers [4].
The use of non-Saccharomyces yeasts has been a useful strategy in improving the stability and sensory profile of wines, even correcting must defects [5,6]. In the present study, to evaluate the effectiveness of non-Saccharomyces yeasts in Verdejo must fermentations, a strain of Lachancea thermotolerans (Lt) and a strain of Metschnikowia pulcherrima (Mp) were selected.
Lt yeast has an ellipsoidal structure, which can be found in single-cell structures in liquid media or in small groups [7]. It has a medium fermentative capacity, reaching up to 9 g/L ethanol, and a requirement of 200 mg/L of assimilable nitrogen sources to avoid sluggish fermentations [8]. Its oenological interest lies in its acidifying capacity, which is due to the production of lactic acid from sugars [9]. This production of lactic acid can reduce the pH by up to 0.5 units [10,11], thus contributing to the microbiological stabilisation of the wine. In this way, the solubility of SO2 is increased, protecting the wine from spoilage yeasts and reducing the amount of sulphites used as antimicrobial agents in winemaking. Moreover, the formation of lactic acid results from sugar metabolism, leading to a slight reduction in the alcoholic degree by approximately 0.2–0.9% v/v [10,12,13]. Several strains have been characterised under oenological conditions by their ability to ferment at different temperatures and tolerate sulphites [14]. The selected strain Lt 3.1. (recently commercialised by Lallemand Inc. (Montreal, Canada) as BLIZZ™) has been reported to produce up to 15 g/L of lactic acid under oenological conditions [15]. Concerning aroma, some strains can exhibit esterase activity. Wines fermented with strain BLIZZ™ have reported an increase in the concentration of ethyl lactate and ethyl hexanoate and a decrease in phenylethyl acetate, which are responsible for the buttery, green apple and rose aromas, respectively [16,17]. Other effects reported have been the revelation of aromatic thiols [18] such as 3-mercaptohexanol and an enhancement of minerality [19], probably connected with the overproduction of succinic acid (+0.2–0.6 g/L) by some strains of Lt.
Mp is a yeast with a globose/elliptical morphology [20]. It is characterised by a refractive oil droplet that can be observed by light microscopy. It can ferment glucose, sucrose, fructose, galactose and maltose as carbon sources but shows weak development in lactose. It has a low fermentative power, which, in most strains, is around 4 g/L ethanol [9], so Mp must be used in combination with yeasts of high fermentative power [21]. The main oenological interest of Mp is bio-protection and the enhancement of varietal aromas [22,23]. The bioprotective effect of Mp is due to the production of pulcherrimin. This compound precipitates iron (III) and functions as an antifungal in species such as Penicillium spp., Aspergillus spp., and Fusarium spp. [24]. In terms of aroma enhancement, the expression of extracellular beta-glucosidase by Mp promotes the release of varietal aromas by hydrolysing precursors of monoterpenes [25] and thiols [26,27,28]. Additionally, Mp has shown some effects in the reduction in ethanol, ranging between 0.6 and 1.2% v/v in white wines, due to the diversion of sugars towards the respiratory pathway [29,30].
Lt and Mp have already been evaluated in a co-fermentation on Airén grape must [16,19]. The resulting wine had a higher alcohol content, a better aromatic profile with an increase in ethyl esters and a lower volatile acidity. The most relevant aspect was the synergy established between Mp and Lt, which led to increased lactic acid production compared to the wine fermented with Lt despite no differences in pH [16].
This trial aimed to evaluate the suitability of the Lt strain BLIZZ™ and Mp strain M29, in both sequential and co-fermentation, for the production of Verdejo wines from two different types of must (one resulting from conventionally managed vines, and the other derived from vines subjected to leaf removal and nitrogen fertilisation treatments). The study focuses on their acidifying and bioprotective capacities and their potential to enhance the aroma profile.

2. Materials and Methods

2.1. Verdejo White Must

The fermentations were performed with two types of must from the Verdejo grape variety from the José Pariente estate (La Seca, Valladolid, Spain), to which different viticultural strategies were applied, namely Control-0 (Must O) and viticultural strategy E (Must E). The vineyard is located in a Csb climate zone, classified as Mediterranean with oceanic influence, characterised by dry and mild summers. The soil profile in which the two management strategies were implemented represents a first horizon, extending to a depth of 35 cm, with a sandy clay loam texture containing 21% clay and 20% silt. Below this, a second horizon extends to a depth of 90 cm, with a sandy loam texture consisting of 13% sand and 13% silt. Both viticultural treatments received three phytosanitary applications of 5 kg/ha of 80% wettable sulfur and two applications of 0.8 kg/ha of 75% copper (as cuprous oxide). Must O corresponded to vertically trained vines with no leaf removal, minimal irrigation (Kd = 0.25), no additional nitrogen fertilisation (standard fertilisation: 30 kg N/ha applied as pelleted manure), and no photoprotection. In contrast, Must E involved a freer training system (Sprawl), basal leaf removal during the herbaceous stage of berry development, higher irrigation (Kd = 0.50), standard fertilisation and additional nitrogen fertilisation (+20 kg N/ha, applied at pea-size and pre-veraison), and foliar photoprotection with two kaolin applications (at bunch closure and pre-veraison) to increase radiation reflection and reduce leaf and bunch temperature. The grapes were harvested mechanically, and the musts were pressed using a pneumatic press, settled at 4 °C, and racked separately. Must O followed standard winery protocols, with the addition of 40 mg/L potassium metabisulphite; no sulphites were added to Must E to avoid influencing the growth of the non-Saccharomyces yeasts under evaluation. Before inoculation, redox potential and dissolved oxygen were measured in the winery. Both musts were characterised in the laboratory of Food Technology of the School of Agricultural, Food and Biosystems Engineering (ETSIAAB, UPM, Madrid, Spain), including the following analyses: density, Brix degrees, pH, total acidity expressed as tartaric acid and yeast-assimilable nitrogen by FTIR, free and total SO2 by the Rankine method recommended by the International Organisation of Vine and Wine (OIV) [31] and malic acid, by enzymatic analysis. Table 1 presents the results of this characterisation with the physicochemical parameters of Must O and Must E.

2.2. Yeast Strains Used for Fermentation

Three commercial strains supplied by the Lallemand company (Montreal, QC, Canada) were used to ferment the Verdejo must: The Lachancea thermotolerans BLIZZ™ strain (Lt) was tested in pure inoculation in the must. The Metschnikowia pulcherrima M29 strain (Mp) was tested in co-inoculation with L. thermotolerans BLIZZ™. The Saccharomyces cerevisiae QCitrus strain (Enartis, Navarrete, La Rioja, Spain) was used as a control in pure fermentation. All strains were inoculated as active dried yeast after hydration, according to the manufacturer’s instructions.

2.3. Must Fermentation

As mentioned above, three fermentation conditions were evaluated: S. cerevisiae QCitrus in pure fermentation, L. thermotolerans BLIZZ™ in sequential fermentation with Sc and a co-inoculation involving L. thermotolerans BLIZZ™ and M. pulcherrima M29 (Figure 1). All fermentations were performed in duplicate 225 L stainless steel barrels, leaving 10% headspace, which allowed the simulation of the geometry of a barrel without contributing wood-derived volatiles, thereby enhancing the effect of the yeasts. The L. thermotolerans strain can ferment up to 9% ethanol by volume, and the M. pulcherrima strain can ferment up to 4%. Consequently, a re-inoculation with S. cerevisiae QCitrus was performed on the fourth day to ensure complete sugar fermentation and obtain dry wines.
S. cerevisiae and L. thermotolerans strains were inoculated at a concentration of 20 g/hL. In the co-inoculation of L. thermotolerans and M. pulcherrima, 10 g/hL of each strain was used. All strains were rehydrated to ten times their weight in a 10% volume must solution at 20 °C. They were left to hydrate for two hours before inoculating the must.
Fermentations were performed in a room at the José Pariente Winery, La Seca, Valladolid, Spain, at 18 °C. Daily samples were taken from the barrels to analyse general oenological parameters and determine the concentration of lactic acid. At the end of fermentation, colour parameters, fermentative volatile compounds and sensory analysis were additionally evaluated.

2.4. Analysis of General Oenological Parameters

Daily, density, ethanol (% v/v), residual sugars (g/L), total acidity expressed as tartaric acid (g/L) and nitrogen content (mg/L) were analysed by FTIR using an OenoFoss instrument (FOSS Iberia, Barcelona, Spain). Additionally, the pH evolution was determined using a pH 80 bench pH meter (XS Instruments). At the end of fermentation, FTIR analysis was performed to determine the ethanol (% v/v), pH, residual sugars (g/L) and volatile acidity (g/L acetic acid).

2.5. Enzyme Analysis

To evaluate the acidifying capacity of L. thermotolerans, malic acid and lactic acid concentrations were determined using the Miura One enzyme analyser (TDI, Barcelona, Spain).

2.6. Colour Analysis

Measurements of absorbance at 420, 520 and 620 nm, colour intensity, hue and CIELab coordinates were performed using the Smart Analysis spectrophotometer (DNA Phone, Parma, Italy).
The colour of the samples was represented in CIELab coordinates, characterising the colours based on the coordinates L*, a* and b*. The L* coordinate represents the brightness and can take values between 0 (black) and 100 (white). The a* coordinate can take negative (green) or positive (red) values. The b* coordinate indicates the position between blue (negative) and yellow (positive).
From the L*a*b* coordinates, chroma (C*) and hue (H*) parameters were obtained. The hue parameter is directly related to the a* and b* coordinates, representing red hue (0°), yellow hue (90°), green hue (180°), and blue hue (270°).

2.7. Analysis of Fermentative Volatile Compounds

Analysis of fermentative volatile compounds was conducted on an Agilent Technologies 6850 gas chromatograph (Las Rozas, Madrid, Spain), integrated with a flame ionisation detector (GC-FID) and a DB-624 column (60 m × 250 μm × 1.40 μm) according to the method described by [32].

2.8. Sensory Analysis

A descriptive sensory analysis evaluated visual, olfactory and taste parameters. The parameters were scored using a scale from 1 (lowest intensity) to 5 (highest intensity). The parameters analysed were colour intensity, tonality, turbidity, aromatic intensity, aromatic quality, herbs, floral, fruity, reduction and oxidation aromas, body, silkiness, bitterness, acidity and overall perception. The taste panel of experts who analysed the wines consisted of eight workers and members of the Food Technology laboratory (ETSIAAB), including both genders and ages between 20 and 50 years old. All evaluators provided voluntary informed consent before participation. The tasting took place at the winery in a room with artificial lighting, with 30 mL of wine served per glass. The experts cleansed their palates between samples using breadsticks and water. This descriptive sensory evaluation method is an adaptation of the International Organization for Standardization (ISO) guidelines to the conditions of our research [33,34]. The study was conducted in accordance with the Declaration of Helsinki and approved by the Institutional Review Board (UPM Ethics Committee) of Universidad Politécnica de Madrid (AIDLAPPMLB-AMB-HUMANOS-20221026) on 14 November 2022.

2.9. Statistical Analysis

Means, standard deviations, analysis of variance and test of significant differences (p < 0.05) were calculated using PC Statgraphics Centurion 19 software (Graphics Software Systems, Rockville, MD, USA). The graphs and principal component analysis were performed in RStudio 2024.9.0 (RStudio Team, Boston, MA, USA).

3. Results and Discussion

3.1. General Oenological Parameters

Table 2 shows the general oenological parameters analysed at the end of fermentation. The ethanol content was between 12.8% and 13.5% by volume, with a higher content in wines fermented with Must E at a significance level of 0.05. Must O showed a higher copper content (Table 1), which may have affected the fermentation performance and decreased the ethanol content [35]. The usefulness of Lachancea thermotolerans in the production of wines with lower alcohol content has been reported [10,12,16]. However, in this study, no significant differences in ethanol content based on the fermenting yeast appeared.
In terms of residual sugar concentration, significant differences were identified between wines fermented from Must O and Must E when S. cerevisiae was used as the fermenting yeast, with lower glucose and fructose content coinciding with higher ethanol production. Similarly to ethanol content, no significant differences in sugar content were observed between the fermenting yeasts.
Volatile acidity was determined between 0.38 and 0.55 g/L acetic acid. Wines made with strategy E showed a higher mean value than their counterparts made from Must O. This can be attributed to the high nitrogen content (425 mg/L), which has been associated with increased yeast biomass production, and higher levels of volatile acidity and ethyl acetate formation [36]. In relation to fermentative yeasts, co-inoculation with L. thermotolerans and M. pulcherrima succeeded in reducing volatile acidity in a statistically significant manner, according to the available literature [16]. M. pulcherrima exhibits a more intense initial respiratory metabolism than S. cerevisiae, consuming oxygen during its growth, which reduces the synthesis of acetic acid and, consequently, lowers volatile acidity.
In relation to pH, wines fermented from Must O had a lower pH than their counterparts fermented from Must E, coinciding with a higher malic acid content. Similarly, a lower pH was perceived in those wines fermented with L. thermotolerans. The decrease in pH was lower in wines co-inoculated with L. thermotolerans and M. pulcherrima, proportional to the lactic acid produced (Table 2).
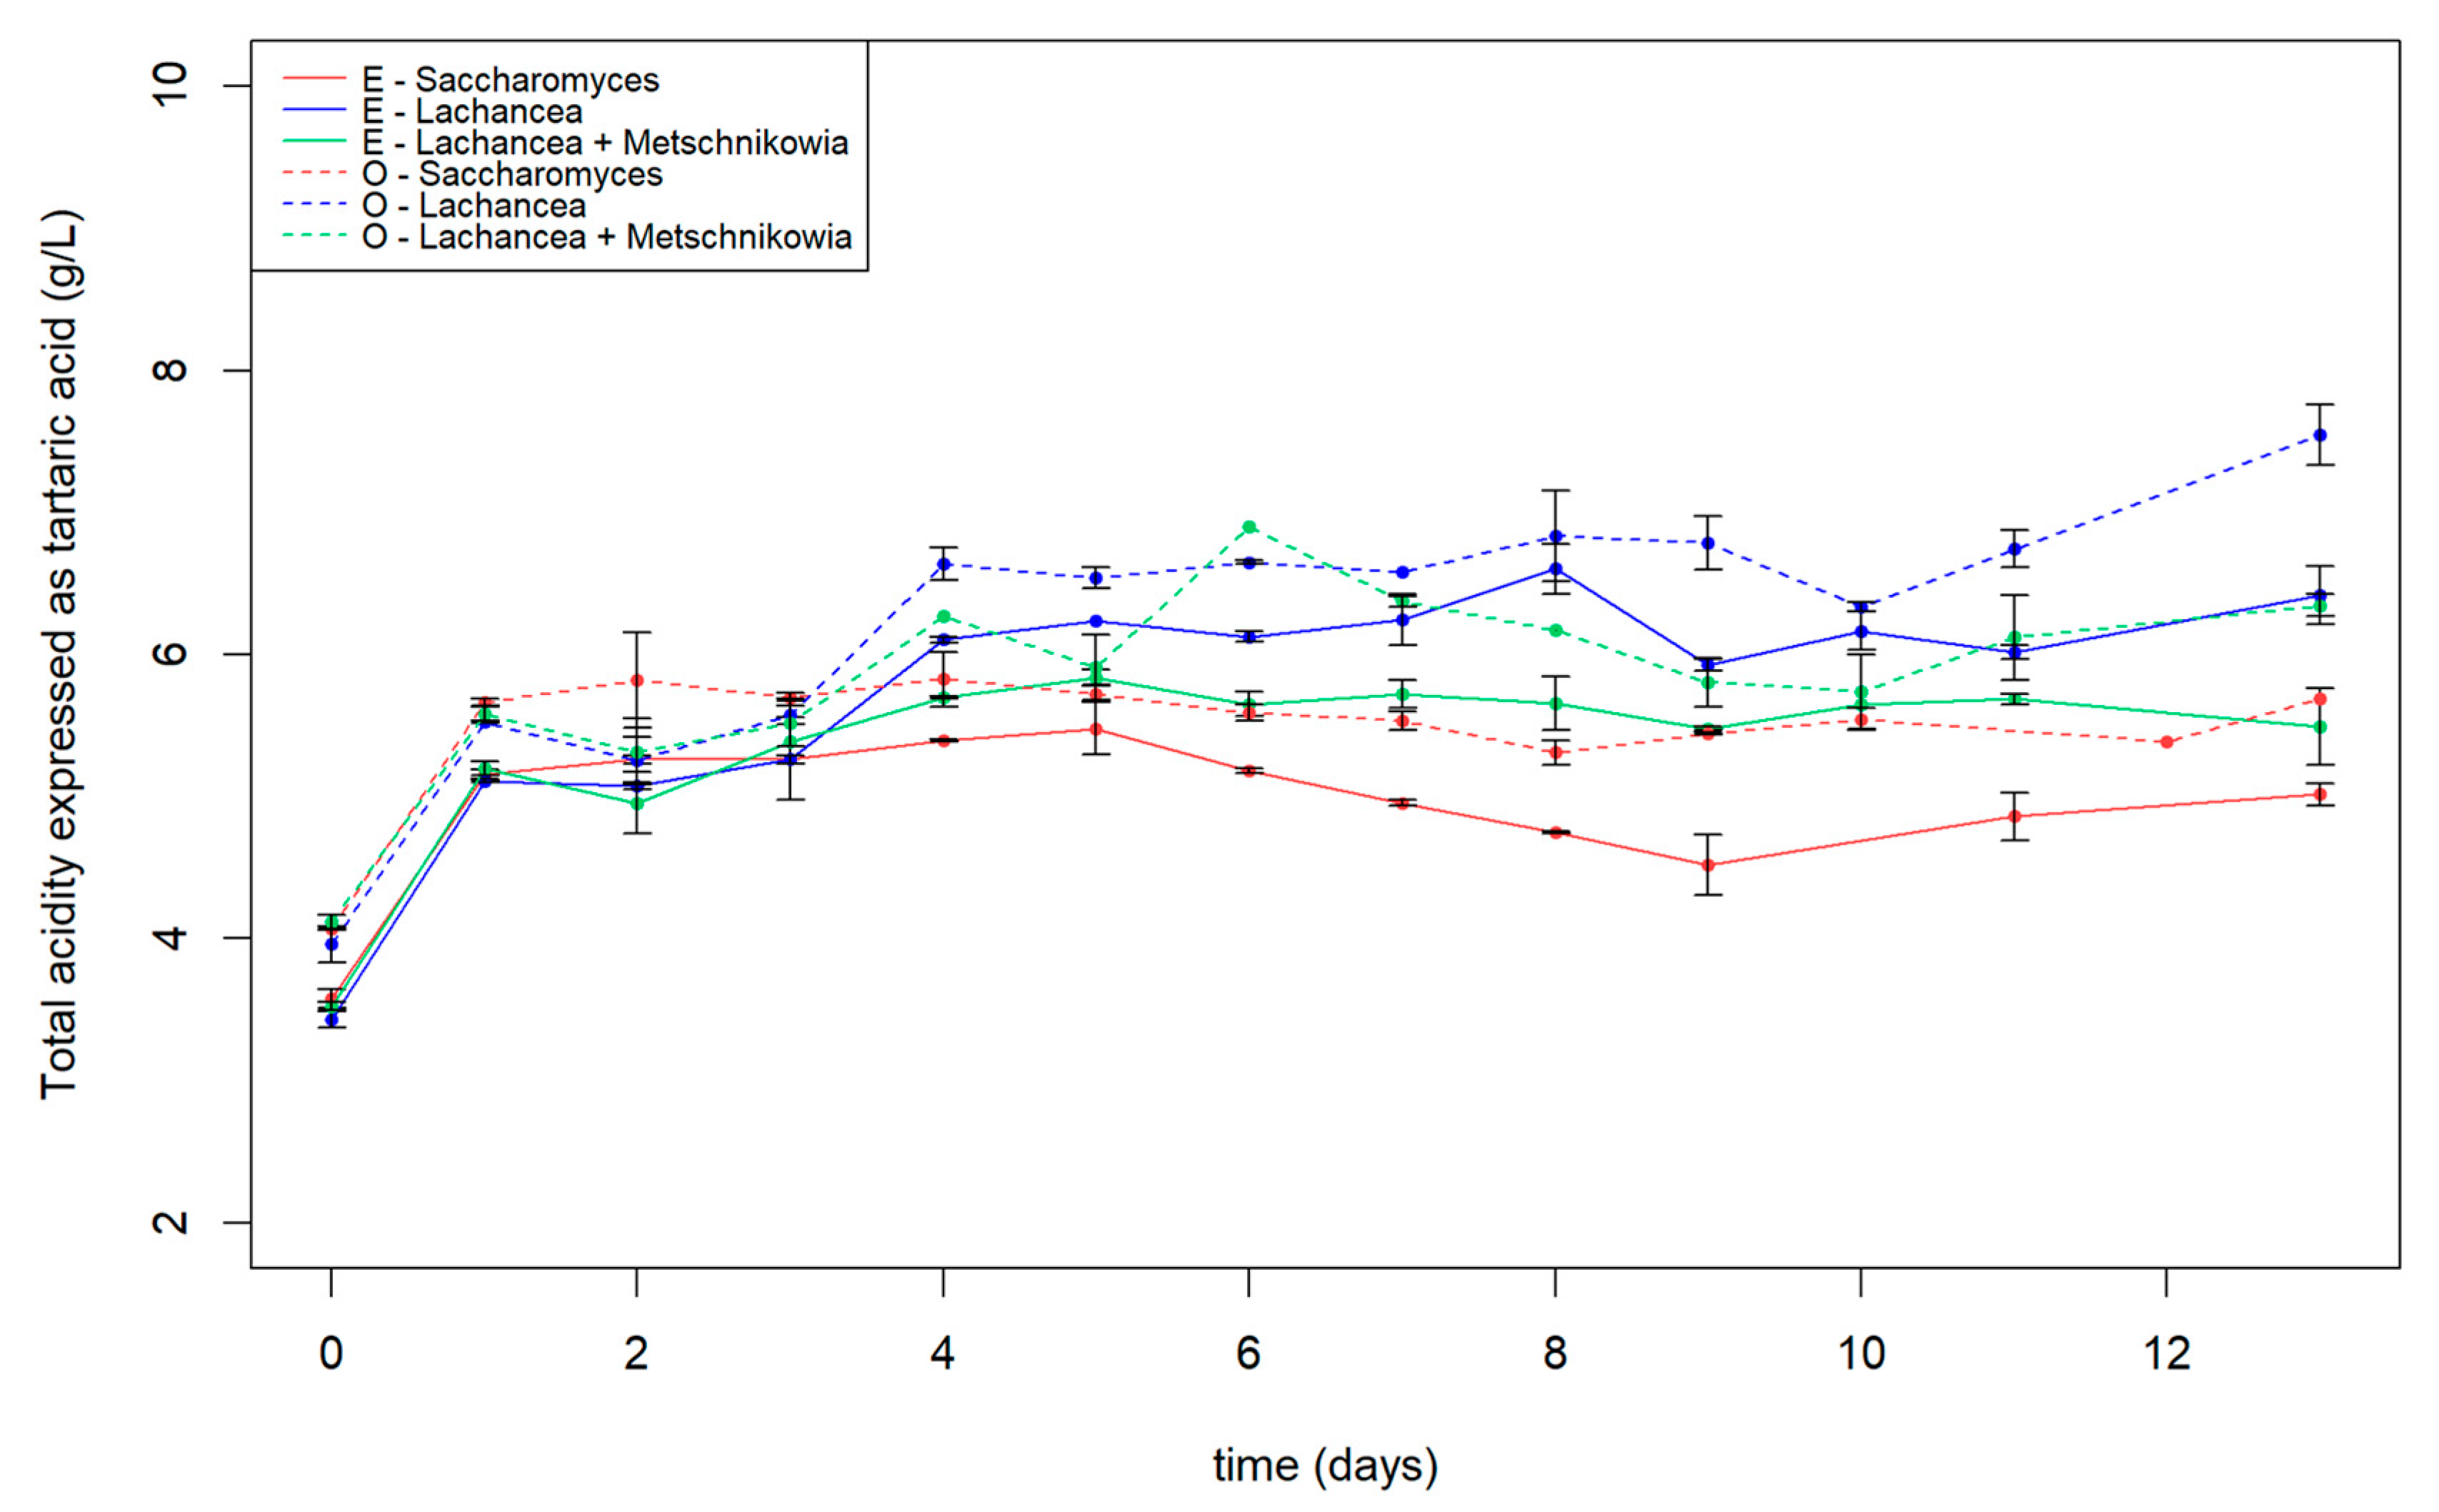
Figure 2, which illustrates the total acidity expressed in grams of tartaric acid, shows significant differences between Must O and Must E at the beginning of fermentation. As fermentation progresses, the differences in acidity between yeasts are accentuated, with results similar to those observed in the final pH determination: wines fermented with L. thermotolerans show the highest acidity, followed by those obtained by co-inoculation with M. pulcherrima. In addition, wines made from Must O show higher acidity than those fermented with Must E.

3.2. Enzymatic Analysis

Enzymatic analysis showed significant differences in malic acid content between wines fermented from Must O and wines fermented from Must E (Figure 3). Wines fermented from Must E had a malic acid content of 1.6–1.8 g/L, 30% less than those fermented from Must O. This reduction may be due to the applied leaf removal, which raises the temperature of the berries, increasing the degradation of malic acid [37]. Subsequently, two independent analyses of variance were performed, one for each type of must, to identify possible specific differences between yeasts. In Must E, no significant differences in malic acid content were found between the different fermentation conditions (p > 0.05). However, in Must O, significant differences were observed between the malic acid content present in wine fermented with S. cerevisiae and wine fermented with L. thermotolerans. This difference could be attributed to the ability of some strains of L. thermotolerans to degrade malic acid during fermentation [12].
The lactic acid concentration was measured daily during fermentation. At the beginning of fermentation, the lactic acid concentration was 0 g/L for all musts. From the third day of fermentation, significant differences (p-value below 0.05) started to be found depending on the fermentative yeasts used: musts inoculated with L. thermotolerans had twice as much lactic acid (about 1 g/L) as those co-inoculated with L. thermotolerans and M. pulcherrima, and musts inoculated with S. cerevisiae maintained a lactic acid concentration of 0 g/L. From the fourth day of fermentation, the production of lactic acid stopped, and the final values stabilised. The results showed that wines fermented with L. thermotolerans had the highest lactic acid production (between 2.25 and 2.50 g/L), with no significant differences based on the must used for fermentation. Barrels co-inoculated with L. thermotolerans and M. pulcherrima showed lower lactic acid production since the initially inoculated population was halved, although biocompatibility between L. thermotolerans BLIZZ™ and different strains of M. pulcherrima, including M. pulcherrima M29, had previously been observed in musts fermented with liquid inoculum [16]. Evaluation of lactic acid production with different co-inoculation protocols would be needed to determine whether biocompatibility is reproducible in winery fermentations. Again, no significant differences were found regarding the must used.

3.3. Colour Analysis

The results analysed in the spectrophotometer showed significant differences in several colour parameters between the samples at a significance level of 0.05 (Table 3).
In terms of colour intensity, no significant differences were found between the different samples, which represents the sum of the absorbances at 420, 520 and 620 nm.
In relation to the tonality of the sample, which is an indicator of the degree of browning of the wines, significant differences were observed depending on the must used in fermentation. In Must O wines, samples fermented with L. thermotolerans and those co-inoculated with L. thermotolerans and M. pulcherrima showed less browning. However, when using Must E, the results were reversed, with the wine fermented with L. thermotolerans from Must E showing the highest browning. The wines fermented from Must E had significantly higher colour tonalities than those made from Must O, probably because the sulphites present in Must O exerted a protective effect on oxidation.
The brightness data, seen in the L* coordinate, indicated significantly higher values for wines made with Must E, with those fermented with S. cerevisiae and L. thermotolerans having the highest brightness, and the co-inoculation from Must O being the sample with the lowest brightness. The L* coordinate is closely related to the degree of clarity, so that the E strategy may have had a positive impact on the clarification process.
Concerning the a* and b* coordinates, significant differences were found between the samples. A more greenish hue, characteristic profile of the variety used (Verdejo), was observed in the wine fermented with L. thermotolerans from Must E, with a significantly lower a* value and a significantly higher b* value. In wines from Must O fermented with L. thermotolerans and those co-inoculated with L. thermotolerans and M. pulcherrima, a more orange hue was observed due to significantly higher a* values and significantly lower b* values.
Similarly to the results of the a* and b* coordinates, the statistical analysis of the H* coordinate determined that the sample fermented with L. thermotolerans from Must E was significantly redder than the sample co-inoculated with Must O, which was more greenish.

3.4. Volatile Analysis

Table 4 presents the volatile compounds produced during fermentation, measured with GC-FID. Compared to the total volatile content, the values are approximately 1200 to 2000 mg/L. In wines fermented from the control must, a lower production of volatile compounds was quantified when using L. thermotolerans and M. pulcherrima as fermenting yeasts. In the fermentation with L. thermotolerans and in the co-inoculation, 1540 and 1263 mg/L, respectively, were produced, compared to 1960 mg/L produced by S. cerevisiae. Wines fermented from Must E had a higher content of volatile compounds (1900–2000 mg/L) associated with a higher nitrogen content [38,39]. No differences were found in the total production of fermentative volatile compounds among the yeasts used.
The differences were mainly due to the content of 2,3-butanediol, a by-product of alcoholic fermentation that has a slightly sweet-sour taste and has no impact on aroma [40]. In wines fermented from Must O, using S. cerevisiae as the fermenting yeast produced 50% more 2,3-butanediol than those fermented with L. thermotolerans and M. pulcherrima. Wines fermented from Must E had a significantly higher 2,3-butanediol content, with no differences relative to the fermenting yeast used. No differences were found for other carbonyl compounds.
Regarding higher alcohols, all strategies were below 400 mg/L, which negatively impacts aroma [41], with no significant differences between the different strategies. Significant differences were found in 1-propanol content. All wines fermented from Must E had a higher 1-propanol content than their counterparts fermented from Must O, although the difference is not statistically significant. This could be explained by the higher nitrogen content of Must E, which provides more precursors for the Ehrlich pathway involved in the synthesis of higher alcohols [42]. Also, wines fermented with L. thermotolerans and M. pulcherrima showed significantly lower yields. Regarding the 2-phenylethanol content, which is associated with floral aromas similar to rose, the samples were between 11 and 13 mg/L, which is above the sensory threshold (10 mg/L) [43]. The concentration of 3-methyl-1-butanol is high, ranging between 130 and 190 mg/L. This exceeds the sensory threshold (40 mg/L) and contributes to a pungent aroma [44,45], which may be related to the high nitrogen content of the musts.
Acetate esters are formed from the esterification of acyl-CoA with alcohols and, except for ethyl acetate, are associated with fruity aromas and have a positive impact [46]. Apart from the E-L. thermotolerans strategy, all the wines had an ethyl acetate content below 150 mg/L. Contents above this concentration produce an undesired solvent aroma [47]. Although no significant differences were found, all wines fermented from Must O had no isobutyl acetate, which contributes sweet, fruity and apple [45], while wines fermented from Must E had a concentration of between 1.5 and 3 mg/L. Ethyl butyrate is an ester formed by the esterification between acetyl-CoA and isobutanol, a higher alcohol, so its production can also be affected by nitrogen content. Concerning ethyl butyrate, which contributes strawberry aromas [48], in fermentations involving M. pulcherrima, production increased by 50%. Regarding 2-phenylethyl acetate, which has a floral rose-like aroma, all strategies showed values above the perception threshold (0.25 mg/L) [49].
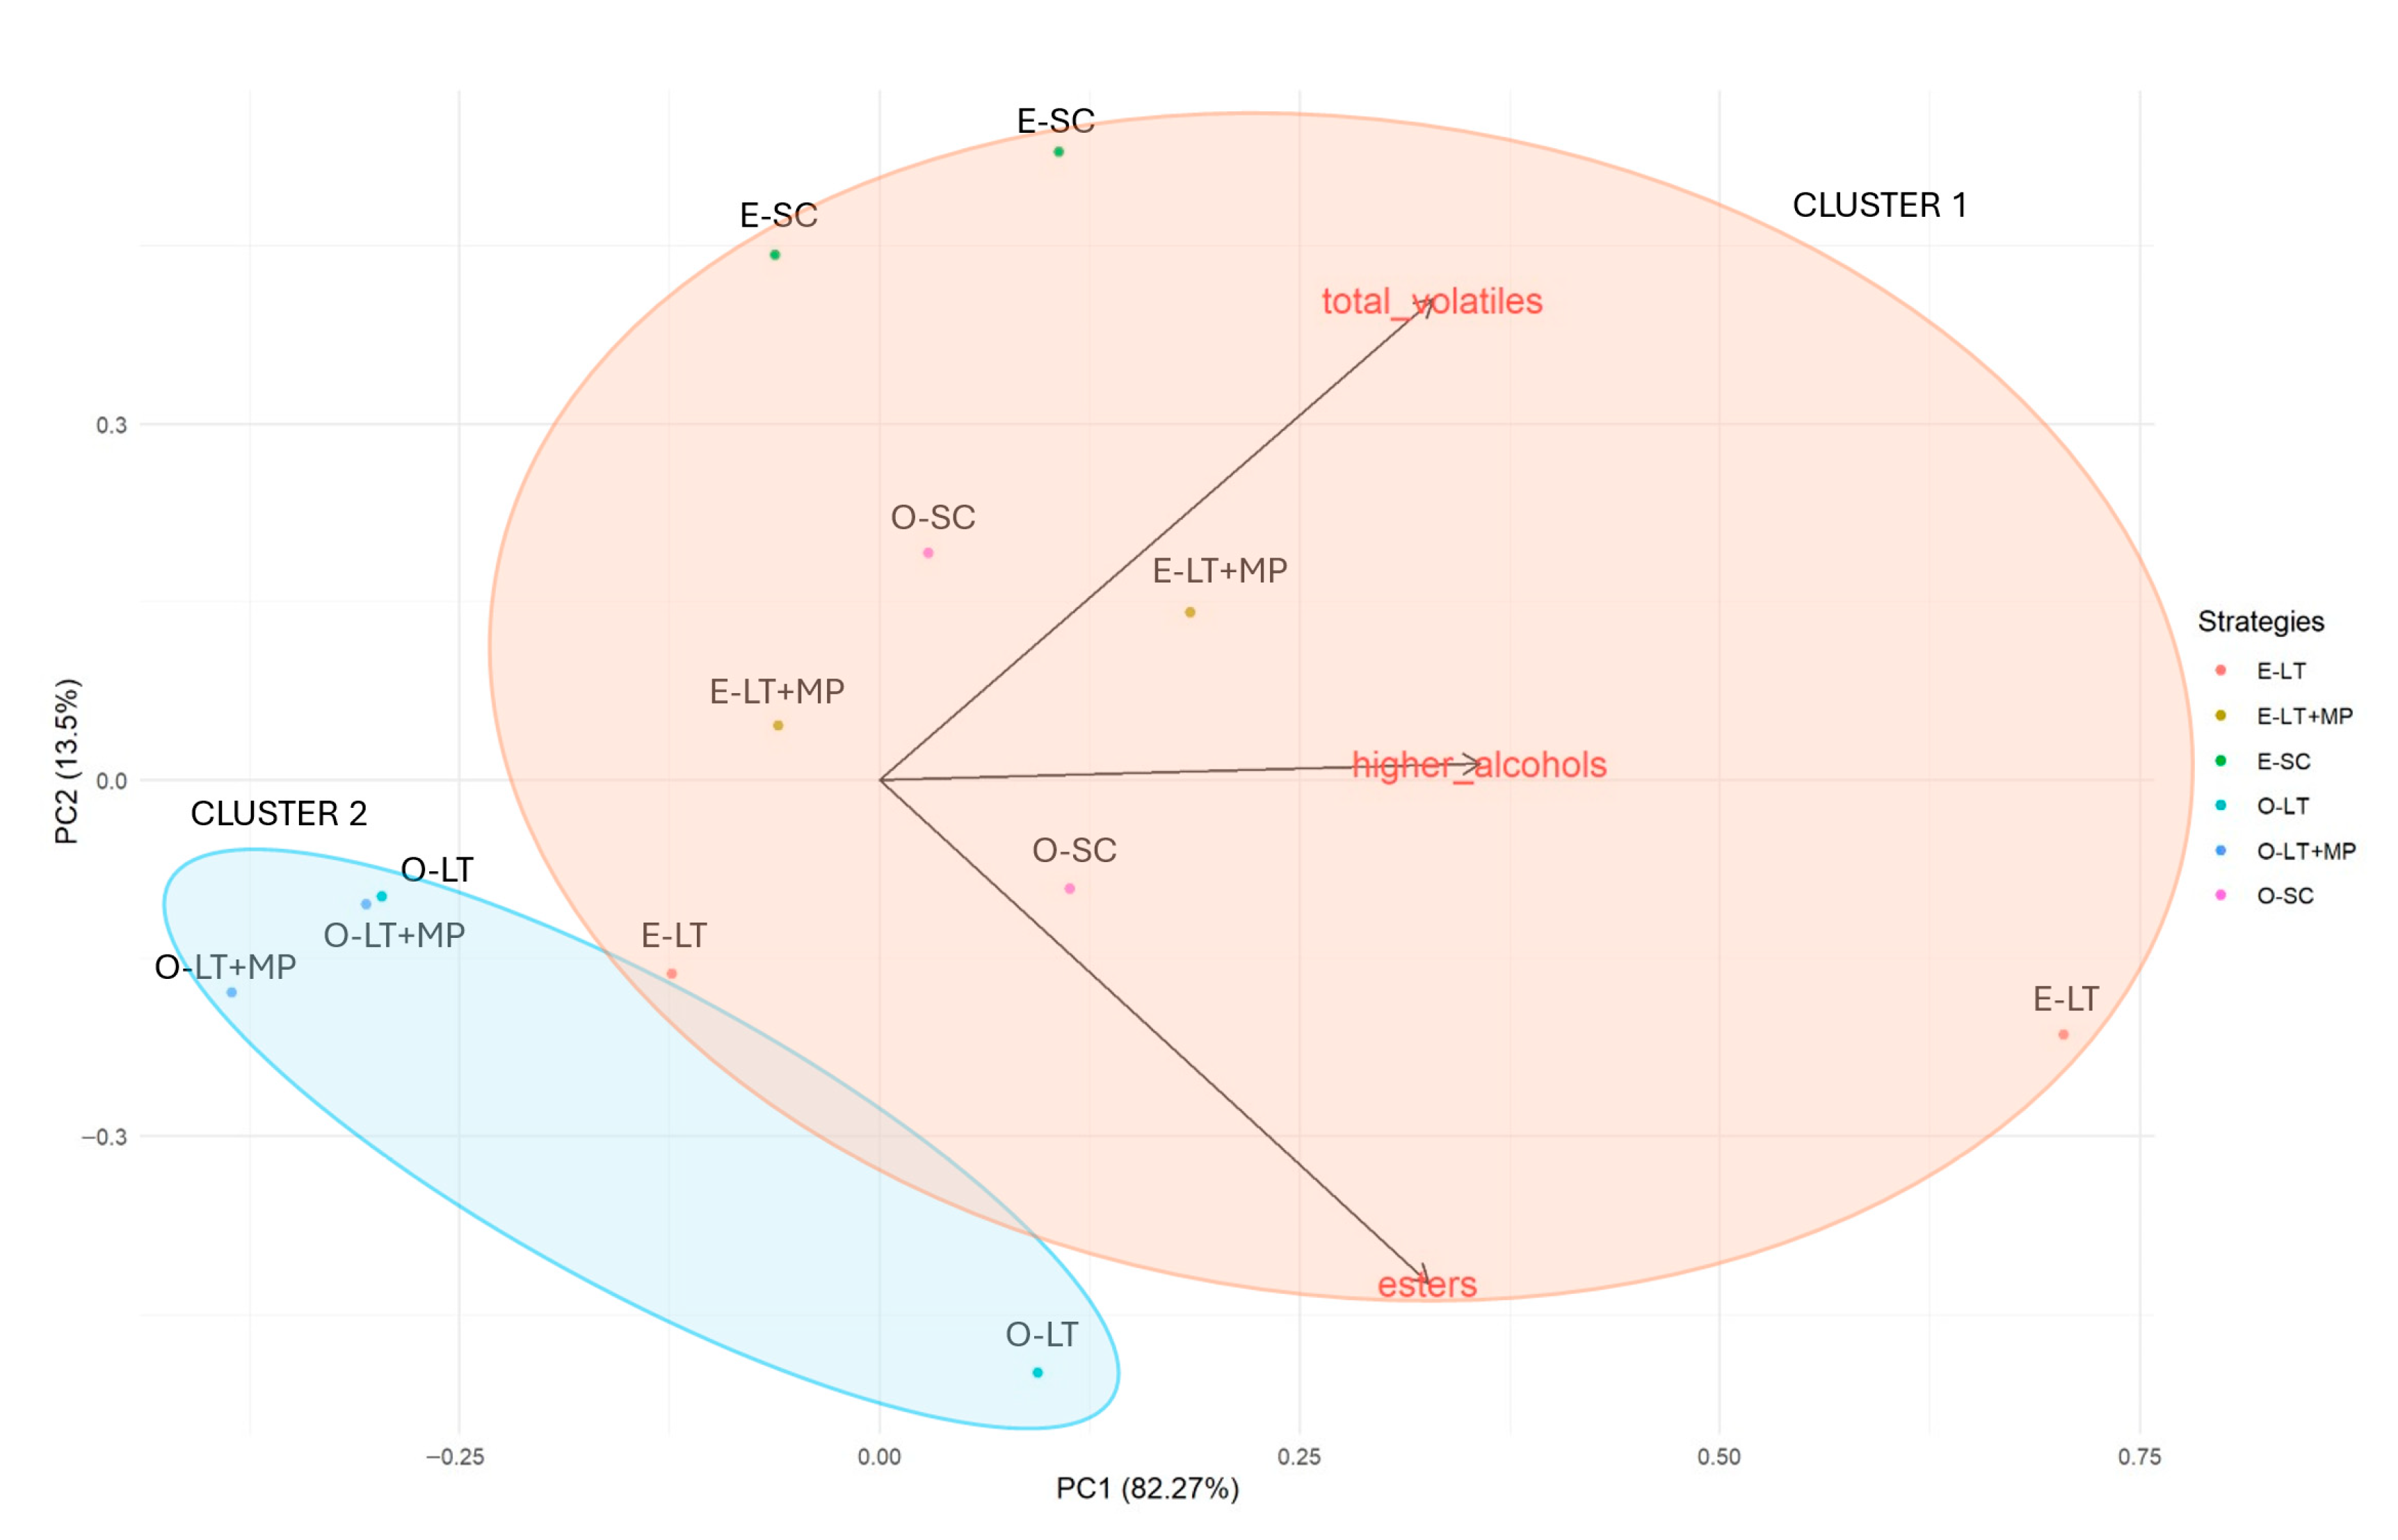
A principal component analysis was performed based on the results of the grouped volatiles (Figure 4). Together, the first two components explained 95.81% of the total variability. Two main groupings were identified: Cluster 1, which groups all samples fermented from Must E and wines fermented with S. cerevisiae from Must O. This cluster relates to those samples with a higher production of total volatiles, due either to a higher nitrogen content or to the effect of S. cerevisiae, which has shown a higher production of carbonyl compounds and higher alcohols [50,51]. On the other hand, Cluster 2 groups wines fermented with L. thermotolerans or L. thermotolerans and M. pulcherrima from Must O are characterised by a lower production of higher alcohols and fermentative volatiles overall.

3.5. Variable Correlation

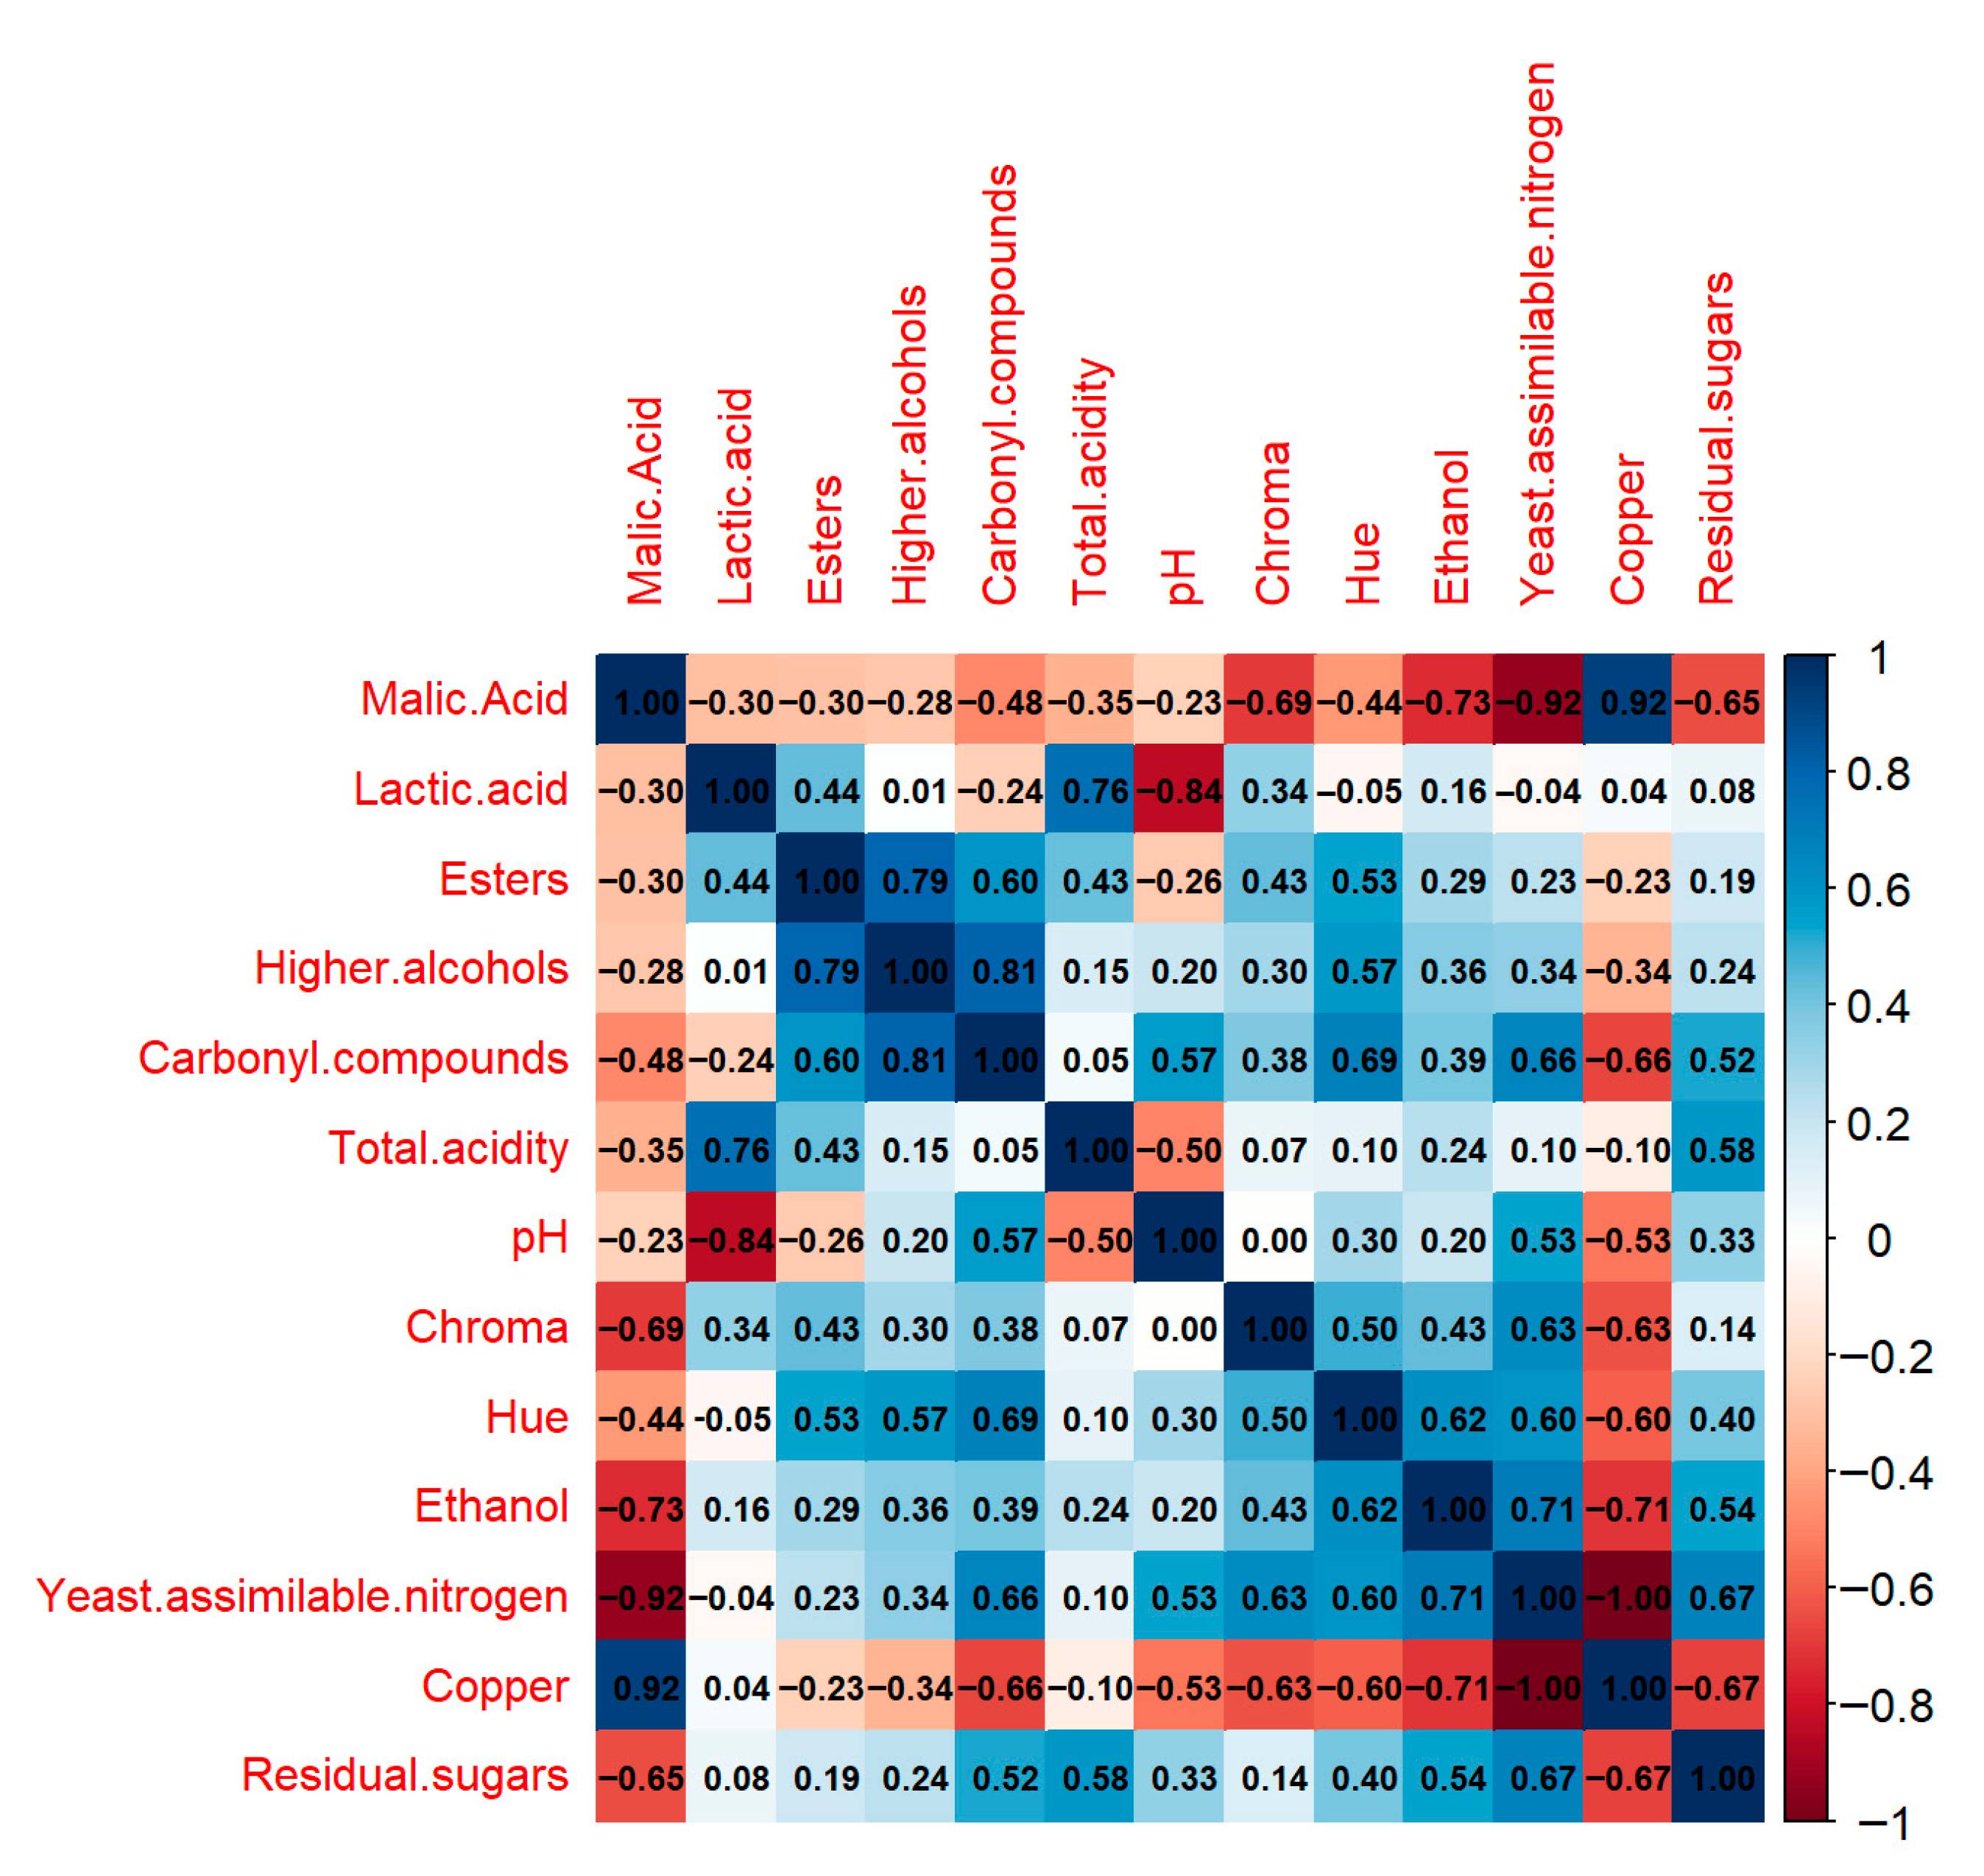
Based on the data collected, a correlation matrix was created using Pearson’s coefficients to establish relationships among the assessed variables (Figure 5). This coefficient, which takes values between −1 and 1, indicates a higher correlation the further away from 0. A positive value indicates a direct correlation between the variables, while a negative value reflects an inverse relationship.
The results showed that ethanol correlated positively with nitrogen content and negatively with copper content. A positive correlation was also observed between the production of carbonyl compounds, higher alcohols and esters. Additionally, yeast-assimilable nitrogen (YAN) was positively associated with the production of carbonyl compounds, as discussed in the analysis of volatile compounds. Also, lactic acid concentration was directly proportional to total acidity and inversely proportional to pH.
This correlation was not evident with malic acid, indicating that its variations had less impact on wine acidity and pH. The copper and YAN data were measured before fermentation to characterise the two types of musts, so their correlation does not provide relevant information.

3.6. Sensory Analysis

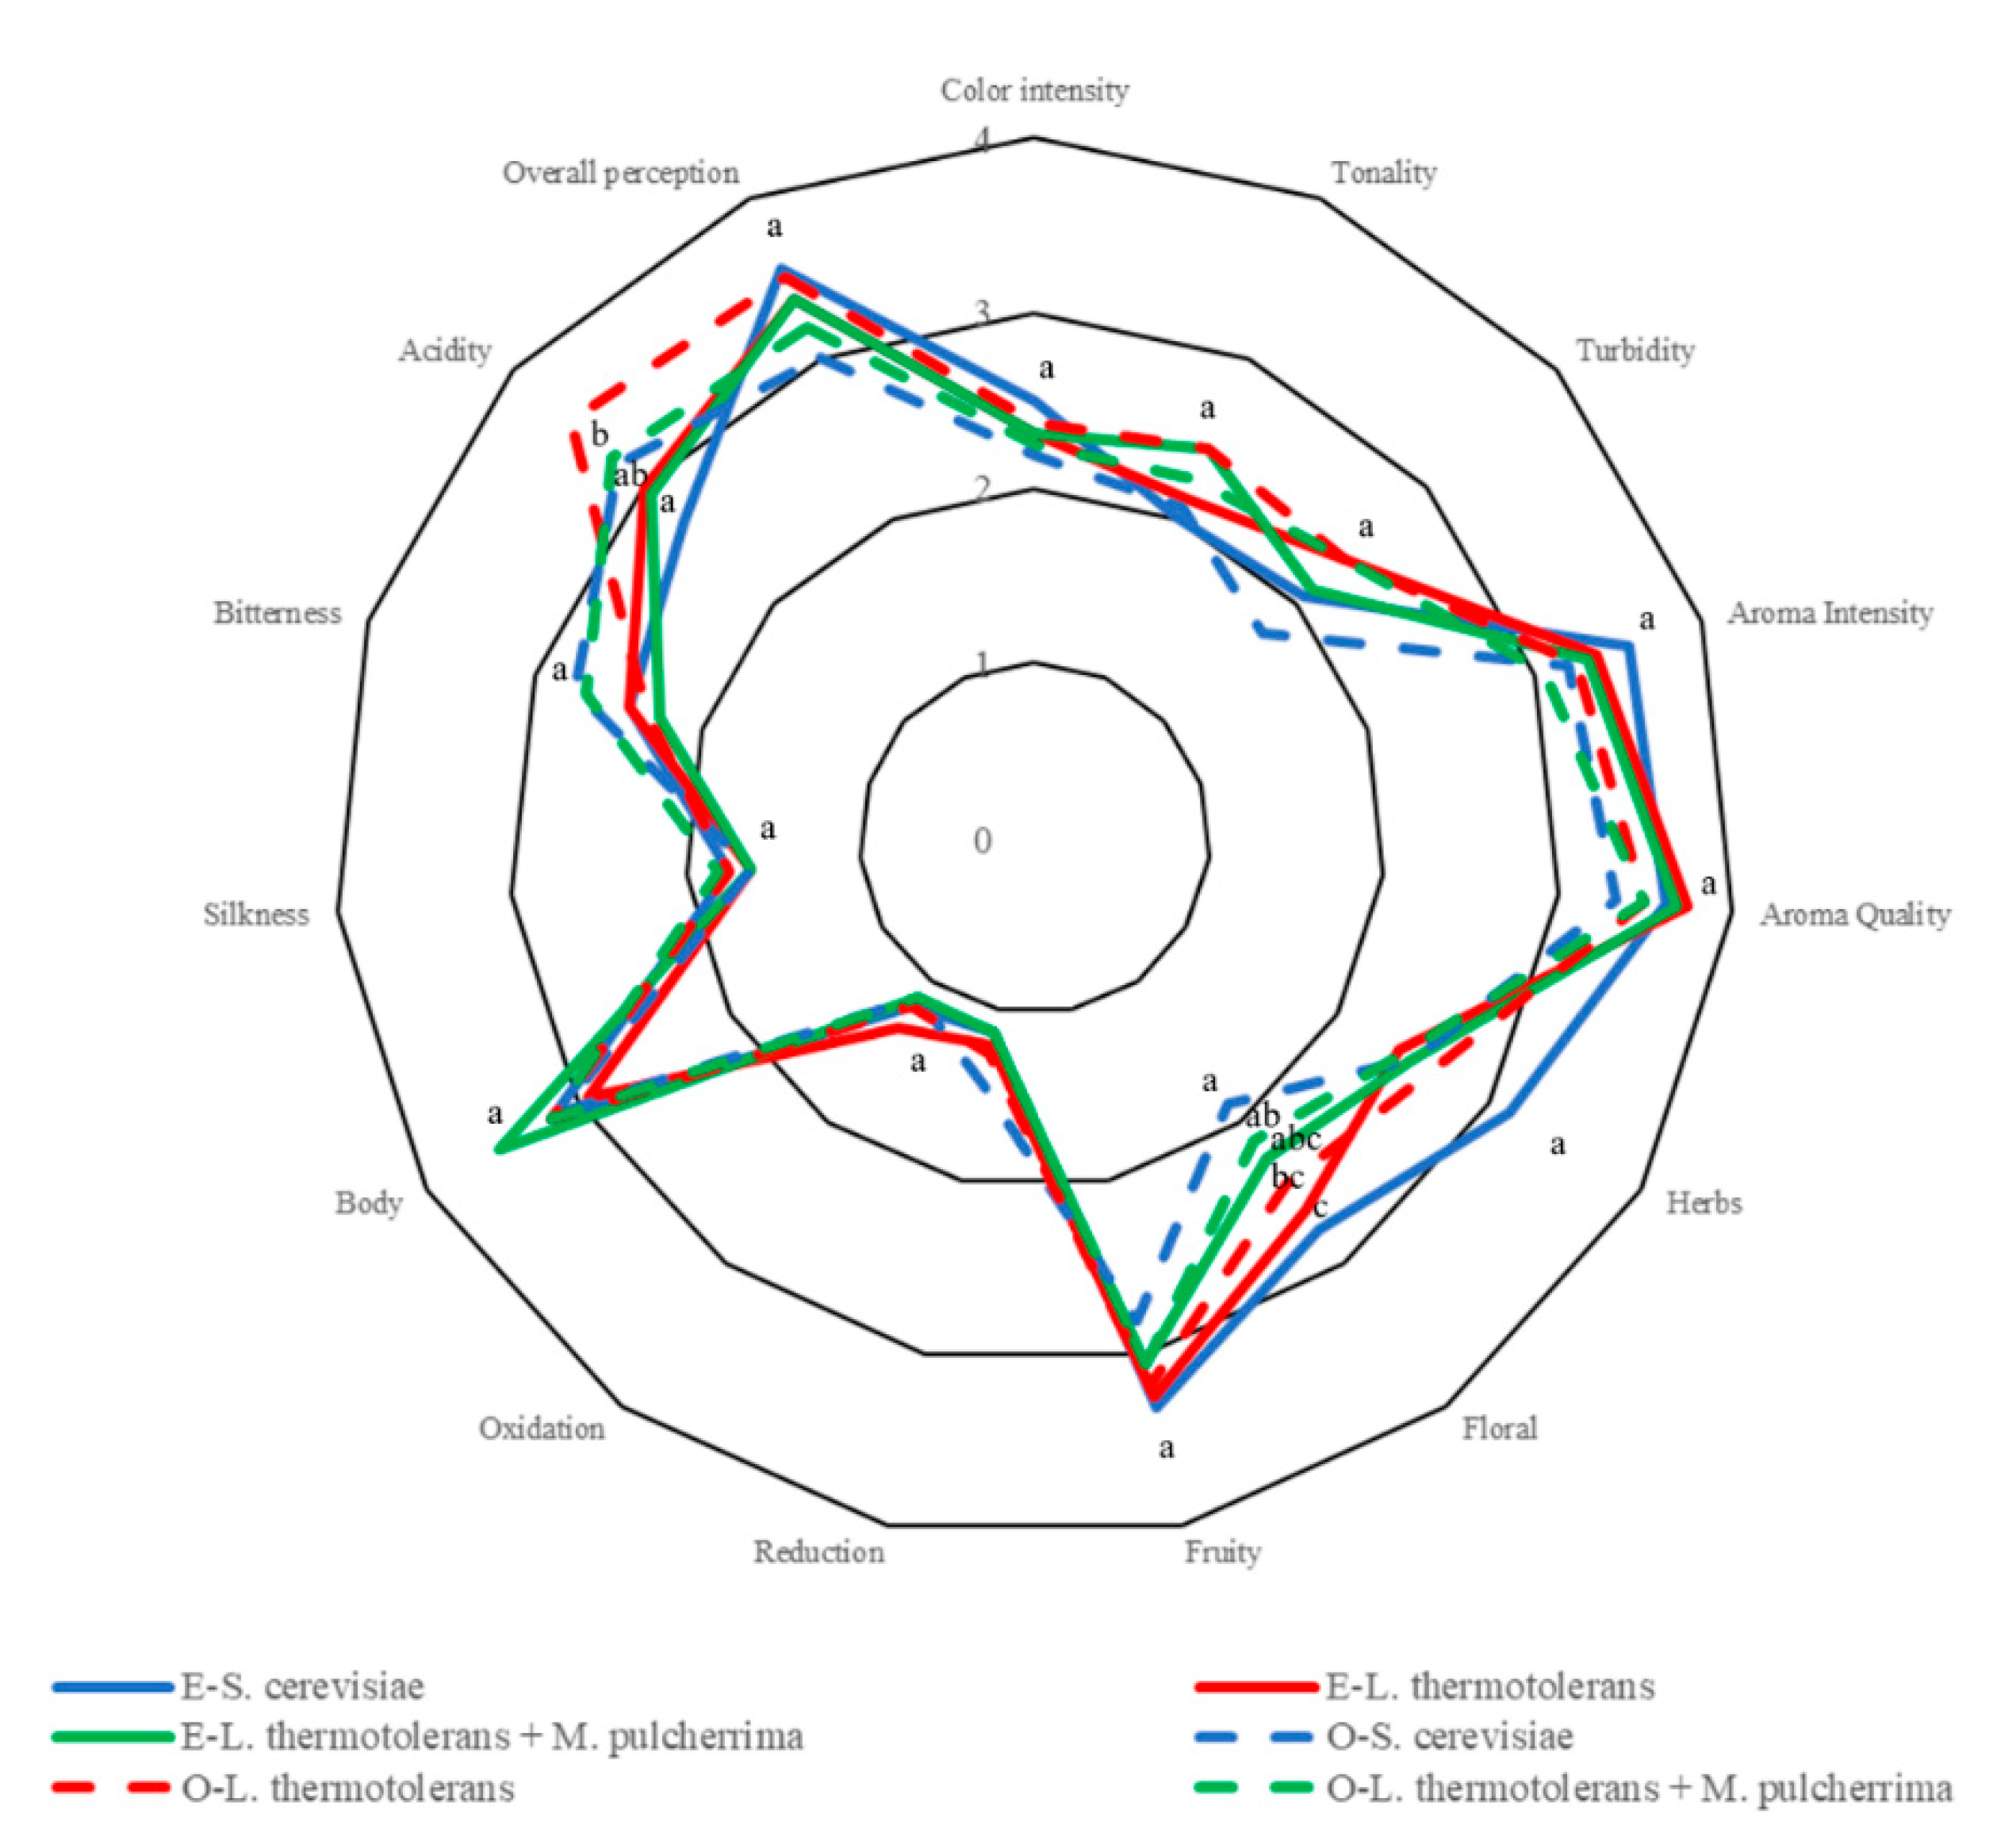
The sensory analysis found significant differences in the perception of acidity and floral aroma, with no differences between the evaluations of the different judges (Figure 6). In general, the wines presented an acidic profile with a fruity aroma. In terms of visual attributes, the colour was perceived as not very intense and with a pale, slightly oxidised hue. In the evaluation of olfactory attributes, the wines were characterised by a high aromatic intensity and quality. Finally, in terms of taste perception, the wines presented a full-bodied profile, high acidity and low astringency, characteristic attributes of the grape variety used. The wine made with L. thermotolerans using Must O had the highest acidity score (3.5/5) and the lowest pH, so the acidifying effect of the yeast could be perceived at the sensory level. In relation to the floral aroma, the wine perceived as more intense was the one fermented with S. cerevisiae from Must E, with a higher content of easily assimilable nitrogen sources. In contrast, the wine fermented with S. cerevisiae from Must O received the lowest scores for floral aroma.
In general, the judges perceived the wines fermented from strategy O as having a more balanced aroma, confirming that increased production of volatile compounds, as seen in the analysis of volatile compounds in Section 3.4, did not lead to an improvement in the perception of aromatic quality.

4. Conclusions

The study has demonstrated that different viticultural and fermentation treatments can significantly impact the sensory and chemical profiles of wines, changing the perception of freshness. Treatment E, while improving colour parameters, increased alcohol levels and reduced acidity, impairing the freshness objective.
Lactic acid production using Lachancea thermotolerans as a fermentative yeast successfully elevated acidity perception, highlighting its potential for modifying taste profiles, although further studies with Metschnikowia pulcherrima are needed to optimise production in co-inoculated wines.
The fermentation strategy using Must O emerged as particularly effective, yielding wines perceived as more balanced due to a more favourable composition of carbonyl compounds and volatile alcohols. This suggests that, while Treatment E enhances certain aromatic profiles through increased production of fermentative volatiles, Must O provides a more balanced aroma, highlighting the importance of carefully selecting both viticultural and fermentation practices in tailoring wine characteristics.

Author Contributions

Conceptualisation, A.M. and J.M.D.F.; methodology, M.A.B.; software, I.L.; validation, I.L.; formal analysis, M.S.; investigation, M.S.; resources, A.M. and M.A.B.; data curation, M.S.; writing—original draft preparation, M.S.; writing—review and editing, A.M., J.M.D.F. and I.L.; visualisation, M.S.; supervision, I.L.; project administration, A.M.; funding acquisition, A.M. All authors have read and agreed to the published version of the manuscript.

Funding

This research was funded by the 4everWINES project under grant number IDI-20230497 (Centre for Technological Development and Innovation (CDTI) and European Regional Development Fund (ERDF), 2021–2027) in collaboration with Bodegas José Pariente (Spain).

Institutional Review Board Statement

The study was conducted in accordance with the Declaration of Helsinki and approved by the Institutional Review Board (UPM Ethics Committee) of Universidad Politécnica de Madrid (AIDLAPPMLB-AMB-HUMANOS-20221026 on 14 November 2022).

Informed Consent Statement

Informed consent was obtained from all subjects involved in the sensory analysis.

Data Availability Statement

Data are available and can be sent upon request.

Acknowledgments

The authors gratefully acknowledge Bodegas José Pariente for generously providing their facilities, resources and financial support, which were essential for the development of this research.

Conflicts of Interest

The authors declare that there are no conflicts of interest.

Abbreviations

The following abbreviations are used in this manuscript:
LtLachancea thermotolerans
MpMetschnikowia pulcherrima

References

  1. Morata, A.; Escott, C.; Bañuelos, M.A.; Loira, I.; del Fresno, J.M.; González, C.; Suárez-Lepe, J.A. Contribution of Non-Saccharomyces Yeasts to Wine Freshness. A Review. Biomolecules 2019, 10, 34. [Google Scholar] [CrossRef]
  2. Ciliberti, N.; Fermaud, M.; Roudet, J.; Rossi, V. Environmental Conditions Affect Botrytis cinerea Infection of Mature Grape Berries More Than the Strain or Transposon Genotype. Phytopathology 2015, 105, 1090–1096. [Google Scholar]
  3. Loureiro, V. Spoilage yeasts in the wine industry. Int. J. Food Microbiol. 2003, 86, 23–50. [Google Scholar] [CrossRef]
  4. García-Muñoz, S.; Muñoz-Organero, G.; Fernández-Fernández, E.; Cabello, F. Sensory characterisation and factors influencing quality of wines made from 18 minor varieties (Vitis vinifera L.). Food Qual. Prefer. 2014, 32, 241–252. [Google Scholar]
  5. Jolly, N.P.; Varela, C.; Pretorius, I.S. Not your ordinary yeast: Non-Saccharomyces yeasts in wine production uncovered. FEMS Yeast Res. 2014, 14, 215–237. [Google Scholar]
  6. Morata, A.; Loira, I.; González, C.; Escott, C. Non-Saccharomyces as Biotools to Control the Production of Off-Flavors in Wines. Molecules 2021, 26, 4571. [Google Scholar] [PubMed]
  7. Lachance, M.A.; Kurtzman, C.P. Lachancea. In The Yeasts; Elsevier: Amsterdam, The Netherlands, 2011; pp. 511–519. [Google Scholar]
  8. Ciani, M.; Beco, L.; Comitini, F. Fermentation behaviour and metabolic interactions of multistarter wine yeast fermentations. Int. J. Food Microbiol. 2006, 108, 239–245. [Google Scholar] [CrossRef] [PubMed]
  9. Comitini, F.; Gobbi, M.; Domizio, P.; Romani, C.; Lencioni, L.; Mannazzu, I.; Ciani, M. Selected non-Saccharomyces wine yeasts in controlled multistarter fermentations with Saccharomyces cerevisiae. Food Microbiol. 2011, 28, 873–882. [Google Scholar] [CrossRef] [PubMed]
  10. Morata, A.; Bañuelos, M.A.; Vaquero, C.; Loira, I.; Cuerda, R.; Palomero, F.; González, C.; Suárez-Lepe, J.A.; Wang, J.; Han, S.; et al. Lachancea thermotolerans as a tool to improve pH in red wines from warm regions. Eur. Food Res. Technol. 2019, 245, 885–894. [Google Scholar] [CrossRef]
  11. Porter, T.J.; Divol, B.; Setati, M.E. Lachancea yeast species: Origin, biochemical characteristics and oenological significance. Food Res. Int. 2019, 119, 378–389. [Google Scholar] [CrossRef]
  12. Hranilovic, A.; Albertin, W.; Capone, D.L.; Gallo, A.; Grbin, P.R.; Danner, L.; Bastian, S.E.; Masneuf-Pomarede, I.; Coulon, J.; Bely, M.; et al. Impact of Lachancea thermotolerans on chemical composition and sensory profiles of Merlot wines. Food Chem. 2021, 349, 129015. [Google Scholar] [CrossRef]
  13. Morata, A.; Loira, I.; González, C.; Bañuelos, M.A.; Cuerda, R.; Heras, J.M.; Vaquero, C.; Suárez-Lepe, J.A. Biological acidification by Lachancea thermotolerans. In White Wine Technology; Elsevier: Amsterdam, The Netherlands, 2022; pp. 131–142. [Google Scholar]
  14. Vaquero, C.; Loira, I.; Bañuelos, M.A.; Heras, J.M.; Cuerda, R.; Morata, A. Industrial Performance of Several Lachancea thermotolerans Strains for pH Control in White Wines from Warm Areas. Microorganisms 2020, 8, 830. [Google Scholar] [CrossRef]
  15. Sgouros, G.; Mallouchos, A.; Filippousi, M.E.; Banilas, G.; Nisiotou, A. Molecular Characterization and Enological Potential of A High Lactic Acid-Producing Lachancea thermotolerans Vineyard Strain. Foods 2020, 9, 595. [Google Scholar] [CrossRef] [PubMed]
  16. Escott, C.; Vaquero, C.; Loira, I.; López, C.; González, C.; Morata, A. Synergetic Effect of Metschnikowia pulcherrima and Lachancea thermotolerans in Acidification and Aroma Compounds in Airén Wines. Foods 2022, 11, 3734. [Google Scholar] [CrossRef] [PubMed]
  17. Martin, V.; Valera, M.J.; Medina, K.; Boido, E.; Carrau, F. Oenological Impact of the Hanseniaspora/Kloeckera Yeast Genus on Wines—A Review. Fermentation 2018, 4, 76. [Google Scholar]
  18. Escott, C.; Vaquero, C.; del Fresno, J.M.; Topo, A.; Comuzzo, P.; Gonzalez, C.; Morata, A. Effect of processing Verdejo grape must by UHPH using non-Saccharomyces yeasts in the absence of SO2. Sustain. Food Technol. 2024, 2, 437–446. [Google Scholar] [CrossRef]
  19. Izquierdo-Cañas, P.M.; del Fresno, J.M.; Malfeito-Ferreira, M.; Mena-Morales, A.; García-Romero, E.; Heras, J.M.; Loira, I.; González, C.; Morata, A. Wine bioacidification: Fermenting Airén grape juices with Lachancea thermotolerans and Metschnikovia pulcherrima followed by sequential Saccharomyces cerevisiae inoculation. Int. J. Food Microbiol. 2025, 427, 110977. [Google Scholar]
  20. Sipiczki, M. Taxonomic Revision of the pulcherrima Clade of Metschnikowia (Fungi): Merger of Species. Taxonomy 2022, 2, 107–123. [Google Scholar] [CrossRef]
  21. Morata, A.; Loira, I.; Escott, C.; del Fresno, J.M.; Bañuelos, M.A.; Suárez-Lepe, J.A. Applications of Metschnikowia pulcherrima in Wine Biotechnology. Fermentation 2019, 5, 63. [Google Scholar] [CrossRef]
  22. Puyo, M.; Simonin, S.; Bach, B.; Klein, G.; Alexandre, H.; Tourdot-Maréchal, R. Bio-protection in oenology by Metschnikowia pulcherrima: From field results to scientific inquiry. Front. Microbiol. 2023, 14, 1252973. [Google Scholar] [CrossRef]
  23. Canonico, L.; Agarbati, A.; Galli, E.; Comitini, F.; Ciani, M. Metschnikowia pulcherrima as biocontrol agent and wine aroma enhancer in combination with a native Saccharomyces cerevisiae. LWT 2023, 181, 114758. [Google Scholar] [CrossRef]
  24. Türkel, S.; Korukluoğlu, M.; Yavuz, M. Biocontrol Activity of the Local Strain of Metschnikowia pulcherrima on Different Postharvest Pathogens. Biotechnol. Res. Int. 2014, 2014, 397167. [Google Scholar] [CrossRef]
  25. Fernández-González, M.; Di Stefano, R.; Briones, A. Hydrolysis and transformation of terpene glycosides from muscat must by different yeast species. Food Microbiol. 2003, 20, 35–41. [Google Scholar] [CrossRef]
  26. Zott, K.; Thibon, C.; Bely, M.; Lonvaud-Funel, A.; Dubourdieu, D.; Masneuf-Pomarede, I. The grape must non-Saccharomyces microbial community: Impact on volatile thiol release. Int. J. Food Microbiol. 2011, 151, 210–215. [Google Scholar] [CrossRef] [PubMed]
  27. Barbosa, C.; Lage, P.; Esteves, M.; Chambel, L.; Mendes-Faia, A.; Mendes-Ferreira, A. Molecular and Phenotypic Characterization of Metschnikowia pulcherrima Strains from Douro Wine Region. Fermentation 2018, 4, 8. [Google Scholar] [CrossRef]
  28. Ruiz, J.; Belda, I.; Beisert, B.; Navascués, E.; Marquina, D.; Calderón, F.; Rauhut, D.; Santos, A.; Benito, S. Analytical impact of Metschnikowia pulcherrima in the volatile profile of Verdejo white wines. Appl. Microbiol. Biotechnol. 2018, 102, 8501–8509. [Google Scholar] [CrossRef]
  29. Hranilovic, A.; Gambetta, J.M.; Jeffery, D.W.; Grbin, P.R.; Jiranek, V. Lower-alcohol wines produced by Metschnikowia pulcherrima and Saccharomyces cerevisiae co-fermentations: The effect of sequential inoculation timing. Int. J. Food Microbiol. 2020, 329, 108651. [Google Scholar]
  30. Morales, P.; Rojas, V.; Quirós, M.; Gonzalez, R. The impact of oxygen on the final alcohol content of wine fermented by a mixed starter culture. Appl. Microbiol. Biotechnol. 2015, 99, 3993–4003. [Google Scholar] [CrossRef]
  31. Organisation Internationale de la Vigne et du Vin (OIV). Métodos OIV-MA-AS323-04A y OIV-MA-AS323-04B para la Determinación de Dióxido de Azufre Libre y Total. In Compendio de Métodos In-ternacionales de Análisis de los Vinos y de los Mostos; OIV: Paris, Francia, 2016. [Google Scholar]
  32. Abalos, D.; Vejarano, R.; Morata, A.; González, C.; Suárez-Lepe, J.A. The use of furfural as a metabolic inhibitor for reducing the alcohol content of model wines. Eur. Food Res. Technol. 2011, 232, 663–669. [Google Scholar] [CrossRef]
  33. International Organization for Standardization. Sensory Analysis: General Guidance for the Design of Test Rooms; International Organization for Standardization: Geneva, Switzerland, 2010. [Google Scholar]
  34. International Organization for Standardization. Sensory Analysis: Vocabulary; International Organization for Standardization: Geneva, Switzerland, 2010. [Google Scholar]
  35. Errichiello, F.; Picariello, L.; Forino, M.; Blaiotta, G.; Petruzziello, E.; Moio, L.; Gambuti, A. Copper (II) Level in Musts Affects Acetaldehyde Concentration, Phenolic Composition, and Chromatic Characteristics of Red and White Wines. Molecules 2024, 29, 2907. [Google Scholar] [CrossRef]
  36. Bell, S.J.; Henschke, P.A. Implications of nitrogen nutrition for grapes, fermentation and wine. Aust. J. Grape Wine Res. 2005, 11, 242–295. [Google Scholar] [CrossRef]
  37. Lakso, A.N.; Kliewer, W.M. The Influence of Temperature on Malic Acid Metabolism in Grape Berries. II. Temperature Responses of Net Dark CO2 Fixation and Malic Acid Pools. Am. J. Enol. Vitic. 1978, 29, 145–149. [Google Scholar]
  38. Ferreira, A.M.; Barbosa, C.; Lage, P.; Mendes-Faia, A. The impact of nitrogen on yeast fermentation and wine quality. Ciência Técnica Vitivinícola 2011, 26, 17–32. [Google Scholar]
  39. Gobert, A.; Tourdot-Maréchal, R.; Sparrow, C.; Morge, C.; Alexandre, H. Influence of nitrogen status in wine alcoholic fermentation. Food Microbiol. 2019, 83, 71–85. [Google Scholar] [CrossRef]
  40. Jackson, R.S. Wine Science; Elsevier: Amsterdam, The Netherlands, 2020. [Google Scholar]
  41. Rapp, A.; Versini, G. Influence of nitrogen compounds in grapes on aroma compounds of wines. In Developments in Food Science; Elsevier: Amsterdam, The Netherlands, 1995; pp. 1659–1694. [Google Scholar]
  42. Hazelwood, L.A.; Daran, J.M.; van Maris, A.J.A.; Pronk, J.T.; Dickinson, J.R. The Ehrlich pathway for fusel alcohol production: A century of research on Saccharomyces cerevisiae metabolism. Appl. Environ. Microbiol. 2008, 74, 2259–2266. [Google Scholar] [PubMed]
  43. Martínez-García, R.; García-Martínez, T.; Puig-Pujol, A.; Mauricio, J.C.; Moreno, J. Changes in sparkling wine aroma during the second fermentation under CO2 pressure in sealed bottle. Food Chem. 2017, 237, 1030–1040. [Google Scholar] [CrossRef] [PubMed]
  44. Vilanova, M.; Martínez, C. First study of determination of aromatic compounds of red wine from Vitis vinifera cv. Castañal grown in Galicia (NW Spain). Eur. Food Res. Technol. 2007, 224, 431–436. [Google Scholar]
  45. Peinado, R.A.; Moreno, J.; Bueno, J.E.; Moreno, J.A.; Mauricio, J.C. Comparative study of aromatic compounds in two young white wines subjected to pre-fermentative cryomaceration. Food Chem. 2004, 84, 585–590. [Google Scholar] [CrossRef]
  46. Moreno-Arribas, M.V.; Polo, M.C. Wine Chemistry and Biochemistry; Springer: New York, NY, USA, 2009. [Google Scholar]
  47. Cosme, F.; Filipe-Ribeiro, L.; Nunes, F. Wine Stabilisation: An Overview of Defects and Treatments. In Chemistry and Biochemistry of Winemaking, Wine Stabilization and Aging, 1st ed.; IntechOpen: London, UK, 2021; pp. 173–204. [Google Scholar]
  48. Lorrain, B.; Tempere, S.; Iturmendi, N.; Moine, V.; de Revel, G.; Teissedre, P.L. Influence of phenolic compounds on the sensorial perception and volatility of red wine esters in model solution: An insight at the molecular level. Food Chem. 2013, 140, 76–82. [Google Scholar] [CrossRef]
  49. Bartowsky, E.J.; Pretorius, I.S. Microbial Formation and Modification of Flavor and Off-Flavor Compounds in Wine. In Biology of Microorganisms on Grapes, in Must and in Wine; Springer: Berlin/Heidelberg, Germany, 2009; pp. 209–231. [Google Scholar]
  50. Binati, R.L.; Lemos Junior, W.J.F.; Luzzini, G.; Slaghenaufi, D.; Ugliano, M.; Torriani, S. Contribution of non-Saccharomyces yeasts to wine volatile and sensory diversity: A study on Lachancea thermotolerans, Metschnikowia spp. and Starmerella bacillaris strains isolated in Italy. Int. J. Food Microbiol. 2020, 318, 108470. [Google Scholar] [CrossRef]
  51. Balikci, E.K.; Tanguler, H.; Jolly, N.P.; Erten, H. Influence of Lachancea thermotolerans on cv. Emir wine fermentation. Yeast 2016, 33, 313–321. [Google Scholar] [CrossRef] [PubMed]
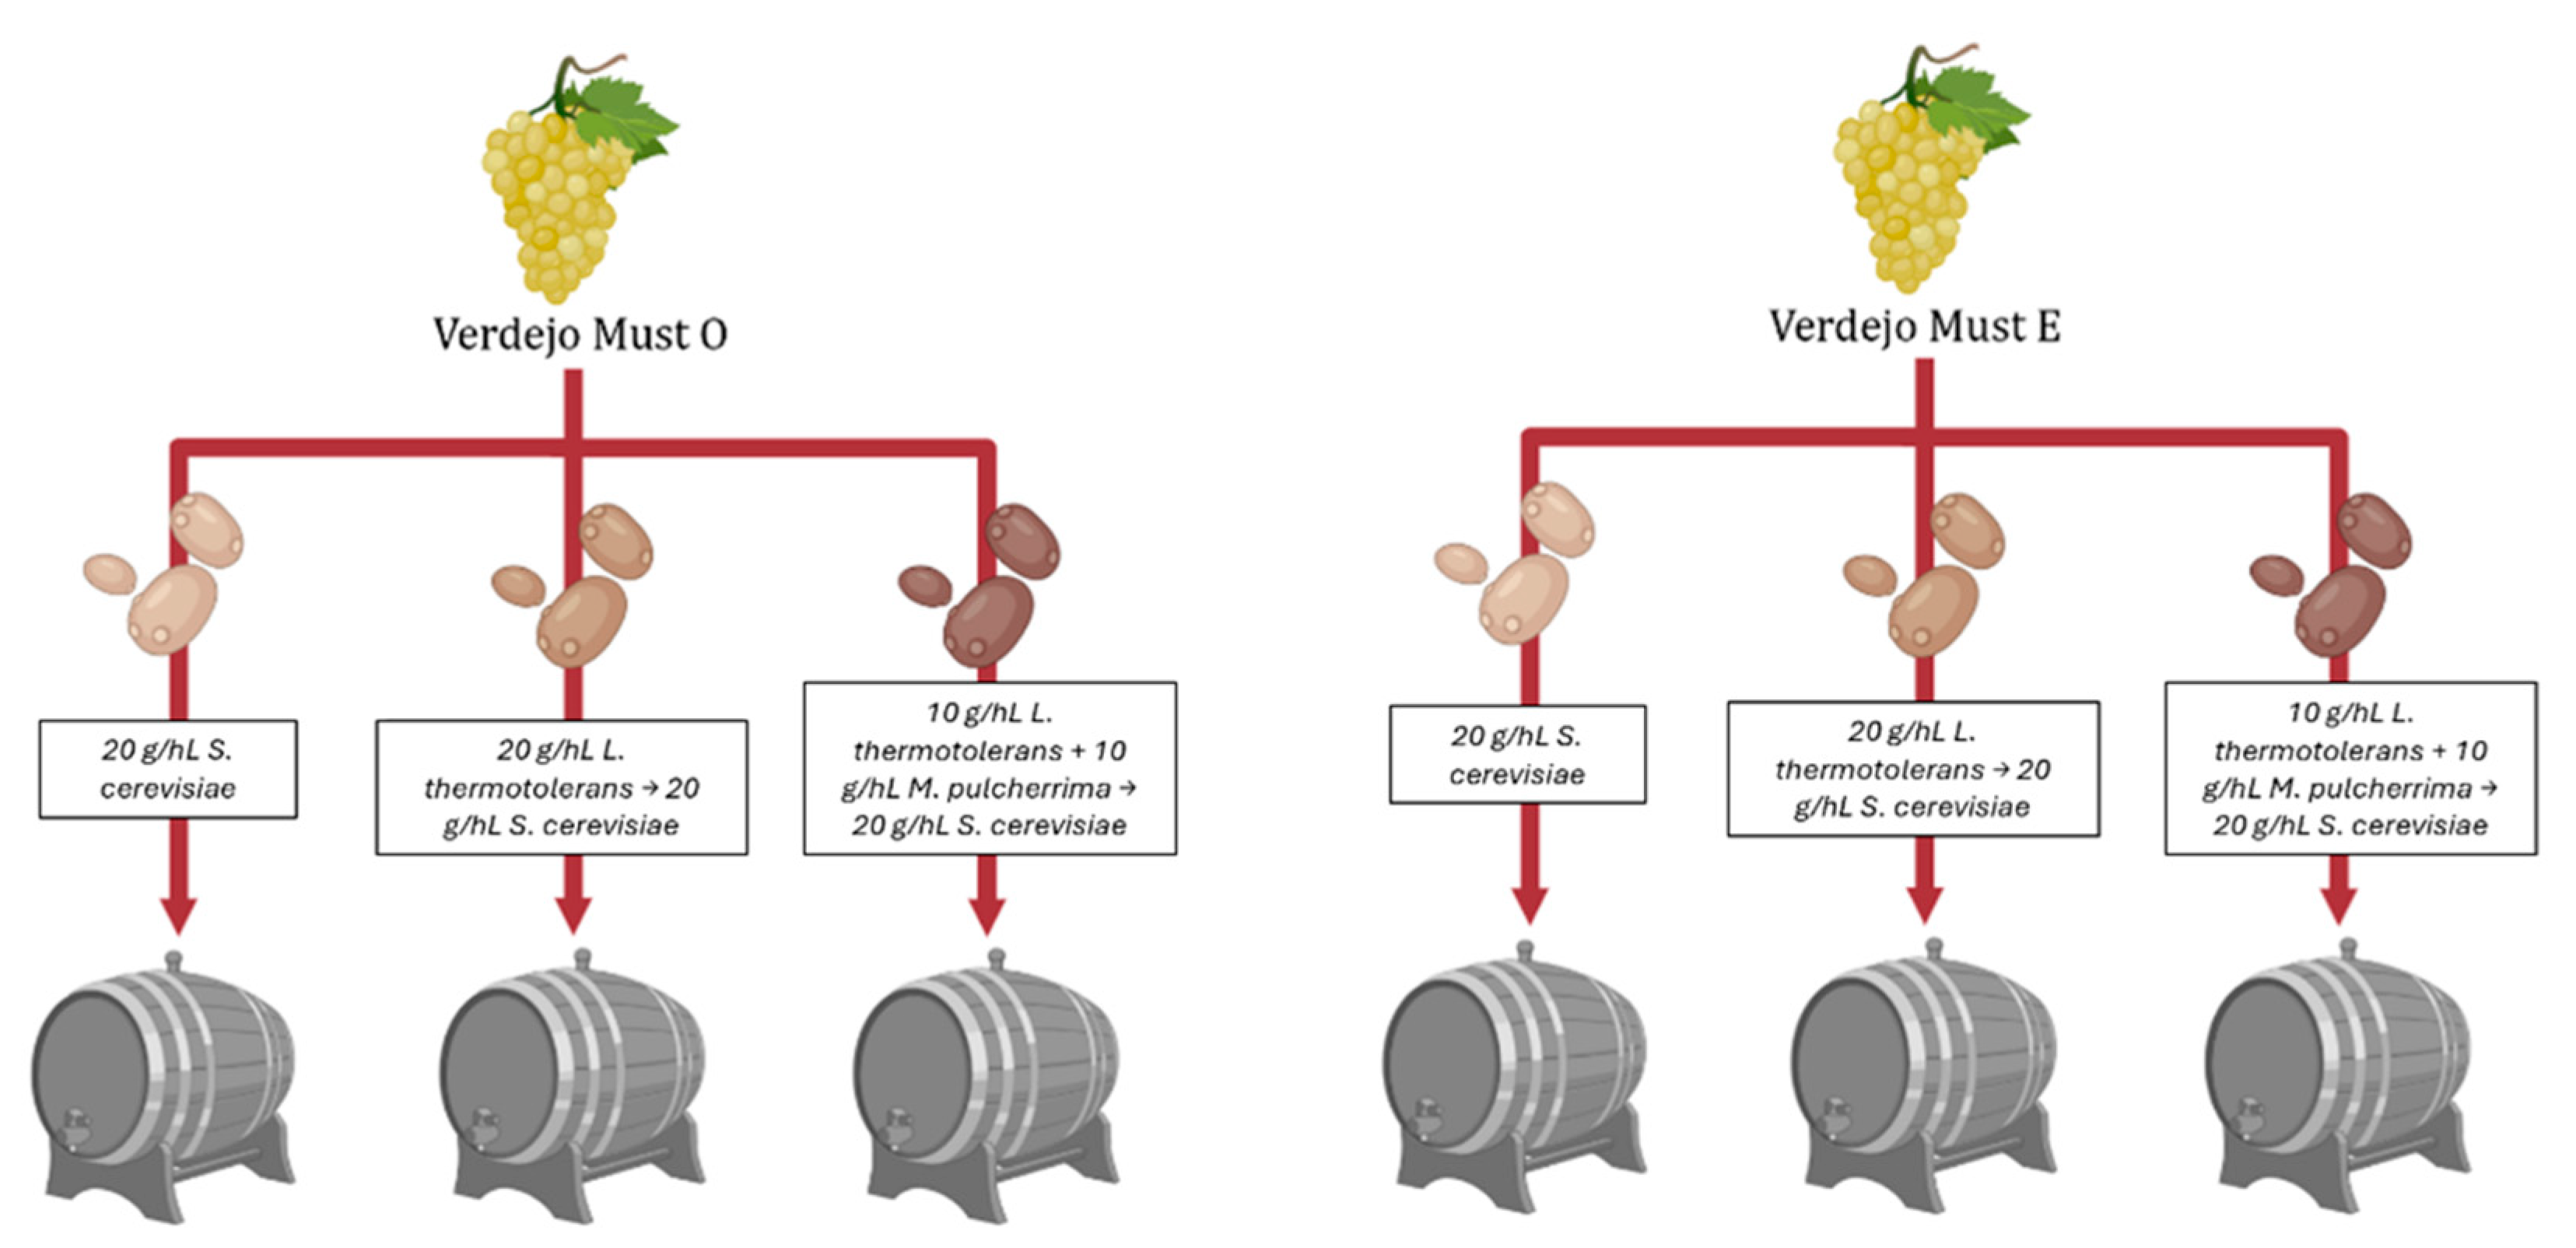
Figure 1. In the experimental design of Verdejo must fermentation trials, two musts (O and E) were inoculated with different yeast combinations: S. cerevisiae (20 g/hL), L. thermotolerans (20 g/hL) followed by S. cerevisiae (20 g/hL) after four days, and a co-inoculation of L. thermotolerans (10 g/hL) and M. pulcherrima (10 g/hL) followed by S. cerevisiae (20 g/hL) after four days, created with BioRender.com (https://www.biorender.com/; accessed on 10 April 2025).
Fermentation 11 00541 g001
Figure 2. Time course of total acidity during fermentation, expressed as tartaric acid (g/L). Wines fermented with S. cerevisiae are shown in red, those fermented with L. thermotolerans in blue and the co-inoculation of L. thermotolerans and M. pulcherrima in green. The dashed line represents the wines made with the musts of the control viticultural strategy, and the solid line represents the wines made with the musts of the E viticultural strategy. Values between which there is no significant difference (p > 0.05) according to Tukey’s test are indicated with the same letter.
Fermentation 11 00541 g002
Figure 3. Concentration of malic acid at the end of fermentation (above) and evolution of lactic acid concentration during fermentation (below). Wines fermented with S. cerevisiae are shown in red, those fermented with L. thermotolerans in blue and those fermented with L. thermotolerans and M. pulcherrima in green. The solid lines represent the wines made with the musts of the control viticultural strategy, and the dashed lines represent the wines made with the musts of the E viticultural strategy. Values between which there is no significant difference (p > 0.05) according to Tukey’s test are indicated with the same letter.
Fermentation 11 00541 g003
Figure 4. Principal component analysis was performed on the concentrations of volatile compounds measured with GC-FID. Cluster 1 groups the O-S. cerevisiae (O-SC), E-S. cerevisiae (E-SC), E-L. thermotolerans (E-LT) and E-L. thermotolerans + M. pulcherrima (E-LT + MP) strategies. Cluster 2 groups the O-L. thermotolerans (O-LT) and O-L. thermotolerans + M. pulcherrima (O-LT + MP) strategies. The main differences between these two clusters are in the total concentration of volatiles and the concentration of higher alcohols.
Fermentation 11 00541 g004
Figure 5. Correlation matrix indicating Pearson’s coefficients calculated from the measured parameters.
Fermentation 11 00541 g005
Figure 6. Spider graph showing the results of the sensory analysis conducted by eight judges. Wines fermented with S. cerevisiae are shown in red, those fermented with L. thermotolerans in blue and those fermented with L. thermotolerans and M. pulcherrima in green. The solid lines represent the wines made with the musts of the control viticultural strategy, and the dashed lines represent the wines made with the musts of the E viticultural strategy. Values between which there is no significant difference (p > 0.05) according to Tukey’s test are indicated with the same letter.
Fermentation 11 00541 g006
Table 1. Chemical composition of the musts before inoculation.
Must OMust E
Density (g/L)10951096
Brix degree (°)22.823
pH3.643.71
Free SO2 (mg/L)100
Total SO2 (mg/L)400
Cu2+ (mg/L)1.61.2
Total acidity expressed as tartaric acid (g/L)5.765.03
Malic acid (g/L)2.31.6
α-NH2 nitrogen (mg/L)238333
NH4 nitrogen (mg/L)8392
Table 2. General oenological parameters at the end of fermentation. Values between which there is no significant difference (p > 0.05) according to Tukey’s test are indicated with the same letter. Ethanol content, pH, glucose plus fructose, and volatile acidity were determined using infrared spectroscopy. The concentrations of malic acid and lactic acid were measured by enzymatic analysis. Values are expressed as mean ± standard deviation (n = 2).
StrategyEthanol (%vol)pHGlucose Plus
Fructose (g/L)
Volatile Acidity (g/L Acetic Acid)Malic Acid (g/L)Lactic Acid (g/L)
O-S. cerevisiae12.8 ± 0.0 a3.66 ± 0.03 c5.9 ± 0.1 b0.420 ± 0.009 a2.48 ± 0.05 b0.000 ± 0.000 a
O-L. thermotolerans12.8 ± 0.0 a3.49 ± 0.00 a 3.8 ± 0.4 ab0.425 ± 0.009 a2.16 ± 0.08 b2.510 ± 0.028 c
O-L. thermotolerans + M. pulcherrima12.8 ± 0.2 a3.56 ± 0.01 b 3.7 ± 0.6 ab0.380 ± 0.009 a2.23 ± 0.04 b1.150 ± 0.028 b
E-S. cerevisiae13.3 ± 0.4 b3.79 ± 0.00 d2.7 ± 0.1 a0.555 ± 0.009 b1.805 ± 0.021 a0.000 ± 0.000 a
E-L. thermotolerans13.5 ± 0.1 b3.57 ± 0.00 b5.3 ± 1.3 ab0.510 ± 0.009 b1.62 ± 0.05 a2.255 ± 0.078 c
E-L. thermotolerans + M. pulcherrima13.3 ± 0.6 b3.65 ± 0.01 c3.5 ± 0.4 ab0.395 ± 0.009 a1.74 ± 0.10 a1.19 ± 0.10 b
Table 3. Colourimetric parameters of the wine samples analysed. Values between which there is no significant difference (p > 0.05) according to Tukey’s test are indicated with the same letter. Values are expressed as mean ± standard deviation (n = 2).
WineColour Intensity (Absorbance Units)Tonality (Adimensional)ChromaHue (°)Lab
O-S. cerevisiae0.54 ± 0.08 a1.82 ± 0.10 abc11.5 ± 1.7 a93.4 ± 0.3 ab87.9 ± 1.9 ab−0.6 ± 0.6 ab11.45 ± 1.8 ab
O-L. thermotolerans0.604 ± 0.007 a1.528 ± 0.011 ab10.69 ± 0.18 a89.4 ± 1.1 ab85.6 ± 0.6 ab0.11 ± 0.24 b10.69 ± 0.18 a
O-L. thermotolerans + M. pulcherrima0.71 ± 0.07 a1.37 ± 0.03 a10.40 ± 0.13 a86.3 ± 0.3 a82.4 ± 1.7 a0.70 ± 0.05 b10.38 ± 0.13 a
E-S. cerevisiae0.36 ± 0.03 a2.13 ± 0.23 bcd10.7 ± 0.7 a92.5 ± 0.3 ab92.6 ± 1.0 b−0.48 ± 0.13 ab10.7 ± 0.7 a
E-L. thermotolerans0.37 ± 0.11 a2.86 ± 0.00 d16.4 ± 0.9 b96.3 ± 0.6 b94 ± 3 b−1.79 ± 0.05 a16.3 ± 0.9 b
E-L. thermotolerans + M. pulcherrima0.51 ± 0.04 a2.37 ± 0.05 cd15.4 ± 1.1 b92.8 ± 0.6 ab90.0 ± 0.8 ab−0.8 ± 0.3 ab15.4 ± 1.0 ab
Table 4. Concentration of the volatile compounds analysed by GC-FID expressed as mean ± standard deviation of duplicates (mg/L). The codes represent: O-S. cerevisiae (O-SC), O-L. thermotolerans (O-LT), O-L. thermotolerans + M. pulcherrima (O-LT + MP), E-S. cerevisiae (E-SC), E-L. thermotolerans (E-LT) and E-L. thermotolerans + M. pulcherrima (E-LT + MP). Values between which there is no significant difference (p > 0.05) according to Tukey’s test are indicated with the same letter.
Compounds (mg/L)O-SCO-LTO-LT + MPE-SCE-LTE-LT + MP
Carbonyl compoundsAcetaldehyde42.6 ± 2.1 a37.9 ± 2.0 a26.0 ± 3.0 a43.2 ± 1.4 a40.0 ± 8.0 a37.0 ± 2.0 a
Diacetyl
(butan-2,3-dione)
1.67 ± 0.04 a0.00 ± 0.00 a1.76 ± 0.03 a0.90 ± 0.90 a0.00 ± 0.00 a1.91 ± 0.07 a
Acetoin (3-hydroxybutan-2-one)15.5 ± 2.3 a20.0 ± 4.0 a16.7 ± 1.0 a14.1 ± 0.9 a14.4 ± 1.0 a15.0 ± 0.5 a
2,3-Butanediol (butane-2,3-diol)1280 ± 70 c870 ± 4 ab707 ± 7 a1499 ± 70 c1120 ± 120 bc1260 ± 14 c
Higher alcohols1-Propanol
(propan-1-ol)
102 ± 5 bc60 ± 10 ab50.3 ± 1.1 a110 ± 8 c72 ± 8 abc74 ± 12 abc
Isobutanol
(2-methylpropan-1-ol)
35.0 ± 0.7 a57.0 ± 9.0 a50.5 ± 1.1 a30.9 ± 1.2 a68.0 ± 17.0 a62.0 ± 7.0 a
3-Methyl-1-butanol
(2-methylbutan-1-ol)
160.0 ± 3.0 a158.0 ± 22.0 a132.0 ± 1.6 a157.0 ± 14.0 a190.0 ± 40.0 a162.0 ± 18.0 a
2-Methyl-1-butanol
(3-methylbutan-1-ol)
53.0 ± 3.0 a67.0 ± 8.0 a57.3 ± 0.9 a37.0 ± 2.0 a72.0 ± 14.0 a68.0 ± 13.0 a
Hexanol (hexan-1-ol)4.30 ± 0.20 a4.27 ± 0.18 a4.44 ± 0.08 a3.82 ± 0.01 a4.80 ± 0.50 a4.42 ± 0.27 a
2-Phenyl ethanol (2-phenylethanol)12.3 ± 0.4 a13.0 ± 1.8 a12.6 ± 0.3 a11.7 ± 0.6 a12.6 ± 1.8 a12.8 ± 1.3 a
Total higher alcohols332 ± 16 a300 ± 60 a257 ± 2 a320 ± 40 a350 ± 100 a320 ± 60 a
EstersEthyl acetate106 ± 3 a127 ± 20 a92 ± 7 a101 ± 3 a190 ± 50 a135 ± 7 a
Isobutyl acetate0.00 ± 0.00 a0.00 ± 0.00 a0.0 ± 0.00 a3.30 ± 1.30 a2.20 ± 2.20 a1.65 ± 0.08 a
Ethyl butyrate1.82 ± 0.19 a0.90 ± 0.90 a1.98 ± 0.06 a0.80 ± 0.80 a1.20 ± 1.20 a2.12 ± 0.19 a
Ethyl lactate (2-hydroxypropanoate)52 ± 11 a32 ± 16 a23 ± 15 a21 ± 15 a22 ± 3 a18 ± 10 a
Isoamyl acetate 8.10 ± 0.70 a7.80 ± 0.90 a6.47 ± 0.23 a6.50 ± 0.30 a9.80 ± 1.30 a9.70 ± 0.60 a
2-Phenylethyl acetate6.14 ± 0.00 a7.50 ± 0.90 a8.01 ± 0.06 a5.57 ± 0.08 a6.20 ± 0.40 a6.40 ± 0.40 a
Total esters175 ± 20 a180 ± 50 a132 ± 10 a138 ± 5 a230 ± 80 a175 ± 3 a
Methanol75.8 ± 0.2 a81.0 ± 24.0 a70.4 ± 1.5 a68.0 ± 3.0 a110.0 ± 30.0 a90.0 ± 13.0 a
Total volatile1960 ± 50 b1540 ± 80 ab1263 ± 7 a2020 ± 100 b1900 ± 300 b1970 ± 50 b
Disclaimer/Publisher’s Note: The statements, opinions and data contained in all publications are solely those of the individual author(s) and contributor(s) and not of MDPI and/or the editor(s). MDPI and/or the editor(s) disclaim responsibility for any injury to people or property resulting from any ideas, methods, instructions or products referred to in the content.