Article

The Construction of Corynebacterium glutamicum for Producing γ-Aminobutyric Acid and Analysis of the Fermentation Process

School of Life and Health Sciences, Hubei University of Technology, Wuhan 430068, China
*
Author to whom correspondence should be addressed.
Fermentation 2025, 11(9), 534; https://doi.org/10.3390/fermentation11090534
Submission received: 4 July 2025 / Revised: 6 September 2025 / Accepted: 9 September 2025 / Published: 13 September 2025
(This article belongs to the Section Microbial Metabolism, Physiology & Genetics)

Abstract

In this study, we constructed a recombinant Corynebacterium glutamicum strain for γ-aminobutyric acid (GABA) biosynthesis via the heterologous expression of glutamate decarboxylase (GAD) derived from Lactiplantibacillus plantarum. We systematically analyzed the fermentation strategy, the balance between cell growth and GAD expression, and the intracellular and extracellular glutamate and GABA levels during fermentation in recombinant C. glutamicum. The results demonstrated that a fermentation strategy combining variable-rate feeding with two-stage pH control at an initial glucose concentration of 50 g/L effectively enhanced cell proliferation, facilitated continuous glutamate synthesis and improved the catalytic efficiency of GAD. The intracellular and extracellular GABA synthesis improved up to 3.231 ± 0.024 g/L (a six-fold increase compared to the uncontrolled supplementation conditions). Furthermore, we fitted empirical equations relating cell growth, glucose consumption, GAD activity, and GABA synthesis during the fermentation. The maximum specific growth rate, glucose consumption rate, and GABA synthesis rate of recombinant C. glutamicum were 0.316 h−1, 1.407 g/(g∙h), and 0.0697 g/L/h, respectively. The fermentation regulation strategy and the dynamic analysis of the fermentation process in this study provide support for future metabolic regulation strategies.

1. Introduction

Gamma-aminobutyric acid (GABA) is a significant four-carbon non-protein amino acid ubiquitously distributed in plants, animals, and microorganisms [1,2]. As the primary inhibitory neurotransmitter in the mammalian central nervous system, GABA regulates various physiological processes and exhibits significant potential for applications in functional foods [3], chemical industries [4,5], pharmaceuticals [6,7,8] and animal feed [9,10], which has sparked considerable research interest in recent years [11,12]. Currently, the industrial production methods of GABA primarily encompass chemical synthesis [13], plant enrichment [14,15] and biosynthesis [16]. The biosynthesis method poses distinct advantages, including low raw material costs, mild reaction conditions, and environmental sustainability, rendering it an ideal approach for GABA production.
The biosynthesis of GABA involves the irreversible decarboxylation of the prerequisite glutamate by microbial fermentation of glutamic acid decarboxylase to produce GABA [17]. Several species, including Escherichia coli, Lactobacillus species, and Saccharomyces cerevisiae, have been used for GABA production through exogenous addition of glutamic acid. GAD derived from lactic acid bacteria naturally exists in acidic environments and can evolve to exhibit stronger low pH stability and activity [18]. Sangkaran et al. [16] conducted a comprehensive synthesis of research findings on GABA biosynthesis in lactic acid bacteria (LAB). Their systematic review critically evaluates optimization strategies for enhancing GABA concentration, including fermentation conditions, mode of fermentation, two-stage fermentation, co-culturing approach, immobilization technique and genetic engineering, all of which are elaborated in detail. Compared to GAD from other microbial sources, Lactiplantibacillus plantarum-derived GAD possesses distinct functional advantages, including a broader pH stability range (retaining activity across pH 4.0–5.5), enhanced thermostability at moderate temperatures (30–42 °C), and higher substrate affinity for glutamate. These advantageous characteristics, coupled with its metabolic compatibility with complex fermentation systems, render L. plantarum GAD a highly promising enzymatic resource for efficient GABA biosynthesis [19,20]. As a food-grade safe bacterium, Corynebacterium glutamicum is remarkable for exceptional glutamate production capacity, which offers significant potential for enhanced GABA production [21]. Shi et al. [22] successfully engineered C. glutamicum strains by co-expressing two glutamate decarboxylase (GAD) encoding genes, gadB1 and gadB2. This genetic modification facilitated the creation of a one-step biosynthetic platform for the production of GABA.
However, the key challenge in the direct synthesis of GABA from glucose is the delicate balance between GAD activity and C. glutamicum growth. GABA production is constrained by the significant difference between the optimal pH for GAD activity (pH 4.5) and the optimal pH for C. glutamicum growth (pH 7.0) [23]. This discrepancy contributes to inefficient carbon source utilization, hampering the potential for GABA concentration improvement in industrial fermentation processes. Currently, limited studies have been conducted on the catalytic process of GAD, the optimization of fermentation conditions, and the dynamics of key metabolites during the fermentation of recombinant C. glutamicum. This gap in research leads to unresolved challenges in addressing the imbalance between cell growth and enzyme expression. By clarifying the catalytic process underlying GABA synthesis and establishing empirical equations that quantify relationships between fermentation variables, the dynamic status of GABA biosynthesis can be more precisely visualized. Such insights are essential for enabling timely, data-driven adjustments to fermentation conditions, thereby maintaining or enhancing production efficiency.
In this study, we focused on the dynamic environmental regulation of the recombinant C. glutamicum fermentation process, and balanced the carbon source utilization efficiency by real-time regulation of the replenishment rate in synchronization with the cellular metabolic demand. A two-stage regulation strategy was employed to dynamically switch the carbon flow from the growth-related pathway (TCA cycle) to the GABA synthesis pathway [24]. Ultimately, we fitted the relevant empirical equation. This fermentation strategy can significantly improve the concentration of GABA and the conversion rate of Glu, providing a basis for industrial production.

2. Materials and Methods

2.1. Heterologous Expression

C. glutamicum ATCC13032 and shuttle plasmid pXMJ19-SP-MCS with SD sequences (SD), signal peptide (SP) and cleavage sites (MCS) were used for expression of GAD derived from L. plantarum CPRGJ. The GAD (MCF97533.1) was amplified from the genomic DNA of L. plantarum CPRGJ using F primer (5′-TACCTACCATCCAGATTGC-3′, BamH I) and R primer (5′-CGTCAGAATTAGGATGATGC-3′, Xho I). The purified PCR product was introduced into the pXMJ19-SP-MCS vector using the BamH I and Xho I digestion and ligation to form the plasmid pXMJ19-SP-MCS-GAD, which was introduced into C. glutamicum ATCC13032 for GABA production. Sample testing was provided by Sangon Biotech (Shanghai, China).

2.2. Culture Condition

The strain was activated in LBHIS medium (2.5 g/L yeast extract, 38.5 g/L brain heart infusion powder and 91 g/L sorbitol) [25]. The primary and secondary seed medium contains 30 g/L glucose, 25 g/L corn steep liquor, 1 g/L KH2PO4, 1 g/L MgSO4∙7H2O, 8 g/L offsetting urea [26]. The fermentation was carried out in 2 L shake flasks containing 200 mL of fermentation medium. The initial fermentation medium contains 100 g/L glucose, 2 g/L corn steep liquor, 2 g/L KH2PO4, 0.4 g/L MgSO4∙7H2O, 0.02 g/L MnSO4, 0.02 g/L FeSO4, 4 g/L offsetting urea [27]. The feeding solution contains 300 g/L glucose and 200 g/L urea. Where necessary, chloramphenicol and isopropyl-β-D-1-thiogalactopyranoside (IPTG) were supplemented in the medium to the final concentrations of 20 μg/mL and 0.01 mM, respectively.

2.3. Fed-Batch Fermentation

2.3.1. Culture Conditions

In the fed-batch fermentation process, recombinant C. glutamicum was initially cultured on LBHIS solid medium at 37 °C overnight. Single colonies were then transferred into 500 mL shake flasks containing 50 mL of seed medium and cultured at 37 °C and 220 rpm for 24 h. The seed culture was subsequently inoculated at 10% (v/v) into a 2 L shake flask containing 200 mL of fermentation medium, with an initial OD600 of 1.6, and cultivated under the same conditions for 12 to 24 h. Afterward, the culture was transferred into a 5 L fermenter (BXBIO, Shanghai, China) with 1.2 L of fermentation medium using a 10% (v/v) inoculum size. During the fermentation process, dissolved oxygen (DO) concentration was maintained within the range of 20–30% via coordinated regulation of aeration and agitation. The initial aeration rate was set at 0.8 vvm, with the stirring speed fixed at 550 rpm, subsequently adjusted based on dissolved oxygen levels. The fermentation temperature was strictly controlled at 37 °C using the bioreactor’s built-in thermal control system. For pH homeostasis, a neutral fermentation environment was sustained by the slow fed-batch addition of a urea solution. The urea feed rate was dynamically adjusted based on real-time pH monitoring data to avoid transient pH fluctuations and ensure stable maintenance of the neutral pH milieu. If necessary, 0.1 mM IPTG was supplemented into the medium 12 h after inoculation. Carbon source supplementation was carried out by flow-through addition of glucose.

2.3.2. Effect of Initial Glucose Concentration on the Fermentation Process

In the inducible recombinant C. glutamicum, the inducer IPTG only becomes effective after a certain amount of glucose is consumed. To overcome the negative effect of high glucose concentration, under otherwise consistent fermentation conditions, initial glucose concentrations were set at 30 g/L, 50 g/L, and 70 g/L, and fermentation was conducted for 48 h. The glutamate concentration was monitored throughout the fermentation to determine the optimal initial glucose concentration and supplementation time.

2.3.3. Glucose-Controlled Culture

During high-density fermentation, the periodic supplementation of nutrients can avert depletion, enabling Glu levels to reach its maximum potential, but an excessive addition of glucose adversely influences the induced expression of the GAD enzyme. Therefore, maintaining an optimal balance between glucose concentration and the induced expression of IPTG is essential for the success of this fermentation process [28]. Following the determination of the optimal initial glucose concentration, we compared two replenishment strategies: (i) once the initial carbon source was depleted in the fed-batch process, the feed rate was meticulously regulated within the range of 0.2 mL/min. (uniform-speed) and (ii) a demand-driven feed governed by on-line glucose control to sustain the residual concentration at 2 g/L (variable-speed) to determine the optimal feeding conditions for cell growth and glutamate synthesis.

2.3.4. Effect of Different pH Control Stages on the Fermentation Process

C. glutamicum synthesizes substantial quantities of glutamate in a neutral environment and secretes it through membrane channels to the extracellular space [29]. L. plantarum typically thrives and carries out its metabolic activities under acidic conditions, which renders the majority of GAD enzymes derived from L. plantarum more active and stable in acidic environments [30]. The optimal pH for GAD in L. plantarum has been widely documented to fall within the range of 4.5 to 6.5. Therefore, we proceeded to investigate the impact of different pH controls (constant pH control, subsquent lack of pH control and two-stage pH control) on the synthesis of Glu with GABA. During the initial 36 h of fermentation, the pH was maintained between 7.0 and 7.2 through the continuous addition of urea. The constant pH control strategy involves continuous urea feeding after 36 h to maintain the pH within the range of 7.0 and 7.2. In contrast, the subsequent lack of pH control strategy entails the cessation of urea feeding after 36 h. For the two-stage pH control strategy, urea feeding is stopped at 36 h, and the initiation of 2M dilute sulfuric acid feeding is implemented to maintain the pH at approximately 4.5. Samples were collected at 6 h intervals to assess the corresponding parameters.

2.3.5. Analytical Methods

Cell growth of C. glutamicum was monitored by measuring the optical density at 600 nm using a UV-VIS spectrophotometer (Thermo Scientific Evolution 300, Thermo Fisher Scientific, Westborough, MA, USA). During fermentation, an appropriate volume of culture broth was harvested and centrifuged at 6000 rpm and 4 °C for 10 min (Cence H1750R, Hunan Xiangyi Laboratory Instrument Development Co., Ltd., Changsha, China). The supernatants were used for measuring the concentrations of glucose, Glu and GABA. The precipitate was washed twice with disodium phosphate-citrate buffer (50 mM, pH 7.4) and then disrupted using an Ultrasonic crusher (SciEnTZ-IID, Ningbo Scientz Biotechnology Co., Ltd., Ningbo, China) at 4 °C for 13 min; the cell debris was discarded by centrifugation at 6000 rpm for 10 min and used for the detection of GAD, intracellular Glu and GABA. Glucose was measured using an SBA-40E (Biology Institute of Shandong Academy of Sciences, Jinan, China). The Glu and GABA concentrations were quantified using reversed phase high-pressure liquid chromatography (Wooking, Wukong Scientific Instruments (Shanghai) Co., Ltd., Shanghai, China), equipped with a Welchrom ODS C18 column (4.6 × 250 mm, 5 μm, Welch Materials, Inc., Shanghai, China), employing the DEEMM pre-column derivatization method. The Glu and GABA were detected at 284 nm, and the column was kept at 35 °C [31,32]. GAD enzyme activity was determined based on the concentration of GABA generated, which was measured specifically via the Berthelot colorimetric assay. One unit (U) of GAD activity was defined as the amount of enzyme required to catalyze the formation of 1 μmol of GABA in a 1 mL reaction mixture at 65 °C for 1 h. The specific activity of GAD was expressed as units of enzyme activity per milligram of total protein (U/mg). Total protein concentration in the reaction mixture was quantified using the Bradford assay, with bovine serum albumin (BSA) serving as the standard protein [33].

2.4. Empirical Correlation Equations of Fermentation Process

2.4.1. Empirical Correlation Equation of Cell Growth

The logistic equation represents a quintessential S-shaped curve, effectively illustrating the inhibitory impact of increasing bacterial concentration on its own growth. pH-regulated cell growth is inhibited, so we established a segmented cell growth equation. We first smoothed the experimental fluctuations using moving average preprocessing, and then MATLAB 2024a software was used to select the Logistic model for nonlinear fitting. The cell growth model of the fermentation process was established as follows:
y 1 = a 1 b 1 1 + t t 0 p + b 1 ,   t t p e a k a 2 e t b 2 + c 2 ,   t > t p e a k ,
where y1 is the biomass, t represents the fermentation time, while a1, b1, a2, b2, c2, and t0 are empirical parameters.

2.4.2. Empirical Correlation Equation of Glucose Consumption

We first smoothed the experimental fluctuations using moving average preprocessing, and then MATLAB 2024a software was used to select the Exponential model for nonlinear fitting. The substrate depletion model of glucose consumption was established as follows:
y 2 = a e t b + c ,
where y2 is the concentration of glucose, t represents the fermentation time, while a, b and c are empirical parameters.

2.4.3. Empirical Correlation Equation of GAD Activity

We first smoothed the experimental fluctuations using moving average preprocessing, and then MATLAB 2024a software was used to select the Gauss model for nonlinear fitting. The GAD activity model was established as follows:
y 3 = a 1 e t b 1 c 1 2 ,
where y3 is specific enzyme activity of GAD at each time period, t represents the fermentation time, while a1, b1, and c1 are empirical parameters.

2.4.4. Empirical Correlation Equation of GABA Production

We first smoothed the experimental fluctuations using moving average preprocessing, and then MATLAB 2024a software was used to select the Gauss model for nonlinear fitting. The product synthesis model of the GABA was established as follows:
y 4 = a 1 e t b 1 c 1 2 ,
where y4 is the concentration of GABA, t represents the fermentation time, while a1, b1, and c1 are empirical parameters.

2.5. Statistical Analysis

All statistical analyses were performed using GraphPad Prism 10.0 software. For quantitative comparisons between groups, two-way analysis of variance (two-way ANOVA) was applied to assess the effects of independent variables, followed by Tukey’s post hoc test to determine pairwise differences between groups. Statistical significance was defined as a p-value less than 0.05 (p < 0.05). All experiments were conducted with biological replicates (n = 3) to ensure the reliability and reproducibility of results. In figures, data are presented as the mean ± standard deviation (SD), with error bars representing the standard deviation of the biological replicates.

3. Results and Discussion

3.1. Construction of C. glutamicum for Producing GABA

Recombinant strain of C. glutamicum was engineered to heterologously express the glutamic acid decarboxylase gene from L. plantarum CPRGJ. The gad sequence was amplified from the genomic DNA of L. plantarum CPRGJ using conventional PCR. The resulting pXMJ19-SP-MCS-GAD plasmid was introduced into C. glutamicum ATCC13032 to obtain the GABA-producing strain ATCC13032-pXMJ19-SP-MCS-GAD. The success of the transformation was verified by PCR of the recombinant plasmid purified from C. glutamicum ATCC13032-pXMJ19-SP-MCS-GAD. As shown in Figure 1, the target band of glutamic acid decarboxylase was 2180 bp, confirming that the GABA-producing C. glutamicum was successfully constructed.

3.2. Production of GABA by Recombinant C. glutamicum in Fed-Batch Fermentation

3.2.1. Effect of Different Initial Glucose Concentrations on the Fermentation Process

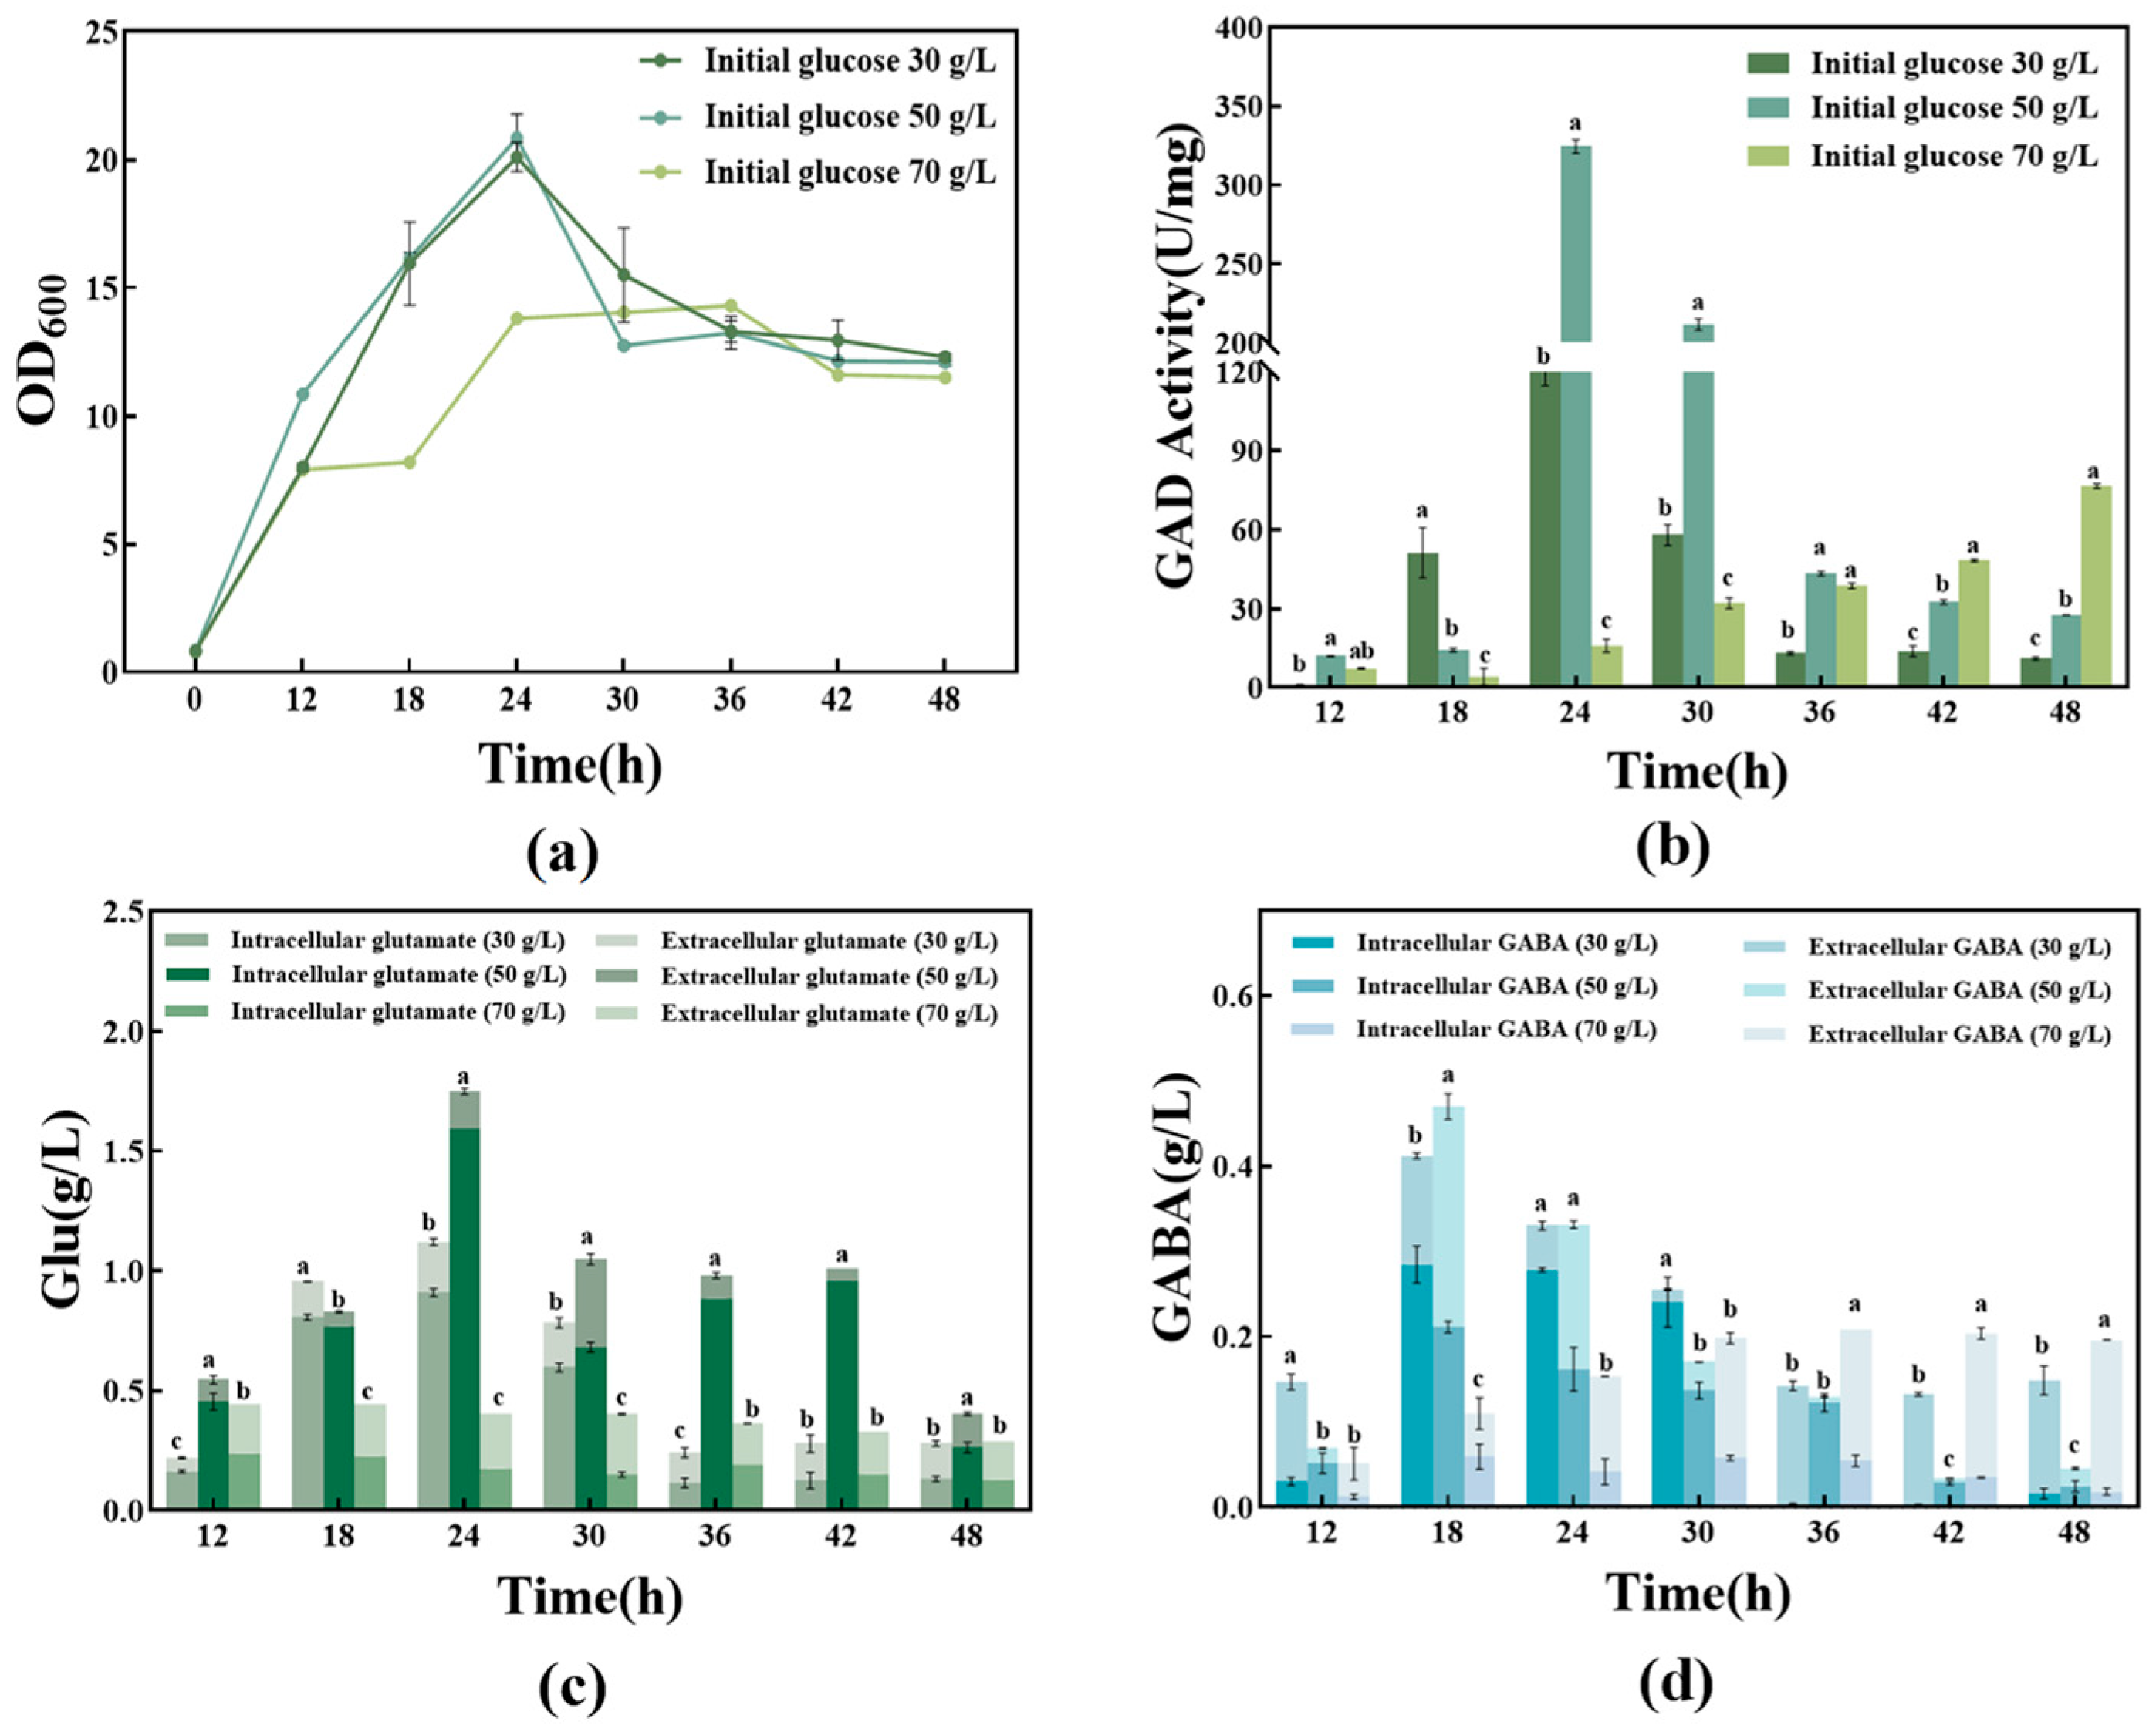
We systematically investigated the correlation between initial glucose concentrations and both biomass accumulation and GAD expression levels. Additionally, the dynamic process of Glu conversion into GABA was examined under conditions without supplementation.
Figure 2 shows the glucose consumption curve during fermentation. At initial glucose concentrations of 30 and 50 g/L, glucose was almost completely consumed within 24 h, with only 0.2 g/L of residual glucose remaining. Therefore, glucose should be replenished within 18–24 h. When the initial glucose concentration was 70 g/L, a significant amount of glucose remained in the fermentation broth, indicating that glucose was present at a supersaturated concentration.
As shown in Table 1, the glucose utilization rate reached 99% at initial concentrations of 30 and 50 g/L, whereas at 70 g/L, the rate dropped to 80%. The phenomenon likely arises from the glucose uptake mechanism in C. glutamicum through the phosphotransferase system (PTS), which achieves substrate saturation at concentrations approaching the Km value [34]. When initial glucose concentrations surpass PTS transport capacity, residual glucose accumulation induces osmotic stress-mediated ATP diversion from biosynthesis to osmoregulation, coupled with a reduction in the activity of transporter proteins at the cell membrane, ultimately forcing metabolic flux redistribution toward energy-sparing pathways with reduced glucose utilization efficiency [35,36]. These results indicate that the recombinant C. glutamicum achieves glucose saturation at approximately 50 g/L initial glucose concentration, where the PTS transport operates at maximal transport capacity and glucose utilization efficiency reached a maximum.
Figure 3 shows the dynamic process of cell growth, GAD activity, and Glu/GABA synthesis under different initial glucose concentrations. As shown in Figure 3a,b, during the fermentation process, the cell growth and GAD activity exhibit a similar trend, characterized by an initial increase followed by a decline, which aligns with the conventional pattern of microbial growth [37]. Cells exhibit rapid growth during the initial phase of fermentation, with biomass accumulation peaking at 24 h. When the initial glucose concentration was 30 g/L, cell growth reached an OD600 of 20 within the first 24 h of fermentation, and GAD activity reached a maximum of 120 U/mg. When the initial glucose concentration was 50 g/L, cell growth (OD600) reached 22 within 24 h, and GAD enzyme activity reached a maximum of 300 U/mg. After 24 h of fermentation, significant cell death occurred, with a corresponding decrease in enzyme activity. Thus, sustained glucose supplementation is necessary to maintain growth-coupled metabolic fluxes and prevent substrate limitation-induced growth arrest. At an initial glucose concentration of 70 g/L, cell growth reached a maximum OD600 of 15, while GAD activity reached a peak of less than 80 U/mg. Compared with the initial glucose concentration of 50 g/L, the maximum cell biomass and peak GAD activity declined by approximately 31.82% and 73.3%, respectively. This is because under high glucose, repressor proteins may bind to GAD gene promoters, repressing GAD expression as cells prioritize glucose metabolism over glutamate decarboxylation. This repression continues until glucose is depleted, allowing GAD expression to recover and support GABA production [38].
Figure 3c,d demonstrate the relationship between Glu and GABA synthesis at different initial glucose concentrations. A substantial amount of Glu was synthesized within the initial 24 h, during which GAD concurrently catalyzed its conversion into GABA. Thus, the processes of Glu synthesis and conversion occurred in tandem. The highest amounts of Glu and GABA were attained at an initial glucose concentration of 50 g/L under identical fermentation conditions without any supplementation, indicating more vigorous cellular growth and metabolic activity at this concentration compared to other glucose levels. This aligns with reports that moderate glucose availability in C. glutamicum enhances carbon flow through the TCA cycle to support glutamate accumulation [39]. In C. glutamicum, glutamate synthesis may occur intracellularly, followed by activation via biotin and other mechanisms that stimulate the mechanosensitive channel MSCCG in the cell membrane, which subsequently induces glutamate efflux [40]. GABA production occurs via two pathways: GAD-mediated intracellular decarboxylation of endogenous glutamate, and transmembrane cycling via the Glu/GABA antiporter that imports extracellular glutamate for decarboxylation while exporting resultant GABA [41]. Consequently, extracellular glutamate gradually decreased during the later stages of fermentation, while the concentration of extracellular GABA exceeded that of its intracellular counterpart.
When the initial glucose concentration was elevated to 70 g/L, a marked reduction in GABA export efficiency was observed, with only limited extracellular GABA accumulation. This phenomenon is attributed to the osmotic stress induced by high glucose levels. Osmotic imbalance leads to cellular dehydration, reduced membrane fluidity, and impaired functionality of transmembrane transporters, including the Glu/GABA antiporter. Consequently, the transport capacity for both Glu uptake and GABA export is diminished, directly limiting extracellular GABA accumulation despite ongoing intracellular synthesis [42,43]. The decrease in GABA during the late stages of fermentation may be due to the presence of a GABA uptake system in C. glutamicum. According to genome annotation, the C. glutamicum ATCC 13032 genome harbors putative gabD (ncgl0462, cg0567) and gabT (ncgl0463, cg0566) genes, suggesting that C. glutamicum may metabolize GABA [44,45].
To optimize glutamate accumulation and avoid cell membrane transporter inhibition under high glucose concentration, glucose feeding regimens will be implemented at 18–24 h post-inoculation in 50 g/L initial glucose fermentations, with subsequent analysis of the fermentation process.

3.2.2. Effect of Different Glucose Supplementation Methods on the Fermentation Process

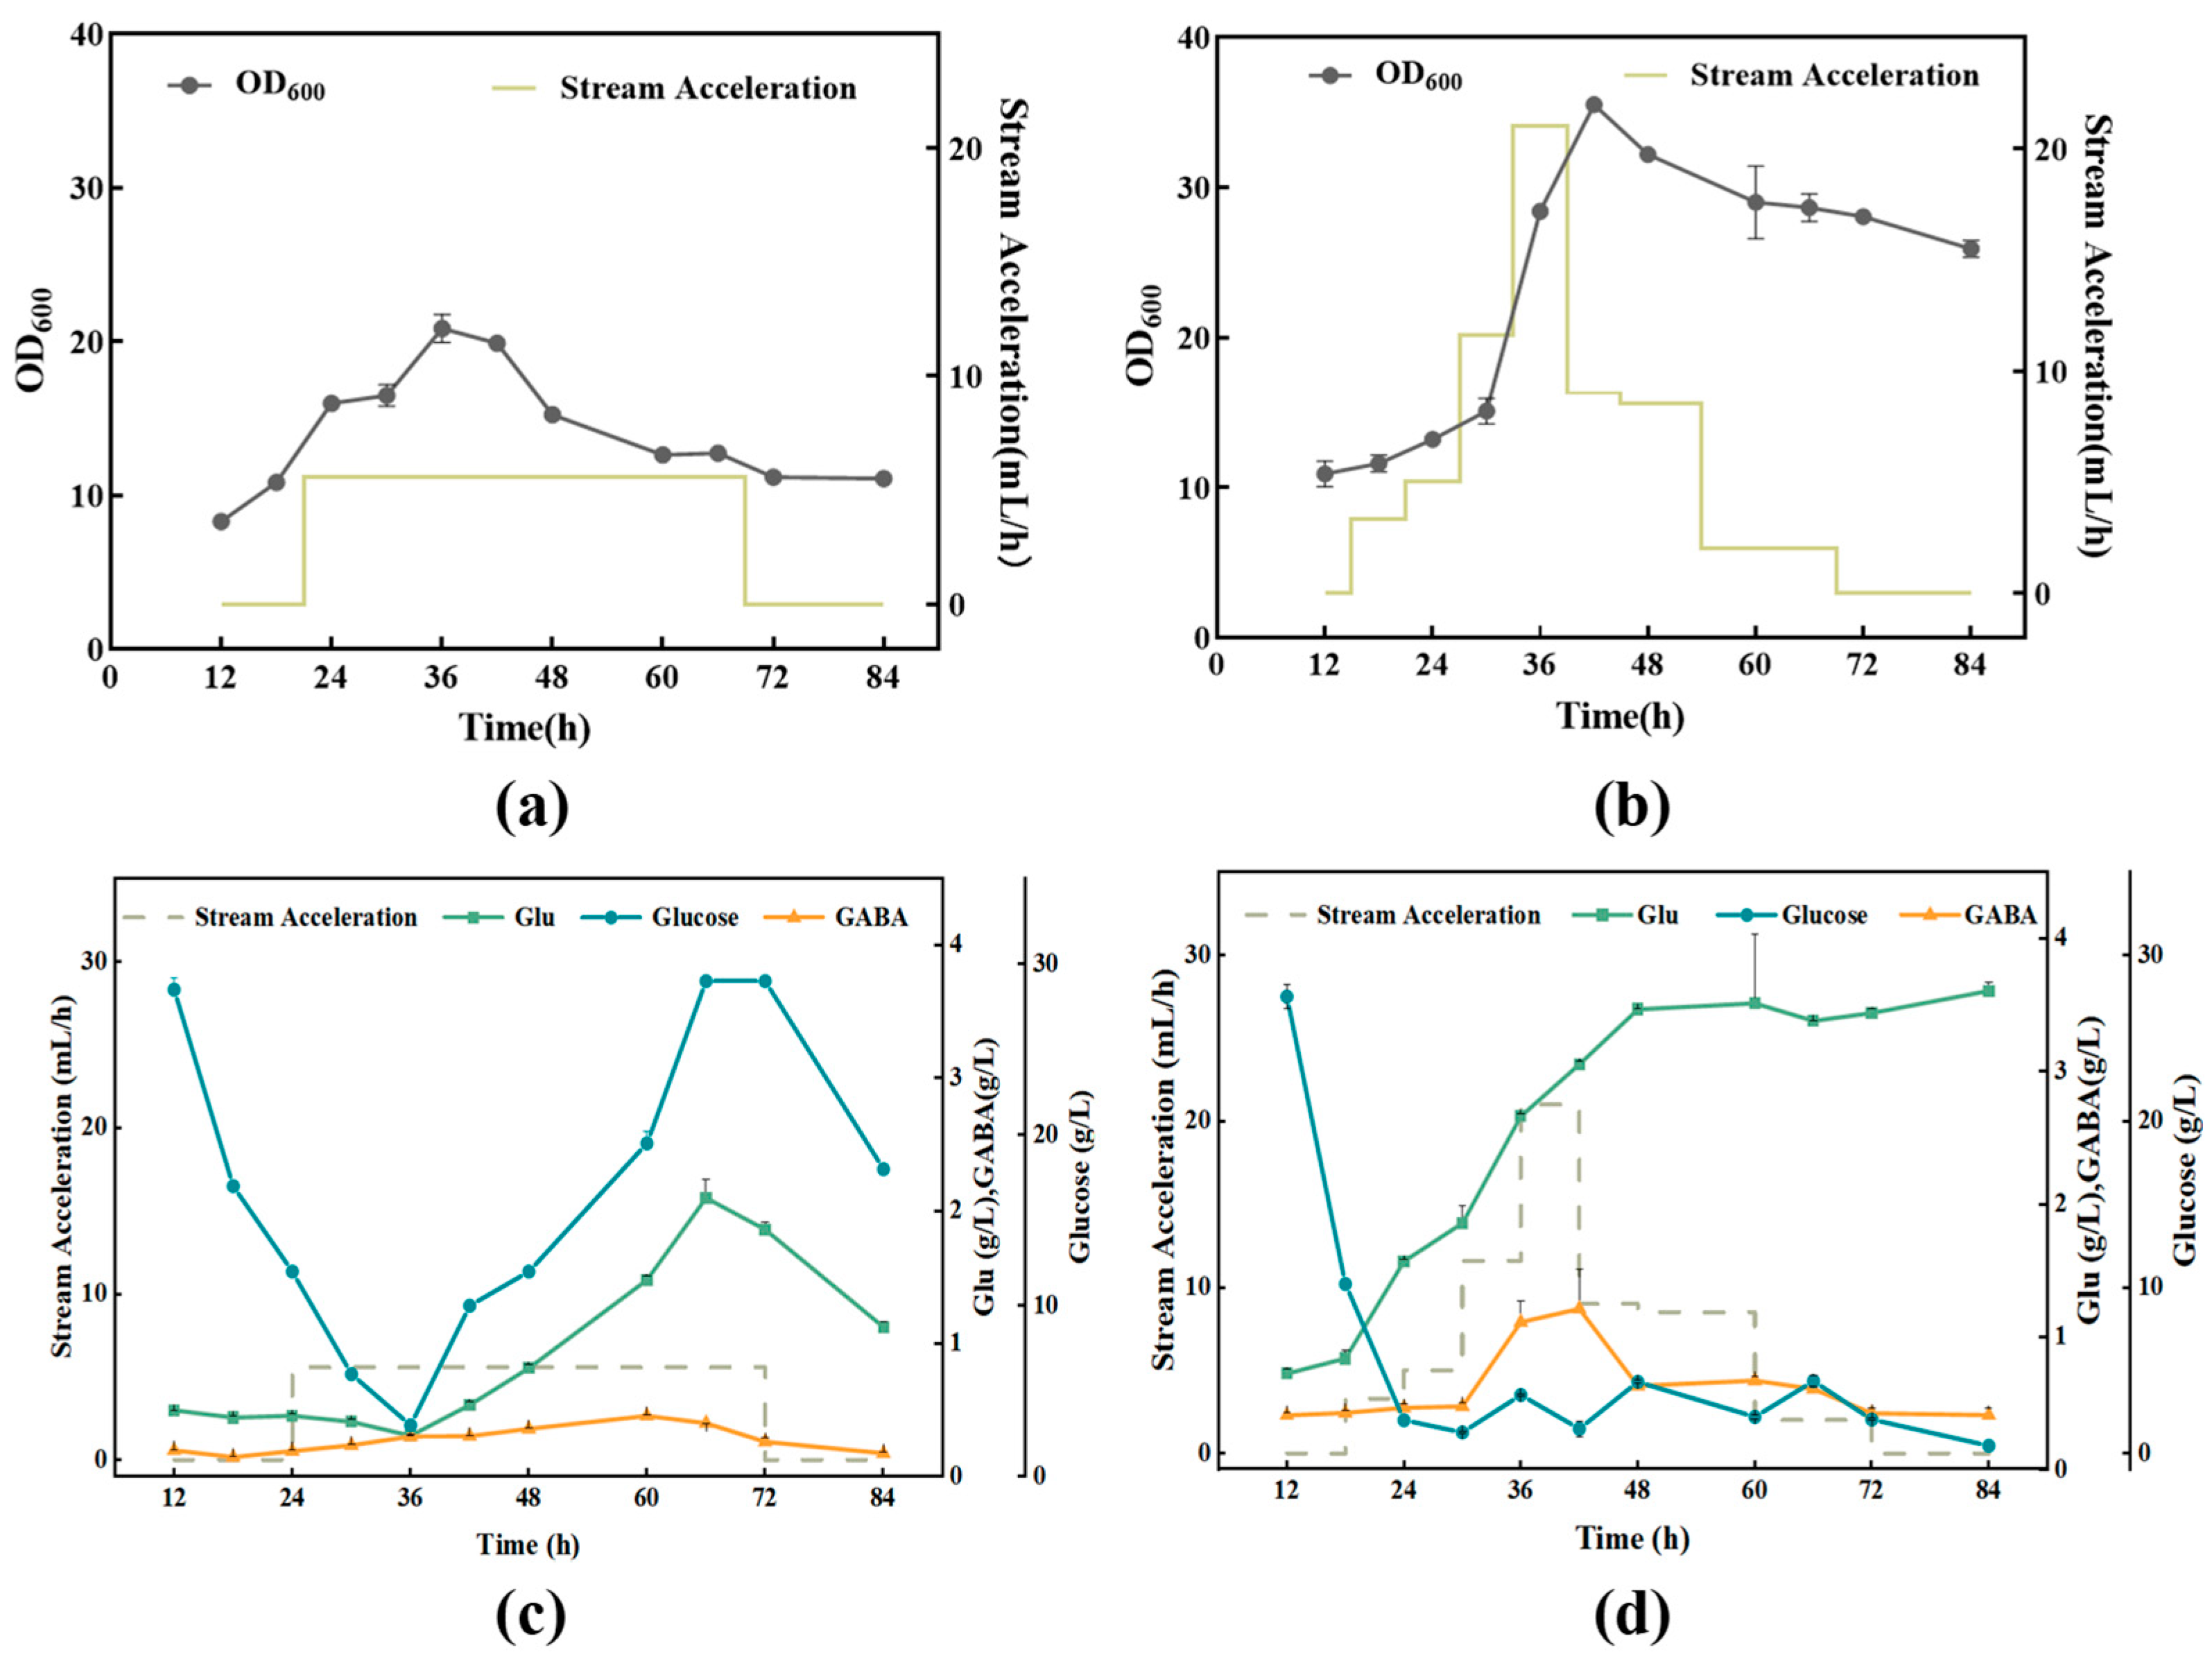
After the thorough consideration of design, the effects of different supplementation methods on the fermentation process of recombinant C. glutamicum are shown in Figure 4. As shown in Figure 4a, under uniform speed glucose replenishment, cells grew to a maximum OD600 of approximately 20 at 36 h. With continuous replenishment, the number of cells was reduced, which may be attributed to elevated intra- and extracellular osmotic pressure resulting from increased glucose concentration, thereby inhibiting cell growth. As shown in Figure 4b, under the variable speed glucose replenishment condition, cell OD600 could reach 35 at approximately 36 h. Continuous supplementation with a low glucose concentration proved beneficial for maximizing cellular glucose utilization, sustaining cell growth and metabolic activity. Variable speed glucose replenishment not only maintains a low glucose concentration but also can continuously replenish the whole fermentation system, avoiding the inhibitory effect of high glucose concentration on cell growth [46].
The relationship between glucose concentration and glutamate synthesis under different replenishment strategies are shown in Figure 4c,d. Figure 4c demonstrates that between 24 and 36 h, the rate of glucose replenishment is less than the rate of glucose consumption, resulting in a decrease in residual glucose in the system. After 36 h, the rate of glucose supplementation surpassed its consumption, the residual glucose increased and glutamate was produced in large quantities. At the end of fermentation, the glutamate content decreased and a small amount of GABA was produced, indicating that an excessively high glucose concentration indeed hampers IPTG-induced expression of GAD. With the flow rate regulated to maintain approximately 5 g/L of residual glucose within the system, Figure 4d demonstrates that a large amount of glutamate was generated along with cell growth, reaching a maximum value at 48 h with stable glutamate synthesis maintained thereafter. However, the rate of glutamate production exceeded the catalytic efficiency of glutamate decarboxylase, leading to substantial glutamate accumulation, and the low conversion efficiency contributed to the low synthesis of GABA.
This fermentation strategy fails to address the challenge of suboptimal GABA biosynthesis, which is potentially attributable to a discrepancy between the pH conditions required for efficient GABA production and the optimal pH range for cell growth and glutamate biosynthesis [47]. Therefore, to improve GAD conversion efficiency, the impact of environmental pH modulation on GABA biosynthesis following substantial glutamate accumulation was subsequently investigated.

3.2.3. Effects of Different pH on the Fermentation Process

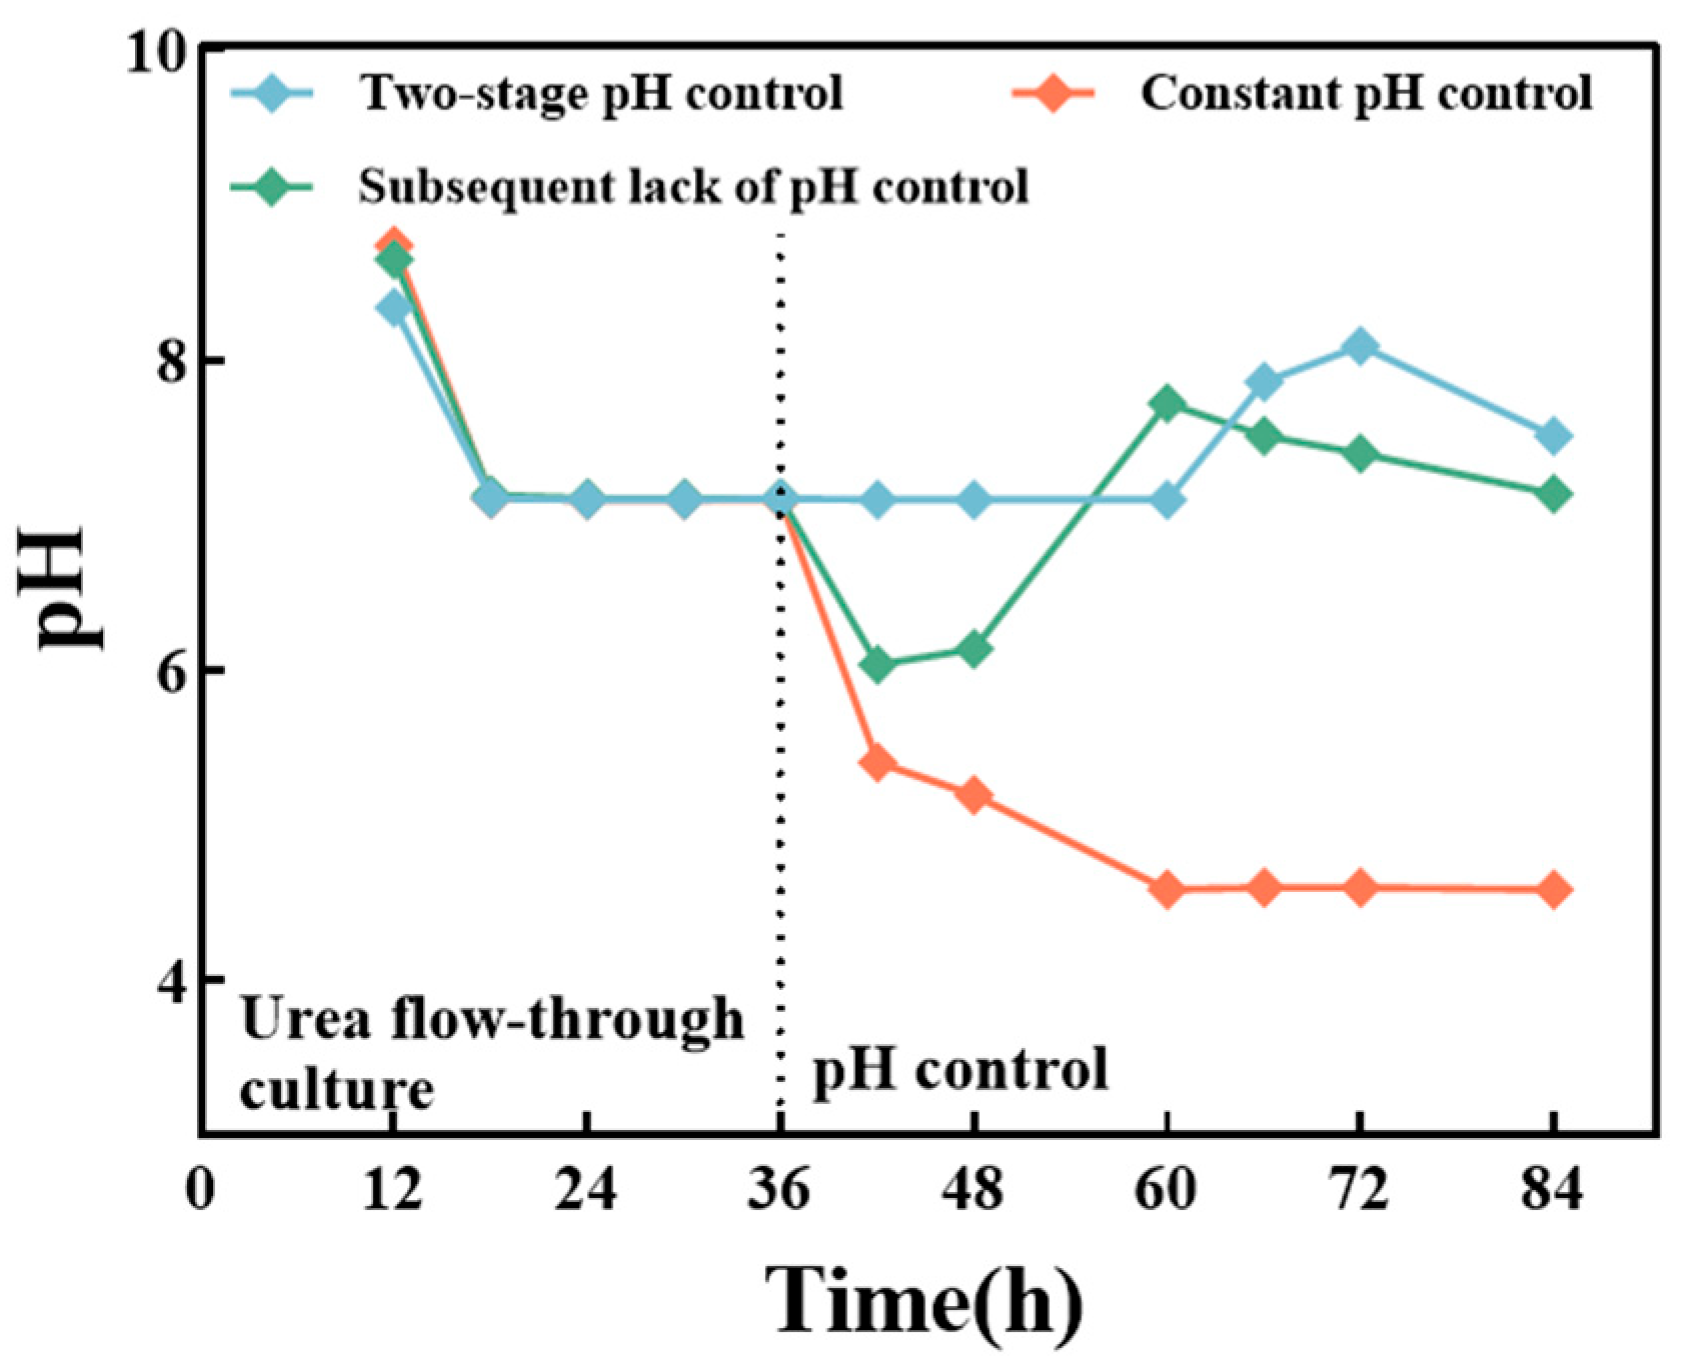
To improve the conversion efficiency of GAD, we formulated three distinct pH control strategies for comparative analysis: constant pH control, subsequent lack of pH control and two-stage pH control. Figure 5 shows the course of pH variation under three control strategies. After 36 h, the constant pH control strategy’s environmental pH maintained a stable profile, but in the later phase, the environmental pH becomes alkaline; subsequently, the lack of pH control strategy’s environmental pH rapidly drops to acidic levels, then rises to alkaline levels before slowly decreasing to neutral; the two-stage pH control strategy’s environmental pH dropped sharply to 4.5 and remained stably maintained at this acidic setpoint thereafter.
Figure 6 shows the effects of different pH control strategies on recombinant C. glutamicum fermentation. As shown in Figure 6a,b, growth and GAD activity of recombinant C. glutamicum were promoted in the first phase. Cellular growth and GAD activity both attained their peak values at 36 h. After 36 h, irrespective of pH control, cells exhibited a certain degree of growth decline, accompanied by a decrease in GAD enzyme activity. This phenomenon might be associated with the bacteria entering the secondary metabolism stage or initiating other energy allocation pathways [48]. The constant pH control group exhibited less cellular decline compared to the other two groups, suggesting that acidic conditions are unfavorable for the growth of recombinant C. glutamicum. Sudden fluctuations in environmental pH can also contribute to cellular deterioration. In the two-stage pH control group, following the introduction of concentrated sulfuric acid flow to maintain a pH of 4.5, the overall GAD activity was higher than that in the other two groups and this activity persisted for an extended duration, which indicated that GAD exhibits higher activity and stability at an environmental pH of 4.5. Subsequent lack of pH control strategy relies on glutamate accumulation to acidify the environment can not satisfy the acidic requirement of GAD, resulting in relatively low GAD activity.
Figure 6c,d show the relationship between Glu and GABA production by recombinant C. glutamicum under different pH control strategies. Under two-stage pH control strategy, during the first 36 h of fermentation, the synthesis rate of glutamate exceeded its consumption rate, carbon metabolic flux was primarily directed toward the proliferation of recombinant C. glutamicum and the synthesis of primary metabolite glutamate. After adjusting the pH to 4.5, the glutamate concentration measured at 42 h decreased significantly, while GABA synthesis increased markedly. This suggests that the acidic environment activated the catalytic activity of GAD, enabling the enzyme to convert substantial amounts of glutamate into GABA. The combined intracellular and extracellular GABA levels could reach up to 3.231 ± 0.024 g/L. With the extension of fermentation time, cells continued to synthesize glutamate and secrete it into the extracellular region, while GABA was also transported from the intracellular to the extracellular region. However, the GABA content gradually decreased over time, potentially associated with the activation of the GABA transport system in C. glutamicum. This system reintroduce GABA into the tricarboxylic acid (TCA) cycle through reverse uptake or generate intermediates like succinate via deamination [44].
Under subsequent lack of pH control strategy, Glu continues to accumulate in large quantities and increase to higher levels, leading to spontaneous acidification of the environment. At this stage, glutamate existed both intracellularly and extracellularly, which was associated with the pH-dependent secretion of glutamate through mechanical channels at pH 7, and a weakly acidic environment resulted in intracellular Glu retention [29]. Only a minimal quantity of Glu was converted to GABA, which was ascribed to the inability of weakly acidic conditions to effectively activate GAD activity.
Under constant pH control strategy, Glu continued to accumulate substantially to reach a maximum, with glutamate being secreted almost entirely extracellularly. This observation suggests that a pH of 7 promotes the secretion of glutamate through mechanochannels [29]. As the fermentation time extended, the environmental pH gradually turned alkaline, and although the extracellular glutamate content decreased, the GABA content did not increase, indicating that the alkaline environment significantly inhibited GAD activity, leading to an almost stagnant GABA synthesis [49]. This phenomenon might be attributed to two underlying mechanisms: first, alkaline conditions induce deprotonation of the GAD active center, thereby weakening its affinity for the substrate [50]; second, high pH activates bypass metabolism enzymes, such as glutamate aminotransferase, prompting a shift in Glu toward α-ketoglutarate or alanine synthesis instead of the GABA pathway [51].

3.2.4. Variable Speed Glucose Replenishment Fermentation Results and Each Parameter Empirical Correlation Equation of the Two-Stage pH Control Strategy

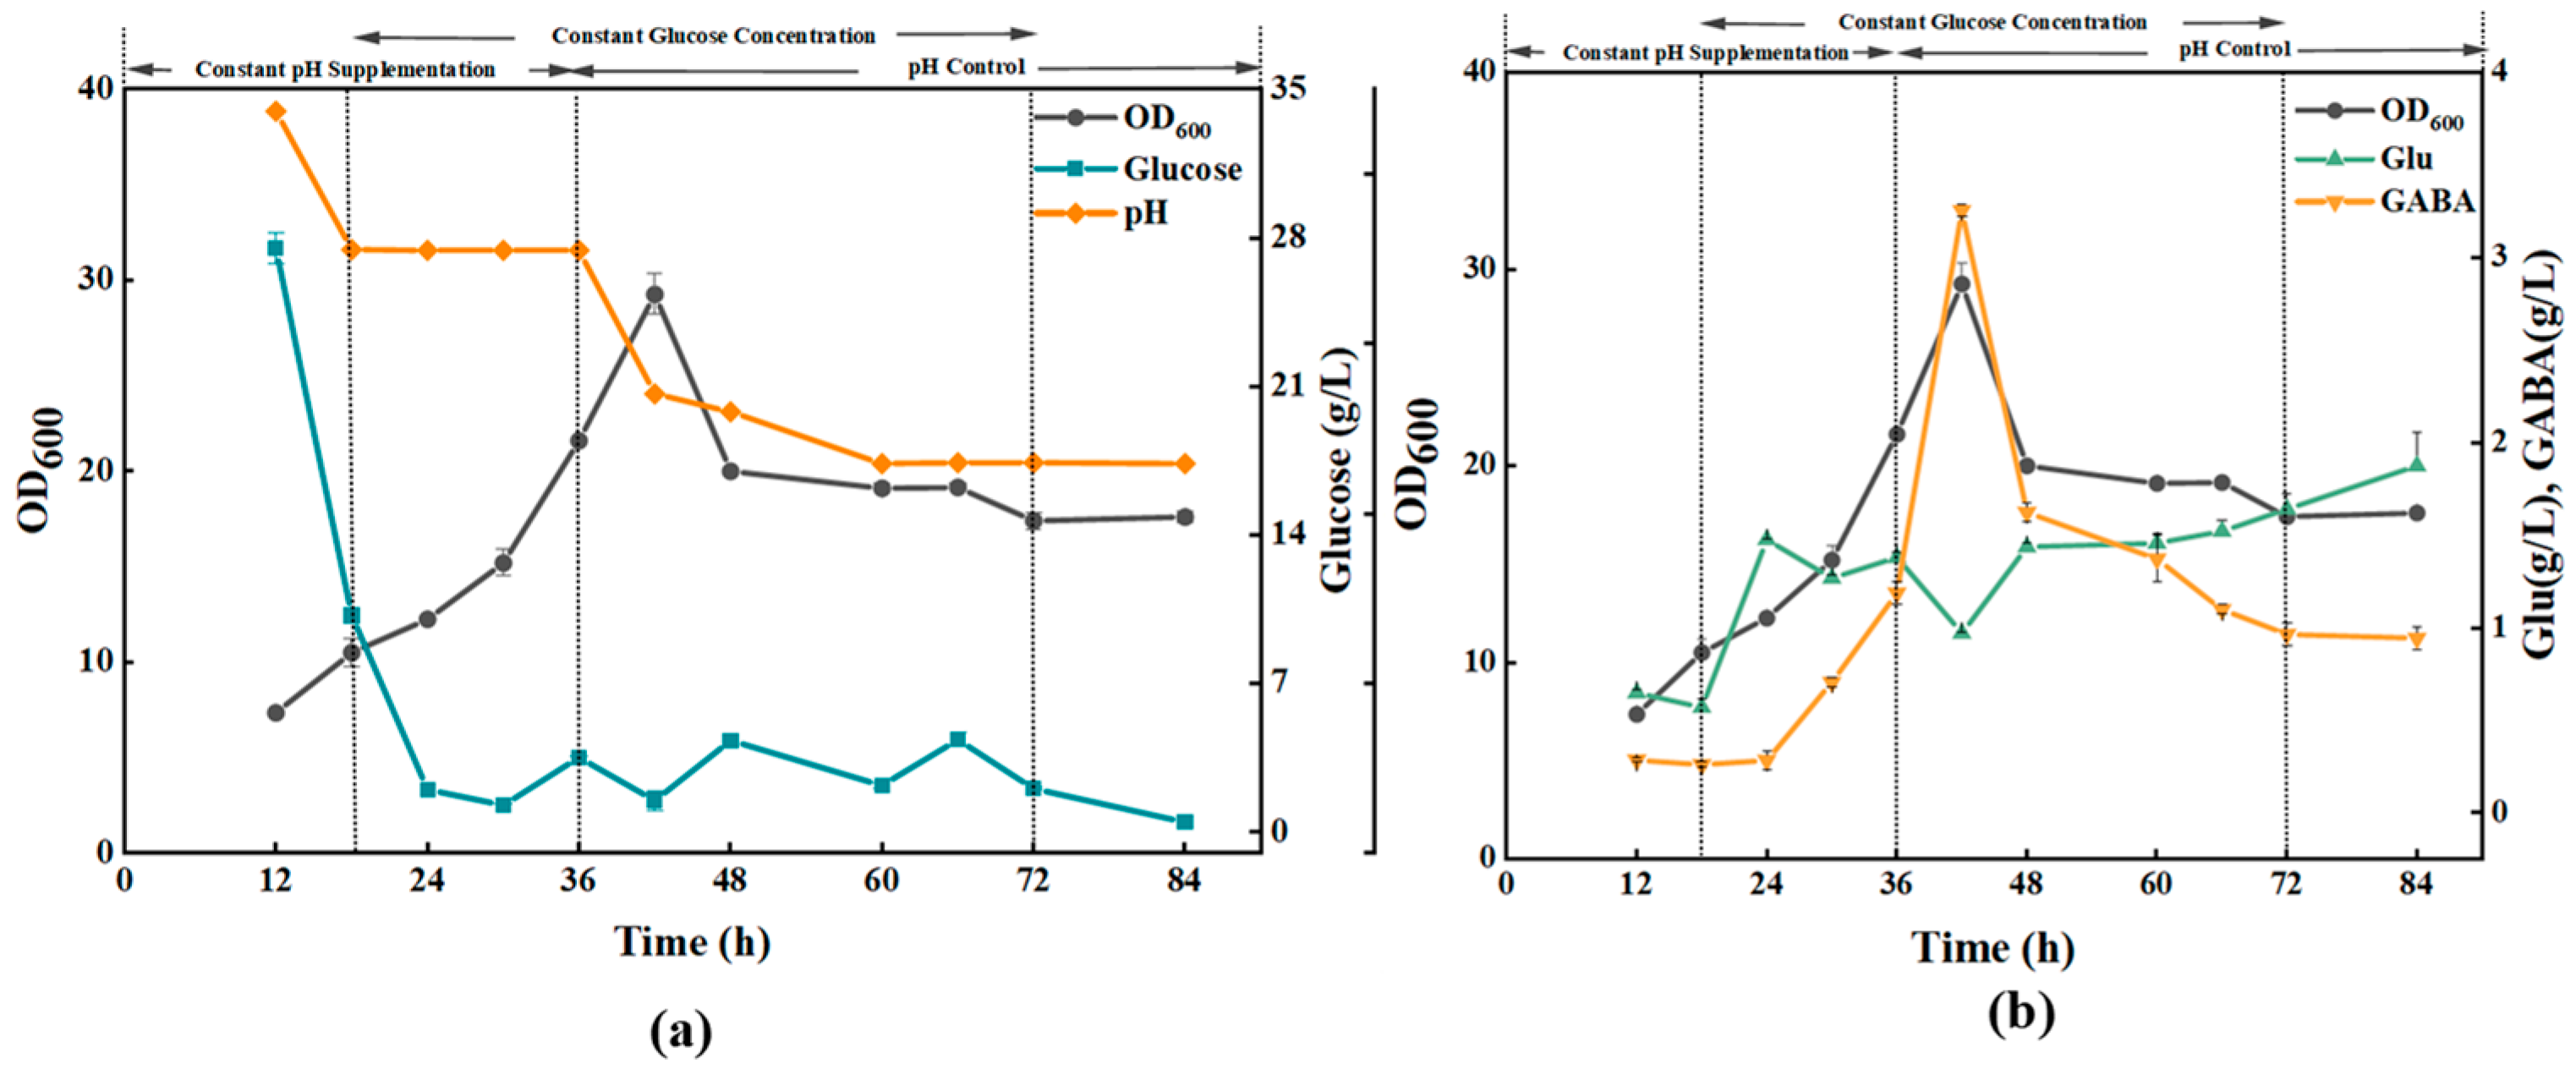
Based on the analysis of the fermentation process under different supplementation methods as well as different pH regulation, a stepwise fermentation optimization strategy was developed. The initial glucose concentration was set at 50 g/L. During the period of the rapid cell growth and marked glutamate synthesis (0–36 h), the pH of the environment was maintained at 7.0–7.2 by adding urea in a flow-through manner and controlling glucose concentration below 5 g/L by variable flow addition of glucose to maintain cell growth as well as glutamate accumulation. After 36 h, GABA synthesis was further promoted by adjusting the environmental pH to 4.5. Figure 7 shows the variation in each parameter during fermentation with variable speed replenishment combined with two-stage control. Figure 7a shows the dynamic changes in cell growth under two-stage pH control conditions. In the first 36 h, C. glutamicum proliferated rapidly and glucose in substantial quantities. This suggests that the active growth of C. glutamicum strongly relied on glucose utilization. After adjusting the environmental pH to 4.5 at 36 h, the biomass declined sharply and then remained stable. Figure 7b focuses on GABA and Glu dynamics alongside OD600. In the first 36 h, C. glutamicum proliferate rapidly and continuous synthesis glutamate. Only a minimal portion of glutamate is converted to GABA. After adjusting the environmental pH to 4.5 at 36 h, glutamate began to be consumed in large quantities and substantial amounts of GABA were synthesized. The intracellular and extracellular GABA reached 3.231 ± 0.024 g/L at 42 h, which was significantly higher than the GABA yield of 0.5 g/L under the unoptimized conditions. This value, while lower than some engineered high-yield systems, is comparable or superior to many studies using non engineered or natural substrate-based fermentation. Monteagudo-Mera et al. [52] pointed out that when L. plantarum 299v is cultured in MRS medium supplemented with monosodium glutamate (1% w/v), the GABA production level is only 4.8 mmol/L, which is approximately 0.43 g/L. Rezaei et al. [53] optimized GABA synthesis in natural strains through heat shock and ultrasonic treatment. Under the optimized conditions, GABA yield was 0.295 g/L.
These results indicate that a regulatory strategy integrating variable-rate replenishment with two-stage pH control represents an effective approach for leveraging glucose to produce and enhance GABA yield. However, the biomass declined after adjusting the ambient pH and remained stable in the late stage of fermentation, which could be attributed to the death of some cells due to the change in ambient pH. GABA decreased in the late fermentation stage, which was due to the existence of a GABA uptake mechanism in C. glutamicum [54].
Finally, the fermentation conditions of recombinant C. glutamicum were analyzed using MATLAB 2024a software. By inputting the relevant empirical parameters into the system of equations. The empirical correlation equations of cell growth, glucose consumption, GAD activity, and GABA synthesis were successfully established.
The following equations were used to describe the empirical correlation equation of cell growth:
y 1 = 6.117 4.981 1 + t 33.593 13.866 ,   t 42 15.62 e t 20.716 + 4.003 ,   t > 42 ,
The growth of recombinant C. glutamicum cells during the first 42 h conformed to a standard logistic growth model, with an R2 value of 0.9842 for the fitted equation. After 42 h, the growth followed an exponential decay model, yielding an R2 value of 0.9623 for the fitted equation. The cell growth model shows that growth is initially exponential, then decelerates as resources become limited or inhibitory factors accumulate. The maximum specific growth rate of the cells of 0.316 h−1.
The following equations were used to describe the empirical correlation equation of glucose consumption:
y 2 ( t ) = 350.919 e t 4.585 + 2.059 ,
The glucose consumption model conforms to an exponential function model, and the R2 value of the fitted equation can be as high as 0.936. The maximum consumption rate of glucose occurs at the beginning of fermentation, consistent with the phenomenon of large amounts of glucose being consumed in the first 24 h of the fermentation process. The maximum rate of glucose consumption is calculated to be 1.407 g/(g∙h).
The following equations were used to describe the empirical correlation equation of GAD activity and synthesis:
y 3 ( t ) = 95.152 e t 44.884 26.865 2 ,
The dynamic process of GAD enzyme activity followed a Gauss functional model and the R2 value of the fitted equation was 0.928. The enzyme activity peaks of GAD occurred at 44 h, respectively.
The following equations were used to describe the empirical correlation equation of GABA synthesis:
y 4 ( t ) = 2.002 e t 46.1695 24.642 2
The dynamic process of GABA synthesis conformed to a Gauss functional model, and the R2 value of the fitted equation could reach 0.853. The GABA synthesis peaks occurred at 46 h, respectively. This is roughly consistent with the peak time of GAD enzyme activity. The maximum rate of GABA synthesis was 0.0697 g/L/h.
Figure 8 demonstrates the relationship of the Glu pattern of the change curve to GAD activity and to the fitting Curve of GABA synthesis. At the beginning of fermentation, glucose consumption was mainly used for cell growth and Glu synthesis. This resembles the trend of glucose consumption in relation to cell growth and glutamate synthesis in recombinant C. glutamicum, as reported by Lv et al. [55]. With the increase in enzyme activity, a portion of glutamate was converted to GABA, and the accumulation of Glu increased sharply before remaining almost stable. This indicates that the consumption rate of glutamate was lower than the synthesis rate, leading to substantial glutamate accumulation. With the increase in enzyme activity, the synthesis rate of glutamate became almost equivalent to the consumption rate.
After adjusting the pH to 4.5, the accumulation of glutamate decreased sharply, the GABA content increased sharply, while the GAD enzyme activity significantly increased. The GAD enzyme activity continued to rise until approximately 44 h of fermentation, at which point the GAD enzyme activity reached its maximum, the accumulation of GABA peaked, and the accumulation of glutamate decreased to its minimum. This suggests that the synthesis rate of glutamate was lower than the consumption rate during this period. After 46 h, the GAD enzyme activity declined, and the GABA content dropped slowly, which may be attributed to the high concentration of GABA activating the GABA uptake gene in C. glutamicum [56], thereby triggering the decomposition of GABA to maintain the amino acid balance of the cells [57]; the cells were not suitable for the acidic environment, and partial decay occurred during the late fermentation stage, leading to a decrease in GAD enzyme activity. Additionally, the depletion of glutamate may have inhibited GAD activity [58]. By the end of 72 h replenishment, the cells gradually decayed, GAD enzyme activity decreased and the GABA content slowly decreased.

4. Conclusions

In this study, different replenishment strategies were investigated for the fermentation process of recombinant C. glutamicum, including the initial glucose concentration, glucose replenishment strategy and pH regulation strategy. We found that the optimal initial glucose concentration was 50 g/L, and the strategy of glucose-controlled incubation combined with two-stage pH control was more suitable for GABA production. The GABA yield could reach 3.231 ± 0.024 g/L after the optimization of the conditions, which was 6-fold higher than the yield before optimization. Additionally, the equation model reveals the trends in parameter changes during the fermentation process of recombinant C. glutamicum, and the peak period (44 h) of GAD activity was pinpointed. The model not only optimizes the process parameters but also provides a predictable theoretical framework for industrial-scale upscaling.

Author Contributions

Investigation, Data curation, Writing—original draft, Q.D.; Data curation and Conceptualization, Y.W.; Supervision and Data curation, R.Z.; Funding acquisition and Review and Editing, J.C. All authors have read and agreed to the published version of the manuscript.

Funding

This work was supported by funding from the Key Laboratory of Fermentation Engineering (Ministry of Education) (202209FE07)and the Key R&D projects in Hubei Province (2022BBA0053).

Institutional Review Board Statement

Not applicable.

Informed Consent Statement

Not applicable.

Data Availability Statement

No new data were created or analyzed in this study. Data sharing is not applicable to this article.

Acknowledgments

The author expresses gratitude to the Key Laboratory of Fermentation Engineering (Ministry of Education), School of Life and Health Sciences, Hubei University of Technology for its support.

Conflicts of Interest

We declare that we have no known competing financial interests or personal relationships that could have appeared to influence the work reported in this paper.

Abbreviations

The following abbreviations are used in this manuscript:
GABAγ-aminobutyric acid
GluGlutamate acid
GADGlutamate acid decarboxylase

References

  1. Milon, R.B.; Hu, P.; Zhang, X.; Hu, X.; Ren, L. Recent advances in the biosynthesis and industrial biotechnology of Gamma-amino butyric acid. Bioresour. Bioprocess. 2024, 11, 32. [Google Scholar] [CrossRef] [PubMed]
  2. Wang, J.; Ma, W.; Zhou, J.; Wang, X.; Zhao, L. Microbial chassis design and engineering for production of gamma-aminobutyric acid. World J. Microbiol. Biotechnol. 2024, 40, 159. [Google Scholar] [CrossRef]
  3. Kwon, M.J.; Kim, J.E.; Lee, S.P. Functional kimchi beverage enhanced with γ-aminobutyric acid (GABA) through serial co-fermentation using Leuconostoc citreum S5 and Lactiplantibacillus plantarum KS2020. Fermentation 2025, 11, 44. [Google Scholar] [CrossRef]
  4. Grewal, J.; Khare, S.K. 2-Pyrrolidone synthesis from γ-aminobutyric acid produced by Lactobacillus brevis under solid-state fermentation utilizing toxic deoiled cottonseed cake. Bioprocess. Biosyst. Eng. 2017, 40, 145–152. [Google Scholar] [CrossRef]
  5. Wu, L.T.; Huang, Y.H.; Hsieh, L.S. Production of γ-aminobutyric acid by immobilization of two Yarrowia lipolytica glutamate decarboxylases on electrospun nanofibrous membrane. Int. J. Biol. Macromol. 2024, 278 Pt 4, 135046. [Google Scholar] [CrossRef]
  6. Sabna, B.S.; Mahendran, R.; Balakrishnan, J.; Huang, C.Y.; Jerimon, P.J.; Thomas, A.; Eswaran, R.; Naveen, P.; Jayaraman, A. Purification and characterization of gamma-aminobutyric acid (GABA) from E. faecium BS5 and its antidiabetic efficacy in streptozotocin-Induced diabetic rats. Probiotics Antimicrob. Proteins 2025. [Google Scholar] [CrossRef] [PubMed]
  7. Barakat, H.; Aljutaily, T. Role of γ-Aminobutyric acid (GABA) as an inhibitory neurotransmitter in diabetes management: Mechanisms and therapeutic implications. Biomolecules 2025, 15, 399. [Google Scholar] [CrossRef]
  8. Zhang, Q.; Zhu, L.; Li, H.; Chen, Q.; Li, N.; Li, J.; Zhao, Z.; Xiao, D.; Tang, T.; Bi, C.; et al. Insights and progress on the biosynthesis, metabolism, and physiological functions of gamma-aminobutyric acid (GABA): A review. PeerJ 2024, 12, e18712. [Google Scholar] [CrossRef]
  9. Ahmad, R.; Pandit, C.; Yu, Y.H.; Chen, W.J.; Cheng, Y.C.; Ali, I.; Cheng, Y.H. The impact of fermented gamma-aminobutyric acid on poultry growth performance through insulin-like growth factor-1 activation. Fermentation 2025, 11, 84. [Google Scholar] [CrossRef]
  10. Wang, Y.L.; Zhang, Z.H.; Wang, W.K.; Wu, Q.C.; Zhang, F.; Li, W.J.; Li, S.L.; Wang, W.; Cao, Z.J.; Yang, H.J. The effect of γ-aminobutyric acid addition on in vitro ruminal fermentation characteristics and methane production of diets differing in forage-to-concentrate ratio. Fermentation 2023, 9, 105. [Google Scholar] [CrossRef]
  11. Altaib, H.; El-Nouby, M.A.; Badr, Y. An Overview of GABA Production by Microorganisms. Microb. Nutraceuticals Prod. Process. 2025, 17, 365–398. [Google Scholar] [CrossRef]
  12. Hu, Y.; Huang, X.; Xiao, Q.; Wu, X.; Tian, Q.; Ma, W.; Shoaib, N.; Liu, Y.; Zhao, H.; Feng, Z. Advances in plant GABA research: Biological functions, synthesis mechanisms and regulatory pathways. Plants 2024, 13, 2891. [Google Scholar] [CrossRef]
  13. Zhu, N.; Wang, T.; Ge, L.; Li, Y.; Zhang, X.; Bao, H. γ-amino butyric acid (GABA) synthesis enabled by copper-catalyzed carboamination of alkenes. Org. Lett. 2017, 19, 4718–4721. [Google Scholar] [CrossRef] [PubMed]
  14. Li, L.; Dou, N.; Zhang, H.; Wu, C. The versatile GABA in plants. Plant Signal Behav. 2021, 16, 1862565. [Google Scholar] [CrossRef] [PubMed]
  15. Hou, D.; Tang, J.; Feng, Q.; Niu, Z.; Shen, Q.; Wang, L.; Zhou, S. Gamma-aminobutyric acid (GABA): A comprehensive review of dietary sources, enrichment technologies, processing effects, health benefits, and its applications. Crit. Rev. Food Sci. Nutr. 2024, 64, 8852–8874. [Google Scholar] [CrossRef] [PubMed]
  16. Pannerchelvan, S.; Rios-Solis, L.; Wong, F.W.F.; Zaidan, U.H.; Wasoh, H.; Mohamed, M.S.; Tan, J.S.; Mohamad, R.; Halim, M. Strategies for improvement of gamma-aminobutyric acid (GABA) biosynthesis via lactic acid bacteria (LAB) fermentation. Food Funct. 2023, 14, 3929–3948. [Google Scholar] [CrossRef]
  17. Lyu, J.F.; Lyu, C.J.; Cao, J.R.; Mei, J.Q.; Hu, S.; Zhao, W.R.; Xu, T.Y.; Wang, Y.T.; Wang, D.L.; Hang, J.; et al. High level production of γ-aminobutyric acid in engineered Escherichia coli by refactoring the glutamate decarboxylase. Process Biochem. 2022, 118, 243–251. [Google Scholar] [CrossRef]
  18. Jia, M.; Zhu, Y.; Wang, L.; Sun, T.; Pan, H.; Li, H. pH auto-sustain-based fermentation supports efficient gamma-aminobutyric acid production by Lactobacillus brevis CD0817. Fermentation 2022, 8, 208. [Google Scholar] [CrossRef]
  19. Abdel-motaal, H.; Abdelazez, A.; Wang, P.; Abady, G.; Abozaed, S.; Ye, B.; Xu, L.; Zhao, Y.; Niu, J.; Alshehry, J.; et al. Exploring phenotype, genotype, and the production of promising GABA postbiotics by Lactiplantibacillus plantarum: A comprehensive investigation. Fermentation 2024, 10, 309. [Google Scholar] [CrossRef]
  20. Nakatani, Y.; Fukaya, T.; Kishino, S.; Ogawa, J. Production of GABA-enriched tomato juice by Lactiplantibacillus plantarum KB1253. J. Biosci. Bioeng. 2022, 134, 424–431. [Google Scholar] [CrossRef]
  21. Sheng, Q.; Wu, X.Y.; Xu, X.; Tan, X.; Li, Z.; Zhang, B. Production of L-glutamate family amino acids in Corynebacterium glutamicum: Physiological mechanism, genetic modulation, and prospects. Synth. Syst. Biotechnol. 2021, 6, 302–325. [Google Scholar] [CrossRef]
  22. Shi, F.; Jiang, J.; Li, Y.; Li, Y.; Xie, Y. Enhancement of γ-aminobutyric acid production in recombinant Corynebacterium glutamicum by co-expressing two glutamate decarboxylase genes from Lactobacillus brevis. J. Ind. Microbiol. Biotechnol. 2013, 40, 1285–1296. [Google Scholar] [CrossRef]
  23. Son, J.; Baritugo, K.A.; Sohn, Y.J.; Kang, K.H.; Kim, H.T.; Joo, J.C.; Park, S.J. Production of γ-aminobutyrate (GABA) in recombinant Corynebacterium glutamicum by expression of glutamate decarboxylase active at neutral pH. ACS Omega 2022, 7, 29106–29115. [Google Scholar] [CrossRef]
  24. Wen, J.; Sun, W.; Leng, G.; Li, D.; Feng, C.; Tian, Z.; Wang, X.J. Enhanced fermentative γ-aminobutyric acid production by a metabolic engineered Corynebacterium glutamicum. Biotechnol. Bioprocess. Eng. 2024, 29, 129–140. [Google Scholar] [CrossRef]
  25. Litsanov, B.; Kabus, A.; Brocker, M.; Bott, M. Efficient aerobic succinate production from glucose in minimal medium with Corynebacterium glutamicum. Microb. Biotechnol. 2012, 5, 116–128. [Google Scholar] [CrossRef]
  26. Wang, Y.; Cao, G.; Xu, D.; Fan, L.; Wu, X.; Ni, X.; Zhao, S.; Zheng, P.; Sun, J.; Ma, Y. A novel Corynebacterium glutamicum L-glutamate exporter. Appl. Environ. Microbiol. 2018, 84, e02691-17. [Google Scholar] [CrossRef] [PubMed]
  27. Alharbi, N.S.; Kadaikunnan, S.; Khaled, J.M.; Almanaa, T.N.; Innasimuthu, G.M.; Rajoo, B.; Alanzi, K.F.; Rajaram, S.K. Optimization of glutamic acid production by Corynebacterium glutamicum using response surface methodology. J. King Saud. Univ. Sci. 2020, 32, 1403–1408. [Google Scholar] [CrossRef]
  28. Fernández-Castané, A.; Vine, C.E.; Caminal, G.; López-Santín, J. Evidencing the role of lactose permease in IPTG uptake by Escherichia coli in fed-batch high cell density cultures. J. Biotechnol. 2012, 157, 391–398. [Google Scholar] [CrossRef]
  29. Nakayama, Y.; Hashimoto, K.I.; Sawada, Y.; Sokabe, M.; Kawasaki, H.; Martinac, B. Corynebacterium glutamicum mechanosensitive channels: Towards unpuzzling “glutamate efflux” for amino acid production. Biophys. Rev. 2018, 10, 1359–1369. [Google Scholar] [CrossRef] [PubMed]
  30. Yogeswara, I.B.A.; Maneerat, S.; Haltrich, D. A brief review on glutamate decarboxylase from lactic acid bacteria. Preprints 2020, 8, 1923. [Google Scholar] [CrossRef]
  31. Kim, Y.H.; Kim, H.J.; Shin, J.H.; Bhatia, S.K.; Seo, H.M.; Kim, Y.G.; Lee, Y.K.; Yang, Y.H.; Park, K. Application of diethyl ethoxymethylenemalonate (DEEMM) derivatization for monitoring of lysine decarboxylase activity. J. Mol. Catal. B Enzym. 2015, 115, 151–154. [Google Scholar] [CrossRef]
  32. Yun, S.; Kim, Y.C.; Ghosh, R.; Song, D.M.; Joo, S.; Khobragade, T.; Giri, P.; Cho, S.; Lee, C.H.; Yun, H. Elucidation of broad substrate specificity of a novel γ-glutamyl transferase from Bacillus atrophaeus and rational design for enhanced substrate selectivity. J. Agric. Food Chem. 2025, 73, 15825–15834. [Google Scholar] [CrossRef] [PubMed]
  33. Ai, S.; Liang, L.; Liu, M.; Grierson, D.; Chen, K.; Xu, C. PpERF17 alleviates peach fruit postharvest chilling injury under elevated CO2 by activating jasmonic acid and γ-aminobutyric acid biosynthesis. Hortic. Res. 2025, 12, uhaf014. [Google Scholar] [CrossRef]
  34. Ruan, H.; Yu, H.; Xu, J. The glucose uptake systems in Corynebacterium glutamicum: A review. World J. Microbiol. Biotechnol. 2020, 36, 126. [Google Scholar] [CrossRef]
  35. Luo, W.; Yang, L.; Ding, Y.; Zhuang, Y.; Sun, L.; Gu, Y.; Fan, X. Research progress regarding physiological functions of probiotics and techniques to enhance their stress resistance: A review. Crit. Rev. Food Sci. Nutr. 2025, 1–29. [Google Scholar] [CrossRef]
  36. McLoone, P.; Warnock, M.; Fyfe, L. Honey: A realistic antimicrobial for disorders of the skin. J. Microbiol. Immunol. Infect. 2016, 49, 161–167. [Google Scholar] [CrossRef]
  37. Esser, D.S.; Leveau, J.H.; Meyer, K.M. Modeling microbial growth and dynamics. Appl. Microbiol. Biotechnol. 2015, 99, 8831–8846. [Google Scholar] [CrossRef]
  38. Simpson-Lavy, K.; Kupiec, M. Carbon catabolite repression: Not only for glucose. Curr. Genet. 2019, 65, 1321–1323. [Google Scholar] [CrossRef]
  39. Liu, J.; Qiao, Z.; Zhao, Y.; Xu, M.; Zhang, X.; Yang, T.; Rao, Z. Rational metabolic engineering of Corynebacterium glutamicum for efficient synthesis of L-glutamate. Chin. J. Biotechnol. 2023, 39, 3273–3289. [Google Scholar] [CrossRef]
  40. Nakayama, Y.; Hashimoto, K.I.; Kawasaki, H.; Martinac, B. “Force-from-lipids” mechanosensation in Corynebacterium glutamicum. Biophys. Rev. 2019, 11, 327–333. [Google Scholar] [CrossRef] [PubMed]
  41. Noda, M.; Ozaki, M.; Ogura, S.; Danshiitsoodol, N.; Nakashima, E.; Sugiyama, M. Characterization of the gamma-aminobutyric acid (GABA) biosynthetic gene cluster in high GABA-producing Enterococcus avium G-15. Fermentation 2024, 10, 379. [Google Scholar] [CrossRef]
  42. Gourdon, P.; Raherimandimby, M.; Dominguez, H.; Cocaign-Bousquet, M.; Lindley, N.D. Osmotic stress, glucose transport capacity and consequences for glutamate overproduction in Corynebacterium glutamicum. J. Biotechnol. 2003, 104, 77–85. [Google Scholar] [CrossRef]
  43. Ikeda, M. Sugar transport systems in Corynebacterium glutamicum: Features and applications to strain development. Appl. Microbiol. Biotechnol. 2012, 96, 1191–1200. [Google Scholar] [CrossRef]
  44. Zhao, Z.; Ding, J.Y.; Ma, W.H.; Zhou, N.Y.; Liu, S.J. Identification and characterization of γ-aminobutyric acid uptake system GabP Cg (NCgl0464) in Corynebacterium glutamicum. Appl. Environ. Microbiol. 2012, 78, 2596–2601. [Google Scholar] [CrossRef]
  45. Shi, F.; Si, H.; Ni, Y.; Zhang, L.; Li, Y. Transaminase encoded by NCgl2515 gene of Corynebacterium glutamicum ATCC13032 is involved in γ-aminobutyric acid decomposition. Process Biochem. 2017, 55, 55–60. [Google Scholar] [CrossRef]
  46. Nie, Y.; Tian, Y.; Ren, X.; Liang, J.; Li, B.; Xiong, Z.Q. Microbial production of L-threonine using metabolically engineered Escherichia coli. J. Agric. Food Chem. 2025, 73, 13125–13141. [Google Scholar] [CrossRef]
  47. Wu, Q.; Tun, H.M.; Law, Y.S.; Khafipour, E.; Shah, N.P. Common distribution of gad operon in Lactobacillus brevis and its GadA contributes to efficient GABA synthesis toward cytosolic near-neutral pH. Front. Microbiol. 2017, 8, 206. [Google Scholar] [CrossRef]
  48. Liu, L.; Chen, G.; Liu, J.; Bao, W.; Li, X.; Yang, K.; Shi, S.; Zhao, B.; Wang, Q.; Cao, X. Sequential production of secondary metabolites by one operon affects interspecies interactions in Enterobacter sp. CGMCC 5087. Innov. Life 2023, 1, 100023. [Google Scholar] [CrossRef]
  49. Xiao, J.; Han, J.; Qiao, Z.; Zhang, G.; Huang, W.; Qian, K.; Xu, M.; Zhang, X.; Yang, T.; Rao, Z. Efficient biosynthesis of γ-aminobutyric acid by rationally engineering the catalytic pH range of a glutamate decarboxylase from Lactobacillus plantarum. Chin. J. Biotechnol. 2023, 39, 2108–2125. [Google Scholar] [CrossRef]
  50. Espeso, E.A.; Arst Jr, H.N. On the mechanism by which alkaline pH prevents expression of an acid-expressed gene. Mol. Cell Biol. 2000, 20, 3355–3363. [Google Scholar] [CrossRef] [PubMed]
  51. Gourdon, P.; Lindley, N.D. Metabolic analysis of glutamate production by Corynebacterium glutamicum. Metab. Eng. 1999, 1, 224–231. [Google Scholar] [CrossRef]
  52. Monteagudo-Mera, A.; Fanti, V.; Rodriguez-Sobstel, C.; Gibson, G.; Wijeyesekera, A.; Karatzas, K.A.; Chakrabarti, B. Gamma aminobutyric acid production by commercially available probiotic strains. J. Appl. Microbiol. 2023, 134, lxac066. [Google Scholar] [CrossRef] [PubMed]
  53. Rezaei, M.; Ghasemi, Y.; Sharifan, A.; Bakhoda, H. Gamma-aminobutyric acid (GABA) biosynthesis from Lactobacillus plantarum subsp. plantarum IBRC10817 optimized and modeled in response to heat and ultrasonic shock. Probiotics Antimicrob. Proteins 2024, 16, 1304–1312. [Google Scholar] [CrossRef] [PubMed]
  54. Ni, Y.; Shi, F.; Wang, N. Specific γ-aminobutyric acid decomposition by gabP and gabT under neutral pH in recombinant Corynebacterium glutamicum. Biotechnol. Lett. 2015, 37, 2219–2227. [Google Scholar] [CrossRef]
  55. Lv, Q.; Hu, M.; Tian, L.; Liu, F.; Wang, Q.; Xu, M.; Rao, Z. Enhancing L-glutamine production in Corynebacterium glutamicum by rational metabolic engineering combined with a two-stage pH control strategy. Bioresour. Technol. 2021, 341, 125799. [Google Scholar] [CrossRef] [PubMed]
  56. Seifi, H.S.; Curvers, K.; De Vleesschauwer, D.; Delaere, I.; Aziz, A.; Höfte, M. Concurrent overactivation of the cytosolic glutamine synthetase and the GABA shunt in the GABA-deficient sitiens mutant of tomato leads to resistance against otrytis cinerea. New Phytol. 2013, 199, 490–504. [Google Scholar] [CrossRef]
  57. Sharafi, Y.; Aghdam, M.S.; Luo, Z.; Jannatizadeh, A.; Razavi, F.; Razavi Fard, J.; Farmani, B. Melatonin treatment promotes endogenous melatonin accumulation and triggers GABA shunt pathway activity in tomato fruits during cold storage. Sci. Hortic. 2019, 254, 222–227. [Google Scholar] [CrossRef]
  58. Guo, J.; Ma, Z.; Gao, J.; Zhao, J.; Wei, L.; Liu, J.; Xu, N. Recent advances of pH homeostasis mechanisms in Corynebacterium glutamicum. World J. Microbiol. Biotechnol. 2019, 35, 192. [Google Scholar] [CrossRef]
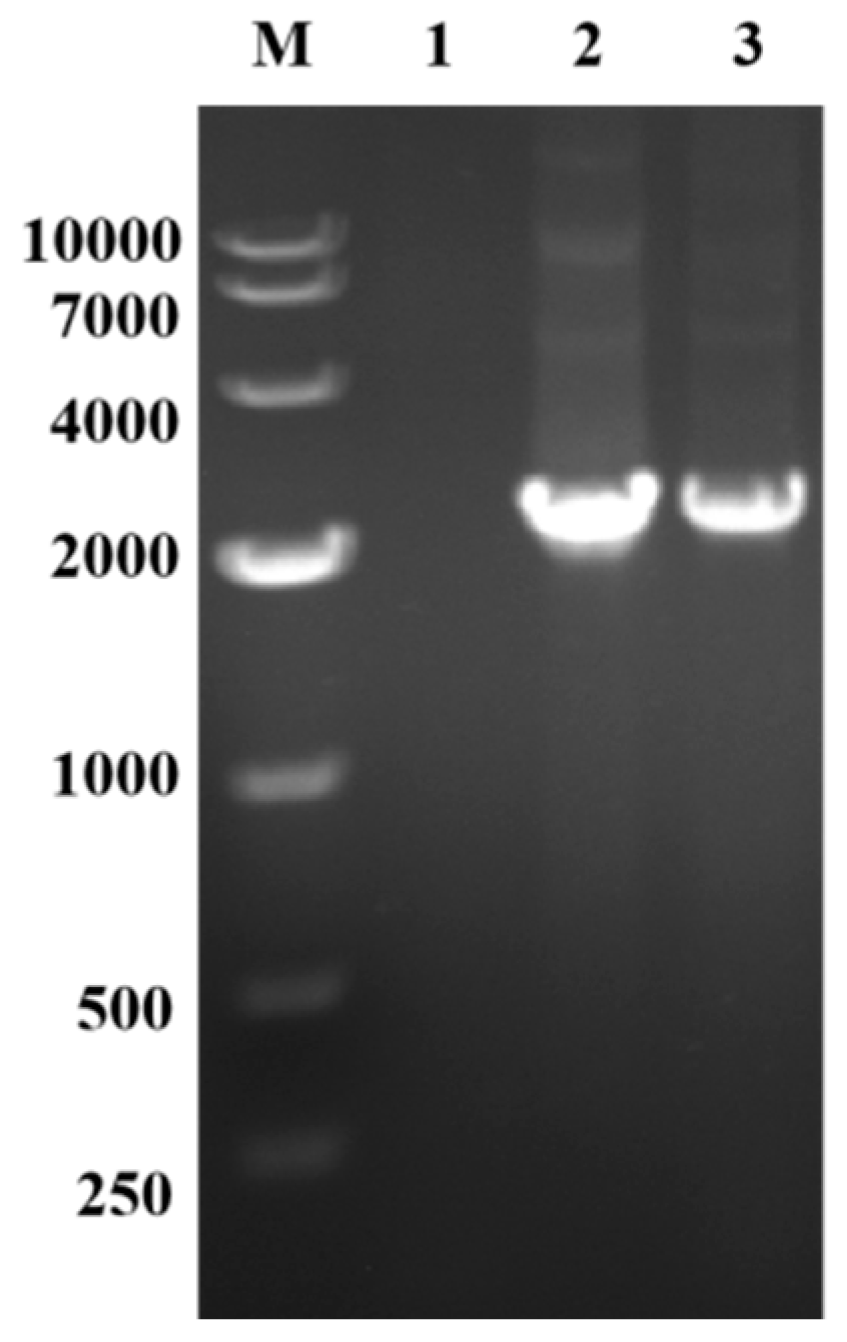
Figure 1. PCR of L. plantarum GAD, M size marker (Takara, Beijing, China), 1 is a negative control that C. glutamicum PCR products without any plasmids, 2–3 are recombinant C. glutamicum PCR products with GAD.
Fermentation 11 00534 g001
Figure 2. Glucose consumption curve during fermentation.
Fermentation 11 00534 g002
Figure 3. Dynamic process of cell growth, GAD activity, and Glu/GABA synthesis under different initial glucose concentrations. (a) Cell growth profiles; (b) GAD activity; (c) Intracellular and extracellular Glu concentrations; (d) Intracellular and extracellular GABA concentrations. Different lowercase letters (a, b, c) within the same time point denote statistically significant differences among the three groups following Tukey’s post hoc test (p < 0.05, two-way ANOVA). Error bars indicate standard deviation (SD, n = 3).
Fermentation 11 00534 g003
Figure 4. Effect of different supplementation methods on the fermentation process of recombinant C. glutamicum. (a) Graph of uniform replenishment versus cell growth; (b) Graph of variable rate supplementation versus cell growth; (c) Graph of uniform replenishment versus Glu and GABA synthesis; (d) Graph of variable speed supplementation versus Glu and GABA synthesis.
Fermentation 11 00534 g004
Figure 5. Course of pH variation under different pH control strategies during fermentation.
Fermentation 11 00534 g005
Figure 6. Effects of different pH control strategies on recombinant C. glutamicum fermentation. (a) Cell growth profiles; (b) GAD activity; (c) Intracellular and extracellular Glu concentrations; (d) Intracellular and extracellular GABA concentrations. The (T) in the legend stands for “Two-stage pH control”; (S) stands for “Subsequent lack of pH control”; (C) stands for “Constant pH control”. Different lowercase letters (a, b, c) within the same time point denote statistically significant differences among the three groups following Tukey’s post hoc test (p < 0.05, two-way ANOVA). Error bars indicate standard deviation (SD, n = 3).
Fermentation 11 00534 g006
Figure 7. Fermentation process parameters after constant glucose concentration replenishment and two-step pH control strategy modulation. (a) The dynamic changes in Optical Density, Glucose concentration, and pH; (b) The dynamic changes in Optical Density, Glu and GABA concentration.
Fermentation 11 00534 g007
Figure 8. Glu change pattern curve and fitted curve of GAD activity and GABA.
Fermentation 11 00534 g008
Table 1. Glucose utilization ratio at different initial glucose concentrations.
Initial Glucose 30 g/LInitial Glucose 50 g/LInitial Glucose 70 g/L
Glucose utilization ratio99.3%99.8%80%
Disclaimer/Publisher’s Note: The statements, opinions and data contained in all publications are solely those of the individual author(s) and contributor(s) and not of MDPI and/or the editor(s). MDPI and/or the editor(s) disclaim responsibility for any injury to people or property resulting from any ideas, methods, instructions or products referred to in the content.