Article

Optimization of Anaerobic Co-Digestion Parameters for Vinegar Residue and Cattle Manure via Orthogonal Experimental Design

State Key Laboratory of Nutrient Use and Management, Key Laboratory of Low-Carbon Green Agriculture, Ministry of Agriculture and Rural Affairs, College of Resources and Environmental Sciences, National Academy of Agriculture Green Development, China Agricultural University, Beijing 100193, China
*
Author to whom correspondence should be addressed.
Fermentation 2025, 11(9), 493; https://doi.org/10.3390/fermentation11090493
Submission received: 1 July 2025 / Revised: 31 July 2025 / Accepted: 15 August 2025 / Published: 23 August 2025
(This article belongs to the Section Industrial Fermentation)

Abstract

The anaerobic co-digestion of agricultural residues emerges as a promising strategy for energy recovery and nutrient recycling within circular agricultural systems. This study aimed to optimize co-digestion parameters for vinegar residue (VR) and cattle manure (CM) using an orthogonal experimental design. Three key variables were investigated which are the co-substrate ratio (VR to CM), feedstock-to-inoculum (F/I) ratio, and total solids (TS) content. Nine experimental combinations were tested to evaluate methane yield, feedstock degradation, and digestate characteristics. Results showed that the optimal condition for methane yield comprised a 2:3 co-substrate ratio, 1:2 F/I ratio, and 20% TS, achieving the highest methane yield of 267.84 mL/g volatile solids (VS) and a vs. degradation rate of 58.65%. Digestate analysis indicated this condition generated the most nutrient-rich liquid digestate and solid digestate, featuring elevated N, P, and K concentrations, acceptable seed germination indices (GI), and moderate humification levels. While total nutrient content did not meet commercial organic fertilizer standards, the digestate is suitable for direct land application in rural settings. This study underscores the need to balance energy recovery and fertilizer quality in anaerobic co-digestion systems, providing practical guidance for decentralized biogas plants seeking to integrate waste treatment with agricultural productivity.

1. Introduction

Vinegar residue is a solid by-product generated during traditional grain-based vinegar fermentation. As one of the world’s leading vinegar producers, China reaches an annual production of up to 3 million tons of vinegar, yielding an estimated 1.8 to 2.1 million tons of vinegar residue [1,2,3]. Rich in carbohydrates, proteins, and lipids, vinegar residue holds high potential for biogas production [4]. However, improper disposal often triggers environmental issues such as odor emissions and leachate contamination [5]. VR has negligible alkalinity, and a low initial pH coupled with no buffering capacity easily leads to acidification [6]. Anaerobic digestion (AD) is widely recognized as a sustainable biotechnology for treating and valorizing organic wastes such as agro-industrial residues, offering the dual benefits of waste reduction and renewable energy production [7,8]. These advantages align with the global emphasis on a circular bioeconomy and carbon-neutral development, fueling growing interest in the co-digestion of agricultural and industrial residues in both academic and engineering fields. Co-digestion with livestock manure is regarded as an effective strategy to improve nutrient balance and process stability [9]. Among various animal manures, cattle manure was selected in this study due to its abundant availability in the study areas (Beijing and Shanxi Province) and its superior performance in comparative trials. It exhibits relatively high total solids (TS) and volatile solids (VS) contents, contains ample carbohydrates conducive to anaerobic digestion, and harbors a rich community of methanogenic microorganisms [10]. However, its high moisture content limits its suitability for thermochemical processes, thus necessitating the identification of appropriate co-substrates for enhanced resource utilization.
In batch anaerobic digestion (AD) systems, performance is significantly influenced by operational parameters such as co-substrate ratio, feedstock-to-inoculum (F/I) ratio, and total solids (TS) content [11,12]. By contrast, continuous AD systems are more affected by organic loading rate (OLR), hydraulic retention time (HRT), and feed frequency, which govern substrate availability and microbial stability. The co-substrate ratio alters the biochemical composition of the feedstock, affecting the proportions of carbohydrates, lipids, and proteins, and thereby impacts intermediate metabolite profiles and methane yield [13]. Co-digestion has been reported to increase cumulative methane yield by 1.27 to 3.46 times compared to mono-digestion [14]. Li et al. [15] reported that adding 20–40% tomato waste (based on VS) to a mixture of CM and corn straw significantly enhanced methane yield, with a 31% increase as tomato waste content rose from 0 to 40%. Inoculum ratio supplies active microbial consortia and essential nutrients, enhancing buffering capacity [16]. However, both a low and excessively high inoculum ratio can negatively affect performance; low ratios may prolong the lag phase and cause acidification, while high ratios can limit volatile gas productivity due to feedstock scarcity [17,18]. Pellera et al. [19] and Demichelis et al. [20] noted that appropriately increasing the inoculum ratio helps improve cumulative methane yield and shorten startup time, but an excessively high inoculum ratio may reduce efficiency due to feedstock limitation [21]. TS content affects organic loading, mass transfer, and overall system efficiency. Although higher TS can reduce reactor volume and digestate management costs, excessive TS levels may impede diffusion, extend retention times, and diminish digestion performance [22]. Aboudi et al. [23] found that TS is positively correlated with biogas production, but excessively high TS may also cause inhibition. Previous studies [24,25] have demonstrated that the interaction between TS and inoculum ratio affects methane yield and startup time, indicating the need for coordinated optimization.
Given these interacting effects among key parameters, a systematic optimization approach is required to enhance digestion efficiency and process stability. Therefore, this study aims to investigate and optimize the anaerobic co-digestion of VR and CM under mesophilic conditions. An orthogonal experimental design was employed to evaluate the combined effects of co-substrate ratio, TS content, and inoculum ratio on methane yield and process stability. This study seeks to elucidate the interactive mechanisms among these parameters and provide practical recommendations for improving the efficiency and engineering feasibility of biogas systems utilizing agro-industrial by-products.

2. Materials and Methods

2.1. Feedstock and Inoculum

VR was collected from a vinegar factory in Shanxi Province, China. The residue exhibited a dark brown color, fibrous texture, and high moisture content. CM was sourced from a livestock farm in Changping District, Beijing. The inoculum was obtained from a stable mesophilic anaerobic digester operating at 37 ± 1 °C, which had been previously fed with cattle manure. The basic physicochemical properties of the vinegar residue, cattle manure, and inoculum including TS, VS, pH, and C/N ratio were analyzed, and the results are presented in Table 1.

2.2. Experimental Design

Anaerobic digestion experiments were conducted in 5 L anaerobic reactors with an effective working volume of 4 L. All treatments were performed under mesophilic conditions (35 ± 1 °C). Each reactor was equipped with a bottom-mounted electric heating element for temperature control, and an automatic thermostat ensured constant temperature throughout the process. An insulating jacket was wrapped around each reactor to minimize heat loss. The digesters were automatically stirred twice daily at 180 rpm for 15 min. Biogas produced during digestion was collected in 5 L Tedlar gas bags (Safe-Laboratory Inc., Beijing, China). The volume and composition of the biogas were measured daily.
A three-factor, three-level orthogonal experimental design (L9(34)) was employed to evaluate the combined effects of three key parameters on anaerobic co-digestion performance: (1) co-substrate ratio of VR to CM (based on VS), (2) F/I (based on VS), and (3) TS content. Each factor was tested at three levels: (1) co-substrate ratio of 3:1, 3:2, and 2:3, (2) F/I of 2:1, 1:1, and 1:2, and (3) TS content of 10%, 15%, and 20%. The experimental conditions and L9(34) design matrix are summarized in Table 2. After thorough mixing, the feedstock was loaded into 5 L anaerobic digesters and subjected to mesophilic anaerobic digestion at 35 ± 1 °C for 30 days. A total of nine treatments and one blank control were set up, with the blank control containing only the inoculum (no feedstock added). Samples were collected on days 0, 1, 3, 5, 7, 10, 15, 20, 25, and 30 and immediately stored at −20 °C for subsequent physicochemical analyses.

2.3. Index Determination Method

To evaluate anaerobic digestion efficiency, biogas composition and methane yield were monitored daily throughout the experiment. The composition of biogas (CH4, CO2, N2, and O2) was analyzed using a portable gas analyzer (Biogas 5000, Geotech, Leamington Spa, UK). Daily and cumulative methane yields were calculated by subtracting methane yield from the blank control reactor, normalizing to the initial vs. of the feedstock, and expressed as L/kg vs. [26].
In this study, the term digestate refers collectively to the post-digestion residues, which include both the solid digestate (formerly termed “biogas residue”) and the liquid digestate (formerly termed “biogas slurry”). This terminology is adopted for clarity and consistency. To characterize the fermentation environment and intermediate products, key physicochemical indicators of the digestate were analyzed. Twenty grams of fresh digestate were mixed with 20 mL of deionized water and centrifuged at 5000 rpm for 20 min (TDL-5-A, Anting Scientific Instrument Factory, Shanghai, China), and the supernatant was filtered through a 0.22 μm water-phase membrane. The pH (pHS-3C), alkalinity (ZDJ-5B), ammonium nitrogen (NH4+-N, SEAL AA3), and volatile fatty acids (VFAs, including acetic, propionic, and butyric acids) were measured. For VFAs quantification, 1 mL of supernatant was mixed with 1 mL of acetonitrile, centrifuged at 10,000 rpm for 4 min, filtered through a 0.22 μm organic-phase membrane, and analyzed by high-performance liquid chromatography (SPD-M20A, Shimadzu, Kyoto, Japan).
To assess feedstock degradation and material transformation, organic matter fractions and elemental contents were determined. TS and vs. were measured according to standard methods (APHA, 2005).
Lignocellulosic composition (soluble matter, hemicellulose, cellulose, and lignin) were analyzed using the Van Soest fiber detergent method [27] with an F57 filter bag and ANTOM 220 fiber analyzer (ANKOM Technology, Macedon, NY, USA).
Elemental composition (total carbon, TC; total nitrogen, TN) was determined by an elemental analyzer (Vario MACRO Cube, Hananu, Germany), and the C/N ratio was calculated accordingly. Digestate residues were air-dried, ground, sieved through a 200-mesh screen, and subjected to microwave-assisted digestion for nutrient content analysis [28]. Humic and fulvic acids were quantified using the sodium pyrophosphate–sodium hydroxide–potassium dichromate oxidation method (NY/T 1867-2010). To evaluate the fertilizer potential of digestate, nutrient contents and humic substances in the liquid phase were analyzed. Nutrients (total nitrogen, TN; total phosphorus, TP; total potassium, TK) in the digestate supernatant were measured using alkaline potassium persulfate digestion–UV spectrophotometry for TN (GB 11894-89), ammonium molybdate spectrophotometry for TP (GB 11893-89), and liquid chromatography for TK (GB/T 11338-1989). For humic substance analysis, the supernatant was diluted to 10 mg/L total organic carbon (TOC) and scanned by a fluorescence spectrophotometer (F97Pro, Lengguang, Shanghai, China) to obtain 3D-EEM spectra, which were processed using Origin 2018 software.
To ensure the agronomic safety of digestate application, microbial community analysis and seed germination tests were conducted. Microbial community structure was assessed by DNA extraction, high-throughput sequencing, and bioinformatics analysis performed by Allwegene Biotechnology Co., Ltd. (Beijing, China) using samples frozen at −25 °C.
The GI was evaluated by placing 5 mL of digestate filtrate in Petri dishes lined with filter paper, adding 10 cabbage seeds, and incubating at 25 ± 1 °C for 48 h. Germination rate and root length were recorded, with distilled water as the control. GI was calculated as follows:
G I   ( % ) = Germination   rate   of   sample × Average   root   length   of   sample Germination   rate   of   control × Average   root   length   of   control × 100

2.4. Statistical Analysis

Orthogonal design data were analyzed using both range analysis and analysis of variance (ANOVA). Each treatment was performed in triplicate, and results are presented as mean ± standard error. ANOVA was used to test statistical significance, followed by Tukey’s Honestly Significant Difference (HSD) test for mean comparisons (p < 0.05). All statistical analyses were conducted using SAS 9.2 (SAS Institute Inc., Cary, NC, USA) and Microsoft Excel 2013.

3. Results and Discussion

3.1. Methane Yield

3.1.1. Orthogonal Test Results

To optimize the co-digestion conditions of VR and CM, an L9(34) orthogonal experimental design was employed. The investigated factors included the co-substrate ratio (Factor A), the F/I (Factor B), and the TS content (Factor C). The experimental results are summarized in Table 3. Range analysis (R) was conducted to assess the relative impact of each factor on cumulative methane yield, where a larger R value indicates a more pronounced effect. Among the three factors, TS content exhibited the highest R value (273.06), followed by F/I (B, R = 271.64), the error term (D, R = 163.57), and the co-substrate ratio (A, R = 58.28). This suggests that TS content and the inoculum ratio are the dominant factors influencing methane yield. Notably, the R value of Factor A was smaller than that of the error term, implying its negligible influence on the outcome. The highest cumulative methane yield (238.73 L/kg VS) was achieved in T2 (Figure 1), which featured a VR:CM ratio of 3:1, an F/I of 1:1, and a TS content of 15%. These results highlight that a moderate TS content and inoculum ratio significantly promote methane generation during co-digestion. A study on wheat straw digestion reported that the F/I ratio primarily influences methane production during the start-up phase, while TS content becomes the dominant factor during the growth phase. This indicates that the inoculum ratio is critical for initiating HS-AD but may interact with TS levels during prolonged operation [29]. However, in a semi-continuous low-solids (3.5–5.5% TS) digestion of agricultural substrates, higher inoculum ratios improved volumetric methane productivity (2.42 mN3/m3·d) compared to high-solids conditions. This supports the argument that reducing the F/I ratio enhances performance across TS spectrums [30]. Furthermore, subsequent physicochemical and microbial analyses were categorized and interpreted based on TS content, the factor exerting the most substantial impact on methane yield. Table 4 presents the results of an ANOVA. Although range analysis revealed differences among factor levels, none of the factors showed statistically significant effects on methane yield (p > 0.05). This may be attributed to variability introduced by uncontrolled environmental factors and experimental errors.

3.1.2. Dynamic Changes in Daily Methane Yield

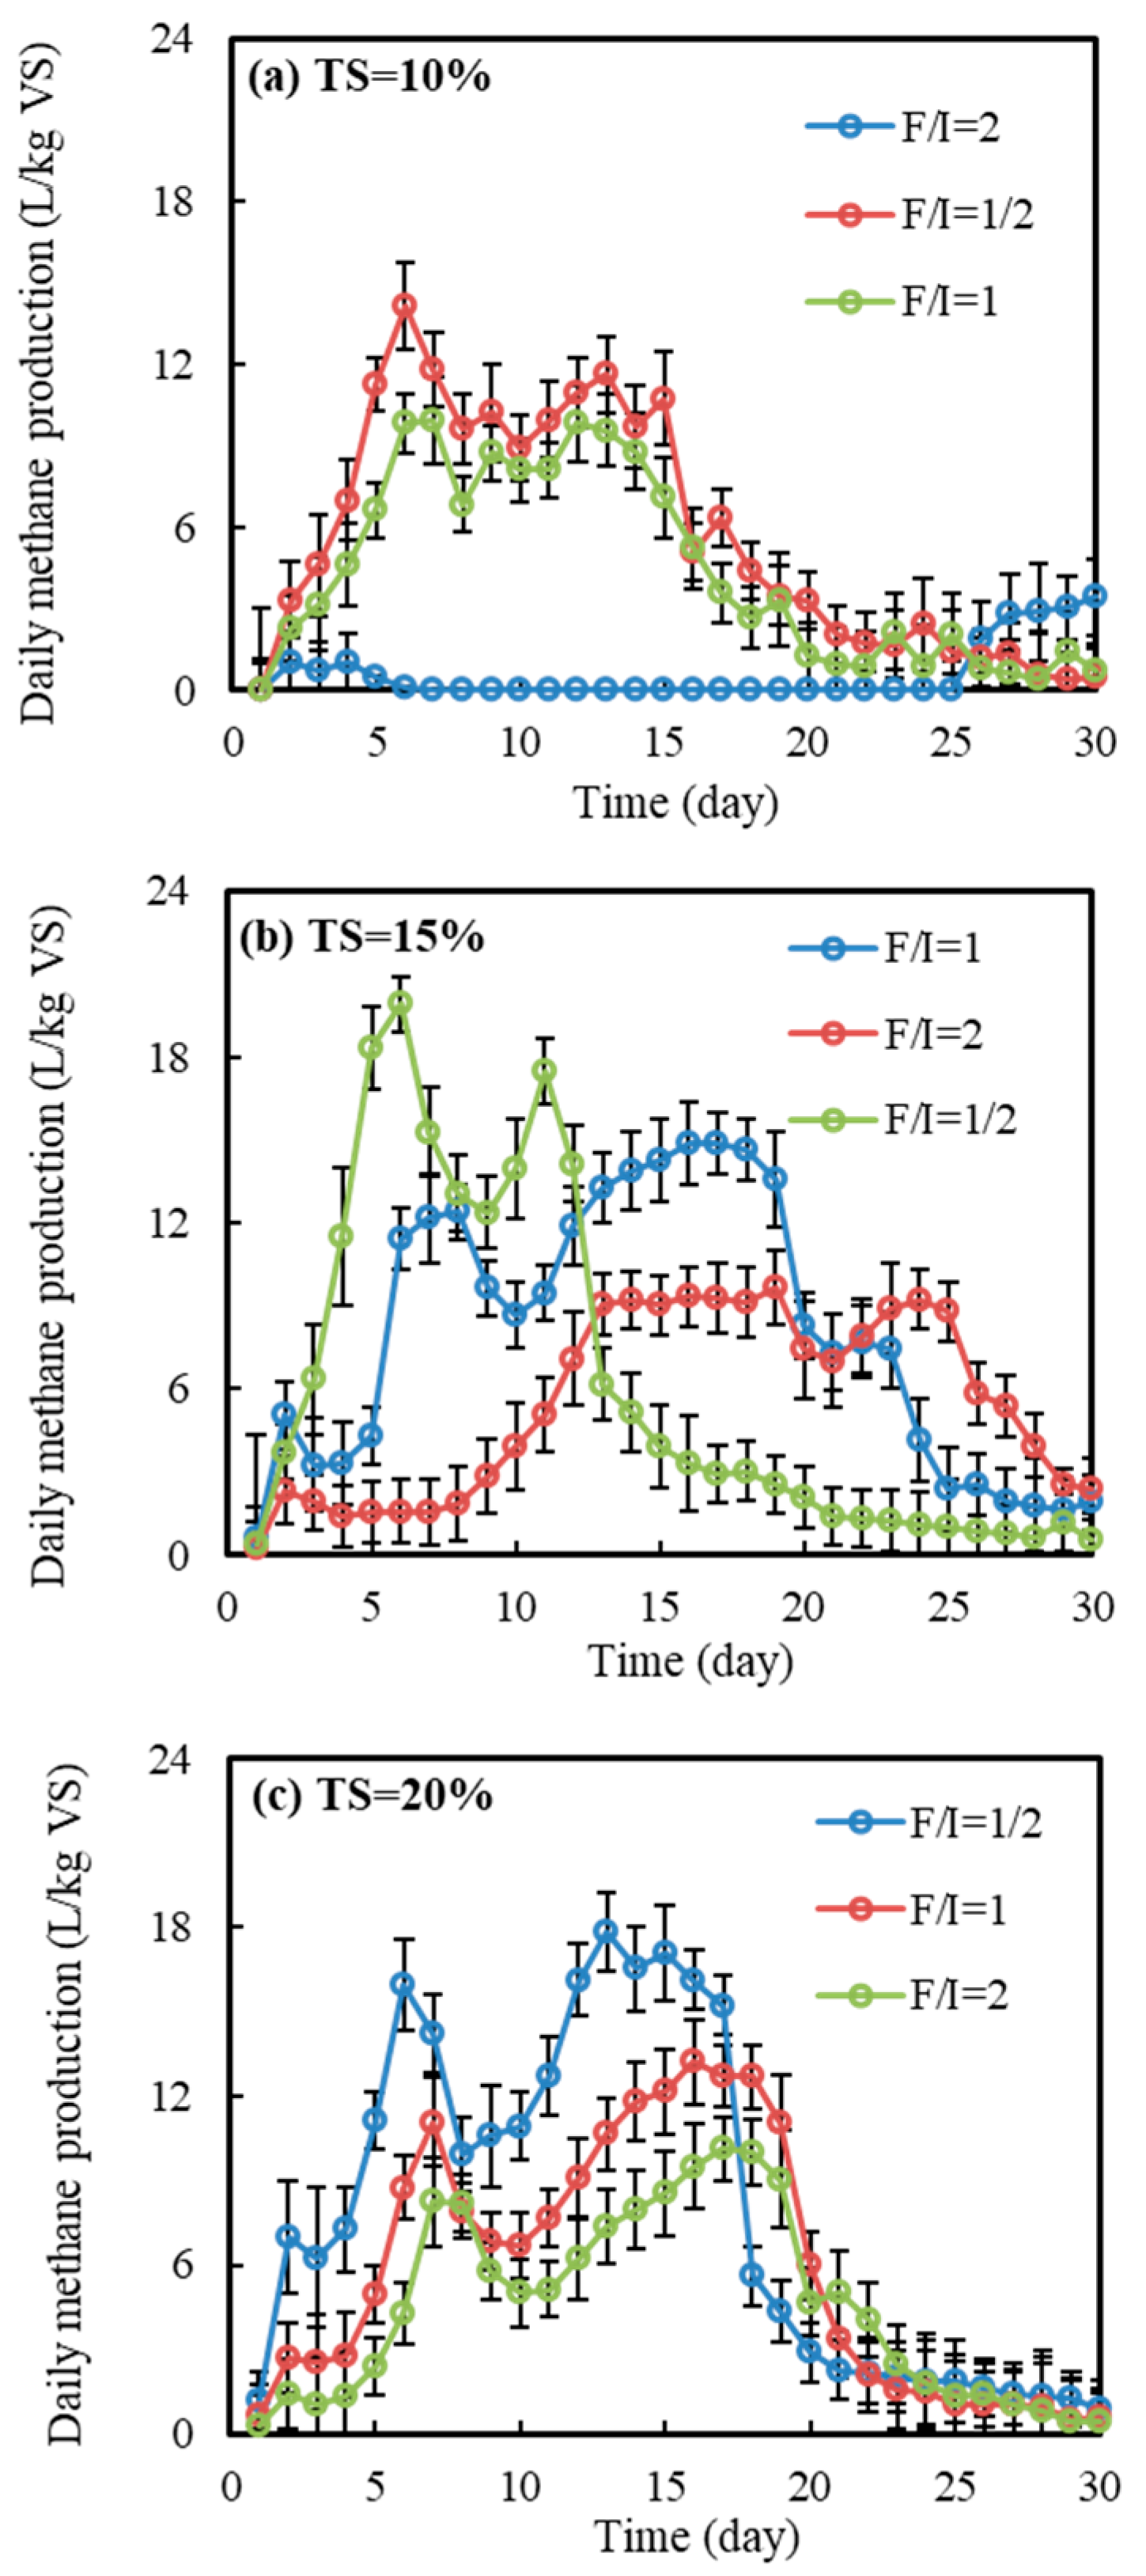
Figure 2 illustrates the dynamic changes in daily methane yield under varying TS conditions. At a TS content of 10%, T1 (F/I = 2, VR:CM = 3:1) exhibited negligible methane yield until day 25, yielding only 3.43 L/kg vs. (Figure 2a). This suboptimal performance can be attributed to the high VR content (75%) and low inoculum ratio (33.33%), which likely reduced buffering capacity and inhibited microbial activity. In contrast, T6 (F/I = 1/2, VR:CM = 3:2) and T8 (F/I = 1, VR:CM = 2:3) displayed biphasic production profiles, with primary peaks on days 6–7 (14.16 and 9.94 L/kg VS, respectively) and secondary peaks on days 12–13 (11.63 and 9.83 L/kg VS). T6 consistently outperformed T8, likely due to its higher inoculum ratio.
At 15% TS, all treatments showed improved daily methane yields. T9 (F/I = 1/2, VR:CM = 2:3) exhibited the fastest start-up and highest peak (19.90 L/kg VS), exceeding those of T2 and T4 by 33.92% and 106.22%, respectively (Figure 2b). This superiority may stem from enhanced microbial metabolism under a higher inoculum ratio. T2 displayed dual peaks on days 8 and 16, while T4, with a high F/I ratio, showed delayed peaks on days 14 and 19.
At 20% TS, all treatments followed similar trends with distinct dual peaks. T3 (F/I = 1/2, VR:CM = 3:1) demonstrated the fastest methane yield, peaking on days 6 and 13 (15.94 and 17.85 L/kg VS), outperforming T5 and T7 by 35.02% and 76.56%, respectively (Figure 2c). This performance advantage likely resulted from increased microbial activity stimulated by a higher inoculum ratio. Collectively, across all TS levels, reducing the F/I ratio, thereby increasing the inoculum ratio, accelerated the onset and enhanced the magnitude of methane yield peaks. Numerous studies have demonstrated that lowering the F/I ratio improves methane production kinetics. A study showed that reducing the substrate-to-inoculum ratio (SIR) from 6:1 to 1:1 significantly increased methane yield (from 232 to 554 mL/g VS) and reduced the lag phase by 77.3%. This effect was attributed to the higher microbial activity and shorter adaptation time of the inoculum-rich environment (the effect of substrate/inoculum ratio on the kinetics of methane production in swine wastewater anaerobic digestion). In a co-digestion study of food waste and paper packages, the highest methane yield (530 L/kg VS) was achieved at an F/I ratio of 0.5. Higher F/I ratios led to lower cumulative yields due to acidification, highlighting the importance of inoculum proportion in maintaining process stability.

3.1.3. Dynamic Changes in Methane Concentration

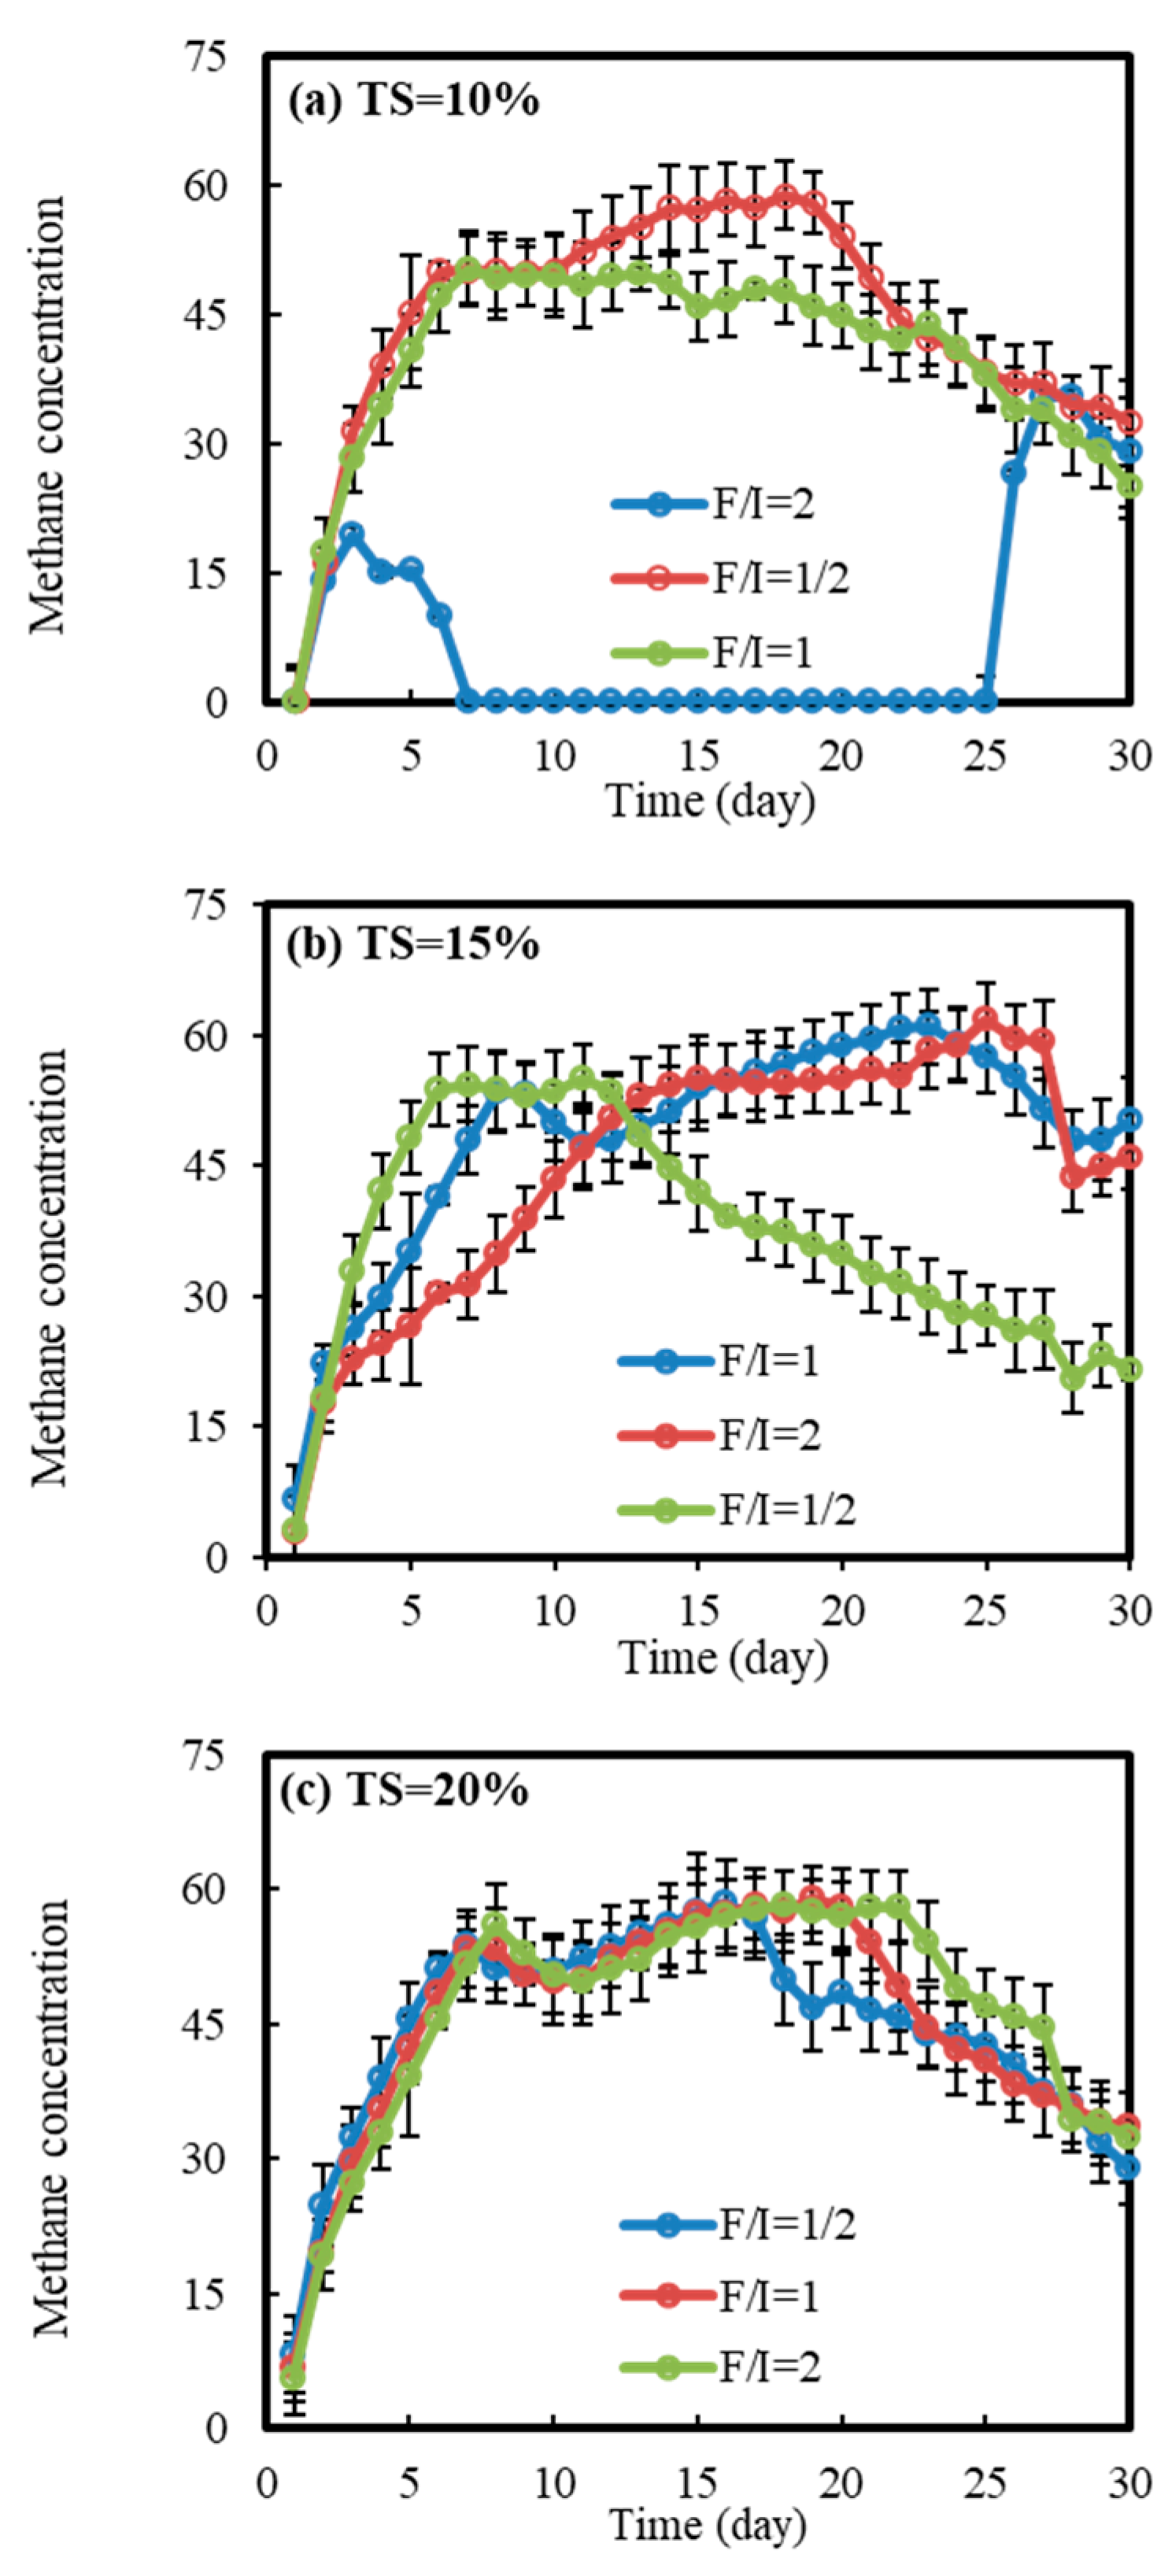
Figure 3 depicts the trends in methane concentration under different TS conditions. At a TS content of 10% (Figure 3a), T1 (F/I = 2, VR:CM = 3:1) showed negligible methane yield during the first 25 days, with a final concentration of only 29.00%. This is likely attributed to acidification and suppressed microbial activity caused by the high VR content (75%) and low inoculum ratio. In contrast, T6 and T8 exhibited gradual increases in methane concentration, peaking at 58.37% and 50.36%, respectively. T6 outperformed T8 slightly due to its higher inoculum ratio. At 15% TS, all treatments displayed a lag phase followed by an increase in methane concentration (Figure 3b). T9 reached the 50% threshold earliest (day 6), but the concentration declined after day 10, possibly due to feedstock depletion. Conversely, T2 and T4 maintained methane concentrations above 50% for 17 and 16 days, respectively, with peak values of 60.75% and 61.90%, indicating more stable methane yield. At 20% TS, all treatments reached methane concentrations above 50% around days 6–7, peaking at 58.43%, 58.90%, and 58.17%, and maintaining stability for 12–17 days before gradually declining (Figure 3c). Overall, methane concentration trends closely paralleled those of daily methane yield. Treatments with higher inoculum generally entered the methane-producing phases more rapidly and sustained stable performance for longer durations. A thermophilic AD study demonstrated that ISRs of 30–40% maintained stable pH (6.4–8.6) and methane content (~70%) across TS levels (8–10%). This stability was linked to balanced microbial activity and reduced substrate overloading [31]. In semi-solid co-digestion of rape straw and dairy manure, ISRs of 3.5 enriched Methanosarcinales (77.46% relative abundance), which efficiently degrade acetate. Conversely, low ISRs favored hydrogenotrophic Methanobacterium, leading to slower VFA turnover [23]. A food waste AD study revealed that ISR = 1:3 promoted synergistic relationships between Bacteroides (acidogens) and Methanoculleus (hydrogenotrophs). This syntrophy enhanced propionate degradation and methane yield (407.93 mL/g VS), while high ISRs (4:1) caused Clostridium-dominated acidification [32].

3.1.4. Cumulative Methane Yield

Figure 4 illustrates the cumulative methane yield under different TS levels. At a TS content of 10% (Figure 4a), T1 (F/I = 2, VR:CM = 3:1) produced less than 20 L/kg vs. throughout the digestion period, likely due to a low inoculum ratio and insufficient buffering capacity. T6 (F/I = 1/2, VR:CM = 3:2) achieved the highest cumulative yield (169.78 L/kg VS), outperforming T8 (F/I = 1, VR:CM = 2:3) by 30%, which suggests that a higher inoculum ratio effectively promotes methane generation.
At 15% TS (Figure 4b), T2 (F/I = 1, VR:CM = 3:1) reached the highest yield (238.73 L/kg VS), exceeding T4 and T9 by 44.42% and 28.69%, respectively. Although T9 exhibited a fast initial production rate, its performance declined in the later stage due to feedstock depletion. These results indicate that excessive inoculum can limit feedstock availability and reduce overall yield. At 20% TS (Figure 4c), all treatments showed similar trends of slow initial accumulation followed by stabilization. T3 (F/I = 1/2, VR:CM = 3:1) had the highest final yield (235.62 L/kg VS), surpassing T5 and T7 by 34.16% and 74.43%, respectively. The higher inoculum ratio likely enhanced biodegradability and microbial activity. In summary, the F/I was the dominant factor influencing cumulative methane yield within each TS level. The optimal conditions were observed under TS = 15%, F/I = 1/2, and VR:CM = 3:1, achieving the highest methane yield. Moreover, kinetic modeling, such as the first-order and modified Gompertz models, can provide further insights into methane production dynamics and support the identification of optimal operational parameters beyond CMY alone [33].

3.2. Physical and Chemical Indicators

3.2.1. pH and VFAs Variation

Figure 5 illustrates the variations in pH and VFAs under different TS conditions. At a TS content of 10% (Figure 5a,d), the pH in T1 (F/I = 2, VR:CM = 3:1) dropped sharply from 7.36 to 5.23 in the early stage, followed by a gradual recovery after day 25. This decline was likely driven by the high VR content (75%) and low inoculum ratio (33.33%), which compromised buffering capacity and caused significant VFA accumulation. In contrast, T6 (F/I = 1/2, VR:CM = 3:2) and T8 (F/I = 1, VR:CM = 2:3) showed similar trends: initial rapid acidification due to microbial hydrolysis, followed by VFA consumption and pH recovery. In the later stages, pH stabilized between 7.49 and 8.01, indicating a buffered and stable system. A study reported pH stabilization at 7.6–7.8 in a mesophilic digester, attributed to bicarbonate alkalinity (2500–3000 mg/L as CaCO3). This range matches the argument’s pH values and highlights the role of alkalinity in neutralizing volatile fatty acids (VFAs). In a semi-continuous system, pH stabilized at 7.5–7.8 during steady-state operation, coinciding with high bicarbonate levels (1800–2200 mg/L). The authors noted that buffering capacity prevented acidification despite fluctuating organic loading rates (OLRs).
At 15% TS (Figure 5b,e), all treatments exhibited an initial pH drop followed by a gradual increase. T2 and T4 experienced more pronounced pH declines (from 7.70 to 6.44 and 7.43 to 5.81, respectively) within the first 10 days, likely due to severe acidification and VFA accumulation. Notably, T2 showed a milder decline than T4, attributed to its lower F/I ratio, which provided better buffering capacity. In T9 (F/I = 1/2, VR:CM = 2:3), the system exhibited minimal VFA accumulation (maximum 0.18 g/L), with the pH remaining within the optimal methanogenic range (7.45–7.80) throughout fermentation, facilitating efficient methane yield. At 20% TS (Figure 5c,f), all treatments showed significant early-stage VFA accumulation, causing the pH to drop from initial values of 8.21–7.88 to 7.38–6.76. However, the relatively high alkalinity of these systems likely prevented further acidification, suggesting that the buffering capacity remained adequate despite VFAs’ buildup. Overall, systems with high VR proportions (≥75%) and a low inoculum ratio (F/I = 2) were susceptible to acidification. In contrast, treatments with lower F/I ratios (1:1 or 1:2) generally demonstrated stronger buffering capacity and greater stability, supporting efficient anaerobic digestion.

3.2.2. Alkalinity and Ammonium Nitrogen Variation

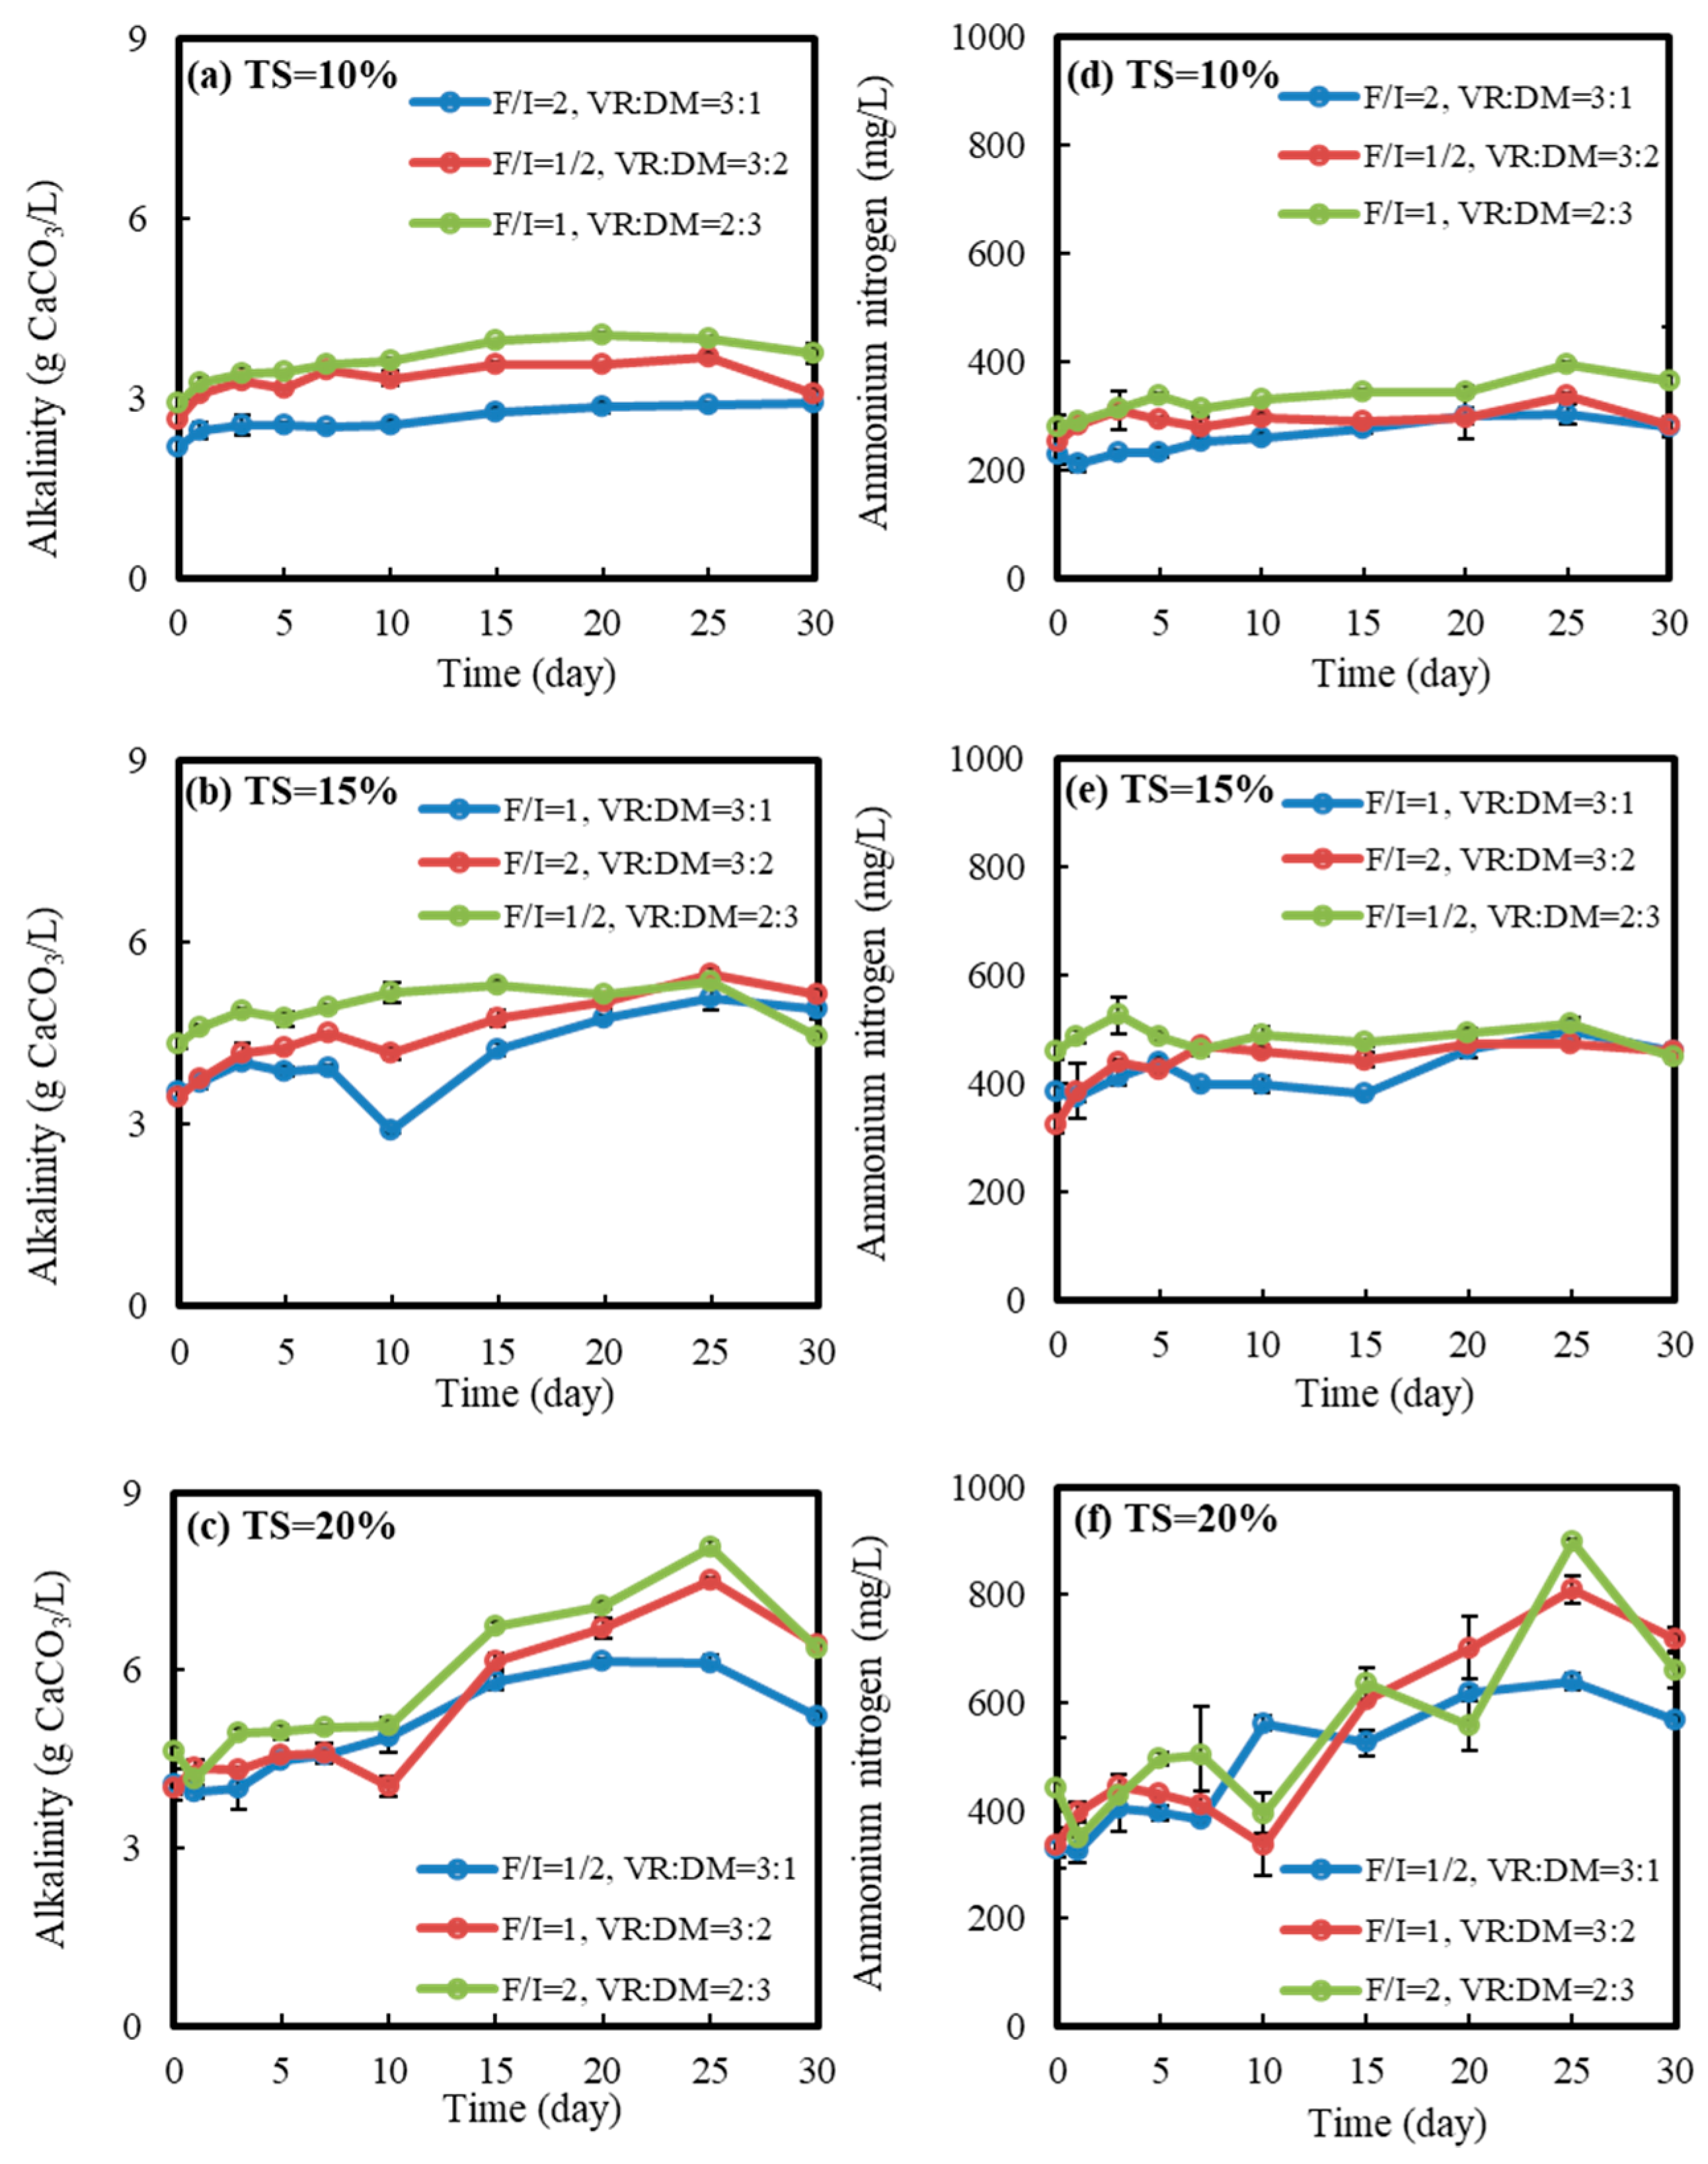
Figure 6 illustrates the temporal dynamics of alkalinity and ammonium nitrogen (NH4+-N) during anaerobic digestion. At a TS content of 10% (Figure 5d and Figure 6a), alkalinity and NH4+-N levels in all treatments exhibited moderate fluctuations. Alkalinity ranged from 2.17 to 4.06 g CaCO3/L, and NH4+-N ranged from 210 to 394 mg/L. T1 (F/I = 2; VR:CM = 3:1), which maintained the lowest alkalinity throughout the process (<3 g CaCO3/L), experienced system acidification—likely attributed to the excessive VR (75%) and insufficient buffering capacity. Although T8 had slightly higher VFAs than T6 (due to a lower inoculum ratio), its higher CM proportion (60%) contributed to greater alkalinity and NH4+-N accumulation, thus maintaining system stability comparable to T6. At 15% TS (Figure 5e and Figure 6b), all treatments sustained adequate alkalinity (2.91–5.36 g CaCO3/L) and NH4+-N levels (324–526 mg/L). T2 and T4 showed a rapid decline in alkalinity between days 5 and 10, likely in response to sharp VFA accumulation. The buffering capacity of the system helped stabilize the pH and maintain fermentation efficiency. At 20% TS (Figure 5f and Figure 6c), alkalinity increased to 3.94–8.08 g CaCO3/L, and NH4+-N reached 330–897 mg/L. T5 and T7 exhibited more pronounced fluctuations in both parameters, consistent with the instability observed in their VFA profiles. The higher TS content intensified ammonia release and alkalinity demand, particularly under a suboptimal F/I. In summary, alkalinity increased with TS level (20% > 15% > 10%), and manure-rich treatments demonstrated stronger buffering capacity. By contrast, the F/I had a limited effect on NH4+-N accumulation. A balanced co-substrate ratio is crucial for maintaining system alkalinity and ensuring process stability. A high-solid AD study on wheat straw (TS = 20%) reported alkalinity of 3800 mg/L, compared to 2800 mg/L at TS = 10%. The authors attributed this to concentrated bicarbonate and ammonia from lignocellulosic breakdown. Food waste digestion at TS = 15% achieved alkalinity of 2200 mg/L, while manure co-digestion increased alkalinity to 3500 mg/L at the same TS. This highlights manure’s inherent buffering capacity.

3.3. Degradation of TS and VS

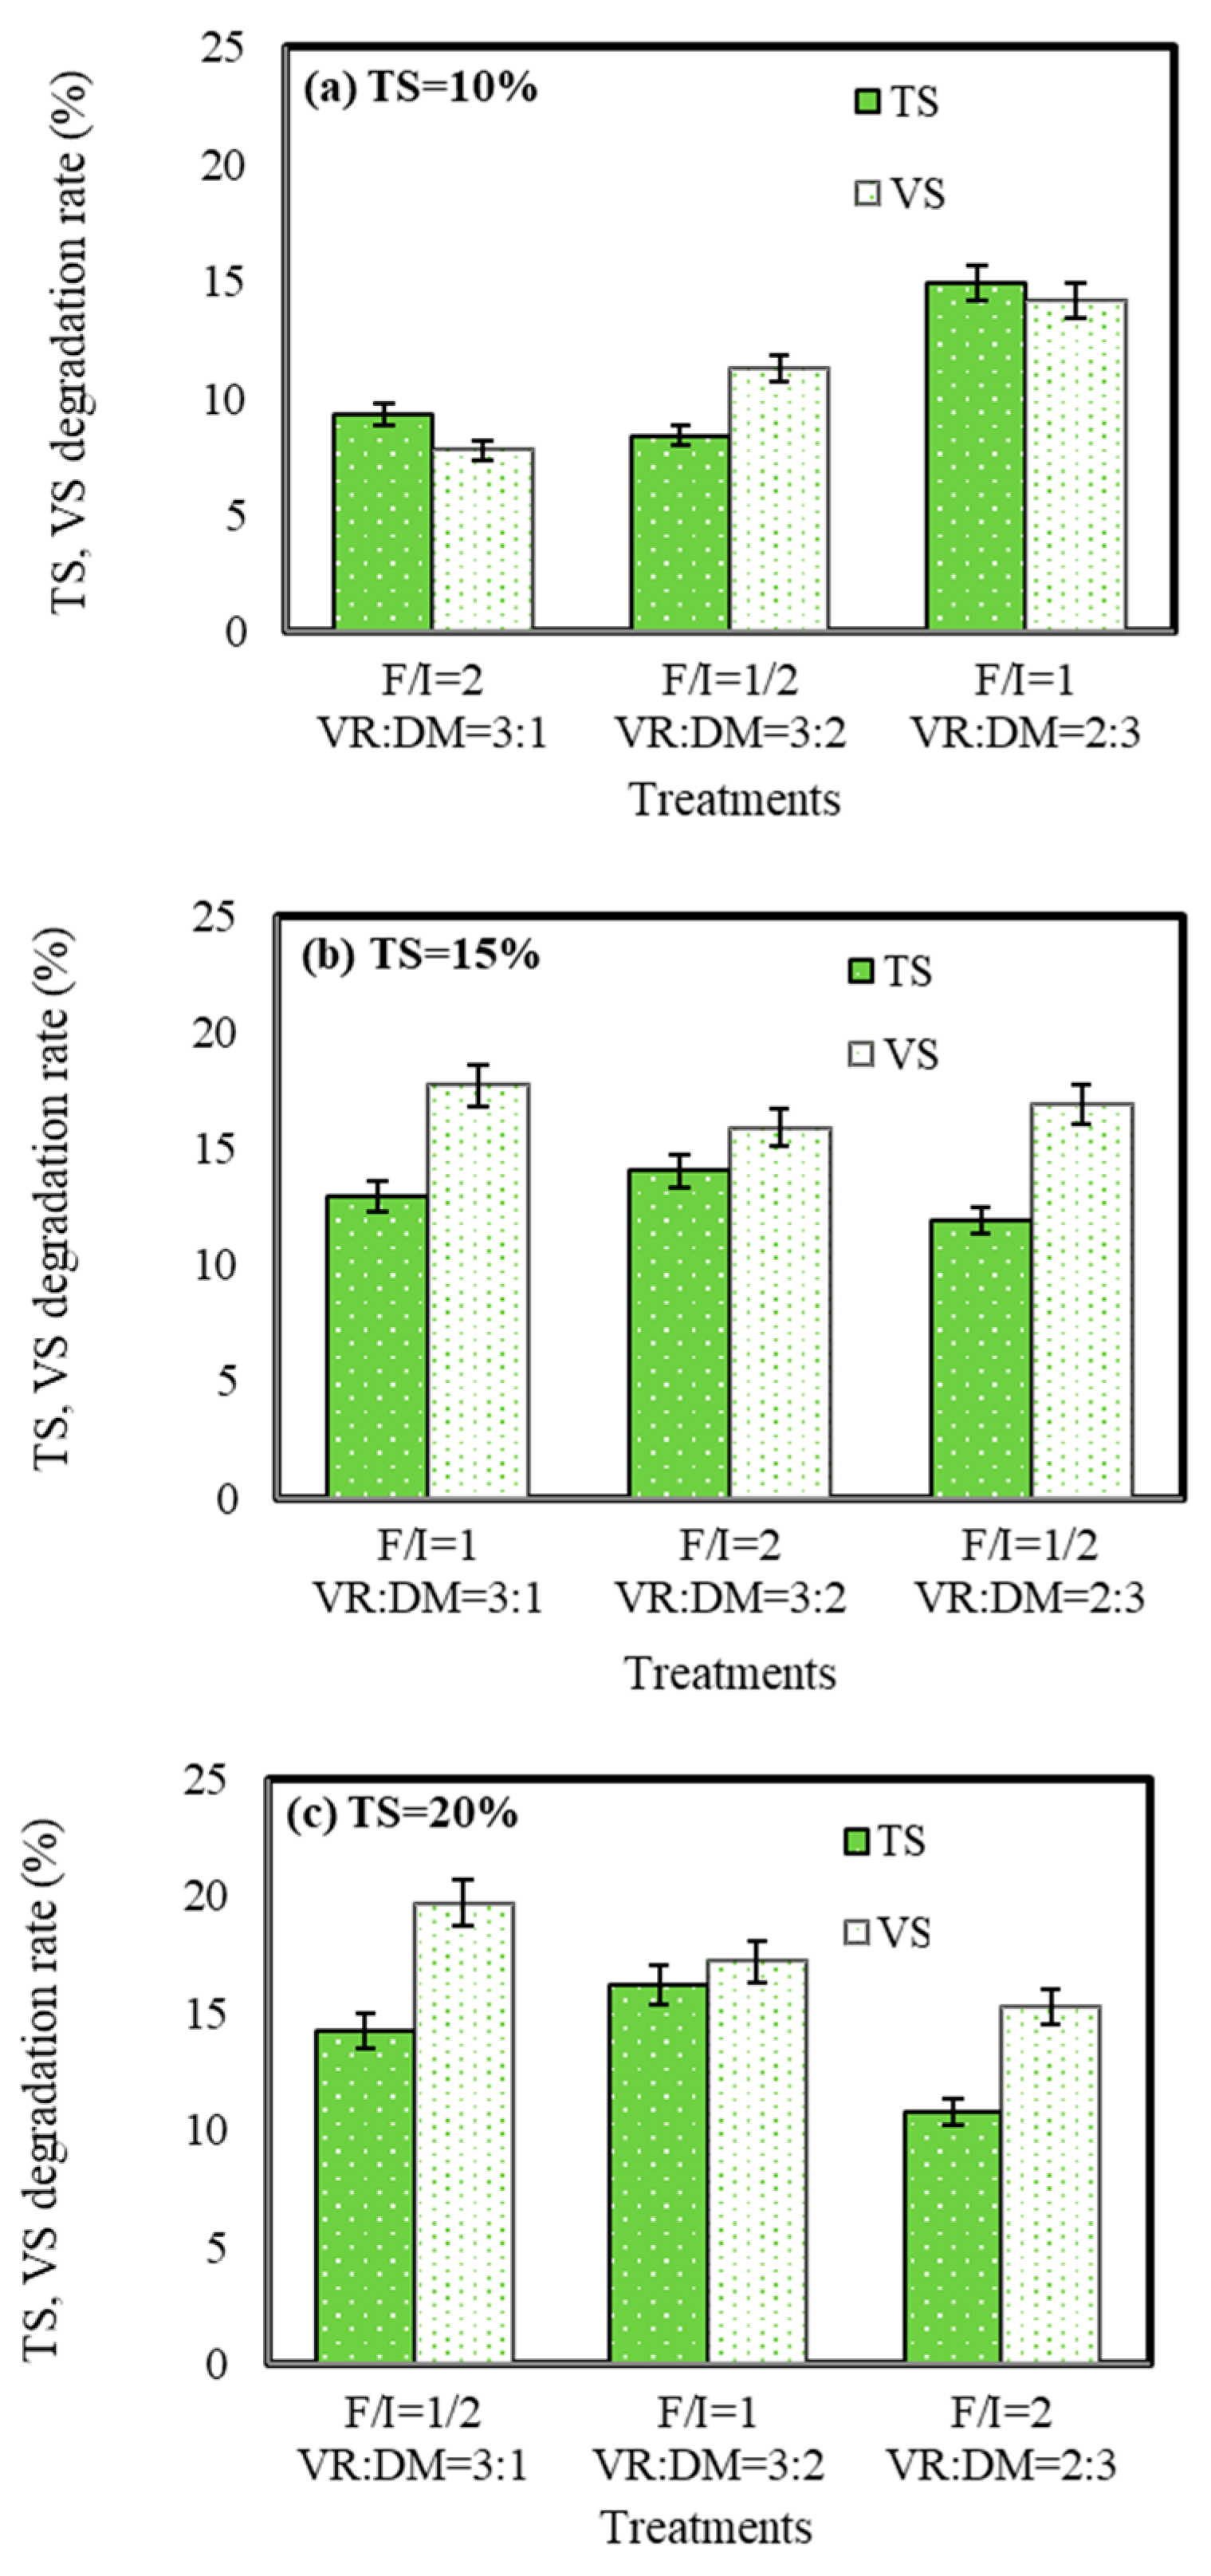
Figure 7 presents the degradation rates of TS and vs. under different total solid contents. At a TS content of 10% (Figure 7a), all treatments exhibited the lowest degradation efficiency for both TS and VS. TS degradation rates ranged from 8.38% to 14.95%, while vs. degradation rates spanned 7.77% to 14.18%. These low values can be attributed to a limited inoculum ratio and the higher lignocellulose content associated with elevated VR ratios, both of which reduced feedstock biodegradability. At 15% TS (Figure 7b), degradation performance of TS and vs. improved across all treatments. TS degradation rates ranged from 11.93% to 14.06%, and vs. degradation rates ranged from 15.90% to 17.74%. T2 (F/I = 1; VR:CM = 3:1) achieved the highest vs. degradation rate, consistent with its superior cumulative methane yield as previously reported [34]. At 20% TS (Figure 7c), T3 (F/I = 1/2; VR:CM = 3:1) maintained high degradation performance, recording the highest vs. degradation rate (19.70%) and demonstrating superior methane productivity. However, increasing F/I ratios led to reduced vs. degradation, likely due to feedstock overload and microbial inhibition under high organic loading conditions.

3.4. Nutrient Characteristics of Liquid Digestate

3.4.1. Nutrient Composition of Liquid Digestate

The anaerobic digestate exhibited high nutrient richness in its liquid fraction. The liquid digestate contained not only abundant macronutrients such as nitrogen (N), phosphorus (P), and potassium (K) but also micronutrients like Fe, Cu, and Zn, as well as amino acids and active enzymes. These nutrients predominantly exist in readily available forms, making the liquid digestate a fast-acting and efficient fertilizer for crops, consistent with previous findings. According to the Chinese agricultural standard NY/T 2596-2014, the total nutrient content (N + P2O5 + K2O) in liquid digestate should exceed 80 g/L prior to dilution. Since such fertilizers are commonly applied at a 200-fold dilution rate, the post-dilution nutrient concentration should remain above 0.40 g/L to ensure agronomic effectiveness. In this study, all treatments met this standard. The lowest concentration (1.96 g/L) was observed in treatment T1 (F/I = 2, VR:CM = 3:1), while the highest value (6.38 g/L) was achieved under a 20% TS content with a co-substrate ratio of 2:3 and an inoculum ratio of 2:1 (Table 5).
Range analysis (Table 5) and ANOVA (Table A1) confirmed that TS content had the most significant impact on total nutrient levels (p < 0.01), followed by the co-substrate ratio (p < 0.05), whereas the inoculum ratio showed no significant effect. Treatments with higher TS content (especially 20%) consistently exhibited elevated nutrient concentrations, which is likely attributed to the increased input of raw materials. In addition, nutrient-specific analyses of total N, P, and K were conducted. As shown in Table A2, the range analysis indicated that TS content was the dominant factor affecting both N and K levels, whereas total P was more influenced by the co-substrate ratio. Furthermore, the ANOVA results in Table A3 confirmed these patterns, although not all differences reached statistical significance. Notably, the optimal configuration for maximizing total N was a 2:3 co-substrate ratio, 1:1 inoculum ratio, and 20% TS; for total P, it was a 3:2 co-substrate ratio, 1:2 inoculum ratio, and 20% TS; and for total K, it was a 3:2 co-substrate ratio, 2:1 inoculum ratio, and 20% TS. These findings underscore the importance of solid concentration and feedstock selection in improving the fertilizing potential of liquid digestate. A study on food waste digestion reported that increasing TS from 5% to 15% led to a 30% increase in total nitrogen (TN) and phosphorus (TP) in the liquid digestate, but reduced potassium (TK) solubility. This was attributed to the concentration of organic matter at higher TS, which enhances nutrient retention in the solid fraction. A thermophilic AD study treating dairy manure at TS = 25% experienced ammonia inhibition (NH4+-N > 2000 mg/L), reducing nutrient bioavailability. This highlights the need to balance TS with alkalinity management. Co-digestion of maize silage with manure increased TK content in liquid digestate by 40% (from 0.9 to 1.3 g/L) due to the crop’s potassium-rich biomass. However, lignocellulosic materials like wheat straw reduced phosphorus availability (AP < 50 mg/kg) unless pretreated.

3.4.2. Humification Characteristics

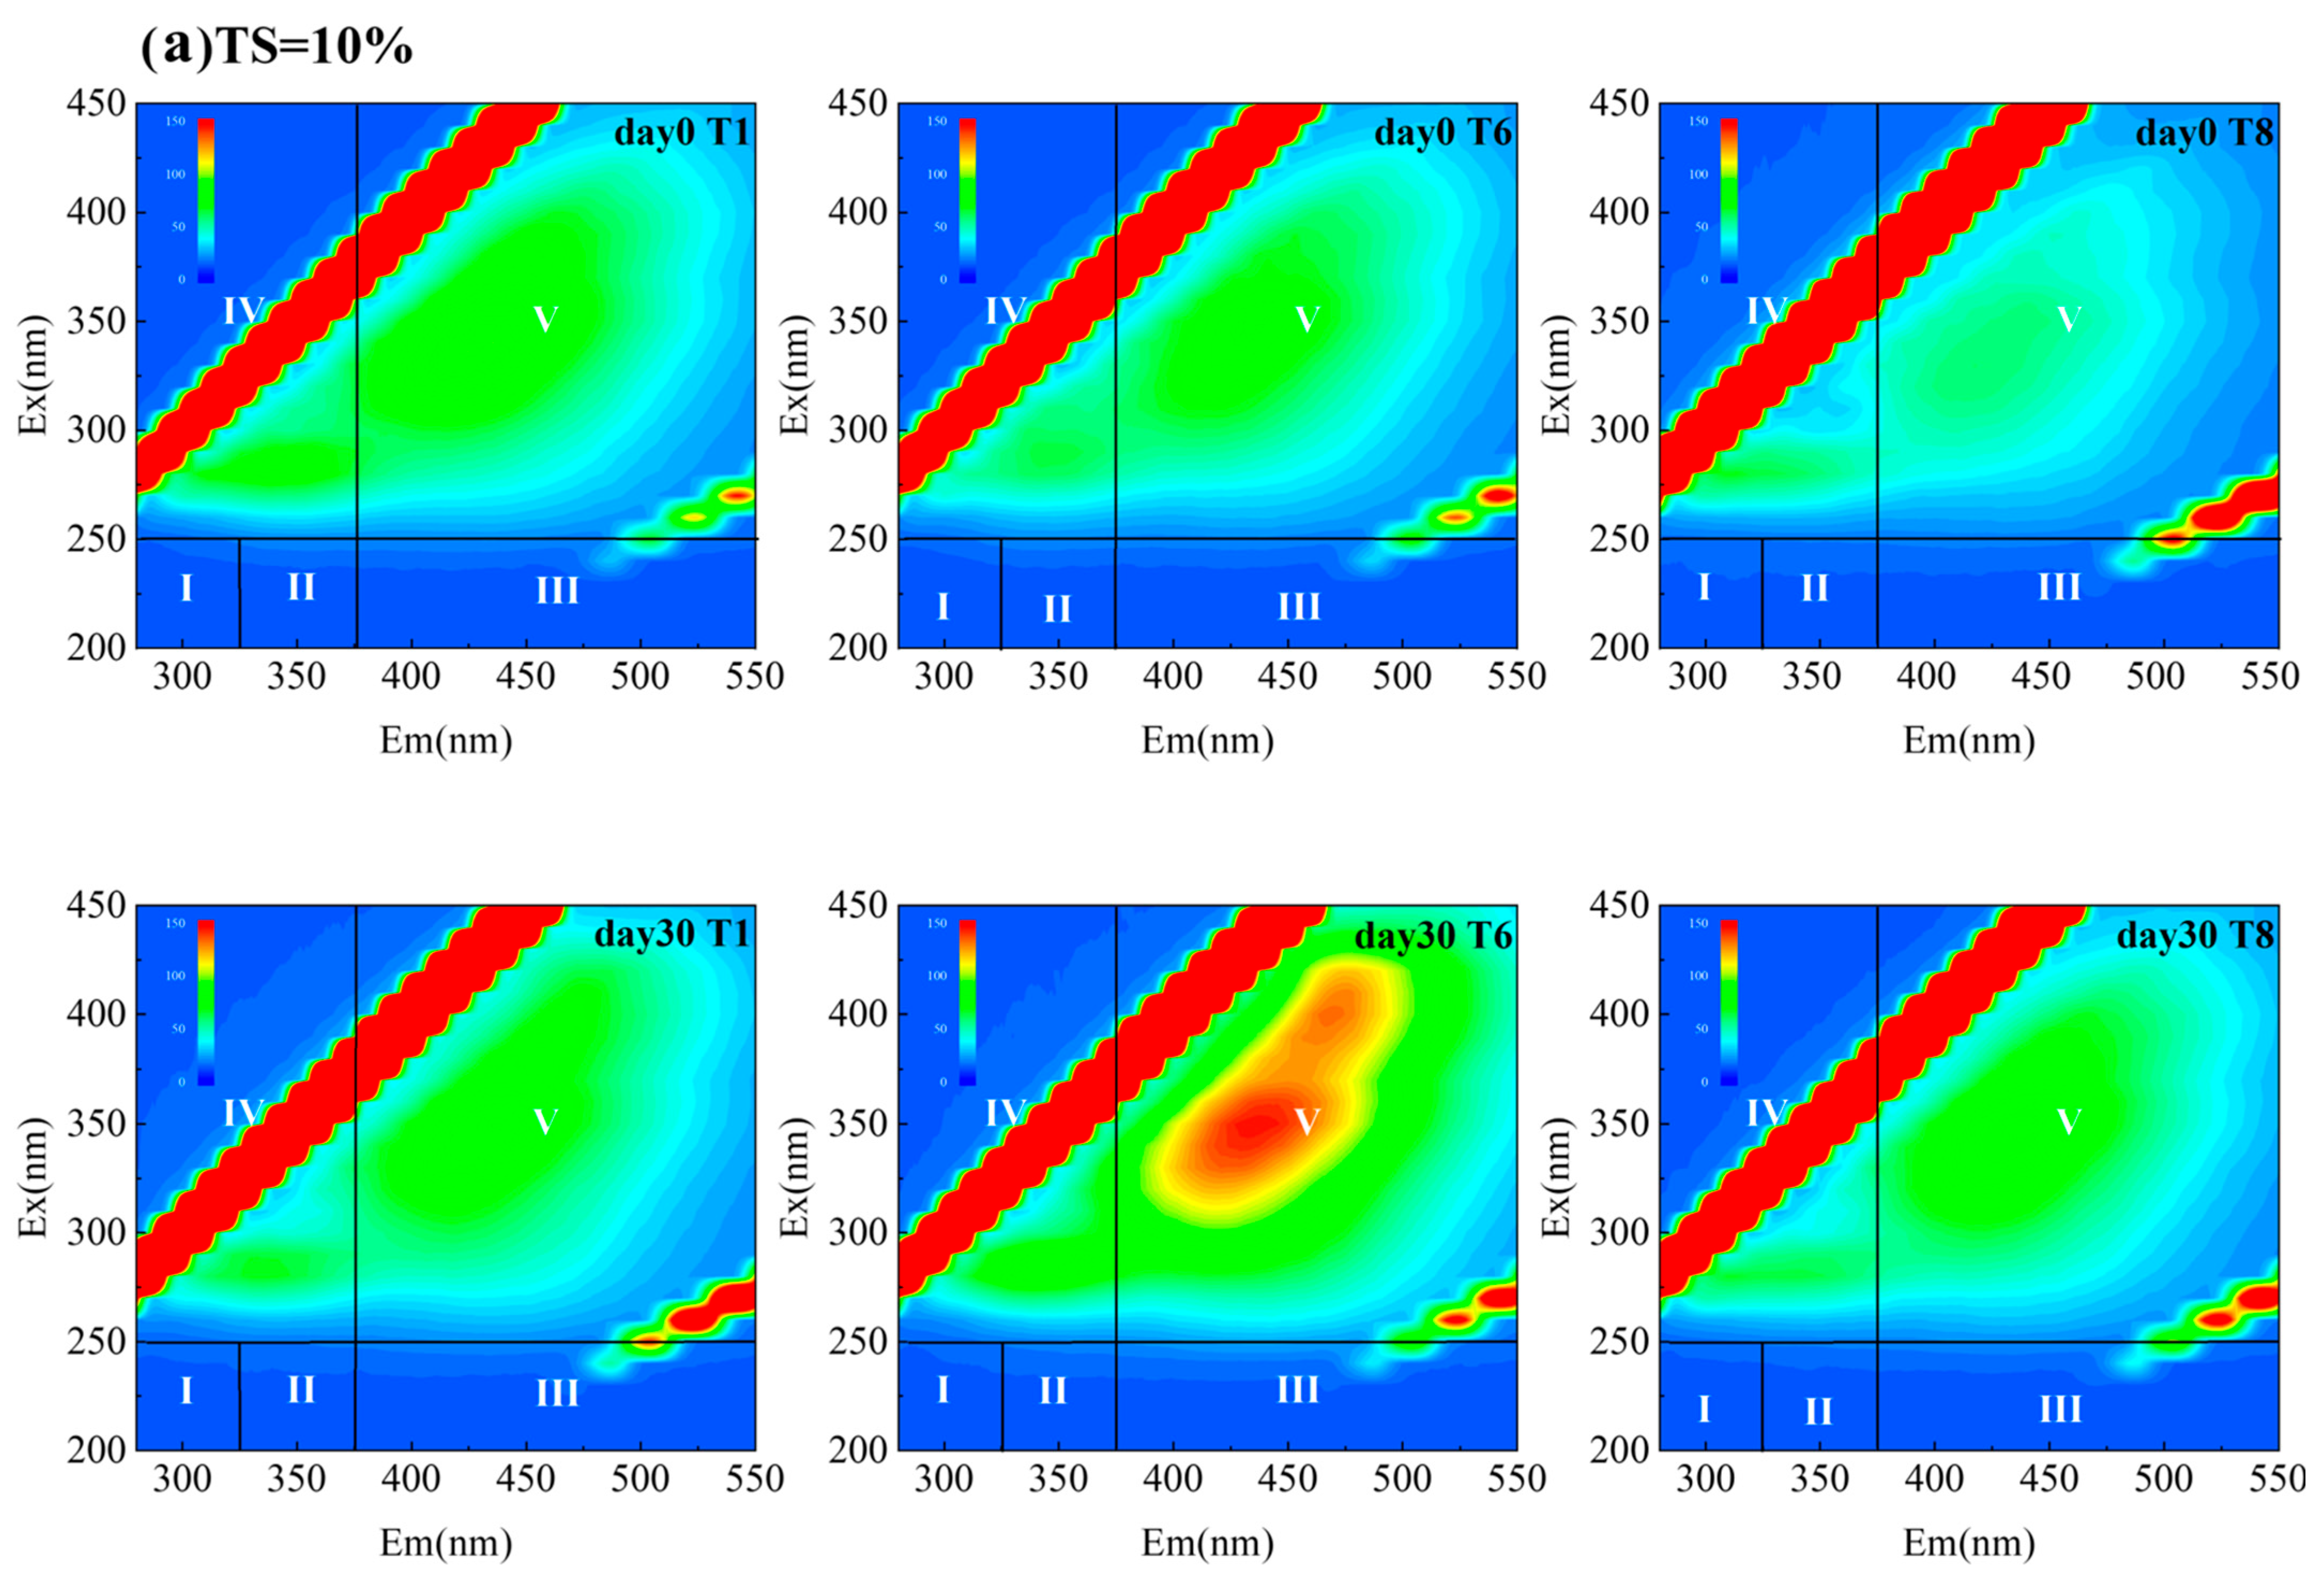
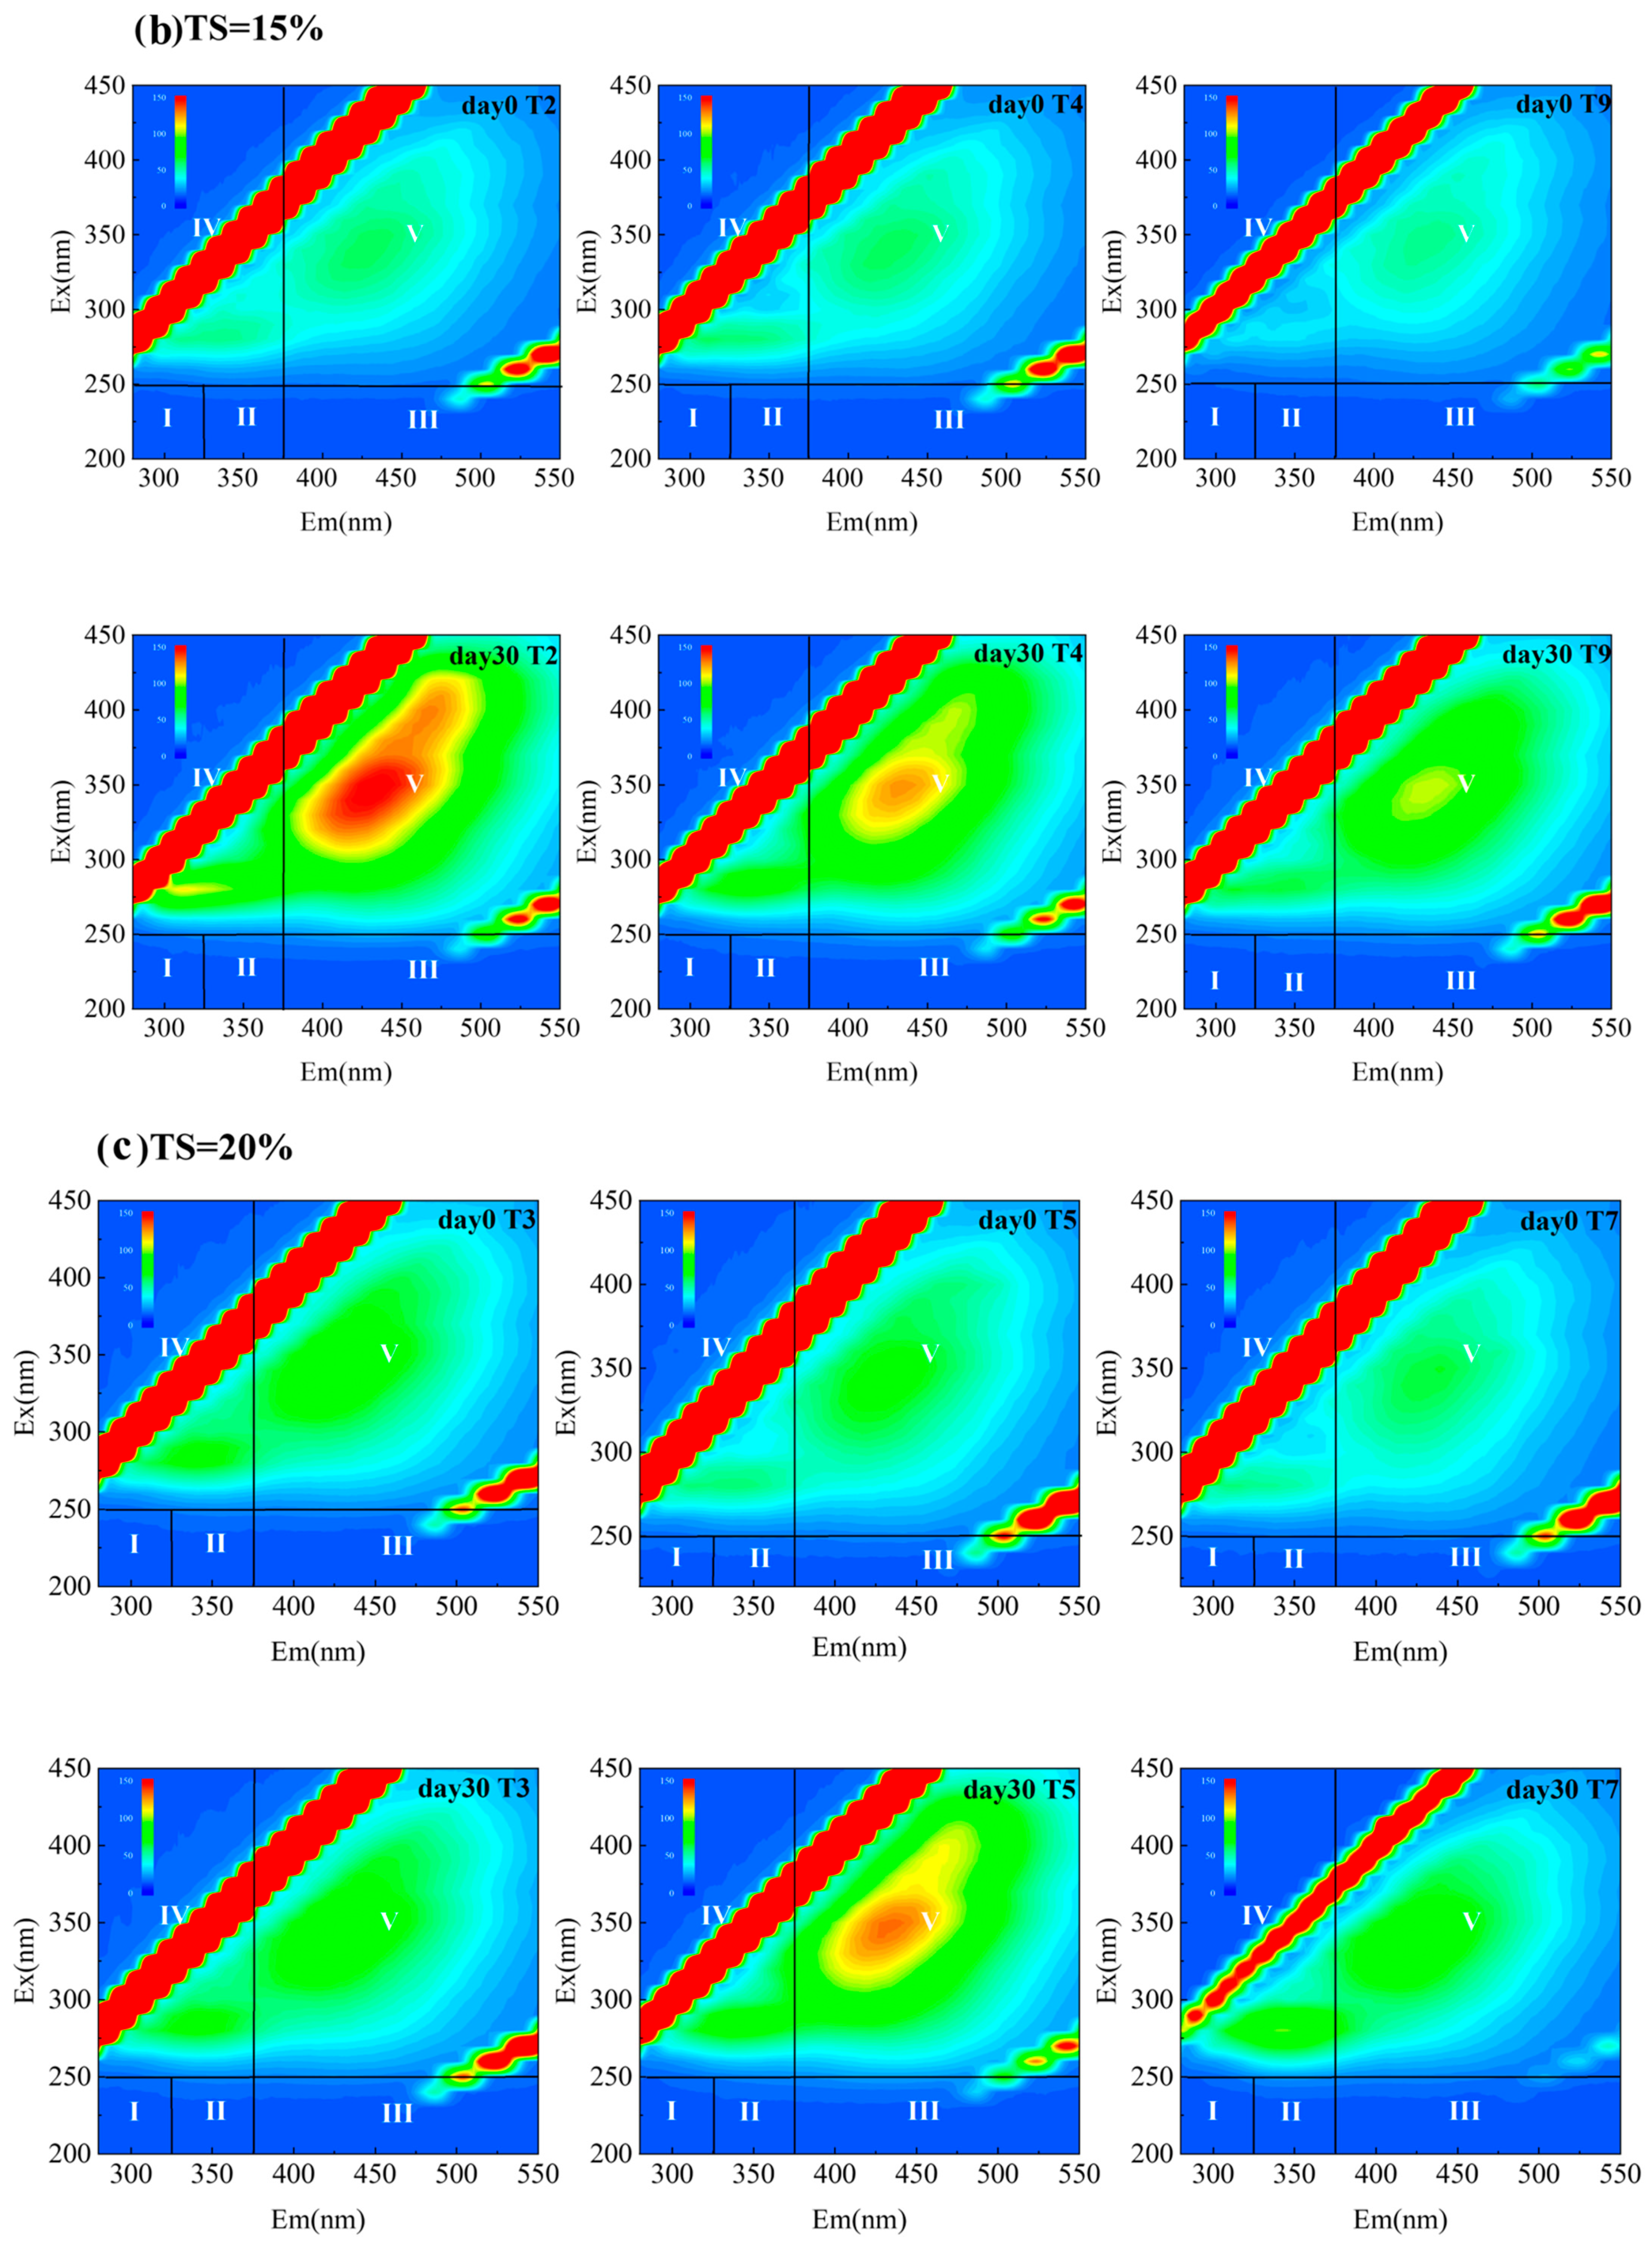
The transformation of organic matter into humic substances during anaerobic digestion was evaluated using three-dimensional excitation–emission matrix (EEM) fluorescence spectroscopy (Figure 8). Five distinct fluorescence regions were identified: Regions I (Ex/Em = 200–250/280–325 nm), II (200–250/325–375 nm), and IV (250–450/280–375 nm) are mainly associated with protein-like substances (e.g., tryptophan, tyrosine, and soluble microbial by-products), while Regions III (200–250/375–550 nm) and V (250–450/375–550 nm) represent fulvic- and humic-like substances, respectively. Across all treatments, an increase in fluorescence intensity in Regions IV and, especially, V was observed after digestion, suggesting enhanced humification. The rise in Region V was particularly pronounced in treatment T2 (F/I = 1; VR:CM = 3:1), indicating a more complete degradation of organic matter and greater accumulation of humic-like substances, which aligns with its higher methane yield.
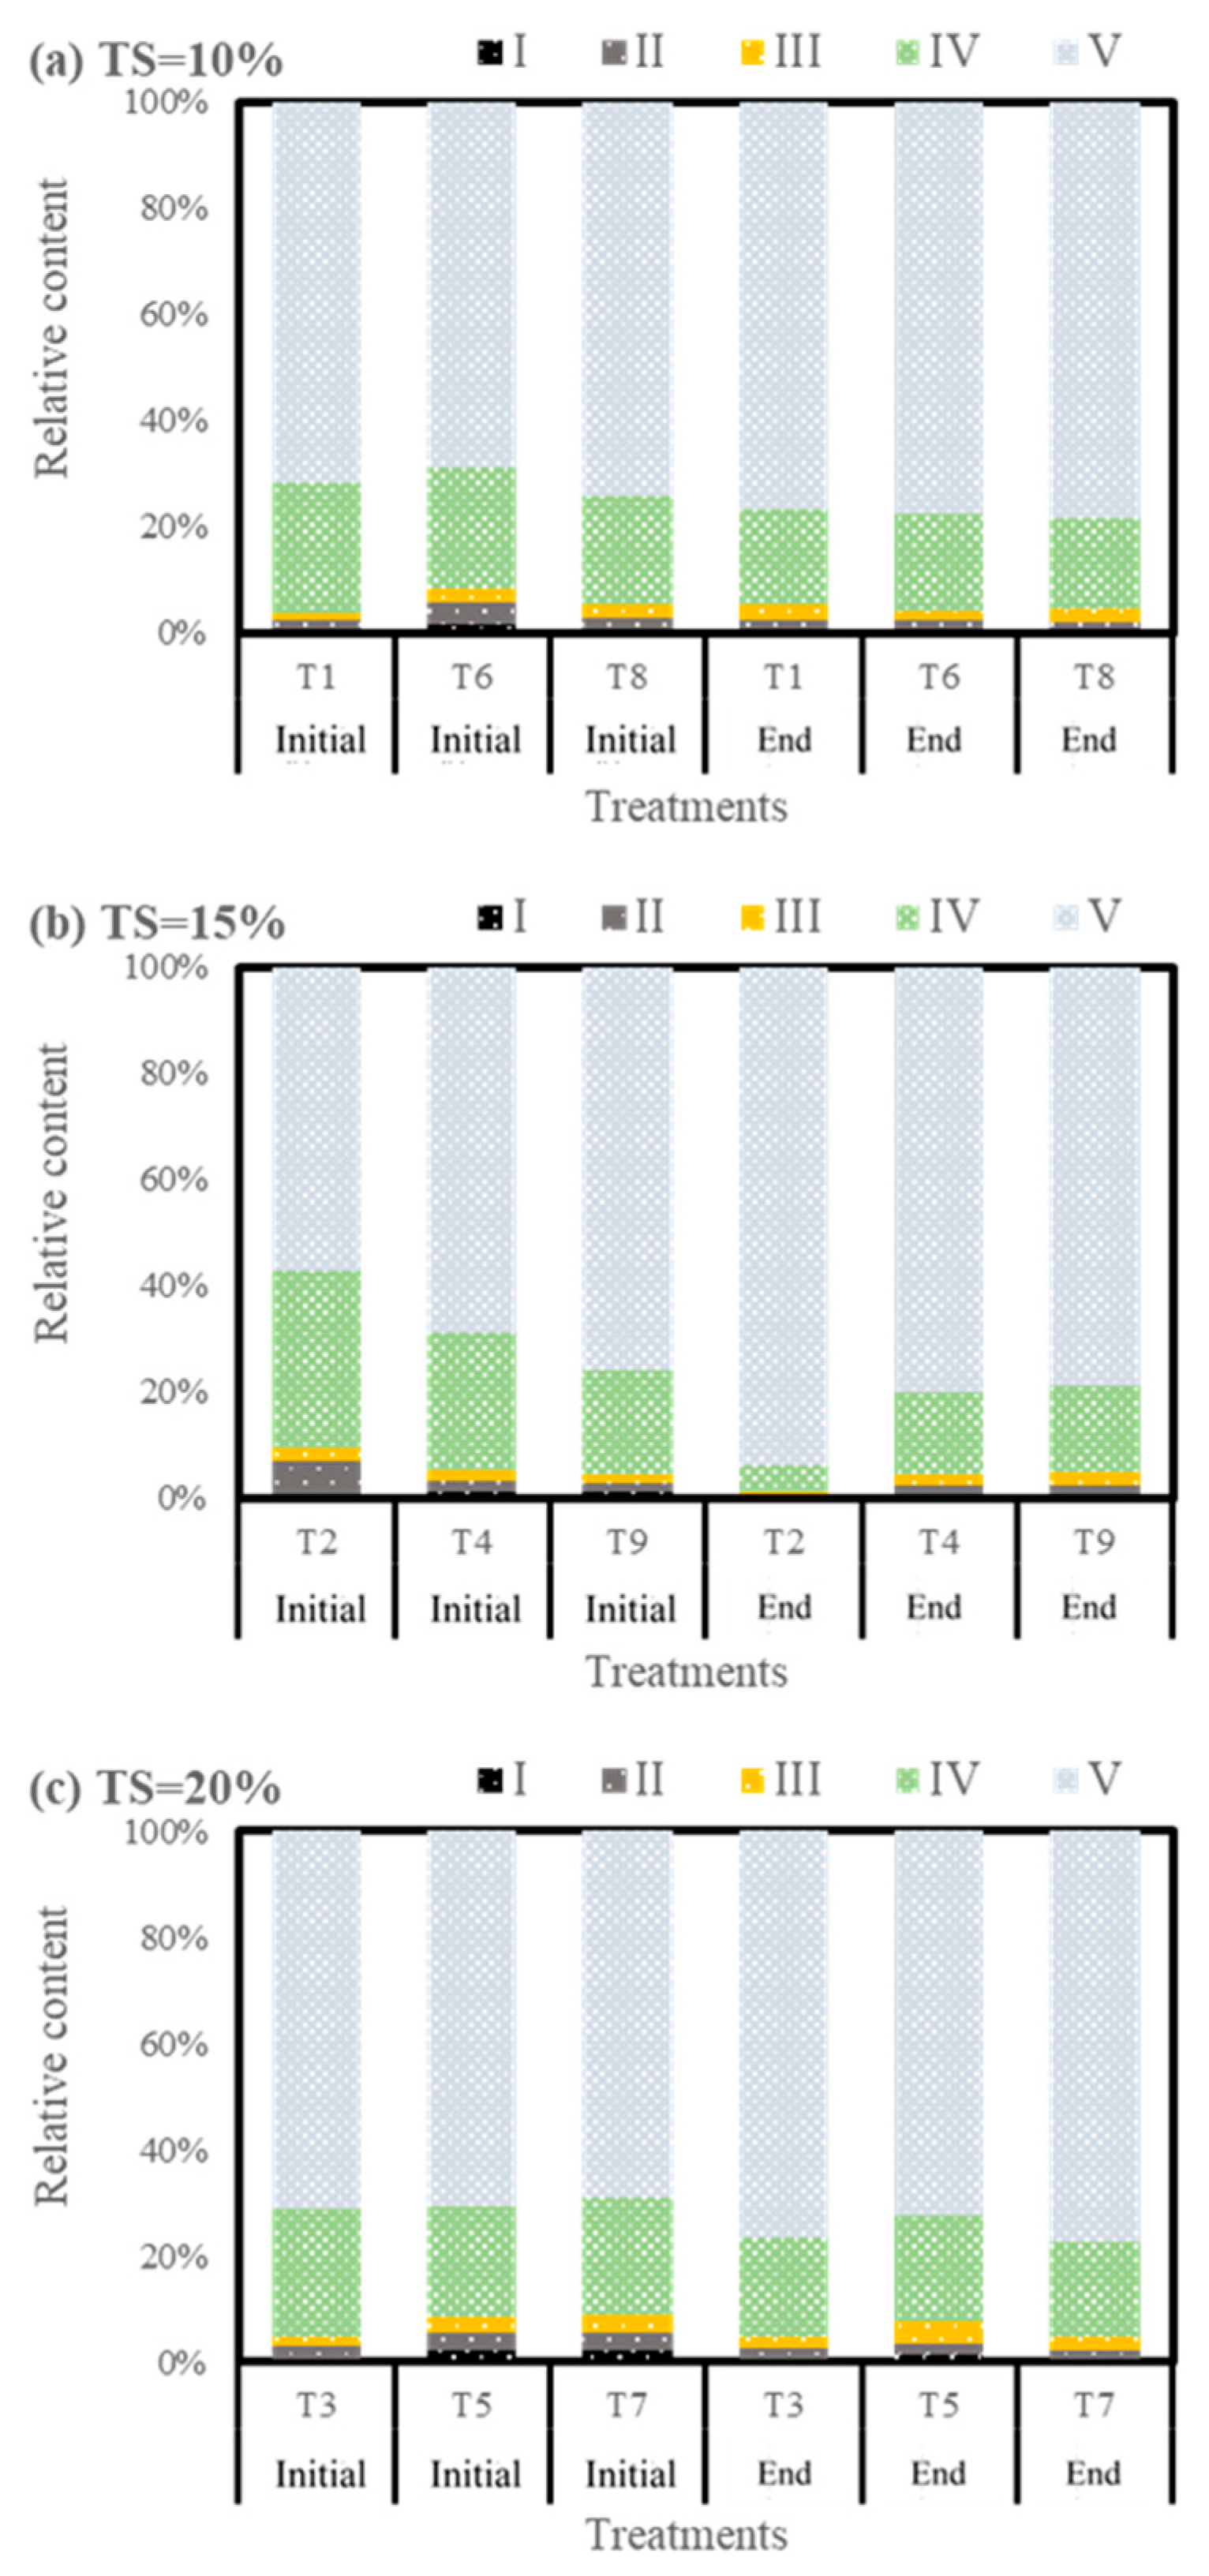
Figure 9 presents the relative proportion of each fluorescence region before and after digestion. Overall, the dominant components were humic-like substances and soluble microbial by-products. For treatments at 10% TS, humic-like substances increased by 5.60–12.41%, while fulvic-like and protein-like substances decreased markedly. Similar but more varied trends were observed at 15% and 20% TS. T2 consistently showed the highest increase in humic-like content, reinforcing its superior degradation efficiency. To assess the phytotoxicity and biological safety of the digestate, the GI was evaluated. All treatments exhibited GI values above 80%, indicating high maturity and suitability for plant growth. The optimal condition for GI was identified as a 2:3 co-substrate ratio, 2:1 feed-to-inoculum ratio, and 10% TS. Statistical analysis of GI results is provided in Table A4 and Table A5.

3.5. Nutrient Characteristics of Solid Digestate

3.5.1. Solid Digestate Nutrient Composition

The total nutrient content (N + P2O5 + K2O) in the solid digestate varied across treatments, with the highest value observed in treatment T7 (F/I = 2, VR:CM = 2:3), reaching 32.82 g/kg. This could be attributed to the higher cow dung proportion and a TS content of 20%, which increased the availability of organic matter for conversion. Although the nutrient level was below the commercial organic fertilizer standard (≥40 g/kg, NY525–2021), the solid digestate still meets the requirements for local field application. Range analysis (Table A6) indicated that the co-substrate ratio had the greatest influence on nutrient accumulation, followed by random error, sludge ratio, and TS content. However, none of the factors significantly affected the total nutrient content based on variance analysis (Table A7).
To explore the distribution of individual nutrient elements (N, P, and K), separate analyses were conducted (Table A8 and Table A9). Nitrogen content was most affected by TS and the sludge ratio, while phosphorus and potassium were mainly influenced by the co-substrate ratio. Yet, variance analysis revealed no statistically significant differences (p > 0.05) for any factor. These results suggest that while treatment conditions affect nutrient enrichment trends, their influence is not strong enough to produce statistically significant variations within the orthogonal design framework.

3.5.2. Humification Characteristics of Solid Digestate

The humification level of solid digestate was evaluated based on the contents of humic acid (HA), fulvic acid (FA), and their ratio (HA/FA). Range analysis results (Table A10) revealed that TS content was the dominant factor influencing both HA and HA/FA, while the co-substrate ratio had the greatest influence on FA. Treatments with higher TS generally resulted in greater humification levels. For instance, the highest HA content (47.50 g/kg) and HA/FA ratio (2.43) were observed in the treatment with a co-substrate ratio of 3:2, a material-to-liquid-digestate ratio of 1:2, and a TS content of 20%. These conditions appeared to facilitate the transformation of organic matter into more stable humic substances. Although the overall HA/FA ratios were below 5, indicating that the solid digestate had not yet achieved complete humification, they suggest a clear trend toward the formation of stable organic matter. This supports the potential for applying the solid digestate as a slow-release organic fertilizer, especially when high TS conditions are maintained. Variance analysis (Table A11) showed that none of the three factors—co-substrate ratio, material-to-liquid-digestate ratio, or TS content—had a statistically significant effect on HA/FA (p > 0.05), though TS content approached marginal significance (p = 0.372).

4. Discussion

The performance of anaerobic co-digestion was significantly influenced by feedstock composition. A VR:CM of 2:3, combined with an F/I ratio of 1:2 and 20% TS content, yielded the highest cumulative methane yield. This configuration likely balanced the readily degradable organic matter from VR with the buffering capacity and microbial carriers provided by CM. The elevated TS level also prolonged feedstock retention time and increased loading, thereby enhancing microbial metabolism and biogas yield.
To further clarify the relationships among key parameters, a Pearson correlation heat map was developed (Figure 10), incorporating variables such as the co-substrate ratio, TS, F/I, CMY, TSR, VSR, N, P, K, and GI. The analysis showed that CMY was strongly and positively correlated with TSR (r = 0.83) and VSR (r = 0.89), indicating that methane production was closely associated with organic matter degradation efficiency (where r denotes the Pearson correlation coefficient). Meanwhile, CMY was negatively correlated with F/I (r = −0.78), confirming that excessive inoculum may dilute organic matter and reduce volumetric productivity. The co-substrate ratio (VR:CM) also showed moderate positive correlations with N and P content, suggesting its role in determining nutrient composition of the feedstock. Interestingly, GI was positively associated with VSR (r = 0.65), implying that more complete degradation improved digestate maturity. These findings quantitatively support the interaction patterns observed during digestion and underscore the necessity of coordinated parameter optimization.
Digestate nutrient content was positively correlated with the proportion of CM and TS concentration. The highest N + P2O5 + K2O concentration in the residue (32.82 g/kg) was observed in the same group with optimal methane yield. Although the total nutrient content did not meet the NY525-2021 standard for commercial organic fertilizer (≥40 g/kg), the digestate showed potential for local application as a soil amendment. Germination index analysis under optimal conditions also confirmed acceptable maturity levels, indicating suitability for agricultural reuse.
Humic and fulvic acid concentrations in the digestate were markedly influenced by TS content and feedstock composition. Higher TS content (20%) and a 2:3 co-substrate ratio promoted enhanced humification. The increase in HA proportion suggested improved stabilization of organic matter, possibly driven by a slower decomposition rate and elevated microbial activity under these conditions. However, no single factor exhibited a statistically significant impact on the HA/FA ratio, highlighting the complex interactions governing humification dynamics.
This study demonstrates that co-digestion optimization should consider both methane yield and digestate quality. The identified optimal conditions were a co-substrate ratio of 2:3, F/I ratio of 1:2, and 20% TS, which balance energy recovery and nutrient recycling effectively. These findings are particularly relevant for small-scale biogas systems in rural areas with decentralized organic waste sources. The results support integrated resource management strategies that align energy generation with fertilizer recovery for circular agricultural development.

5. Conclusions

This study adopted an orthogonal experimental design to optimize the anaerobic co-digestion of VR and CM, comprehensively evaluating gas production, feedstock degradation, and digestate fertilizer value. The results showed that a co-substrate ratio of 2:3, an F/I ratio of 1:2, and a TS content of 20% yielded the highest methane yield (267.84 mL/g VS) and facilitated favorable feedstock utilization. Beyond gas production, this condition also generated digestate with relatively rich nutrient contents and acceptable maturity indicators, such as high GI values and moderate HA/FA ratios. Although the total nutrient content of the digestate did not fully meet commercial organic fertilizer standards, the material still shows promise for localized land application, particularly in rural circular agricultural systems. Overall, this study emphasizes the need for a multi-criteria optimization approach in anaerobic digestion research and provides valuable evidence for integrating energy recovery with organic waste recycling in small-to-medium-scale applications.

Author Contributions

Conceptualization, Y.L. (Yangyang Li); methodology, Y.L. (Yuan Lu); software, G.H.; validation, J.Z.; formal analysis, T.H.; investigation, P.T.; resources, G.L.; writing—original draft, Y.L. (Yuan Lu); writing—review & editing, Y.L. (Yangyang Li); funding acquisition, Y.L. (Yangyang Li). All authors have read and agreed to the published version of the manuscript.

Funding

This research was funded by the China Agriculture Research System (CARS-53) and the National Key R&D Program of China (grant number 2024YFD1700700). The APC was funded by the authors.

Institutional Review Board Statement

Not applicable.

Informed Consent Statement

Not applicable.

Data Availability Statement

Due to the nature of this research, participants of this study did not agree for their data to be shared publicly, so supporting data is not available.

Conflicts of Interest

The authors declare no conflict of interest.

Appendix A

Table A1. Analysis of variance of N + P2O5 + K2O in liquid digestate.
Source of VariationSum of SquaresdfFp *
Co-substrate Ratio3.032102.920.010
F/I ratio0.2929.750.093
Total Solids13.222449.640.002
Error0.032--
Note: When p < 0.05, the difference is significant; p < 0.01, the difference is extremely significant. Abbre-viations: df = degrees of freedom; F = F-test value; * = significance level.
Table A2. Range analysis of the nutrient elements N, P, and K in the liquid digestate.
FactorNPK
ABCDABCDABCD
K12547.402779.51798.552852.3533.8249.8768.2453.773293.114427.532536.574086.96
K22815.553088.152631.502848.9596.4046.3531.1790.853907.343967.283874.494112.16
K33079.62574.914012.502741.2555.8389.8386.6441.435088.663894.305878.054089.99
k1849.13926.50599.52950.7811.2716.6222.7517.921097.701475.84845.521362.32
k2938.521029.38877.17949.6532.1315.4510.3930.281302.451322.431291.501370.72
k31026.53858.301337.50913.7518.6129.9428.8813.811696.221298.101959.351363.33
R177.40171.08737.9837.0320.8613.3218.4916.47598.62177.751113.838.40
Influencing OrderC > A > B > DA > C > D > BC > A > B > D
Note: A is the ratio of vinegar grains and cow dung material (based on vs. weight), B is the material sludge ratio (based on vs. weight), C is the solid content rate, and D is the error term. k1, k2, k3 are all average values, and R is extremely poor. K1, K2, and K3 represent the average values of the corresponding factor at levels 1, 2, and 3, respectively.
Table A3. Variance analysis of nutrient elements N, P, and K in liquid digestate.
Source of VariationNPK
Sum of SquaresdfFp *Sum of SquaresdfFp *Sum of SquaresdfFp *
Co-substrate Ratio47,207.07217.740.053671.8521.520.396555,202.9424401.430.000
F/I ratio44,505.732116.720.056388.8620.880.53155,722.132441.740.002
Total Solids833,615.702313.210.003532.1921.210.45318,885,529.54214,947.720.000
Error2661.562--441.062--126.142--
Note: When p < 0.05, the difference is significant; p < 0.01, the difference is extremely significant. Abbre-viations: df = degrees of freedom; F = F-test value; * = significance level.
Table A4. Range analysis of seed germination index (GI).
TreatmentCo-Substrate Ratio (A)F/I Ratio (B)Total Solids (%) (C)Error (D)Seed GI (%)
T13:12:1101166
T23:11:115288
T33:11:2203136
T43:22:1153124
T53:21:1201100
T63:21:2102137
T72:32:1202139
T82:31:1103160
T92:31:2151133
K1390429463399-
K2361348345364-
K3432406375420-
k1130143154133-
k2120116115121-
k3144135125140-
R14273919-
Influencing orderC > B > D > A
Note: k1, k2, k3 are all average values, and R is extremely poor. K1, K2, and K3 represent the average values of the corresponding factor at levels 1, 2, and 3, respectively; k1, k2, and k3 are the mean values; R is the range.
Table A5. Analysis of variance of seed germination index (GI).
Source of VariationSum of SquaresdfFp *
Co-substrate Ratio849.5621.590.386
F/I ratio1161.5622.180.315
Total Solids2507.5624.700.175
Error533.562--
Note: When p < 0.05, the difference is significant; p < 0.01, the difference is extremely significant. Abbre-viations: df = degrees of freedom; F = F-test value; * = significance level.
Table A6. Range analysis of N + P2O5 + K2O content in solid digestate.
TreatmentCo-Substrate Ratio (A)F/I Ratio (B)Total Solids (%) (C)Error (D)N + P2O5 + K2O (g/kg)
T13:12:110122.31
T23:11:115225.00
T33:11:220327.68
T43:22:115325.11
T53:21:120126.36
T63:21:210229.11
T72:32:120232.82
T82:31:110330.94
T92:31:215130.27
K175.0080.2482.3878.93-
K280.6082.3180.3886.96-
K394.0387.0886.8683.73-
k125.0026.7527.4626.331-
k226.8727.4426.7928.99-
k331.3429.0328.9527.91-
R6.342.282.162.68-
Influencing OrderA > D > B > C
Note: k1, k2, k3 are all average values, and R is extremely poor. K1, K2, and K3 represent the average values of the corresponding factor at levels 1, 2, and 3, respectively; k1, k2, and k3 are the mean values; R is the range.
Table A7. Analysis of variance (ANOVA) for N + P2O5 + K2O in solid digestate.
Source of VariationSum of SquaresdfFp *
Co-substrate Ratio63.8525.920.144
F/I ratio8.1620.760.569
Total Solids7.3620.680.595
Error10.782--
Note: When p < 0.05, the difference is significant; p < 0.01, the difference is extremely significant. Abbre-viations: df = degrees of freedom; F = F-test value; * = significance level.
Table A8. Summary of dominant influencing factors for N, P, and K content in solid digestate.
ElementNPK
ABCDABCDABCD
K1836.45839.66861.98833.0111,709.7311,919.0412,762.9612,116.4325,377.7127,776.8927,995.4026,943.66
K2802.74806.81802.80800.7512,224.0412,263.4012,134.8413,328.8127,681.1328,487.9527,660.3929,744.36
K3805.81798.53780.22811.2414,154.9913,906.3213,190.9712,643.5332,446.4329,240.4429,849.4928,817.25
k1278.82279.89287.33277.673903.243973.014254.324038.818459.249258.969331.808981.22
k2267.58268.94267.60266.924074.684087.804044.954442.949227.049495.989220.139914.79
k3268.60266.18260.07270.414718.334635.444396.994214.5110,815.489746.819949.839605.75
R10.2113.7127.2510.758621.57662.43352.05404.122356.24487.85729.70933.57
Influencing OrderC > B > D > AA > B > D > CA > D > C > B
Note: A is the ratio of vinegar grains and cow dung material (based on vs. weight), B is the material sludge ratio (based on vs. weight), C is the solid content rate, and D is the error term. k1, k2, k3 are all average values, and R is extremely poor. K1, K2, and K3 represent the average values of the corresponding factor at levels 1, 2, and 3, respectively; k1, k2, and k3 are the mean values; R is the range.
Table A9. ANOVA of nutrient elements N, P, and K in solid digestate.
Source of VariationNPK
Sum of SquaresdfFp * Sum of SquaresdfFp * Sum of SquaresdfFp *
Co-substrate Ratio231.6221.280.4381,108,032.4024.500.1828,664,509.0026.390.135
F/I ratio315.4821.750.364751,899.8223.050.247357,091.7920.260.792
Total Solids1188.5426.580.132188,129.7320.760.567926,893.3620.680.594
Error180.522--246,363.732--1,357,096.392--
Note: When p < 0.05, the difference is significant; p < 0.01, the difference is extremely significant. Abbre-viations: df = degrees of freedom; F = F-test value; * = significance level.
Table A10. Range analysis of humic acid, fulvic acid, and HA/FA in solid digestate.
FactorHAFAHA/FA
ABCDABCDABCD
K1119.26101.7091.8590.8152.1165.3977.3065.377.264.523.414.07
K2131.25128.71134.25142.5073.2865.2660.9267.335.456.877.297.18
K3111.34131.44135.74128.5477.8972.6365.0770.584.355.676.375.81
k139.7533.9030.6230.2717.3721.8025.7721.792.421.511.141.36
k243.7542.9044.7547.5024.4321.7520.3122.441.822.292.432.39
k337.1143.8145.2542.8525.9624.2121.6923.531.451.892.121.94
R6.649.9114.6312.588.592.455.461.740.970.781.291.04
Influencing OrderC > D > B > AA > C > B > DC > D > B > A
Note: A is the ratio of vinegar grains and cow dung material (based on vs. weight), B is the material sludge ratio (based on vs. weight), C is the solid content rate, and D is the error term. k1, k2, k3 are all average values, and R is extremely poor. K1, K2, and K3 represent the average values of the corresponding factor at levels 1, 2, and 3, respectively; k1, k2, and k3 are the mean values; R is the range.
Table A11. ANOVA of HA/FA in solid digestate at the end of anaerobic digestion.
Source of VariationSum of SquaresdfFp *
Co-substrate Ratio1.4420.890.531
F/I ratio0.9220.570.639
Total Solids2.7621.690.372
Error1.632--
Note: When p < 0.05, the difference is significant; p < 0.01, the difference is extremely significant. Abbre-viations: df = degrees of freedom; F = F-test value; * = significance level.

References

  1. Guan, B.; Zhao, J.; Cai, M.; Lin, H.; Yao, L.; Sun, L. Analysis of volatile organic compounds from chinese vinegar substrate during solid-state fermentation using a colorimetric sensor array. Anal. Methods 2014, 6, 9383–9391. [Google Scholar] [CrossRef]
  2. Tesfaye, W.; Morales, M.L.; García-Parrilla, M.C.; Troncoso, A.M. Wine vinegar: Technology, authenticity and quality evaluation. Trends Food Sci. Technol. 2002, 13, 12–21. [Google Scholar] [CrossRef]
  3. Wang, K.; Yu, Y.; Liu, S.; Zhu, Y.; Liu, P.; Yu, Z.; Wang, Y. A review of the current state and future prospects in resource recovery of chinese cereal vinegar residue. Foods 2022, 11, 3256. [Google Scholar] [CrossRef]
  4. Li, L.; Feng, L.; Zhang, R.; He, Y.; Wang, W.; Chen, C.; Liu, G. anaerobic digestion performance of vinegar residue in continuously stirred tank reactor. Bioresour. Technol. 2015, 186, 338–342. [Google Scholar] [CrossRef]
  5. Chen, L.; Zhou, G.; Zheng, T.; Zhou, Z.; Wu, Q.; Yuan, H. Effect of the organic loading rates increase on process stability and microbial community composition during the anaerobic digestion of fresh vinegar residue. Waste Biomass Valor 2021, 12, 5505–5516. [Google Scholar] [CrossRef]
  6. Labatut, R.A.; Angenent, L.T.; Scott, N.R. Biochemical methane potential and biodegradability of complex organic substrates. Bioresour. Technol. 2011, 102, 2255–2264. [Google Scholar] [CrossRef]
  7. Zhao, S.; Thakur, N.; Salama, E.-S.; Zhang, P.; Zhang, L.; Xing, X.; Yue, J.; Song, Z.; Nan, L.; Yujun, S.; et al. Potential Applications of protein-rich waste: Progress in energy management and material recovery. Resour. Conserv. Recycl. 2022, 182, 106315. [Google Scholar] [CrossRef]
  8. Kumar, A.; Samadder, S.R. Performance evaluation of anaerobic digestion technology for energy recovery from organic fraction of municipal solid waste: A Review. Energy 2020, 197, 117253. [Google Scholar] [CrossRef]
  9. Mohammadianroshanfekr, M.; Pazoki, M.; Pejman, M.B.; Ghasemzadeh, R.; Pazoki, A. kinetic modeling and optimization of biogas production from food waste and cow manure co-digestion. Results Eng. 2024, 24, 103477. [Google Scholar] [CrossRef]
  10. Li, Y.; Zhao, J.; Krooneman, J.; Euverink, G.J.W. Strategies to boost anaerobic digestion performance of cow manure: Laboratory achievements and their full-scale application potential. Sci. Total Environ. 2021, 755, 142940. [Google Scholar] [CrossRef]
  11. Latifi, P.; Karrabi, M.; Danesh, S. Anaerobic co-digestion of poultry slaughterhouse wastes with sewage sludge in batch-mode bioreactors (Effect of inoculum-substrate ratio and total solids). Renew. Sust. Energ. Rev. 2019, 107, 288–296. [Google Scholar] [CrossRef]
  12. Xu, F.; Okopi, S.I.; Jiang, Y.; Chen, Z.; Meng, L.; Li, Y.; Sun, W.; Li, C. Multi-criteria assessment of food waste and waste paper anaerobic co-digestion: Effects of inoculation ratio, total solids content, and feedstock composition. Renew. Energy 2022, 194, 40–50. [Google Scholar] [CrossRef]
  13. Song, Y.; Meng, S.; Chen, G.; Yan, B.; Zhang, Y.; Tao, J.; Li, Y.; Li, J. Co-digestion of garden waste, food waste, and tofu residue: Effects of mixing ratio on methane production and microbial community structure. J. Environ. Chem. Eng. 2021, 9, 105901. [Google Scholar] [CrossRef]
  14. Amon, T.; Amon, B.; Kryvoruchko, V.; Zollitsch, W.; Mayer, K.; Gruber, L. Biogas production from maize and dairy cattle manure—Influence of biomass composition on the methane yield. Agric. Ecosyst. Environ. 2007, 118, 173–182. [Google Scholar] [CrossRef]
  15. Li, Y.; Xu, F.; Li, Y.; Lu, J.; Li, S.; Shah, A.; Zhang, X.; Zhang, H.; Gong, X.; Li, G. Reactor performance and energy analysis of solid state anaerobic co-digestion of dairy manure with corn stover and tomato residues. Waste Manag. 2018, 73, 130–139. [Google Scholar] [CrossRef]
  16. Shahbaz, M.; Ammar, M.; Zou, D.; Korai, R.M.; Li, X. An insight into the anaerobic co-digestion of municipal solid waste and food waste: Influence of co-substrate mixture ratio and substrate to inoculum ratio on biogas production. Appl. Biochem. Biotechnol. 2019, 187, 1356–1370. [Google Scholar] [CrossRef] [PubMed]
  17. Wang, Z.; Xu, F.; Li, Y. Effects of total ammonia nitrogen concentration on solid-state anaerobic digestion of corn stover. Bioresour. Technol. 2013, 144, 281–287. [Google Scholar] [CrossRef]
  18. Shi, J.; Xu, F.; Wang, Z.; Stiverson, J.A.; Yu, Z.; Li, Y. Effects of microbial and non-microbial factors of liquid anaerobic digestion effluent as inoculum on solid-state anaerobic digestion of corn stover. Bioresour. Technol. 2014, 157, 188–196. [Google Scholar] [CrossRef] [PubMed]
  19. Pellera, F.-M.; Gidarakos, E. Effect of substrate to inoculum ratio and inoculum type on the biochemical methane potential of solid agroindustrial waste. J. Environ. Chem. Eng. 2016, 4, 3217–3229. [Google Scholar] [CrossRef]
  20. Demichelis, F.; Tommasi, T.; Deorsola, F.A.; Marchisio, D.; Fino, D. Effect of inoculum origin and substrate-inoculum ratio to enhance the anaerobic digestion of organic fraction municipal solid waste (OFMSW). J. Clean Prod. 2022, 351, 131539. [Google Scholar] [CrossRef]
  21. Luo, C.; Wang, X.; Zhang, G.; Wei, L.; Shi, G.; Zhang, M. Effects of inoculums ratio and urea concentration on biochemical methane of rural domestic waste with anaerobic digestion. J. Agric. Resour. Environ. 2017, 34, 168–174. [Google Scholar]
  22. Ziganshin, A.M.; Liebetrau, J.; Proeter, J.; Kleinsteuber, S. Microbial community structure and dynamics during anaerobic digestion of various agricultural waste materials. Appl. Microbiol. Biotechnol. 2013, 97, 5161–5174. [Google Scholar] [CrossRef]
  23. Aboudi, K.; Alvarez-Gallego, C.J.; Romero-Garcia, L.I. Influence of total solids concentration on the anaerobic co-digestion of sugar beet by-products and livestock manures. Sci. Total Environ. 2017, 586, 438–445. [Google Scholar] [CrossRef]
  24. Feng, L.; Yu, Q.; Zhen, X.F.; Dong, H.Y.; Zheng, J.; Wang, Y. Comparison of methanogenesis between sunflower and corn stalks mixed with pig manure at different temperatures. Appl. Ecol. Environ. Res. 2020, 18, 747–756. [Google Scholar] [CrossRef]
  25. Azkarahman, A.R.; Cysneiros, D.; Chatzifragkou, A.; Karatzas, K.-A.G. Anaerobic digestion of whey permeate: Impact of feedstock ratio and organic loading rate in batch and semi-continuous systems. Heliyon 2025, 11, e42395. [Google Scholar] [CrossRef]
  26. Angelidaki, I.; Alves, M.; Bolzonella, D.; Borzacconi, L.; Campos, J.L.; Guwy, A.J.; Kalyuzhnyi, S.; Jenicek, P.; van Lier, J.B. Defining the biomethane potential (BMP) of solid organic wastes and energy crops: A proposed protocol for batch assays. Water Sci. Technol. 2009, 59, 927–934. [Google Scholar] [CrossRef] [PubMed]
  27. Wang, X.; Zhang, L.; Xi, B.; Sun, W.; Xia, X.; Zhu, C.; He, X.; Li, M.; Yang, T.; Wang, P.; et al. Biogas production improvement and C/N control by natural clinoptilolite addition into anaerobic co-digestion of Phragmites australis, feces and kitchen waste. Bioresour. Technol. 2015, 180, 192–199. [Google Scholar] [CrossRef]
  28. Li, C.; Li, J.; Pan, L.; Zhu, X.; Xie, S.; Yu, G.; Wang, Y.; Pan, X.; Zhu, G.; Angelidaki, I. Treatment of digestate residues for energy recovery and biochar production: From lab to pilot-scale verification. J. Clean Prod. 2020, 265, 121852. [Google Scholar] [CrossRef]
  29. Motte, J.C.; Escudié, R.; Bernet, N.; Delgenes, J.P.; Steyer, J.P.; Dumas, C. Dynamic effect of total solid content, low substrate/inoculum ratio and particle size on solid-state anaerobic digestion. Bioresour. Technol. 2013, 144, 141–148. [Google Scholar] [CrossRef] [PubMed]
  30. Rusín, J.; Kašáková, K.; Chamrádová, K.; Staněk, B.; Obroučka, K. High-and low-solids anaerobic digestion in laboratory model fermenter made from silage bags. Pol. J. Chem. Technol. 2013, 15, 23–28. [Google Scholar] [CrossRef]
  31. Yin, F.; Li, Z.; Hou, S.; Feng, R.; Zhou, W.; Wang, X.; Guo, H. The influence of total solid and inoculum ratio on Thermophilic anaerobic digestion of waste activated sludge. Adv. Mater. Res. 2014, 878, 670–678. [Google Scholar] [CrossRef]
  32. Li, Y.; Chen, Z.; Peng, Y.; Huang, W.; Liu, J.; Mironov, V.; Zhang, S. Deeper insights into the effects of substrate to inoculum ratio selection on the relationship of kinetic parameters, microbial communities, and key metabolic pathways during the anaerobic digestion of food waste. Water Res. 2022, 217, 118440. [Google Scholar] [CrossRef]
  33. Karki, R.; Chuenchart, W.; Surendra, K.C.; Sung, S.; Raskin, L.; Khanal, S.K. Anaerobic co-digestion of various organic wastes: Kinetic modeling and synergistic impact evaluation. Bioresour. Technol. 2022, 343, 126063. [Google Scholar] [CrossRef] [PubMed]
  34. Brown, D.; Li, Y. Solid state anaerobic co-digestion of yard waste and food waste for biogas production. Bioresour. Technol. 2013, 127, 275–280. [Google Scholar] [CrossRef] [PubMed]
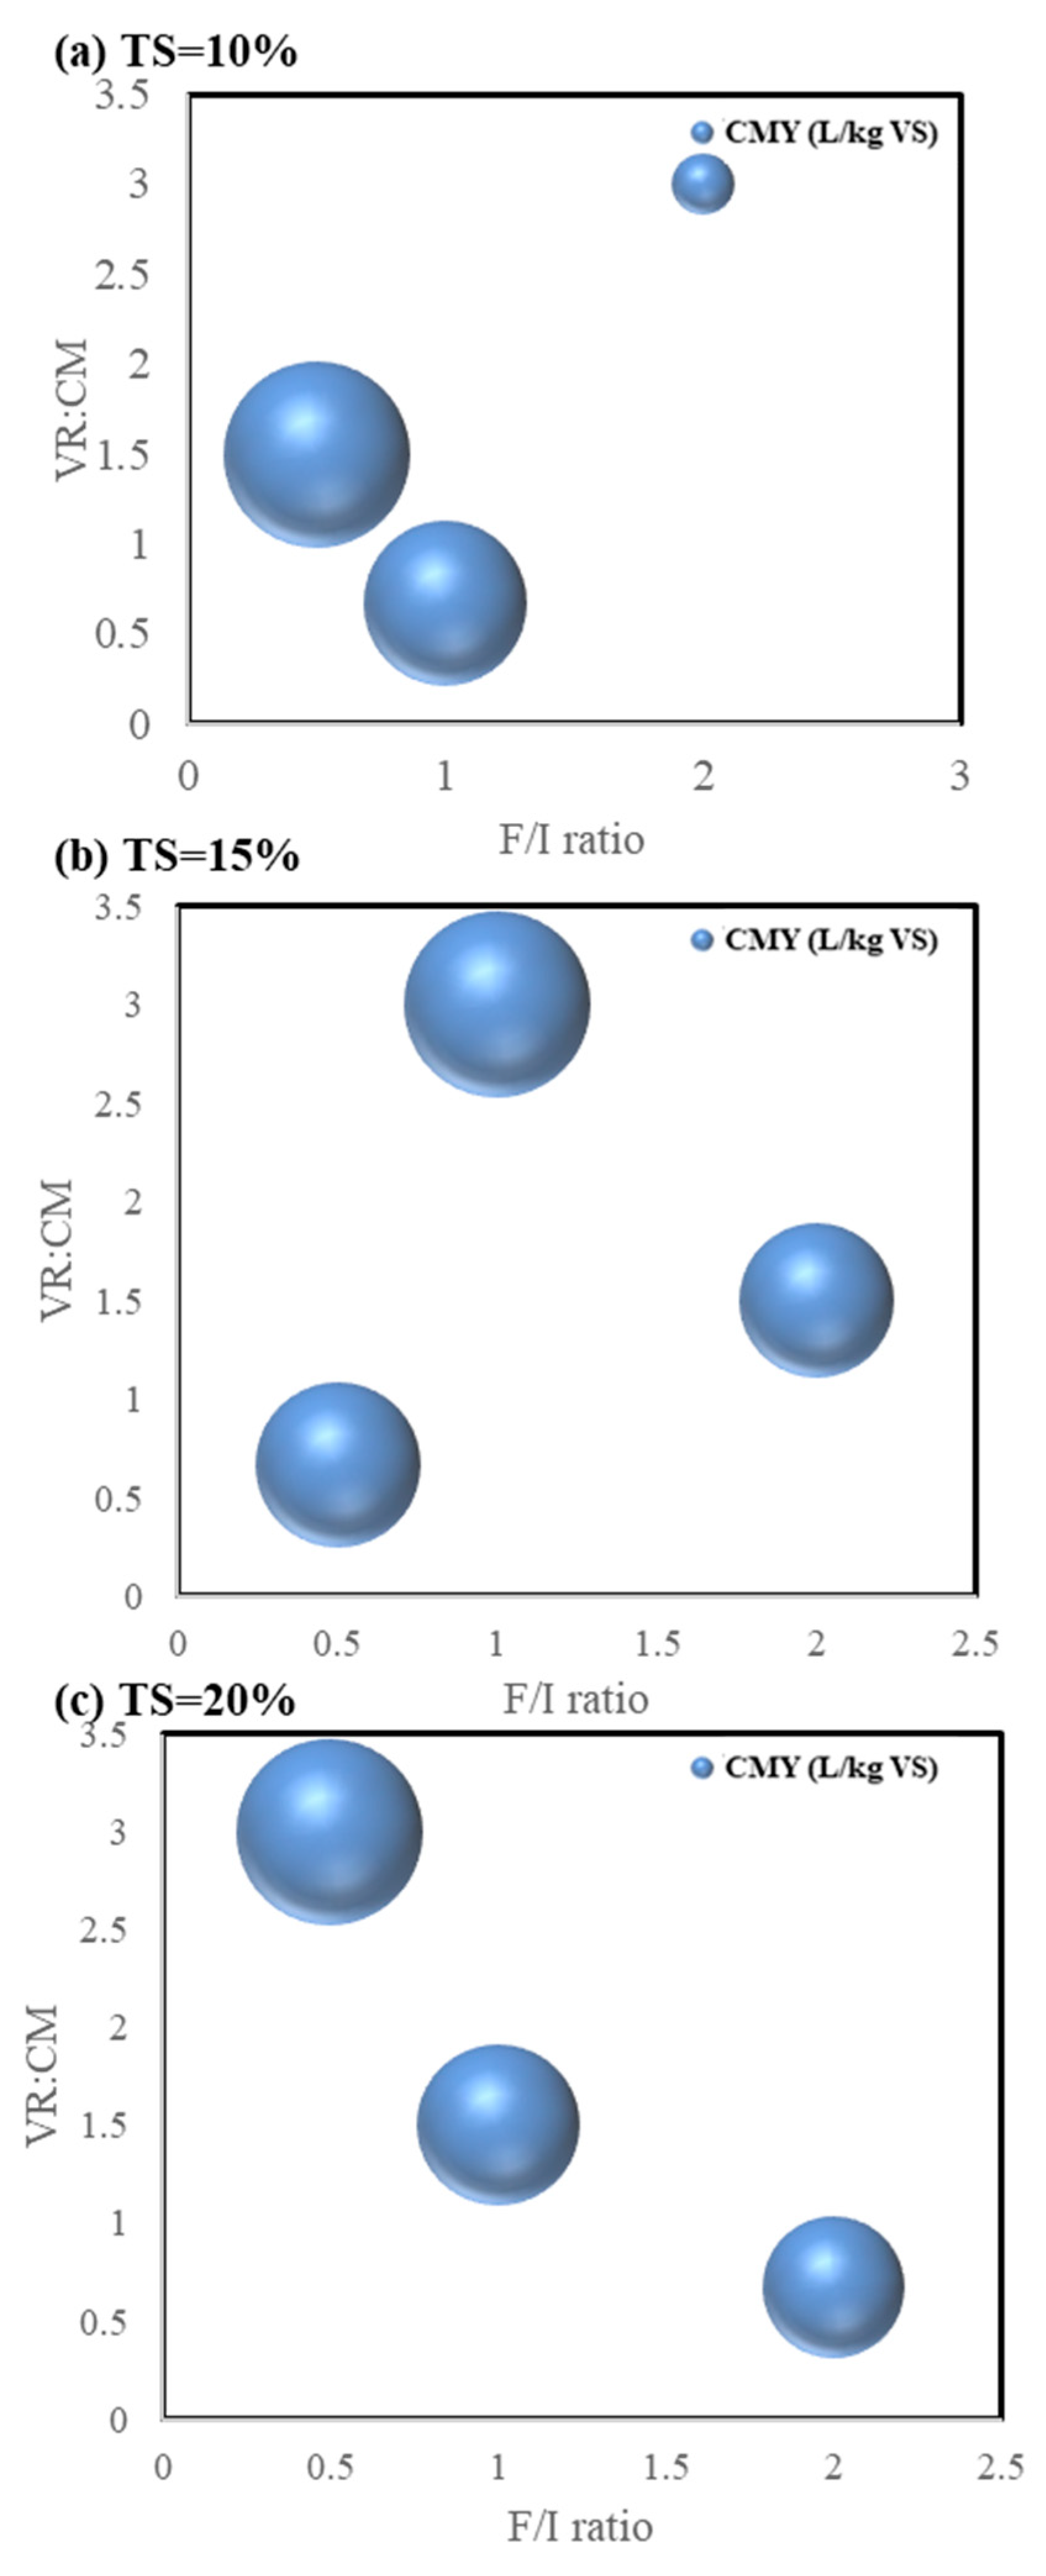
Figure 1. Bubble plots illustrating the effects of the F/I ratio and co-substrate ratio on CMY under three TS conditions: (a) TS = 10%, (b) TS = 15%, and (c) TS = 20%. The size of each bubble corresponds to the CMY value (L/kg VS).
Fermentation 11 00493 g001
Figure 2. Daily methane yield curves under different total solids (TS) levels: (a) TS = 10%; (b) TS = 15%; (c) TS = 20%.
Fermentation 11 00493 g002
Figure 3. Methane concentration curves under different total solids (TS) levels: (a) TS = 10%; (b) TS = 15%; (c) TS = 20%.
Fermentation 11 00493 g003
Figure 4. Cumulative methane yield under different total solids (TS) levels: (a) TS = 10%; (b) TS = 15%; (c) TS = 20%.
Fermentation 11 00493 g004
Figure 5. Changes in pH and VFAs under different TS levels: (a,d) TS = 10%; (b,e) TS = 15%; (c,f) TS = 20%.
Fermentation 11 00493 g005
Figure 6. Changes in alkalinity and ammonium nitrogen under different TS levels: (a,d) TS = 10%; (b,e) TS = 15%; (c,f) TS = 20%.
Fermentation 11 00493 g006
Figure 7. TS and vs. degradation rates under different TS conditions: (a) TS = 10%; (b) TS = 15%; (c) TS = 20%.
Fermentation 11 00493 g007
Figure 8. Three-dimensional fluorescence spectra of anaerobic digestion process with different initial and end treatments: (a) TS = 10%; (b) TS = 15%; (c) TS = 20%.
Fermentation 11 00493 g008aFermentation 11 00493 g008b
Figure 9. Anaerobic digestion process different treatment initial and final fluorescence area relative concentration diagram: (a) TS = 10%; (b) TS = 15%; (c) TS = 20%.
Fermentation 11 00493 g009
Figure 10. Pearson correlation heat map among key operational and output parameters in anaerobic co-digestion of vinegar residue and cattle manure.
Fermentation 11 00493 g010
Table 1. Physical and chemical properties of materials and inoculum.
ParameterVinegar ResidueCattle ManureInoculum
pH3.91 ± 0.048.42 ± 0.099.01 ± 0.06
Volatile fatty acids (g/L) a0.22 ± 0.010.41 ± 0.030.02 ± 0.00
Alkalinity (g CaCO3/L) aND c7.72 ± 0.325.34 ± 0.04
Ammonium nitrogen (g/L) a0.40 ± 0.012.62 ± 0.032.31 ± 0.09
Sodium ions (g/L) a0.30 ± 0.020.45 ± 0.030.30 ± 0.04
Total solids (TS, %) a27.81 ± 0.0322.11 ± 0.0218.01 ± 0.03
Volatile solids (VS) (%) a24.51 ± 0.1917.32 ± 0.0512.62 ± 0.02
VS/TS (%) a88.81 ± 0.1878.43 ± 0.1370.22 ± 0.23
Total carbon (%) b45.01 ± 0.2033.61 ± 0.1137.31 ± 0.23
Total nitrogen (%) b1.91 ± 0.071.61 ± 0.121.41 ± 0.18
C/N ratio24.33 ± 0.0920.83 ± 0.0527.42 ± 0.07
Cellulose (%) b28.42 ± 0.0835.61 ± 0.0532.22 ± 0.02
Hemicellulose (%) b12.22 ± 0.0213.51 ± 0.0411.03 ± 0.05
Lignin (%) b18.32 ± 0.149.41 ± 0.0221.74 ± 0.07
Note: a Based on wet weight; b Based on dry weight; c Not detected.
Table 2. Experimental conditions for the anaerobic co-digestion trials based on the L9(34) orthogonal design, showing the co-substrate ratio of vinegar residue (VR) to cattle manure (CM), the feedstock-to-inoculum (F/I) ratio (based on VS), and the total solids (TS) content (%).
TreatmentCo-Substrate Ratio (A)F/I Ratio (B)TS (%) (C)Error (D)
T13:12:1101
T21:1152
T31:2203
T43:22:1153
T51:1201
T61:2102
T72:32:1202
T81:1103
T91:2151
Note: Based on vs. weight. Co-substrate ratio is based on vs. weight. F/I ratio = feedstock-to-inoculum ratio (based on VS). TS = total solids content (%).
Table 3. Design and results of the orthogonal experiment.
TreatmentCo-Substrate Ratio (A)F/I Ratio (B)Total Solids (%) (C)Error (D)Cumulative Methane Yield (L/kg VS)
T13:12:110117.55
T23:11:1152238.73
T33:11:2203235.62
T43:22:1153165.30
T53:21:1201175.62
T63:21:2102168.44
T72:32:1202135.08
T82:31:1103130.49
T92:31:2151185.51
K1491.90317.93316.48378.68-
K2509.36544.84589.54542.25-
K3451.08589.57546.32531.41-
k1163.97105.98105.49126.23-
k2169.79181.61196.51180.75-
k3150.36196.52182.11177.14-
R58.28271.64273.06163.57-
Influencing OrderC > B > D > A
Note: K1, K2, and K3 represent the cumulative methane yield at each level of the respective factor; k1, k2, and k3 are their means; R denotes the range.
Table 4. ANOVA of orthogonal experiment results.
Source of VariationSum of SquaresdfFp *
Co-substrate Ratio596.4120.110.903
F/I Ratio14,141.9122.540.283
Total Solids14,361.7922.580.280
Error5577.682--
Note: When p < 0.05, the difference is significant; p < 0.01, the difference is extremely significant. Abbreviations: df = degrees of freedom; F = F-test value; * = significance level.
Table 5. Range analysis of N + P2O5 + K2O in liquid digestate.
TreatmentCo-Substrate Ratio (A)F/I Ratio (B)Total Solids (%) (C)Error (D)N + P2O5 + K2O (g/L)
T13:12:11011.96
T23:11:11522.90
T33:11:22034.40
T43:22:11533.56
T53:21:12015.17
T63:21:21022.13
T72:32:12026.38
T82:31:11033.03
T92:31:21514.07
K19.2011.737.0111.13-
K210.8211.1210.4411.25-
K313.3710.5415.9111.00-
k13.073.912.343.71-
k23.613.713.483.75-
k34.463.515.313.67-
R1.390.402.970.08-
Influencing OrderC > A > B > D
Note: k1, k2, k3 are all average values, and R is extremely poor. K1, K2, and K3 represent the average values of the corresponding factor at levels 1, 2, and 3, respectively.
Disclaimer/Publisher’s Note: The statements, opinions and data contained in all publications are solely those of the individual author(s) and contributor(s) and not of MDPI and/or the editor(s). MDPI and/or the editor(s) disclaim responsibility for any injury to people or property resulting from any ideas, methods, instructions or products referred to in the content.