3.1. Impact of UV on Algal Cell Destruction
The impact of UV irradiation on LMCMA cell wall disruption was investigated across various exposure durations (5, 15, 20, and 30 min). The physicochemical properties of LMCMA following UV pretreatment and the subsequent fermentation process are summarized in
Table 1.
The concentrations of total carbon (TC), total organic carbon (TOC), total nitrogen (TN), and inorganic carbon (IC) (ppm) in the supernatants following UV pretreatment—as well as the elemental composition (C, N, H in wt%) of the dry microalgal biomass—demonstrate the substantial impact of pretreatment conditions on the disintegration of LMCMA cells. The release of intracellular components (sugar, protein, and carbohydrates) into the solution enhances the availability of fermentable substrates, thereby improving the efficiency of S. cerevisiae fermentation. This increased availability is expected to positively influence biofuel production.
The UV exposure facilitated the solubilization of both organic and inorganic carbon, as evident from the measurements after the UV reaction. The highest TOC observed after UV treatment alone was 16.6 ± 2.1 ppm at 30 min of irradiation, followed by 11.7 ± 1.5 ppm at 15 min, clearly demonstrating the time-dependent nature of carbon release. When the UV irradiation time was extended to 45 min, the TOC concentration decreased by approximately 7%. This reduction may be attributed to the further mineralization of the released organic matter under prolonged UV irradiation, leading to its conversion into smaller, non-fermentable compounds such as CO2.
The total carbon (TC) and inorganic carbon (IC) fractions indicate the speciation of released carbon. For instance, at 20 min, the IC was highest (20.1 ± 2.5 ppm), whereas at 15 min, the IC was much lower (10.9 ± 1.4 ppm), suggesting that UV intensity and duration modulate both the quantity and type of carbon released. These carbon species serve as precursors for fermentation in the subsequent step. The release of total nitrogen (TN) also followed a variable pattern, peaking at 33.34 ± 0.850 ppm at 20 min and 26.6 ± 0.720 ppm at 30 min, confirming that UV effectively disintegrated nitrogen-containing cellular components, such as proteins and amino acids, into soluble forms. This bioavailable nitrogen is critical for yeast growth but must be carefully balanced to optimize alcohol profiles during fermentation. The observed trend suggests that UV treatment should be stopped after 30 min. Extending the irradiation beyond this point not only results in excessive mineralization of the solution but also increases the pretreatment cost and potentially reduces the expected biofuel productivity, due to the reduction in the availability of fermentable material. Limited UV oxidation (e.g., 5–15 min) results in the release of only a small fraction of cellular contents, thus leading to low fermentation yields. On the other hand, controlled UV exposure promotes the disintegration of complex biomolecules such as polysaccharides and proteins into simpler, more bioavailable substrates, enhancing their fermentability. Therefore, it is essential to terminate UV treatment at the optimal point—around 30 min—where simple sugars, proteins, and carbohydrates are most available for microbial conversion to biofuel.
Following UV treatment, the released substrates were fermented for either 24 or 48 h. The values reflect how much of the TOC and TC was retained or transformed. Notably, the highest TOC after fermentation (0.32 ± 0.025 ppm) was observed at 24 h fermentation with 5 min UV, suggesting minimal carbon consumption, likely due to the low carbon release during UV treatment (TOC = 7.2 ± 0.9 ppm in that condition). In contrast, at 48 h/15 min, although the TOC after fermentation was lower (0.24 ± 0.025 ppm), the initial TOC from the UV pretreatment was high (11.7 ± 1.5 ppm), indicating substantial microbial conversion during fermentation.
This trend reflects the fermentability of UV-released substrates and their potential to produce alcohols. Lower post-fermentation TOC values in samples with high pre-fermentation TOC (e.g., 24 h/30 min, 48 h/15 min, and 48 h/30 min) imply effective substrate utilization by
S. cerevisiae [
23]. Appropriate nitrogen availability drastically enhances
Saccharomyces cerevisiae activity, leading to increased ethanol production. Conversely, nitrogen limitation shifts microbial metabolism through the Ehrlich pathway, promoting the synthesis of higher (fusel) alcohols as byproducts. Thus, it illustrates the effectiveness of the released nitrogen in the supernatants after microalgae disintegration. Hence, higher alcohols are synthesized as byproducts under nitrogen limitation due to the shift in microbial pathways via the Ehrlich pathway, resulting in the formation of fusel alcohol. In this study, the maximum TOC yield was obtained after 30 min, followed by 15, 20, and 5 min of UV duration. Nonetheless, the recorded results of the soluble TOC indicate that extending the UV time will significantly increase the TOC, thereby affecting ethanol production.
Elemental analysis of the dry biomass following UV pretreatment further supports carbon and nitrogen mobilization. Compared to the control biomass (C% = 44.3 ± 4.5%, N% = 7.57 ± 0.57%), treated samples showed significant decreases in C% (as low as 37.9 ± 3.8%) and N% (down to 6.48 ± 0.48%), indicating intracellular material loss due to UV-induced disintegration. The hydrogen content (H%) increased in several cases after treatment, particularly at 48 h/20 min (8.19 ± 0.78%) and 48 h/30 min (8.14 ± 0.72%), which may signal the accumulation of hydrogen-rich compounds or residual lipids, and which aligns with conditions favoring higher alcohol synthesis.
The carbon-to-nitrogen (C/N) ratio plays a critical role in guiding yeast metabolism during fermentation. A higher C/N ratio promotes ethanol production by favoring fermentative over anabolic pathways, whereas low or unbalanced ratios may reduce the ethanol yield or lead to fusel alcohol formation. In this study, the optimal C/N ratio of 1.62 was achieved under 30 min of UV pretreatment followed by 24 h of fermentation, with TOC and TN values of 16.64 ppm and 10.26 ppm, respectively. This condition provided sufficient carbon while limiting nitrogen, supporting efficient ethanol biosynthesis. In contrast, lower C/N ratios were observed under other conditions: 0.53 at 48 h/15 min (TOC = 11.7 ± 1.5 ppm, TN = 22.87 ± 0.66 ppm), 0.51 at 24 h/15 min (TOC = 10.2 ± 1.3 ppm, TN = 19.25 ± 0.417 ppm), and the lowest ratio of 0.42 at 24 h/20 min (TOC = 8.9 ± 1.1 ppm, TN = 21.41 ± 0.217 ppm). These lower ratios reflect nitrogen-rich environments, which may favor yeast growth over ethanol production. The findings highlight that a balanced yet carbon-lean nutrient profile—achieved through optimized UV treatment—enhances the utilization of microalgal substrates for bioethanol yield.
The structural and biochemical impact of UV pretreatment on LMCMA was comprehensively assessed through SEM and TEM imaging (
Figure 1 and
Figure 2) and elemental and biochemical data (
Table 1). Together, these results highlight the role of UV exposure in disrupting cellular integrity, enhancing the release of fermentable compounds, and influencing fermentation efficiency.
Figure 1a represents the untreated microalgal biomass, characterized by well-defined, intact cell structures and smooth surfaces, indicating solid cell walls. As UV exposure was applied, progressive morphological deformation was observed in the LMCMA cells across
Figure 1b–e, corresponding to increasing UV durations of 5, 15, 20, and 30 min, respectively. After 5 min of UV irradiation (
Figure 1b), the cell wall damage was minimal, and some species remained morphologically intact, consistent with a relatively low TOC release of 7.2 ± 0.9 (
Table 1). The corresponding dry biomass showed moderate carbon content (C% = 38.3 ± 3.9) and nitrogen content (N% = 6.51 ± 0.48%), indicating limited intracellular leakage. As the UV pretreatment proceeded between 15 and 20 min (
Figure 1c,d), the deformation became more pronounced, with increased agglomeration and disrupted surface morphology. This aligns with higher TOC values of 10.2 ± 1.3 ppm and 8.9 ± 1.1 ppm, and TN values of 19.25 ± 0.417 and 21.41 ± 0.217 ppm, respectively, suggesting enhanced release of soluble organics from broken cell walls. At 30 min (
Figure 1e), extensive rupture and aggregation were evident, particularly in the surface layers and intracellular contents. This condition corresponds to the highest TOC release (16.6 ± 2.1 ppm) and a significant decrease in TN to 10.26 ± 0.22 ppm, reflecting strong solubilization of cellular contents, most notably carbohydrates and proteins. The obtained results confirmed that UV exposure for 30 min caused the most effective physical disruption, which directly correlates with maximized biochemical release. Liza et al. [
24] showed that ozone pretreatment enhanced biohydrogen production from microalgae biomass. It was highlighted that ozone improves cell wall disruption, increases the release of intracellular organics, and optimizes the hydrogen yield.
The TEM images in
Figure 2 confirm the internal structural degradation of the LMCMA. Untreated LMCMA samples (
Figure 2a) show intact cell membranes and dense internal structures, indicating no disruption. UV-treated cells (
Figure 2b–e) reveal progressive membrane thinning, cytoplasmic leakage, and overall collapse of the cellular architecture, with the severity increasing with the exposure duration.
Figure 2e (30 min UV) shows fragmented structures and loss of intracellular compartmentalization. Such microstructural damage aligns with the observations of Miao and Tao [
25], who documented similar membrane degradation and DOC release after ozonation—a parallel oxidative pretreatment approach. This correlates with the substantial elemental depletion in biomass observed in
Table 1: the carbon content dropped from 44.624% (control) to 38.803%, and the nitrogen content declined from 7.569% to 6.516%, reflecting the exodus of organics into the surrounding medium. The morphological degradation observed in
Figure 1 and
Figure 2 supports the biochemical trends shown in
Table 1. The optimal UV exposure (especially 30 min) not only improved the TOC release but also optimized the C/N ratio (1.62 at 24 h/30 min) and enhanced the fermentable substrate availability, particularly carbohydrates and proteins—critical factors for efficient fermentation processes.
3.2. Effects of UV Photolysis Time
Figure 3 illustrates the impacts of UV irradiation time (5, 15, 20, and 30 min) on both the quantity of carbohydrate released from LMCMA and the corresponding release efficiency (%). After 5 min of UV irradiation, the released carbohydrate was approximately 0.014 ± 0.005 g
carb/g
DCW, with a release efficiency of 25%. Increasing the UV exposure to 15 min significantly enhanced the carbohydrate release to 0.018 ± 0.003 g
carb/g
DCW and an efficiency of 32.1%, indicating more effective cell wall disruption and solubilization of polysaccharides. The maximum values were achieved at 20 min, where the released carbohydrate peaked at 0.025 ± 0.004 g
carb/g
DCW and the efficiency reached 44.65%. However, extending the UV treatment to 30 min resulted in a slight reduction, with a carbohydrate release of 0.024 ± 0.003 g
carb/g
DCW and an efficiency of 42.96%. This decline suggests that excessive UV exposure may lead to the degradation of released sugars into non-fermentable compounds or the formation of inhibitory byproducts such as reactive oxygen species or oxidized intermediates. The error bars confirm the reliability of the data, although the variability slightly increases at longer durations. Collectively, the trend highlights that 20 min of UV pretreatment provides the optimal balance between efficient carbohydrate release and minimal degradation, making it the most effective duration for maximizing substrate availability for downstream biofuel fermentation.
The progressive increase in carbohydrate yield from 5 to 20 min reflects enhanced cell wall disruption due to prolonged UV exposure. At shorter UV irradiation periods (5 and 15 min), the liberation of carbohydrates was low, suggesting insufficient energy input to significantly compromise the structural integrity of the cell walls, thereby limiting the release of intracellular polysaccharides. These observations are consistent with the SEM and TEM observations (
Figure 1 and
Figure 2), where minimal deformation was seen at 5 min and more extensive membrane damage occurred at higher UV irradiation times. However, a slight decline in carbohydrate yield was observed at 30 min compared to 20 min, despite greater morphological damage. This may be attributed to overexposure to UV radiation, which can lead to the degradation or oxidation of released sugars, as well as the possible formation of recalcitrant compounds that increase COD levels while reducing fermentable sugar concentrations. This trend aligns with the observations of Bhushan et al. [
26], who reported that extended UV-C exposure can compromise carbohydrate recovery by over-fragmenting cellular contents or initiating photodegradation pathways. It was shown that UV-induced membrane instability is a key factor in this process. As the UV duration increases, membrane permeability improves, facilitating the release of intracellular carbohydrates. However, beyond an optimal time (e.g., 30 min in this study), further exposure may result in structural collapse or oxidative degradation, diminishing the net recoverable sugar yield. The study of Bhushan et al. [
26] showed that the maximum sugar content released was 73.61 mg/L after 10 h of exposure. Thoroughly, the cell rupture led to a gradual decrease in sugar liberation and chlorophyll content, as well as weakness in cell stability. Moreover, the study concluded that long-term UV-C exposure results in cell weakness, wherein the cellular contents, including sugars, are discharged into the surrounding liquid, negatively impacting their potential for biofuel production [
26]. On the other hand, limited research and a lack of studies describe the effectiveness of the UV-C pretreatment method for microalgae disruption, which provided new insight into biofuel production.
UV radiation is usually combined with other methods, such as H
2O
2, ozone, microwave, and Fenton reaction methods, to enhance hydroxyl radical formation [
27]. The results concluded that further combined pretreatment is necessary to improve the cell wall rupture and enhance intracellular liberation, increasing the fermentation process’s efficacy. Liza et al. [
24] investigated a combined chemical and UV pretreatment strategy to modify lignin chromophores in wood residues. The chemical pretreatment involved sodium hydroxide (NaOH) and hydrogen peroxide (H
2O
2), followed by UV irradiation for durations ranging from 30 to 120 min. NaOH was used to facilitate the disintegration of the lignin structure, while H
2O
2 generated hydroxyl radicals that contributed to oxidative degradation. This combination resulted in a slight reduction in lignin concentration. Subsequently, the pretreated wood residues underwent mechanical disruption through ball milling and ultrasonic treatment. Additionally, UV radiation was found to further enhance hydroxyl radical formation, intensifying the modification of lignin chromophores and improving the overall efficiency of the pretreatment process [
24]. Wen et al. [
28] demonstrated an effective combined pretreatment approach to enhance the production of cellulose nanofibers by integrating UV radiation and ozone exposure. In this process, UV irradiation facilitated the decomposition of ozone, leading to the formation of hydrogen peroxide (H
2O
2) as an intermediate, which further decomposed into additional hydroxyl radicals. These radicals played a crucial role in promoting cellulose oxidation and the degradation of polysaccharides. The study specifically found that applying UV radiation for 30 min in the presence of 12 mmol H
2O
2/g fiber significantly enhanced ozone-induced oxidation by increasing hydroxyl radical production. As a result, the structural integrity of the biomass was compromised, leading to improved cellulose accessibility. The authors concluded that UV pretreatment at 20–30 min effectively ruptures cell walls, increases membrane permeability, and enhances the release of intracellular carbohydrates—findings that align closely with the carbohydrate liberation patterns observed in microalgae under similar UV exposure conditions. Overall, these results confirm that UV pretreatment is effective in enhancing carbohydrate release, with 20 min identified as the optimal duration for maximizing the fermentable sugar yield without incurring significant degradation losses. These findings support the integration of UV exposure as a controllable parameter in pretreatment strategies for biofuel feedstock processing [
28].
Further investigation is required to study the effects of viscosity on mixed culture cells, their effectiveness in enabling UV light radiation to penetrate microalgae cell walls, and their potential impact on cell disruption by releasing fermentable carbohydrates. In addition, the viscosity of microalgae fluctuates considerably depending on the microalgae species and their composition [
22]. Dense microalgae accumulation will increase the microalgae concentration, diminishing the UV light’s ability to penetrate cell walls, and negatively impacting cell disruption.
3.3. Effects of Fermentation Time
Figure 4 presents the effects of fermentation time (24 and 48 h) on carbohydrate consumption following UV pretreatment at various durations (5, 15, 20, and 30 min), using
Saccharomyces cerevisiae under optimal fermentation conditions (pH 5.5). The results reveal a progressive decrease in carbohydrate concentration with extended fermentation time, indicating effective microbial utilization of the released proteins and sugars for biofuel production. As fermentation progresses from 24 to 48 h, the carbohydrate content in the fermentation broth declines accordingly. LMCMA treated with UV for 15 min released 0.018 ± 0.003 g
carb/g
DCW. After fermentation, the carbohydrate concentration decreased to 0.010 g
carb/g
DCW at 24 h and further dropped to 0.005 g
carb/g
DCW at 48 h, reflecting carbohydrate consumption of 50.8% and 75.4%, respectively. Similarly, the carbohydrate concentration for LMCMA treated with UV for 5 min declined to 0.009 g/g
DCW at 24 h and to 0.003 g
carb/g
DCW at 48 h, showing 57.0% and 85.1% consumption, respectively. The most pronounced carbohydrate consumption was observed at 20 min of UV pretreatment, where the carbohydrate concentration decreased to 0.0156 g
carb/g
DCW and to 0.0033 g
carb/g
DCW, representing a 25.9% reduction after 24 h of fermentation and a maximum 80% consumption after 48 h. This condition suggests optimal UV-mediated solubilization of fermentable carbohydrates and their efficient microbial uptake.
These results indicate that even low UV durations can partially facilitate cell contents’ release, albeit with less efficiency than longer exposures. Interestingly, at 30 min of UV pretreatment, the carbohydrate concentration after 24 h remained relatively higher, at 0.018 gcarb/gDCW, but decreased to 0.006 gcarb/gDCW after 48 h, still marking 70% of the total initial carbohydrate concentration. This confirmed the previous observation that prolonged UV exposure may lead to partial degradation or oxidation of cell contents, thereby reducing their availability for fermentation over time.
The observed trends highlight a balance between UV-induced sugar release and microbial consumption. While UV enhances cell disruption and carbohydrate release, excessive exposure may degrade fermentable sugars or generate inhibitory byproducts, potentially reducing the fermentation efficiency, as seen at 30 min compared to 20 min.
These findings emphasize that while UV pretreatment is effective in enhancing fermentable sugar release, the combination of moderate UV exposure (e.g., 20 min) and sufficient fermentation duration (48 h) offers the best performance, resulting in up to 80.2% carbohydrate conversion. Further improvements in pretreatment strategies, such as combining UV with enzymatic or mild chemical treatments, may help enhance cell wall disintegration and improve the liberation and preservation of fermentable sugars.
Apollo et al. [
29] suggested a combined pretreatment of UV-C and photocatalysis at 60 min of UV duration time for improving the anaerobic digestion biodegradation of methylene blue dye, thereby facilitating methane production [
29]. The anaerobic digestion pretreatment, which utilizes a 15 min UV duration, enhances the lipid accumulation in microalgae by up to 48.18% [
30]. However, microalgae can be resistant to UV radiation via various mechanisms. The integrated pretreatment with UV effectively reduces the cost of the operation by decreasing the UV duration time [
30].
Jeon et al. [
31] highlighted the effectiveness of ultrasonic pretreatment of the
Scenedesmus obliquus YSW15 microalgae strain, facilitating biomass destruction and changing the surface morphology at different sonication duration times, varying from 0 to 60 min, and sonication temperatures of 45 and 65 °C, resulting in releasing 0.12 g/g of carbohydrate at the optimal sonication time of 15 min, which effectively enhanced ethanol and hydrogen generation through fermentation over 23 days. At fermentation temperatures of 35 and 55 °C, the reduction in carbohydrates in the sonicated samples after 23 days of fermentation reduced from 0.37 to 0.08 g
carb/g
biomass; hence, 89% of the total carbohydrates was diminished by 16 days, followed by a gradual decline in the remaining carbohydrates until the end of the fermentation [
31].
3.4. Effects of UV Pretreatment on Biofuel Production
Figure 5 presents the biofuel production from microalgae following UV pretreatment and fermentation with
Saccharomyces cerevisiae at 30 °C for 24 and 48 h. Five biofuels were quantified: ethanol, methanol, 1-propanol, 1-butanol, and 1-pentanol. Overall, the UV pretreatment facilitated carbohydrate release and subsequent microbial conversion into bioalcohols, with clear differences in product yields depending on the UV duration and fermentation time. The carbohydrate is consumed during fermentation and potentially converted into biofuel with extended fermentation time. The recorded results are described in terms of biofuel produced (g) per gram of carbohydrates for experiments performed at pH 5.5 after 24 and 48 h of fermentation.
Ethanol was the dominant fermentation product (
Figure 5a), with the production yield (Y
prod) increasing significantly from 24 to 48 h. The maximum ethanol Y
prod of 0.3668 g
ethanol/g
carb) was recorded at 30 min UV pretreatment and 48 h fermentation. The ethanol Y
prod reached 0.0218 g
ethanol/g
carb at 15 min of UV duration and 24 h of fermentation, increasing to 0.0792 g
ethanol/g
carb after 48 h. A noticeable decrease in ethanol Y
prod to 0.01643 g
ethanol/g
carb was observed for the LMCMA pretreated with UV for only 5 min and fermented for 24 h; increasing the fermentation time to 48 h increased the ethanol Y
prod to 0.15 g
ethanol/g
carb. The observed tend indicates the presence of long-chain carbohydrates in the LMCMA pretreated with UV for only 5 min, which required a long fermentation time to achieve a reasonable ethanol Y
prod. Moreover, a notable decrease in ethanol Y
prod (0.00157 g
ethanol/g
carb) was observed for LMCMA pretreated with UV for 20 min after 24 h of fermentation. Notably, the ethanol Y
prod slightly increased to 0.0325 g
ethanol/g
carb after 48 h of fermentation. An increase in the ethanol Y
prod was observed at 30 min of UV duration, reaching 0.01537 g
ethanol/g
carb after 24 h, and yielding the maximum ethanol yield of 0.3668 g
ethanol/g
carb after 48 h. The ethanol yields were higher than those obtained at 35 and 37 °C. Notably, the 15 min UV pretreatment also resulted in a substantial ethanol Y
prod (0.0792 g/g at 48 h). At 20 min, although UV caused significant sugar solubilization, the ethanol Y
prod was relatively low at 24 h (0.00157 g/g) and improved to 0.0325 g/g at 48 h, possibly due to the initial degradation of fermentable sugars or delayed microbial adaptation. This trend supports previous findings by Jeon et al. [
31], where physical pretreatment (ultrasound) increased ethanol yields by improving substrate accessibility. Additionally, longer fermentation times allow yeast metabolism to fully convert available carbohydrates, consistent with the ~84% carbohydrate reduction at 20 min UV duration. It can be inferred that ethanol generation leads to a decrease in hydrogen production due to the shifting in the microbial metabolism pathways of butyrate to ethanol during fermentation. It was observed that ethanol is the main microbial product from the fermentation process, whereas the bacteria degrade the monosaccharides under the anaerobic process [
31].
The methanol production yields (
Figure 5b) peaked at 5 min UV (0.0564 g/g at 48 h), followed by a slight decline at higher UV durations. The maximum methanol Y
prod of 0.0134 g
methanol/g
carb was recorded at 5 min after 24 h and increased to 0.0564 g
methanol/g
carb after 48 h. Yields of 0.0131 and 0.0203 g
methanol/g
carb were detected at 15 min after 24 and 48 h, respectively. A decline in the methanol Y
prod was observed with increased UV radiation times of 20 and 30 min, yielding 0.0072 and 0.0033 g
methanol/g
carb after 24 h, respectively, which reached slightly similar yields of 0.033 and 0.032 g
methanol/g
carb after 48 h, respectively. This suggests that short-term UV exposure sufficiently disrupted the cell walls to release methanol precursors without extensive sugar degradation. Similarly, the 1-propanol production yield (
Figure 5c) peaked at 30 min UV (0.0512 g/g at 48 h), indicating that more intense pretreatment was necessary to release its precursor molecules. However, the lower yields at 15 and 20 min highlight a non-linear relationship, likely due to intermediate compound volatility or microbial pathway competition. Kushwaha et al. [
32] produced 8.873 g/L of butanol by applying acidic hydrolysis as a pretreatment of
Lyngbya limnetica cyanobacteria using 1.63 M H
2SO
4 at 100 °C for 60 min, mixed with
Clostridium beijerinckii ATCC and adding 10 g/L of glucose to the fermentation medium. Another study by Liu et al. [
33] produced 62% isobutanol from
Microchloropsis salina biomass treated with diluted sulfuric acid using an
E. coli consortium. However, it was concluded that the investigated butanol yields were lower than those measured in the literature.
For 1-butanol (
Figure 5d), the highest Y
prod (0.0225 g
1-butanol/g
carb) occurred at 15 min UV after 48 h, followed closely by 5 and 20 min. Prolonged UV exposure (30 min) led to a drastic reduction in methanol Y
prod (0.0032 g/g), suggesting possible inhibitory effects of UV byproducts on butanol-producing enzymes, as described by Kushwaha et al. [
32] and Liu et al. [
33]. 1-Pentanol exhibited a unique pattern: the highest yield occurred at 20 min UV after 24 h (0.0219 g/g), yet this significantly decreased to 0.0016 g/g at 48 h, indicating rapid metabolism or instability over time. The pentanol pathway, linked to the Ehrlich pathway via leucine catabolism [
34], may have peaked early and declined due to the depletion of precursor amino acids or the redirection of microbial metabolism toward ethanol. These results affirm that UV pretreatment is effective for enhancing biofuel yields, with each bioalcohol responding differently to the UV duration and fermentation time. Ethanol benefits from prolonged UV and fermentation, while other alcohols, such as methanol and pentanol, show optimal production at moderate durations. However, UV overexposure may generate inhibitory compounds (e.g., HMF, furfural, acetic acid), as noted by Gao et al. [
34], affecting
S. cerevisiae’s performance. Song et al. [
35] also demonstrated UV-induced microbial stress due to hydroxyl radicals, which may explain the declining yields at 30 min UV for butanol and pentanol.
Figure 5e shows that the maximum Y
prod of 1-pentanol was achieved at 30 °C after 24 h of fermentation and 20 min of UV irradiation pretreatment, reaching up to 0.0219 g
1-pentanol/g
carb. A reduction in the 1-pentanol Y
prod was observed with increased fermentation time, resulting in 0.0016 g
1-pentanol/g
carb after 48 h. At 15 min of UV irradiation pretreatment, a decline was recorded, yielding 0.0207 g
1-pentanol/g
carb after 24 h; however, with an increase in fermentation time, the measured yield after 48 h decreased to 0.0016 g
1-pentanol/g
carb. Additionally, the yields decreased with extended UV time, as illustrated at 30 min, which produced 0.0045 and 0.0002 g
1-pentanol/g
carb after 24 and 48 h, respectively.
The effect of the fermentation temperature was also investigated.
Table 2 summarizes the production of different biofuels at 30, 35, and 37 °C. The maximum ethanol Y
prod was at 35 °C, at 5 min, producing 0.02 g
ethanol/g
carb after 24 h, and increasing to 0.085 g
ethanol/g
carb after 48 h. A decline in ethanol Y
prod of 0.017 g
ethanol/g at 15 min was found after 24 h, which reached up to 0.056 g
ethanol/g
carb after 48 h. There was a reduction in yields at 20 min, recording 0.012 and 0.017 g ethanol/g after 24 and 48 h, respectively, along with a slight decline of 0.010 g
ethanol/g
carb after 24 h, and yielding 0.035 g
ethanol/g
carb after 48 h, with the extended UV duration. Compared to the results obtained at 37 °C, as shown in
Table 2, the subsequent reduction in the produced yields was investigated, concluding that the yield is potentially affected by the increase in the fermentation temperature. A decline in ethanol yields was recorded.
The maximum produced ethanol was recorded at 5 min—with 0.0130 g
ethanol/g
carb after 24 h, and increasing to 0.05 g
ethanol/g
carb after 48 h—followed by 0.013, 0.012, and 0.01 g
ethanol/g
carb at 15, 20, and 30 min, respectively, after 24 h, which reached up to 0.04, 0.015, and 0.028 g
ethanol/g
carb after 48 h, respectively. Jeon et al. [
31] employed ultrasonic pretreatment of the
Scenedesmus obliquus YSW15 microalgae strain for 15 min, which effectively destroyed the microalgae biomass and altered its surface morphology. Ethanol and hydrogen were produced through fermentation over 23 days at different temperatures, achieving an 89% reduction in carbohydrates and producing 5.6 g/L ethanol and 2.5 mL/L hydrogen; the microbial fermentation enhanced the organic carbon content, which requires further economic assessment in the utilization of renewable carbon sources to generate biofuel.
It can be inferred that ethanol generation leads to a decrease in hydrogen production due to the shift in the microbial metabolism pathways of butyrate to ethanol during fermentation. It can be observed that ethanol is the main microbial product from the fermentation process, whereas the bacteria degrade the monosaccharides under the anaerobic process [
31].
The maximum methanol Yprod at 35 °C (0.0134 gmethanol/g) was recorded at 5 min after 24 h, and this increased to 0.0564 gmethanol/gcarb after 48 h. Yields of 0.0131 and 0.0203 gmethanol/gcarb were detected at 15 min after 24 and 48 h, respectively. A decline in methanol Yprod was observed with increased UV radiation times of 20 and 30 min, yielding 0.0072 and 0.0033 gmethanol/gcarb after 24 h, which reached slightly similar yields of 0.033 and 0.032 g methanol/g after 48 h, respectively. A decline in methanol Yprod was observed by increasing the fermentation temperature from 35 to 37 °C. LMCMA pretreated with UV irradiation for 20 min and fermented at 35 °C showed methanol Yprod 0.012 gmethanol/gcarb after 24 h and 0.0.017 gmethanol/gcarb after 48 h. At 37 °C, substantial decreases in the yields were measured with increased fermentation temperature.
Similar methanol production yields were recorded at 5 and 15 min, achieving 0.0088 gmethanol/g after 24 h and increasing to 0.0094 and 0.012 gmethanol/gcarb at 5 and 15 min, respectively. A reduction in methanol Yprod was recorded at 20 min, producing 0.0056 and 0.007 gmethanol/gcarb after 24 and 48 h, respectively. The lowest methanol production yields were at 30 min, with 0.0045 and 0.07 gmethanol/gcarb after 24 and 48 h, respectively. The findings recorded the maximum methanol production yields at a fermentation temperature of 30 °C after 48 h. Nevertheless, few studies have highlighted methanol generation from treated microalgae biomass after fermentation following UV pretreatment using Saccharomyces cerevisiae. The 1-propanol production yields were demonstrated at 30 °C. The obtained production yields decreased with UV durations of 5, 15, 20, and 30 min, achieving values of 0.0023, 0.0031, 0.0002, and 0.0022 g1-propanol/gcarb after 24 h, respectively. The recorded production yields after 48 h increased to 0.0210, 0.0111, 0.0052, and 0.0512 g1-propanol/gcarb, respectively. However, there was a decrease in the yields at 35 °C. The maximum yield at 35 °C was obtained at 15 min—reaching 0.002 g1-propanol/g after 24 h, which subsequently increased to 0.0086 g1-propanol/gcarb after 48 h—followed by 5 min, resulting in 0.0018 and 0.0067 g1-propanol/gcarb after 24 and 48 h, respectively.
A reduction in the 1-propanol Yprod was seen with extended duration time, at 20 and 30 min, achieving similar production yields of 0.0011 and 0.0011 g1-propanol/gcarb after 24 h, respectively, and attaining 0.005 and 0.0045 g1-propanol/gcarb after 48 h, respectively. Likewise, similar production yields of 1-propanol were recorded at 37 °C after 24 h, with a decrease in production yields after 48 h. The produced yields of 1-butanol at 30 °C reached a maximum of 0.0158 g1-propanol/g after 24 h, significantly increasing to 0.02 g1-propanol/gcarb after 48 h, at 5 min. The next-highest production yield was at 15 min, which achieved 0.0073 g1-propanol/gcarb after 24 h and increased to 0.0225 g1-butanol/gcarb after 48 h. Moreover, a reduction in the production yield was found at 20 min after 24 h of fermentation, resulting in 0.0024 g1-butanol/gcarb, and reaching up to 0.0167 g1-propanol/gcarb. Notably, an increase in the yield was observed after 30 min, where a 0.0032 g1-propanol/gcarb yield was obtained.
Low butanol concentrations may impede and inhibit the enzymatic activity associated with butanol synthesis, particularly during anaerobic fermentation [
36]. One of the studies generated a new enzyme, EB4.F, by combining a modified
E. coli (EB4.0) integrated with the formate dehydrogenase (fdh1) gene from
Saccharomyces cerevisiae to enhance the oxidation of formate to CO
2 to produce NADH, which can subsequently be utilized to produce butanol synthesis [
37]. The synthesis of butanol depends on the biomass type utilized; for instance, a study employed a batch reactor with
Clostridium beijerinckii BA101, achieving a fermentation duration time of 110 h and yielding 18.9 g/L of butanol from an initial starch concentration of 80 g/L of starch derived from peanuts, producing butanol [
38], which indicates the impact of prolonged duration on alcoholic fermentation. Compared with the yields shown in
Table 2 at 35 °C, a decrease in yields was recorded at 5 and 15 min, with similar 1-butanol yields of 0.0088 and 0.012 g
1-butanol/g
carb after 24 and 48 h, respectively. There was a decline in the yields at 20 min; the obtained yields were 0.0056 and 0.009 g
1-butanol/g
carb after 24 and 48 h, respectively, and yielded a low concentration of 0.0019 and increased to 0.0071 g
1-butanol/g
carb after 24 and 48 h, respectively. However, the yields decreased at 37 °C, as depicted in
Table 2 and the highest butanol yields were found at 15 min, yielding 0.0047 and 0.006 g
1-butanol/g
carb after 24 and 48 h, respectively.
As illustrated by Kushwaha et al., 8.873 g/l of butanol was produced by applying acidic hydrolysis as a pretreatment of
Lyngbya limnetica cyanobacteria using 1.63 M H
2SO
4 at 100 °C for 60 min, mixed with
Clostridium beijerinckii ATCC and adding 10 g/L of glucose to the fermentation medium [
32]. Another study by Liu et al. produced 62% isobutanol from
Microchloropsis salina biomass treated with diluted sulfuric acid using an
E. coli consortium [
33]. However, it was concluded that the investigated butanol yields were lower than those measured in the literature.
The maximum production yield of 1-pentanol was achieved at 30 °C after 24 h at 20 min, reaching up to 0.0219 g1-pentanol/g. A reduction in the production yield was observed with increased fermentation time, resulting in 0.0016 g1-pentanol/gcarb after 48 h. At 15 min, a decline was recorded, yielding 0.0207 g of g1-pentanol/g after 24 h; however, with an increase in fermentation time, the measured production yield after 48 h decreased to 0.0016 g1-pentanol/gcarb. Additionally, the production yields decreased with extended UV time, as illustrated at 30 min, which produced 0.0045 and 0.0002 g1-pentanol/gcarb after 24 and 48 h, respectively. Following a decrease in production yields at 35 °C, the highest 1-pentanol yield was recorded at 15 min, reaching up to 0.016 g1-pentanol/g after 24 h, which then decreased to 0.0003 g1-pentanol/gcarb after 48 h. The production yields gradually reduced with the increased UV radiation time. The low yield of pentanol declined over time, with a further reduction in pentanol yields after 48 hr, ultimately approaching zero at 20 and 30 min. Compared to the results obtained at 37 °C, a reduction in the production yield was observed with the increase in fermentation temperature, highlighting the effect of temperature on microbial metabolic activity to enhance biofuel synthesis. However, the recorded production yield of pentanol after 24 h was higher than the production yields obtained from butanol and propanol, indicating that the enzymatic pathway for pentanol synthesis might dominate during fermentation. The Ehrlich pathway describes the conversion of the amino acid leucine to α-ketoisocaproate, which is then decarboxylated by the enzyme THI3 to form isoamyl aldehyde, which is subsequently reduced to isoamyl alcohol (pentanol).
It was observed that after 48 h at 35 and 37 °C, the recorded results diminished to zero. This observation suggests either a reduction in the α-amino acids isoleucine and leucine during fermentation—where these α-amino acids were dominant in the microbial pathway, leading to increased pentanol yields compared to those found from 1-butanol and 1-propanol—or a shift in microbial activity after 24 h that produced another higher alcohol. UV pretreatment represents a promising process in biofuel production from microalgae. However, UV pretreatment may generate inhibitors that hinder
Saccharomyces cerevisiae fermentation. Gao L. et al. emphasized that the formation of inhibitors as byproducts following the pretreatment impacts carbohydrate recovery [
34].
Furthermore, the formation of hydroxymethylfurfural, furfural, and acetic acid from glucose hinders the metabolism of bacteria [
34]. As a result, it diminishes the
Saccharomyces cerevisiae growth activity, decreasing biofuel production. Song, K., M. Mohseni, and F. Taghipour examined the impact of UVA radiation in the generation of hydroxyl radicals, which directly degraded the
E. coli cell walls during pretreatment and subsequently influenced the metabolic activity [
35].
3.7. Elemental Composition
Table 3 shows the concentrations of TC, TOC, TN, and IC (ppm) from the supernatants obtained following UV/H
2O
2 pretreatment and subsequent fermentation. Additionally, the elemental composition (C, N, H in wt%) of dry microalgal biomass before and after pretreatment is shown, revealing the extent of cellular disruption and internal content release caused by this oxidative strategy.
The application of UV/H2O2 significantly enhanced the solubilization of cellular carbon and nitrogen, as reflected by the increased TOC and TN values in the supernatant compared to the untreated control.
For instance, at a concentration of 0.88 mM H2O2, the TOC and TC values reached 21.43 ± 0.79 and ppm, with negligible IC (0.0076 ppm) and a relatively high TN of 17.311 ± 0.639 ppm. The dry biomass still retained 39.344 ± 0.832% carbon, 6.192 ± 0.229% nitrogen, and 6.570 ± 0.250% hydrogen, indicating moderate cell rupture and content release. When the same H2O2 dose was applied under different conditions (presumably longer exposure or different UV intensity), TOC and TC increased significantly to 39.59 ± 1.46 ppm and 39.89 ± 1.47 ppm, respectively, while TN rose slightly to 17.431 ± 0.644 ppm. However, the carbon content in the biomass dropped to 35.908 ± 0.759%, confirming more efficient content leaching. At 1.76 mM H2O2, an optimal release of organic contents was observed under one condition, with TOC and TC peaking at 31.97 ± 1.18 ppm and 32.29 ± 1.19 ppm, respectively, while IC rose to 0.32301 ± 0.00683 ppm, and TN decreased sharply to 4.300 ± 0.159 ppm. This indicates effective oxidation and solubilization of carbon-rich compounds, with lower nitrogen retention in the medium. The biomass carbon content also dropped to 35.204 ± 0.745%, with nitrogen at 6.016 ± 0.222%, suggesting substantial cell disruption. Interestingly, under another condition at the same concentration, the TOC and TC values were considerably lower (17.82 ± 0.66 ppm and 17.83 ± 0.66 ppm, respectively), although biomass carbon (36.246 ± 0.767%) and nitrogen (6.131 ± 0.226%) remained similar—possibly due to experimental variation or oxidative degradation of organics. For 2.65 mM H2O2, the TOC and TC levels were 27.13 ± 1.00 ppm and 27.23 ± 1.01 ppm in one trial, respectively, with the biomass carbon content increasing to 40.817 ± 0.863%, which may indicate less extensive biomass oxidation despite effective cell rupture. In a separate condition, TC rose to 33.82 ± 1.25 ppm, accompanied by a significant increase in IC (2.30274 ± 0.04870 ppm) and a moderate TN of 13.397 ± 0.495 ppm, pointing to enhanced oxidation of organics into inorganic forms. The biomass retained 39.866 ± 0.843% carbon and 6.737 ± 0.249% nitrogen, suggesting partial but effective treatment. At the highest concentration, 3.53 mM H2O2, TOC and TC reached 28.60 ± 1.06 ppm, with zero IC, and TN was 12.515 ± 0.462 ppm in one case, while another condition showed reduced TC (24.37 ± 0.90 ppm) but a substantial IC of 9.09141 ± 0.19229 ppm and TN of 16.751 ± 0.619 ppm. These results imply that at high oxidant concentrations, further oxidation may lead to increased formation of inorganic byproducts (e.g., CO2), diminishing the availability of fermentable organics. Interestingly, despite higher carbon release, the residual carbon in the biomass remained high (up to 42.488 ± 0.899%), showing that complete breakdown was not achieved. Compared to the untreated control biomass (C = 45.829 ± 0.969%, N = 7.831 ± 0.289%, H = 8.450 ± 0.388%), all pretreated samples showed a decrease in carbon and nitrogen contents, validating the effectiveness of UV/H2O2 in rupturing cells and leaching intracellular materials. Overall, moderate H2O2 concentrations (1.76–2.65 mM) were the most effective for maximizing organics’ release into the supernatant while minimizing excessive oxidation into non-fermentable forms. This balance is crucial for optimizing substrate availability in the subsequent fermentation stage.
The supernatants obtained from UV/H2O2-pretreated LMCMA were subjected to fermentation using Saccharomyces cerevisiae (S. cerevisiae), with the objective of utilizing the released organic carbon for biofuel production. The efficiency of fermentation was assessed by measuring the remaining total carbon (TC), inorganic carbon (IC), and total nitrogen (TN) in the medium after 24 and 48 h of microbial activity. The data clearly demonstrate that S. cerevisiae effectively consumes the available carbon sources released during pretreatment. After 24 h of fermentation, the TC levels decreased dramatically across all conditions: From an initial TC of 21.4–32.25 ppm (as seen in Stage 1), the post-fermentation TC values dropped from 21.43 ± 0.79 to 0.5704 ± 0.0217 ppm for tests carried out with 0.88 mM H2O2. Increasing the concentration of H2O2 exhibited lower TC values after fermentation. The TC values dropped from 32.29 ± 1.19 to 0.2093 ± 0.0086 ppm, from 27.23 ± 1.01 ppm to 0.5023 ± 0.0207 ppm, and from 28.60 ± 1.06 ppm to 0.0677 ± 0.0028 ppm for H2O2 concentrations of 1.76 mM, 2.65 mM, and 3.53 mM, respectively. These reductions correspond to carbon removal efficiencies exceeding 98%, indicating a high degree of substrate uptake and metabolic activity. The IC levels remained low (ranging from 0.0126 ± 0.0003 to 0.0775 ± 0.0016 ppm), suggesting minimal conversion of organics to inorganic carbon or CO2 within the liquid phase. Importantly, TN dropped to 0 ppm in all conditions, implying complete nitrogen assimilation by the yeast or conversion into undetectable forms. Extending the fermentation to 48 h improved the uptake of TC, and lower concentrations were reported at all initial concentrations of H2O2: from 39.89 ± 1.47 to 0.1164 ± 0.0048 ppm at 0.88 mM, from 17.83 ± 0.66 ppm to 0.4032 ± 0.0166 ppm at 1.76 mM, from 33.82 ± 1.25 to 0.5862 ± 0.0241 ppm at 2.65 mM, and from 24.37 ± 0.90 ppm to 1.3251 ± 0.0546 ppm at 3.53 mM. These values still represent a >95–99% reduction in TC, with the lowest carbon residue observed for the 0.88 mM pretreatment, suggesting that this condition supports the most complete fermentation after 48 h. The IC values remained low (between 0 and 0.0775 ± 0.0016 ppm), reinforcing that only a small fraction of carbon ends up in inorganic form. TN remained consistently at 0 ppm in all conditions, confirming that nitrogen compounds released during pretreatment were fully utilized by the microbial cells.
The variation in total nitrogen (TN) across the two stages—UV/H2O2 pretreatment (Stage 1) and fermentation using Saccharomyces cerevisiae (Stage 2)—provides important insights into the efficiency of nutrient release and utilization, both of which are directly linked to biofuel production outcomes.
In Stage 1, the UV/H2O2 pretreatment is designed to rupture microalgae cells and release their intracellular components into the surrounding medium. The TN concentrations in the supernatant following this treatment varied widely depending on the H2O2 concentration and processing conditions. For example, at 0.88 mM H2O2, the TN values were relatively high, reaching 17.311 ± 0.639 ppm and 17.431 ± 0.644 ppm, indicating that milder oxidative conditions are effective at releasing nitrogenous compounds like amino acids and peptides without degrading them. In contrast, at 1.76 mM H2O2, TN decreased sharply to 4.300 ± 0.159 ppm, suggesting that more aggressive oxidative conditions may either degrade nitrogen-containing compounds into undetectable forms or volatilize them. Intermediate values were observed at 2.65 mM (e.g., 13.38–14.3 ppm) and at 3.53 mM (e.g., 12.5–16.73 ppm), indicating a balance between release and oxidative degradation. These variations highlight that TN release does not increase linearly with H2O2 concentration, and that excessive oxidant levels may compromise the bioavailability of nitrogen for microbial processes.
In Stage 2, after inoculating the pretreated supernatants with S. cerevisiae, the TN levels dropped to 0 ppm across all treatments and fermentation durations (both 24 and 48 h). This complete nitrogen depletion indicates that the nitrogen released during Stage 1 was readily bioavailable and fully assimilated by the yeast. Nitrogen is essential for microbial growth, particularly for protein synthesis, enzyme activity, and biomass formation. The ability of S. cerevisiae to consume all available TN confirms active metabolic processes and robust cell proliferation—both prerequisites for efficient fermentation and bioethanol production.
The observed TN dynamics have important implications for biofuel generation. In fermentation systems, the carbon-to-nitrogen (C/N) ratio plays a critical role in determining the balance between microbial growth and biofuel synthesis. Excess nitrogen can shift metabolism toward biomass accumulation at the expense of ethanol production, while insufficient nitrogen can hinder microbial activity altogether. The data suggest that the TN levels released during pretreatment were within a favorable range, supporting both microbial activity and carbon utilization. The complete TN removal, coupled with a >95–99% reduction in total carbon (TC), indicates that the system achieved an optimal nutrient balance that facilitated the efficient conversion of microalgal biomass into biofuel precursors [
40].
3.10. Effects of Fermentation Time on Carbohydrate Yield
Figure 7 illustrates the effects of fermentation time (24 and 48 h) on the carbohydrate release (gcarb/g
DCW) following UV/H
2O
2 pretreatment of microalgal biomass at various H
2O
2 concentrations (0.88, 1.76, 2.65, and 3.53 mM). The figure provides a comparative assessment of how effectively fermentable carbohydrates released during pretreatment were consumed over time by
Saccharomyces cerevisiae, highlighting the interplay between oxidant concentration and fermentation duration.
At 24 h of fermentation, the carbohydrate concentration dropped drastically, especially at higher H
2O
2 concentrations. The most notable reductions were observed at 2.65 mM and 3.53 mM, where the carbohydrate concentrations decreased to approximately 0.0023 ± 0.0003 g
carb/g
DCW and 0.0018 ± 0.0002 g
carb/g
DCW, respectively. These values reflect a 93.6% and 93.1% reduction, respectively, relative to the released carbohydrate, indicating rapid and efficient microbial utilization of sugars. This performance even exceeded the 91.6% glucose conversion reported by Yang et al. [
16], who utilized UV/H
2O
2 treatment on sisal waste with 6 h of exposure.
In contrast, at lower H2O2 concentrations (0.88 and 1.76 mM), the carbohydrate reduction was less pronounced at 24 h, reaching 57.2% and 63%, respectively. However, after extending the fermentation to 48 h, the yields at these lower concentrations further declined—indicating continued microbial activity—with final reductions of 63.5% (0.88 mM) and 71% (1.76 mM). Interestingly, while the yield at 2.65 mM slightly increased to a final reduction of 72.8%, the yield at 3.53 mM continued to drop to 0.0006 gcarb/gDCW, reflecting a 98.4% total reduction—the highest observed across all conditions. This suggests that while higher H2O2 concentrations may initially generate inhibitory compounds that slow microbial metabolism, prolonged fermentation enables S. cerevisiae to adapt and further metabolize the available sugars.
These trends demonstrate the dual influence of oxidative pretreatment and fermentation time. At moderate oxidant levels (e.g., 1.76 mM), UV/H2O2 pretreatment effectively ruptures the cell wall and enhances sugar availability without severely degrading carbohydrates, facilitating sustained fermentation. However, at higher oxidant concentrations (≥2.65 mM), over-oxidation may initially impair fermentability but does not entirely prevent microbial utilization over extended periods.
Several studies support these findings. For example,
Scenedesmus obliquus, after sonication and 16 days of fermentation, achieved an 89% reduction in carbohydrates [
31]. In another study, UV/H
2O
2 pretreatment followed by ZSM-5-catalyzed pyrolysis yielded 6.4% sugar after 2 h of UV radiation using 4 mL/g H
2O
2 [
42]. Similarly, a UV–alkaline H
2O
2 pretreatment followed by enzymatic hydrolysis of corn stover led to 90.2% lignin removal, with enhanced hemicellulose recovery (+48.9%) [
43]. These examples reaffirm that H
2O
2 concentration, treatment time, and posttreatment processes significantly affect saccharification efficiency.
The current study reveals that excessive H
2O
2 concentration can suppress carbohydrate release and subsequent fermentation due to potential sugar degradation and the formation of inhibitory byproducts such as furfural, hydroxymethylfurfural (HMF), and phenolic compounds. These inhibitors are known to hinder microbial growth and ethanol yield [
44]. Additionally, the observed trends emphasize that microalgae species, pretreatment conditions, and microbial strains all contribute to sugar yield variability.
3.11. Effects of UV/H2O2 Pretreatment on Biofuel Production
Figure 8 presents the yields of various biofuels—ethanol, methanol, 1-propanol, 1-butanol, and 1-pentanol—produced through fermentation of UV/H
2O
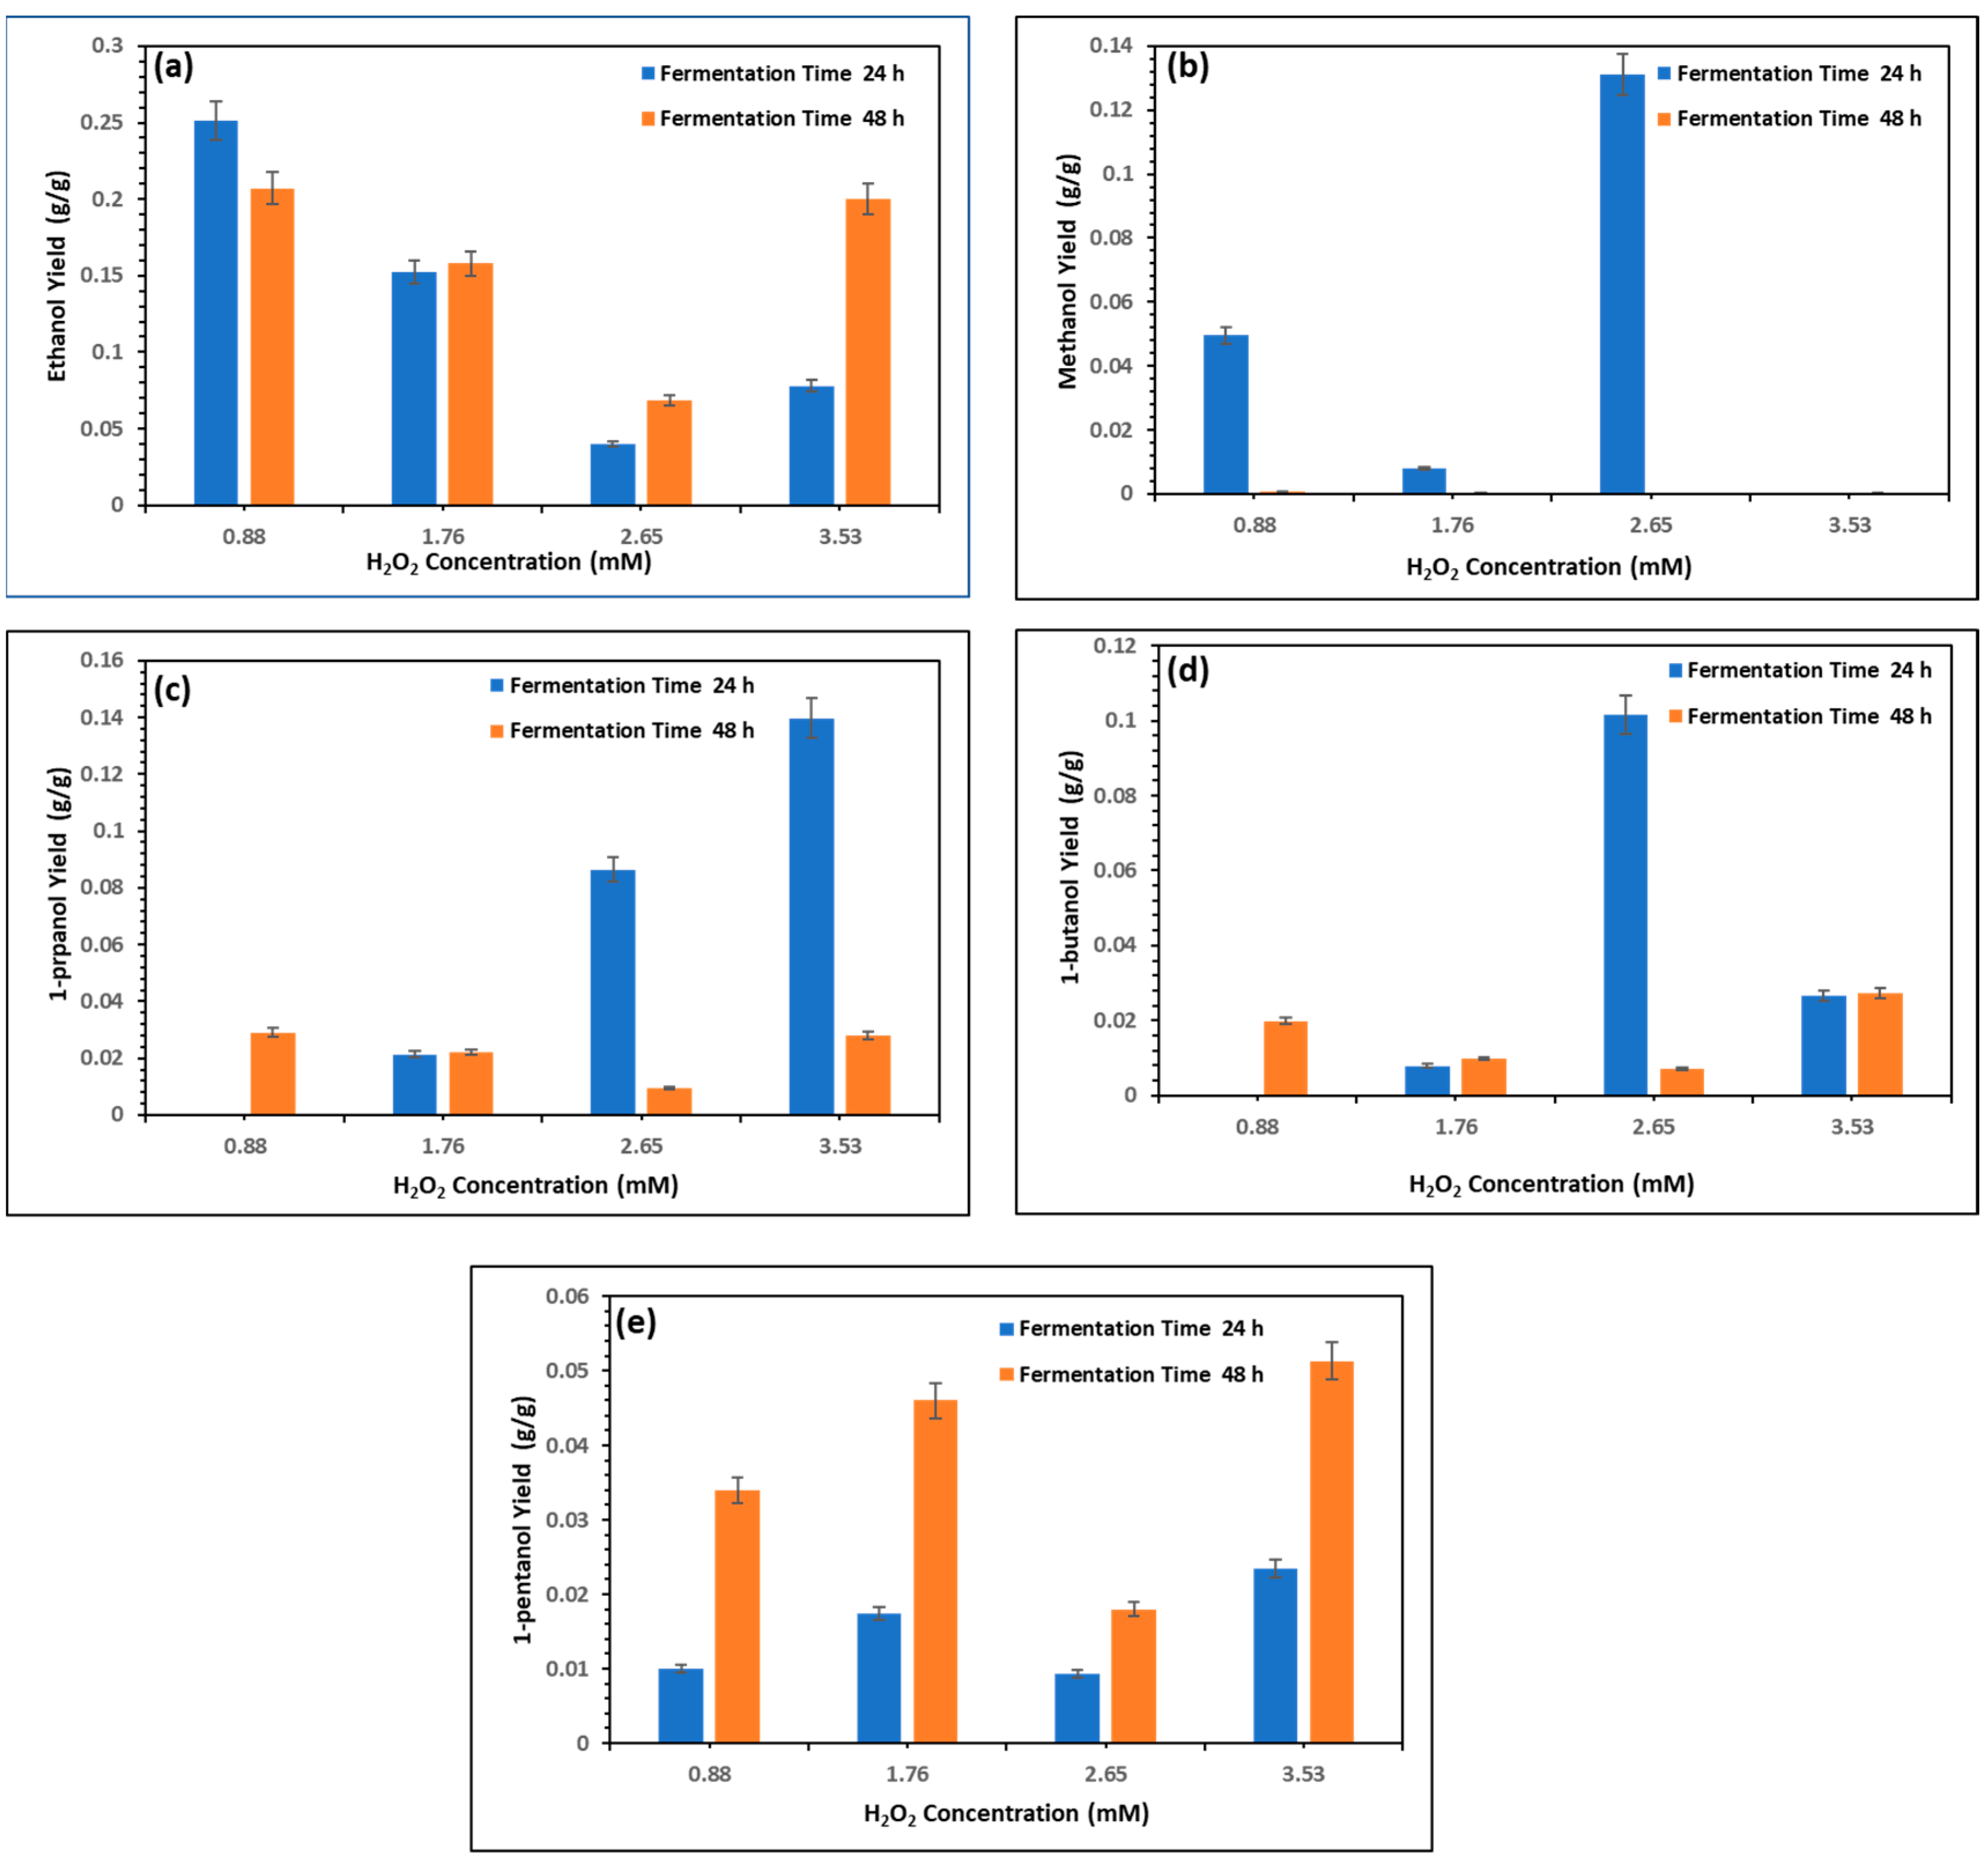
2-pretreated microalgae biomass. The treatments involved four concentrations of hydrogen peroxide (0.88, 1.76, 2.65, and 3.53 mM) and fermentation durations of 24 and 48 h at 30 °C, showcasing the influence of oxidant dose and fermentation time on biofuel production efficiency. The results depict that carbohydrates are consumed during fermentation and potentially converted into biofuel.
Figure 8a shows that highest ethanol Y
prod was recorded at 1.76 mM H
2O
2 after 48 h, reaching 0.268 g
ethanol/g
carb, which was a 6.8% increase from 0.251 g
ethanol/g
carb at 24 h. At 0.88 mM, the ethanol Y
prod improved slightly, from 0.211 to 0.219 g
ethanol/g
carb (3.8% increase). At 2.65 mM, the ethanol Y
prod increased from 0.202 to 0.232 g
ethanol/g
carb (14.9% increase), while at 3.53 mM, the ethanol Y
prod increased from 0.148 to 0.179 g
ethanol/g
carb (21.0% increase). These trends suggest continued carbohydrate conversion over time, especially at moderate concentrations. The ethanol Y
prod at 1.76 mM was 27% higher than at 3.53 mM at 24 h, confirming 1.76 mM as optimal for ethanol production. Zhang et al. [
42] revealed that a combined pretreatment pyrolysis of treated water hyacinth using UV/H
2O
2 resulted in a 32% increase in hydrocarbons, facilitating bio-oil production.
The methanol Y
prod (
Figure 8b) showed a distinct peak at 2.65 mM after 24 h, yielding 0.1311 g
methanol/g
carb, followed by a dramatic drop to 0.00012 g
methanol/g
carb after 48 h, reflecting a 99.9% reduction. At 0.88 mM, the methanol Y
prod decreased from 0.0495 g
methanol/g
carb to 0.00055 g
methanol/g
carb (98.9% reduction). At 1.76 mM, the methanol Y
prod declined from 0.0228 g
methanol/g
carb to 0.00021 g/g (99.1% decrease). No significant methanol was detected at 3.53 mM. These results confirm that methanol production peaks early and rapidly depletes, possibly due to volatilization or microbial assimilation. This behavior underscores the need for short fermentation times to capture methanol efficiently.
Figure 8c shows that the 1-propanol Y
prod increased with higher H
2O
2 concentrations. At 3.53 mM, the maximum 1-propanol Y
prod of 0.139 g
1-propanol/g
carb was achieved after 24 h, decreasing to 0.028 g
1-propanol/g
carb at 48 h (79.9% reduction). At 2.65 mM, the 1-propanol Y
prod dropped from 0.086 to 0.0096 g
1-propanol/g
carb (88.8% decrease). At 0.88 mM, 1-propanol Y
prod declined from 0.036 to 0.021 g
1-propanol/g
carb (41.7% decrease), while at 1.76 mM, the 1-propanol Y
prod remained constant at 0.022 g
1-propanol/g
carb over both time points. Thus, 1-propanol is rapidly generated and then depleted at high oxidant levels. The 1-propanol Y
prod at 3.53 mM of H
2O
2 and fermentation for 24 h was 4.36× higher than the Y
prod at 1.76 mM, making this treatment the most favorable for fast, high-yield 1-propanol production.
The 1-butanol Y
prod (
Figure 8d) peaked at 2.65 mM after 24 h, with a Y
prod of 0.1058 g
1-butanol/g
carb, which dropped to 0.00725 g
1-butanol/g
carb at 48 h (93.2% reduction). At 0.88 mM, the 1-butanol Y
prod decreased from 0.0466 to 0.0199 g
1-butanol/g
carb (57.3% decrease). At 1.76 mM, the 1-butanol Y
prod remained relatively stable (0.0133 to 0.0125 g
1-butanol/g
carb; a 6.0% decrease). At 3.53 mM, the 1-butanol Y
prod fell from 0.026 to 0.0122 g
1-butanol/g
carb (53.1% decrease). The 1-butanol Y
prod yield at 2.65 mM was 127% higher than the yield at 0.88 mM after 24 h, highlighting that moderate oxidative pretreatment significantly boosts the initial butanol yield, although this is not sustained.
Unlike the other alcohols, 1-pentanol’s Y
prod (
Figure 8e) increased over time at lower concentrations. At 1.76 mM, the 1-pentanol Y
prod rose from 0.0174 g
1-pentanol/g
carb (24 h) to 0.046 g
1-pentanol/g
carb (48 h), representing a 164% increase. At 0.88 mM, the Y
prod increased from 0.010 to 0.034 g
1-pentanol/g
carb (240% increase). At 2.65 mM, the 1-pentanol Y
prod rose from 0.0093 to 0.018 g
1-pentanol/g
carb (93.5% increase). At 3.53 mM, however, the Y
prod decreased from 0.0235 to 0.0051 g
1-pentanol/g
carb (78.3% decrease). The highest 1-pentanol Y
prod was 0.046 g
1-pentanol/g
carb at 1.76 mM after 48 h, which was 360% higher than the yield at 0.88 mM after 24 h. This behavior suggests that 1-pentanol may be a secondary fermentation product favored under prolonged, moderate oxidation.
These findings align with those of studies such as the work of Yang et al. [
16], who achieved 91.6% glucose conversion using UV/H
2O
2 pretreatment, as well as additional research on ZSM-5 catalysis and enzymatic hydrolysis [
42,
43]. However, unlike lignocellulosic systems, where the biofuel yield increases with time, the current study reveals that, for microalgae, the biofuel type, H
2O
2 concentration, and fermentation time must be tailored specifically to the target product.
The impact of fermentation temperature on the conversion efficiency of UV/H2O2-pretreated microalgal biomass into biofuels was systematically evaluated at 30 °C, 35 °C, and 37 °C over fermentation durations of 24 and 48 h, using fixed hydrogen peroxide concentrations (0.88, 1.76, 2.65, and 3.53 mM). This study focused on the production of ethanol, methanol, 1-propanol, 1-butanol, and 1-pentanol, with a particular emphasis on the metabolic and thermodynamic principles influencing yield outcomes.
Ethanol biosynthesis via Saccharomyces cerevisiae relies on the glycolytic breakdown of glucose into pyruvate, followed by decarboxylation and reduction to ethanol under anaerobic conditions. The maximum ethanol yield was observed at 30 °C, peaking at 0.251 g/g at 1.76 mM after 24 h, and further increasing by 6.7% to 0.268 g/g after 48 h.
In contrast, at 35 °C, the yield at 0.88 mM was 0.18 g/g (24 h) and 0.21 g/g (48 h)—28% lower than the corresponding 30 °C value. At 37 °C, the yields were even more suppressed, rising from 0.09 g/g to 0.15 g/g, marking a 40–50% reduction compared to optimal conditions. The decline in ethanol yield with increasing temperature can be attributed to the thermal sensitivity of S. cerevisiae’s fermentative enzymes and the shift toward stress-response pathways that divert carbon flux away from ethanol synthesis.
Methanol was detected only at 30 °C, with the highest yield of 0.1311 g/g recorded at 2.65 mM after 24 h. However, this yield plummeted by >99.9% to 0.00012 g/g after 48 h. At lower H2O2 concentrations, methanol similarly decreased with time. No methanol was detected at 35 °C or 37 °C, indicating rapid volatilization or metabolic assimilation at elevated temperatures. This aligns with the known low boiling point and volatility of methanol, and suggests that methanol accumulation is thermodynamically unstable above 30 °C, reinforcing the need for early harvest strategies in methanol-focused processes.
1-Propanol is produced through amino acid catabolism (notably threonine) and may proceed via the Ehrlich pathway. At 30 °C, the yield reached a maximum of 0.139 g/g (3.53 mM, 24 h) but fell to 0.028 g/g (48 h)—a 79.9% reduction. At 2.65 mM, the yield decreased from 0.086 g/g to 0.0096 g/g (88.8% decrease). At 35 °C, the peak yield dropped to 0.05 g/g (24 h) and 0.01 g/g (48 h). Interestingly, a reverse trend was observed at 2.65 mM, with the yields increasing from 0.035 g/g to 0.067 g/g, suggesting temperature-induced activation of secondary fermentative enzymes. At 37 °C, the highest recorded yield was 0.009 g/g at 0.88 mM (24 h), decreasing to 0.006 g/g, marking an over 90% reduction compared to the 30 °C peak. These results highlight the thermal fragility of 1-propanol biosynthesis, which is optimal under moderate temperatures and is highly suppressed by heat stress.
1-Butanol formation is typically governed by the CoA-dependent ABE (acetone–butanol–ethanol) pathway. At 30 °C, the highest yield was 0.1058 g/g (2.65 mM, 24 h), decreasing sharply to 0.00725 g/g (48 h)—a 93.2% drop. At 0.88 mM, the yield declined from 0.0466 to 0.0199 g/g, while at 1.76 mM it remained relatively low (0.00796 to 0.00985 g/g). At 35 °C, the maximum yield was 0.05 g/g (24 h), declining to 0.012 g/g (48 h), while at 37 °C, the maximum yield did not exceed 0.01 g/g, with most values <0.009 g/g. This represents a 5–10× reduction compared to the optimal yield at 30 °C. This temperature sensitivity is consistent with the well-documented thermolability of the key enzymes involved in acetyl-CoA conversion and butanol elongation, as well as the inhibitory effect of heat on NADH regeneration necessary for butanol synthesis.
In contrast to the other biofuels, 1-pentanol exhibited an increasing trend over time and appeared to benefit from elevated fermentation temperatures. At 30 °C, the yield at 3.53 mM decreased from 0.0235 to 0.0051 g/g (78% reduction), but at lower concentrations, the yields increased: from 0.010 to 0.034 g/g (0.88 mM) and from 0.0174 to 0.046 g/g (1.76 mM) over 48 h. At 35 °C, the yields continued this trend: 0.011 to 0.021 g/g (1.76 mM) and 0.009 to 0.015 g/g (3.53 mM), reflecting a 91% increase in the former case. At 37 °C, the most notable rise was at 1.76 mM, from 0.00174 to 0.022 g/g—a 1164% increase, the highest relative growth among all biofuels in the study. This pattern suggests that 1-pentanol may be regulated through heat-responsive pathways, possibly involving amino acid catabolism (e.g., leucine-derived keto acid elongation) or the Ehrlich pathway, which is known to be activated under oxidative or thermal stress. The delayed accumulation implies that 1-pentanol may function as a secondary or overflow metabolite, emerging when primary fermentative pathways are saturated or inhibited. These results indicate that 1-pentanol production benefits from higher temperatures and longer fermentation times, suggesting that it may follow an alternative secondary metabolic pathway (e.g., Ehrlich pathway) that is activated under stress or extended fermentation.
The previous results reveal that fermentation temperature plays a pivotal role in determining the profile and yield of biofuels from pretreated microalgal biomass. It was observed that 30 °C is optimal for ethanol, methanol, 1-propanol, and 1-butanol, supporting high enzymatic activity and maintaining redox balance for efficient fermentation Methanol formation is exclusive to 30 °C, likely due to its volatility and instability at higher temperatures. 1-Propanol and 1-butanol yields are suppressed by 80–95% at 37 °C compared to 30 °C, reflecting thermally sensitive metabolic bottlenecks. 1-Pentanol production uniquely increases at higher temperatures and extended durations, suggesting temperature-induced redirection of carbon flow into alternative alcohol pathways. These findings align with those of prior studies, including the works of Yang et al. [
16], Zhang et al. [
42], and Qureshi et al. [
44], which highlight the importance of fine-tuning the fermentation parameters—particularly temperature and retention time—to maximize the yield of targeted biofuels. Understanding the enzymatic and regulatory basis of these temperature-dependent shifts is crucial for developing optimized microalgae-based biorefineries.
Table 4 highlights the impacts of H
2O
2 concentration, fermentation time, and temperature on alcohol production from UV/H
2O
2-pretreated microalgae. Methanol was only detected at 30 °C, peaking at 0.1311 g/g (2.65 mM, 24 h), but dropped by >99% after 48 h. No methanol was detected at 35 °C or 37 °C, likely due to volatilization. The 1-Propanol yield was highest at 30 °C, reaching 0.139 g/g (3.53 mM, 24 h), but declined by 85–95% at 37 °C. At 35 °C, some delayed increases were observed, suggesting moderate stress-induced metabolism. 1-Butanol peaked at 0.1058 g/g (30 °C, 2.65 mM, 24 h), but the yields dropped by over 90% at higher temperatures and longer durations. Unlike the other alcohols, 1-pentanol increased over time and with temperature. At 37 °C and 1.76 mM, the yield rose from 0.00174 to 0.022 g/g (a 1164% increase), indicating a stress-activated pathway, possibly the Ehrlich pathway. Overall, 30 °C favored methanol, propanol, and butanol production, while higher temperatures enhanced 1-pentanol yields, demonstrating the need to tailor the fermentation conditions based on the target biofuel.
The current study achieved a maximum ethanol Y
prod of 0.3668 g/g, along with notable production yields of other alcohols, including methanol (0.0564 g/g), 1-propanol (0.0512 g/g), 1-butanol (0.0225 g/g), and 1-pentanol (0.0219 g/g). These results were obtained using UV/H
2O
2 pretreatment under optimized fermentation conditions (temperatures of 30–35 °C and durations of 24–48 h).
Table 5 provides a comparative overview of the biofuel production results from this study in relation to previous works employing different microalgal pretreatment and fermentation strategies.
Compared to prior studies using UV pretreatment alone, the current findings demonstrate enhanced biofuel production. For example, Bhushan et al. [
26] investigated UV-C irradiation (254 nm) as a standalone pretreatment for wastewater-grown algal biomass, with exposure durations ranging from 15 to 60 min. Their highest reported ethanol yield was 0.084 g/g volatile solids (VS), with a maximum hydrogen yield of 30.1 mL/g VS following 60 min of UV-C exposure. These values are notably lower than the ethanol yield obtained in the present study, highlighting the efficacy of incorporating H
2O
2 to generate additional hydroxyl radicals for improved cell wall disruption.
The work of Ma’mun et al. [
45] further supports the importance of effective pretreatment. In their study, a two-step pretreatment process—comprising thermal acid hydrolysis (1% H
2SO
4 at 121 °C for 15 min) followed by enzymatic hydrolysis with cellulase—was applied to
Arthrospira platensis biomass. This combination significantly enhanced sugar release and fermentability, resulting in an ethanol yield of 5.24 g/L, corresponding to 62.7% of the theoretical maximum. While the yield was substantial, it reflected the concentration per liter rather than per gram of biomass, and it required a longer fermentation duration (72 h) compared to the current study.
Bhushan et al. [
46] offered a comprehensive review of advancements in microalgae-based bioenergy. They emphasized that chemical and oxidative pretreatments, including UV/H
2O
2, are particularly effective for breaking down microalgal cell walls to enhance fermentable sugar release. This aligns closely with the outcomes of the present study, where UV/H
2O
2 pretreatment facilitated substantial production of ethanol and other alcohols from microalgal biomass. Common operational conditions across these studies include fermentation temperatures ranging from 30–60 °C and pH values between 4 and 6.
Saccharomyces cerevisiae remains the preferred fermenting organism for ethanol production, while
Clostridium spp. are more effective for butanol and hydrogen. As reported in the review, yields vary with species and conditions—such as up to 5.6 g/L ethanol from
Scenedesmus obliquus after ultrasonic pretreatment and lipid contents reaching 57% of dry cell weight (DCW) for biodiesel, with biohydrogen yields of up to 112 mL H
2/g VS via dark fermentation.
Table 5.
Comparison of biofuel production with other studies.
Table 5.
Comparison of biofuel production with other studies.
| Feedstock | Pretreatment Method | Pretreatment/Fermentation Conditions | Ethanol Yield | Other Biofuels | Reference |
|---|
| Mixed culture | UV and UV/H2O2 | 30–35 °C; 24–48 h; S. cerevisiae | 0.3668 g/gcarb | Methanol (0.0564), 1-propanol (0.0512), 1-butanol (0.0225), 1-pentanol (0.0219) g/g | Current study |
| Mixed culture | UV-C | 60 min UV; fermenter not specified | 0.084 g/gVS | Hydrogen: 30.1 mL/g VS | [26] |
| Arthrospira platensis | Microwave-assisted acid hydrolysis (H2SO4) | 48 h hydrolysis,
72 h fermentation at 30 °C; S. cerevisiae | 5.24 g/L (~0.35 g/g carbohydrate) | Not reported | [45] |
| Various microalgae (e.g., Chlorella, Scenedesmus, Arthrospira) | Various (UV/H2O2, acid, alkaline, ultrasonic, enzymatic) | Varies widely across studies | Up to 5.6 g/L (Scenedesmus) | Butanol (18.9 g/L), H2 (112 mL/g VS), lipids (up to 57% DCW) | [26] |
| Sisal waste (lignocellulosic) | UV photocatalysis + alkaline H2O2 | Enzymatic hydrolysis post pretreatment | Not directly reported; 71.2% sugar conversion | None reported | [16] |
| Ulva reticulata (seaweed) | CEM microwave + H2SO4 | 5 days at 30 °C; 12% S. cerevisiae; pH 4.5 | 42.53% ethanol content (~5.02 g/L est.) | Not reported | [47] |
The findings of Yang et al. [
16] further corroborate the potential of UV/H
2O
2 pretreatment. They demonstrated that combining UV photocatalysis with alkaline H
2O
2 significantly enhanced the enzymatic hydrolysis of sisal waste, achieving a 62.4% increase in reducing sugar yield. Although their substrate was lignocellulosic rather than algal, the underlying mechanism—generation of hydroxyl radicals and disruption of biomass structure—supports the strategy used in the current study to improve carbohydrate accessibility.
Additional studies provide further context. For example, Kushwaha et al. [
32] reported high butanol production (18.9 g/L) using
Clostridium spp., although their process required 110 h of fermentation under acidic conditions, making it less time-efficient. Kolo et al. [
47] found that UV pretreatment of
Chlorella vulgaris for 30 min improved cell disruption, leading to a 16% increase in biogas yield and an increase in methane content from 48% to 54%, underscoring the broad applicability of UV-based pretreatment in various bioenergy contexts.
In summary, the UV/H2O2 pretreatment applied in this study effectively enhanced bioethanol and higher alcohol production from microalgae. The results not only demonstrate comparable or superior yields to those reported in other studies but also underscore the efficiency of oxidative pretreatment in improving fermentation outcomes through improved cell disruption and sugar release.
While this study successfully demonstrated the effectiveness of UV and UV/H2O2 pretreatments in enhancing carbohydrate release and biofuel production from mixed marine microalgal cultures, several future directions should be acknowledged. First, the current work was conducted using batch fermentation and did not incorporate kinetic analysis or real-time monitoring of biotransformation rates. Future research should include kinetic studies and real-time biotransformation measurements to better understand the substrate utilization dynamics and process efficiency. Furthermore, pigment and chlorophyll degradation analyses were not conducted but could serve as important indicators of microalgal digestion and pretreatment effectiveness. Incorporating such spectrophotometric measurements in future studies would enhance our understanding of cell wall disruption and biomass utilization efficiency.
The obtained results show that the efficiency of carbohydrate release from LMCMA was significantly influenced by the type of pretreatment applied. UV irradiation alone achieved low carbohydrate release efficiencies in the range 25.0% to 44.6%. In contrast, UV/H2O2 pretreatment demonstrated markedly superior performance, with efficiencies ranging from 43.0% to 82.2%. This enhanced performance can be attributed to the generation of more hydroxyl radicals (•OH), which effectively degraded structural polysaccharides and disrupted cell membranes, resulting in a more complete solubilization of intracellular contents.
The significant increase in carbohydrate release directly translated into improved biofuel production. UV/H2O2 pretreatment not only increased the availability of fermentable sugars but also facilitated the liberation of additional biomolecules such as proteins and lipids—critical for supporting microbial growth and the synthesis of diverse biofuels, including ethanol, methanol, and higher alcohols (1-propanol, 1-butanol, and 1-pentanol). This comprehensive cell disruption enabled more complete biomass utilization and improved the overall carbon conversion efficiency during fermentation. Compared to UV-only pretreatment, which resulted in limited substrate availability due to partial cell disintegration, the UV/H2O2 strategy led to higher ethanol yields and broader bioalcohol production profiles. Moreover, the UV/H2O2 approach provided a balanced nutrient environment for Saccharomyces cerevisiae, enhancing the fermentation performance and product selectivity. By maximizing the fermentable substrate availability while minimizing over-oxidation and inhibitory byproduct formation, UV/H2O2 pretreatment offers a robust and scalable strategy for sustainable biofuel production. These findings highlight its potential as a key enabling technology for the full valorization of algal biomass within an integrated biorefinery framework, supporting the transition toward a circular and low-carbon bioeconomy.


