Article

Integrated Process Combining High-Temperature Fermentation and Extractive Ethanol Removal via CO2 Stripping

by
Jorge Luíz Silveira Sonego
1,
Jaqueline Machado de Moraes
2,
Nayana Simon de Vargas
3,
Anderson Ferreira da Cunha
4,
Rosineide Gomes da Silva Cruz
2,
Antonio José Gonçalves Cruz
2,3,* and
Alberto Colli Badino
2,3
1
Graduate Program in Biotechnology, Federal University of Pernambuco, Recife 50670-901, PE, Brazil
2
Chemical Engineering Department, Federal University of São Carlos, São Carlos 13565-905, SP, Brazil
3
Chemical Engineering Graduate Program, Federal University of São Carlos, São Carlos 13565-905, SP, Brazil
4
Department of Genetics and Evolution, Federal University of São Carlos, São Carlos 13565-905, SP, Brazil
*
Author to whom correspondence should be addressed.
Fermentation 2025, 11(5), 270; https://doi.org/10.3390/fermentation11050270
Submission received: 28 February 2025 / Revised: 14 April 2025 / Accepted: 6 May 2025 / Published: 9 May 2025
(This article belongs to the Special Issue YBC2025: Yeast in Bioeconomy)

Abstract

:
Fermentation at high temperatures may be a viable alternative for ethanol production, especially in tropical climate regions. This work describes the evaluation of ethanol production through extractive fermentation at high temperatures using thermotolerant Kluyveromyces marxianus. An experimental design was applied to assess the effect of temperature on the ethanol removal process by CO2 stripping. Subsequently, kinetic modeling of conventional batch ethanol fermentation at high temperatures was performed, and the hybrid Andrews−Levenspiel model was found to be suitable for describing the kinetics of this process. Experiments were conducted to evaluate ethanol production at high temperatures using thermotolerant yeast, specifically evaluating the effects of different specific CO2 flow rates (ϕ = 1.0, 1.5, and 2.0 vvm) on ethanol stripping. The results indicated that in all the extractive fermentations conducted with K. marxianus, there was faster substrate uptake and earlier substrate exhaustion compared to conventional fermentation. Significant ethanol removal by stripping was achieved using a CO2 flow rate of 1.0 vvm (EFHT1), and complete substrate consumption was observed by the end of 12 h of fermentation. This result highlights the positive effect of temperature on ethanol entrainment. In addition, integrating the CO2 stripping technique with high-temperature fermentation (T = 40 °C) improves process efficiency with a lower gas flow rate. This is advantageous, especially for industrial-scale applications, as it can reduce equipment costs associated with the CO2 feed.

1. Introduction

Up to the present day, the global energy matrix remains highly dependent on fossil fuels, resulting in significant greenhouse gas emissions. These emissions are closely tied to climate change and have direct consequences on human well-being. As a consequence, the urgent need to replace fossil fuels with renewable alternatives, such as ethanol, is becoming increasingly critical [1,2].
Industrial production of fuel ethanol has become a well-established process that is robust, economically viable, and sustainable [3]. However, several scientific and technological challenges remain in ethanol production [4]. There is a need to develop new technologies with innovative solutions for the sector [3,5]. Recent studies have focused on identifying technologies to enhance ethanol production [6,7], improve the cost–benefit ratio [6], increase energy efficiency, and improve water usage [8], thereby helping to meet the growing demand for ethanol fuel.
In Brazil, ethanol is primarily produced through the fermentation of sugar cane juice. The concentration of total fermentable sugars is approximately 20 °Brix, which equates to about 180 g L−1 of total reducing sugars (TRSs) [9]. Industrial fermentation for ethanol can be performed using either discontinuous (fed-batch) or continuous processes, both of which involve recycling yeast to achieve a high cell density in the fermentation vats [10]. This practice achieves ethanol concentrations in the fermentation broth of approximately 8−11% (v v−1) in fermentations conducted for up to 12 h. The process achieves a high ethanol yield, between 90 and 92% of the theoretical maximum (0.511 g ethanol per g hexose equivalent), at temperatures ranging from 32 to 35 °C [11,12]. These fermentations predominantly use the yeast Saccharomyces cerevisiae, which performs well in this temperature range.
Fermentation at high temperatures can be a viable alternative for ethanol production. To implement high-temperature ethanol fermentation, thermotolerant yeast strains are required, capable of maintaining their metabolism at temperatures of 40 °C or higher [13,14,15]. Thermotolerant yeasts offer several advantages, including energy savings through reduced cooling costs for fermentation vats [16], increased productivity due to higher substrate uptake rates and product formation [17], and a lower risk of contamination by mesophilic microorganisms [18]. Among the thermotolerant strains, Kluyveromyces marxianus has been studied as a promising candidate yeast for high-temperature ethanol production [3]. Research indicates that this yeast can ferment effectively at temperatures ranging from 37 to 50 °C [19,20,21,22,23]. K. marxianus is known for its rapid cell growth and ability to utilize a wide range of substrates, including sugar cane juice, corn maceration water, molasses, whey [24], as well as xylose, xylitol, cellobiose, and others [25].
Another advantage of high-temperature fermentation is the ability to use gas stripping to remove some of the ethanol produced during the fermentation process [13]. To address ethanol inhibition, extractive fermentation with CO2 stripping can be employed to remove ethanol from the broth. This technique is advantageous because it is relatively simple and selectively removes volatile compounds in a clean form. Additionally, it does not remove nutrients from the broth or harm the cells during fermentation [26,27,28]. According to Sonego et al. [29], the cell viability obtained after 9 h of extractive ethanolic fermentation with CO2 stripping (ϕCO2 = 2.5 vvm) using the yeast S. cerevisiae was an average viability of 64%. This value was higher than that obtained for conventional fermentation, which had a viability of 55%.
To maintain the fermentation temperature, the energy released by yeast during the process must be removed using cooling water through plate heat exchangers. If not adequately removed, the energy released (697.7 kJ kg−1 of glucose consumed) can cause the broth temperature to rise. This effect is more pronounced in industrial units located in tropical climates, where the temperature inside the vat can reach 38 to 40 °C [6,30,31]. This increase in temperature can make ethanol production economically unviable due to the high consumption of cooling water, reduced ethanol yields, higher final concentrations of residual sugar, increased yeast cell mortality, and the proliferation of contaminating bacteria [3].
Several studies have demonstrated that extractive fermentation with gas stripping effectively prevents ethanol inhibition [6,28]. Furthermore, ethanol removal by gas stripping is favored at higher temperatures. Previous studies indicate that ethanol removal by CO2 stripping from hydroalcoholic solutions [32,33] or from fermentation media is enhanced by increased temperatures [28].
In this sense, the present study focused on evaluating ethanol production through extractive fermentation at high temperatures. An experimental design was applied to assess the effect of temperature on the ethanol removal process by CO2 stripping. In the sequence, experiments were conducted to evaluate ethanol production at high temperatures using thermotolerant K. marxianus, specifically evaluating the effects of different CO2 flow rates on ethanol stripping.

2. Materials and Methods

2.1. Equipment

The experiments were performed using a bubble column bioreactor with a 2 L working volume (30.3 cm liquid height, 47.7 cm total height, and 9.2 cm internal diameter), composed of an upper part made of acrylic and a jacketed base made of stainless steel. The CO2 was injected through a perforated cross-sparger (36 holes spaced 5 mm apart and 0.5 mm in diameter) located at the bottom of the bioreactor. For conventional and extractive fermentations with CO2 stripping, a condenser was connected to the lid of the bioreactor.

2.2. Influence of High Temperature in the Ethanol Removal by CO2 Stripping

To evaluate the influence of high temperature on ethanol removal by CO2 stripping, experiments were performed under different conditions of the specific CO2 flow rate (ϕ) and solution temperature (T).
The gas used in the stripping experiments was commercial carbon dioxide (CO2), stored in a cylinder (25 kg and approximately 60 atm when full). The stripping experiments were carried out as described by [28], with each experiment lasting 6 h. The CO2 flow rate was controlled using a mass flow controller (GFC 37, Aalborg, Orangeburg, NY, USA). A thermostatic bath was used to regulate the bioreactor temperature, and a digital thermometer (HI 147-00, Hanna Instruments, Keysborough, VIC, Australia) monitored the solution temperature throughout the experiments. Samples were withdrawn hourly to measure changes in the ethanol concentration (CE), and the liquid phase volume (V) was also recorded at the same time intervals.
Experiments were carried out using a two-level Central Composite Rotational Design (CCRD) [34] to evaluate the influence of three operational variables on the performance of the ethanol stripping process: specific CO2 flow rate (X1: ϕCO2 in vvm), solution temperature (X2: CE0 in g L−1), and initial ethanol concentration (X3: Tsol in °C). A total of 17 experiments were carried out (Table 1), including 8 factorial points, 6 axial points (α = 1.68), and 3 central points. The variable levels were as follows: 1.0 to 4.0 vvm for X1; 30 to 60 g L−1 for X2; and 35 to 45 °C for X3. The removal rate constants for ethanol (kE) and water (kW) were the response variables in the stripping study. The quality of the fitted models was assessed by the R2 coefficient, and statistical significance was evaluated using the F-test and p-value. Statistica v. 7.0 software (StatSoft, Inc., Tulsa, OK, USA) was used for data analysis.

2.3. Ethanol Stripping Process: Ethanol and Water Removal Model

Studies on stripping reported in the literature [7,28,35,36] describe the removal of solvents from aqueous solutions according to the classical first-order kinetic model proposed by Truong and Blackburn [37]. More recently, Ref. [28] has introduced a different approach to describe the gas stripping process, accounting for the removal of ethanol and water and considering changes in the solution volume. This model is based on Equations (1)–(3).
d C E d t = k E + 1 V · d V d t · C E
d C W d t = k W + 1 V · d V d t · C W = k W + 1 V · d V d t · ( ρ S C E )
d V d t = V ρ S · ( k E · C E + k W · C W )
where CE and CW are the ethanol and water concentrations in the solution (g L−1), kE and kW are the removal rate constants for ethanol and water (h−1), V is the liquid phase volume (L), and ρS is the is the specific mass of the solution (g L−1).

2.4. Microorganism and Culture Media

The thermotolerant strain of Kluyveromyces marxianus, kindly provided by the Biochemistry and Applied Genetics Laboratory of the Department of Genetics and Evolution at the Federal University of São Carlos (SP, Brazil), was utilized in this study. This strain was initially isolated during ethanol production at a mill located in the city of Ourinhos, SP, Brazil. The strain was first cultured on YPD medium plates, from which a single colony was selected and cultivated in YPD medium. The culture was subsequently preserved in glycerol at −80 °C in a cryotube until use.
The medium used to perform the fermentations was prepared using analytical grade reagents and contained sources of carbon, nitrogen, phosphorus, potassium, and magnesium, simulating the composition of sugar cane molasses used in Brazilian distilleries and supplying the nutritional requirements of the yeast. The culture medium contained 5.6 g L−1 KH2PO4, 1.4 g L−1 MgSO4·7H2O, 6.8 g L−1 yeast extract, 5.32 g L−1 urea, and 100.0 or 190.0 g L−1 sucrose. The initial pH of the fermentation broth was adjusted to 4.6 by adding hydrochloric acid [28]. The substrate (S) was considered the total reducing sugars (TRSs), obtained as the sum of glucose and fructose after the total inversion of sucrose by yeast invertase [5].

2.5. Evaluation of the Temperature Tolerance of Yeasts

Cell production for inoculum was carried out in a 1 L shaking flask containing 100 mL of fermentation medium with a sucrose concentration of 100.0 g L−1. The flask was inoculated with a cryotube of stock culture and incubated in a rotary shaker at 40 °C and 250 rpm for 10 h. Following incubation, the suspension was centrifuged (4000 rpm and 4 °C for 20 min). After this step, the suspension was centrifuged and used to start fermentation tests at different temperatures.
The fermentation tests were carried out at different temperatures (38, 40, 42, and 44 °C) to evaluate the optimal fermentation temperature. The thermotolerant strain K. marxianus was used at the initial concentration (in dry mass) of 10 g L−1. The fermentation assays were carried out in 250 mL shake flasks with 100 mL of medium (200 rpm and pH 4.5 for 9 h) in duplicate. To analyze the process, every 1 h, a volume of 1 mL was collected for the analysis of cell, sugar, and ethanol concentrations.

2.6. Conventional and Extractive Ethanol Fermentation at High Temperature

The fermentations were performed in a bubble column bioreactor with an initial cell concentration of approximately 10 g L−1 (dry basis) from the cell production step carried out similarly to that used for fermentations in shaking flasks. Both conventional and extractive fermentations with CO2 stripping were carried out at 40 °C for 12 h using a sucrose-based culture medium, as previously reported. At the beginning of all the cultivations, agitation was achieved by recirculating the medium with a peristaltic pump (Watson Marlow 323 Dz, Wilmington, MA, USA) set at 300 rpm. Samples (2 mL) were withdrawn every hour for analysis. In conventional fermentation, to minimize ethanol loss due to evaporation, a condenser was attached to the bioreactor. The extractive fermentations with CO2 stripping were performed under the same conditions as the conventional experiments, except that the agitation and condenser were used only until the CO2 injection started.
Three extractive batch ethanol fermentations were performed with ethanol removal by CO2 stripping initiated 3 h after the start of the experiment when the ethanol concentration reached approximately 30 g L−1. The specific CO2 flow rates (ϕ) were 1.0 (EFHT1), 1.5 (EFHT2), and 2.5 (EFHT3) vvm. Both the conventional and extractive ethanol fermentations were performed in duplicate.

2.7. Analytical Methods

Cell concentrations (on a dry mass basis) were determined after centrifuging the samples at 10,000 rpm and 4 °C for 10 min. The precipitates were washed twice with distilled water and then dried at 80 °C for 24 h. The concentrations of sucrose, glucose, fructose, and ethanol in the supernatants were analyzed using an HPLC (Waters, Houston, TX, USA) equipped with a refractive index detector and a Sugar-Pak I column (300 × 6.5 mm, 10 μm, Waters) maintained at 80 °C. Ultrapure water was utilized as the eluent, at a flow rate of 0.5 mL min−1 [28]. Calibration was performed with standard solutions of sucrose, glucose, fructose, and ethanol, at concentrations between 0.1 and 8.0 g L−1.

2.8. Mathematical Modeling of Batch Ethanol Fermentations

2.8.1. Conventional Ethanol Fermentation

According to [28], conventional batch fermentation is represented by three differential Equations (4)–(6), which represent the mass balances for the cells (X), substrate (S), and ethanol (E).
d C x d t = μ · C x
d C s d t = 1 Y X / S · μ · C x
d C E d t = Y E / S Y X / S · μ · C x
where CX is the cell concentration (g L−1), μ is the specific cell growth rate (h−1), CS is the limiting substrate concentration (g L−1, obtained from the sum of the concentrations of glucose and fructose), CE is the ethanol concentration (g L−1), YX/S is the cell yield coefficient (gX gS−1), and YE/S is the ethanol yield coefficient (gE gS−1).
The hybrid Andrews–Levenspiel kinetic model [38,39] was used to represent the growth, considering inhibition by both the substrate and product (Equation (7)).
μ = μ m a x · C s K S + C s + C s 2 K I S · 1 C E C E m a x n
where μmax is the maximum specific cell growth rate (h−1), KS is the saturation constant (g L−1), KIS is the substrate inhibition constant (g L−1), CEmax is the maximum concentration of ethanol after which cell growth ceased, and n is a dimensionless constant.
The cell and ethanol yield coefficients, YX/S and YE/S, were determined by Equations (8) and (9), respectively.
Y X / S = C x f · V C x 0 · V 0 C s 0 · V 0 C s f · V
Y E / S = C E f · V C E 0 · V 0 C s 0 · V 0 C s f · V
where the subscripts “0” and “f” refer to the initial and final times, respectively.

2.8.2. Kinetic Parameter Estimation Procedure

After the determination of the YX/S and YE/S coefficients, the kinetic parameters were estimated using the nonlinear optimization method combining the genetic algorithm (GA) with the Runge–Kutta algorithm for numerically solving the differential equations representing the model. Scilab 5.4.1 software was used to implement these algorithms. The objective function was the sum of the squared differences between the experimental and model-predicted concentrations of cells (X), substrate (S), and ethanol (E). The criterion for the best fit and parameter optimization was the minimization of the sum of squared residuals [5].

2.8.3. Extractive Ethanol Fermentation with Ethanol Removal by CO2 Stripping

According to [28], the mathematical model for extractive batch fermentation employed mass balance equations for the cells (X), substrate (S), and ethanol (E). It also accounted for the removal of ethanol and water (W) by the CO2 stream and changes in the broth volume (V). Equations (10)–(13) describe the model.
d C x d t = μ · C x C x · 1 V · d V d t
d C s d t = 1 Y X / S · μ · C x C s · 1 V · d V d t
d C E d t = Y E / S Y X / S · μ · C x C E · 1 V · d V d t k E · C E
d V d t = k E · C E + k w · ρ w C E · V ρ w
where V is the broth volume (L), kE is the removal rate constant for ethanol (h−1), kw is the removal rate constant for water (h−1), and ρw is the specific mass of water (g L−1).
The numerical resolution of the set of differential equations (Equations (4)–(13)) was performed by the implementation of the Runge–Kutta algorithm using Scilab 5.4.1 software.

3. Results

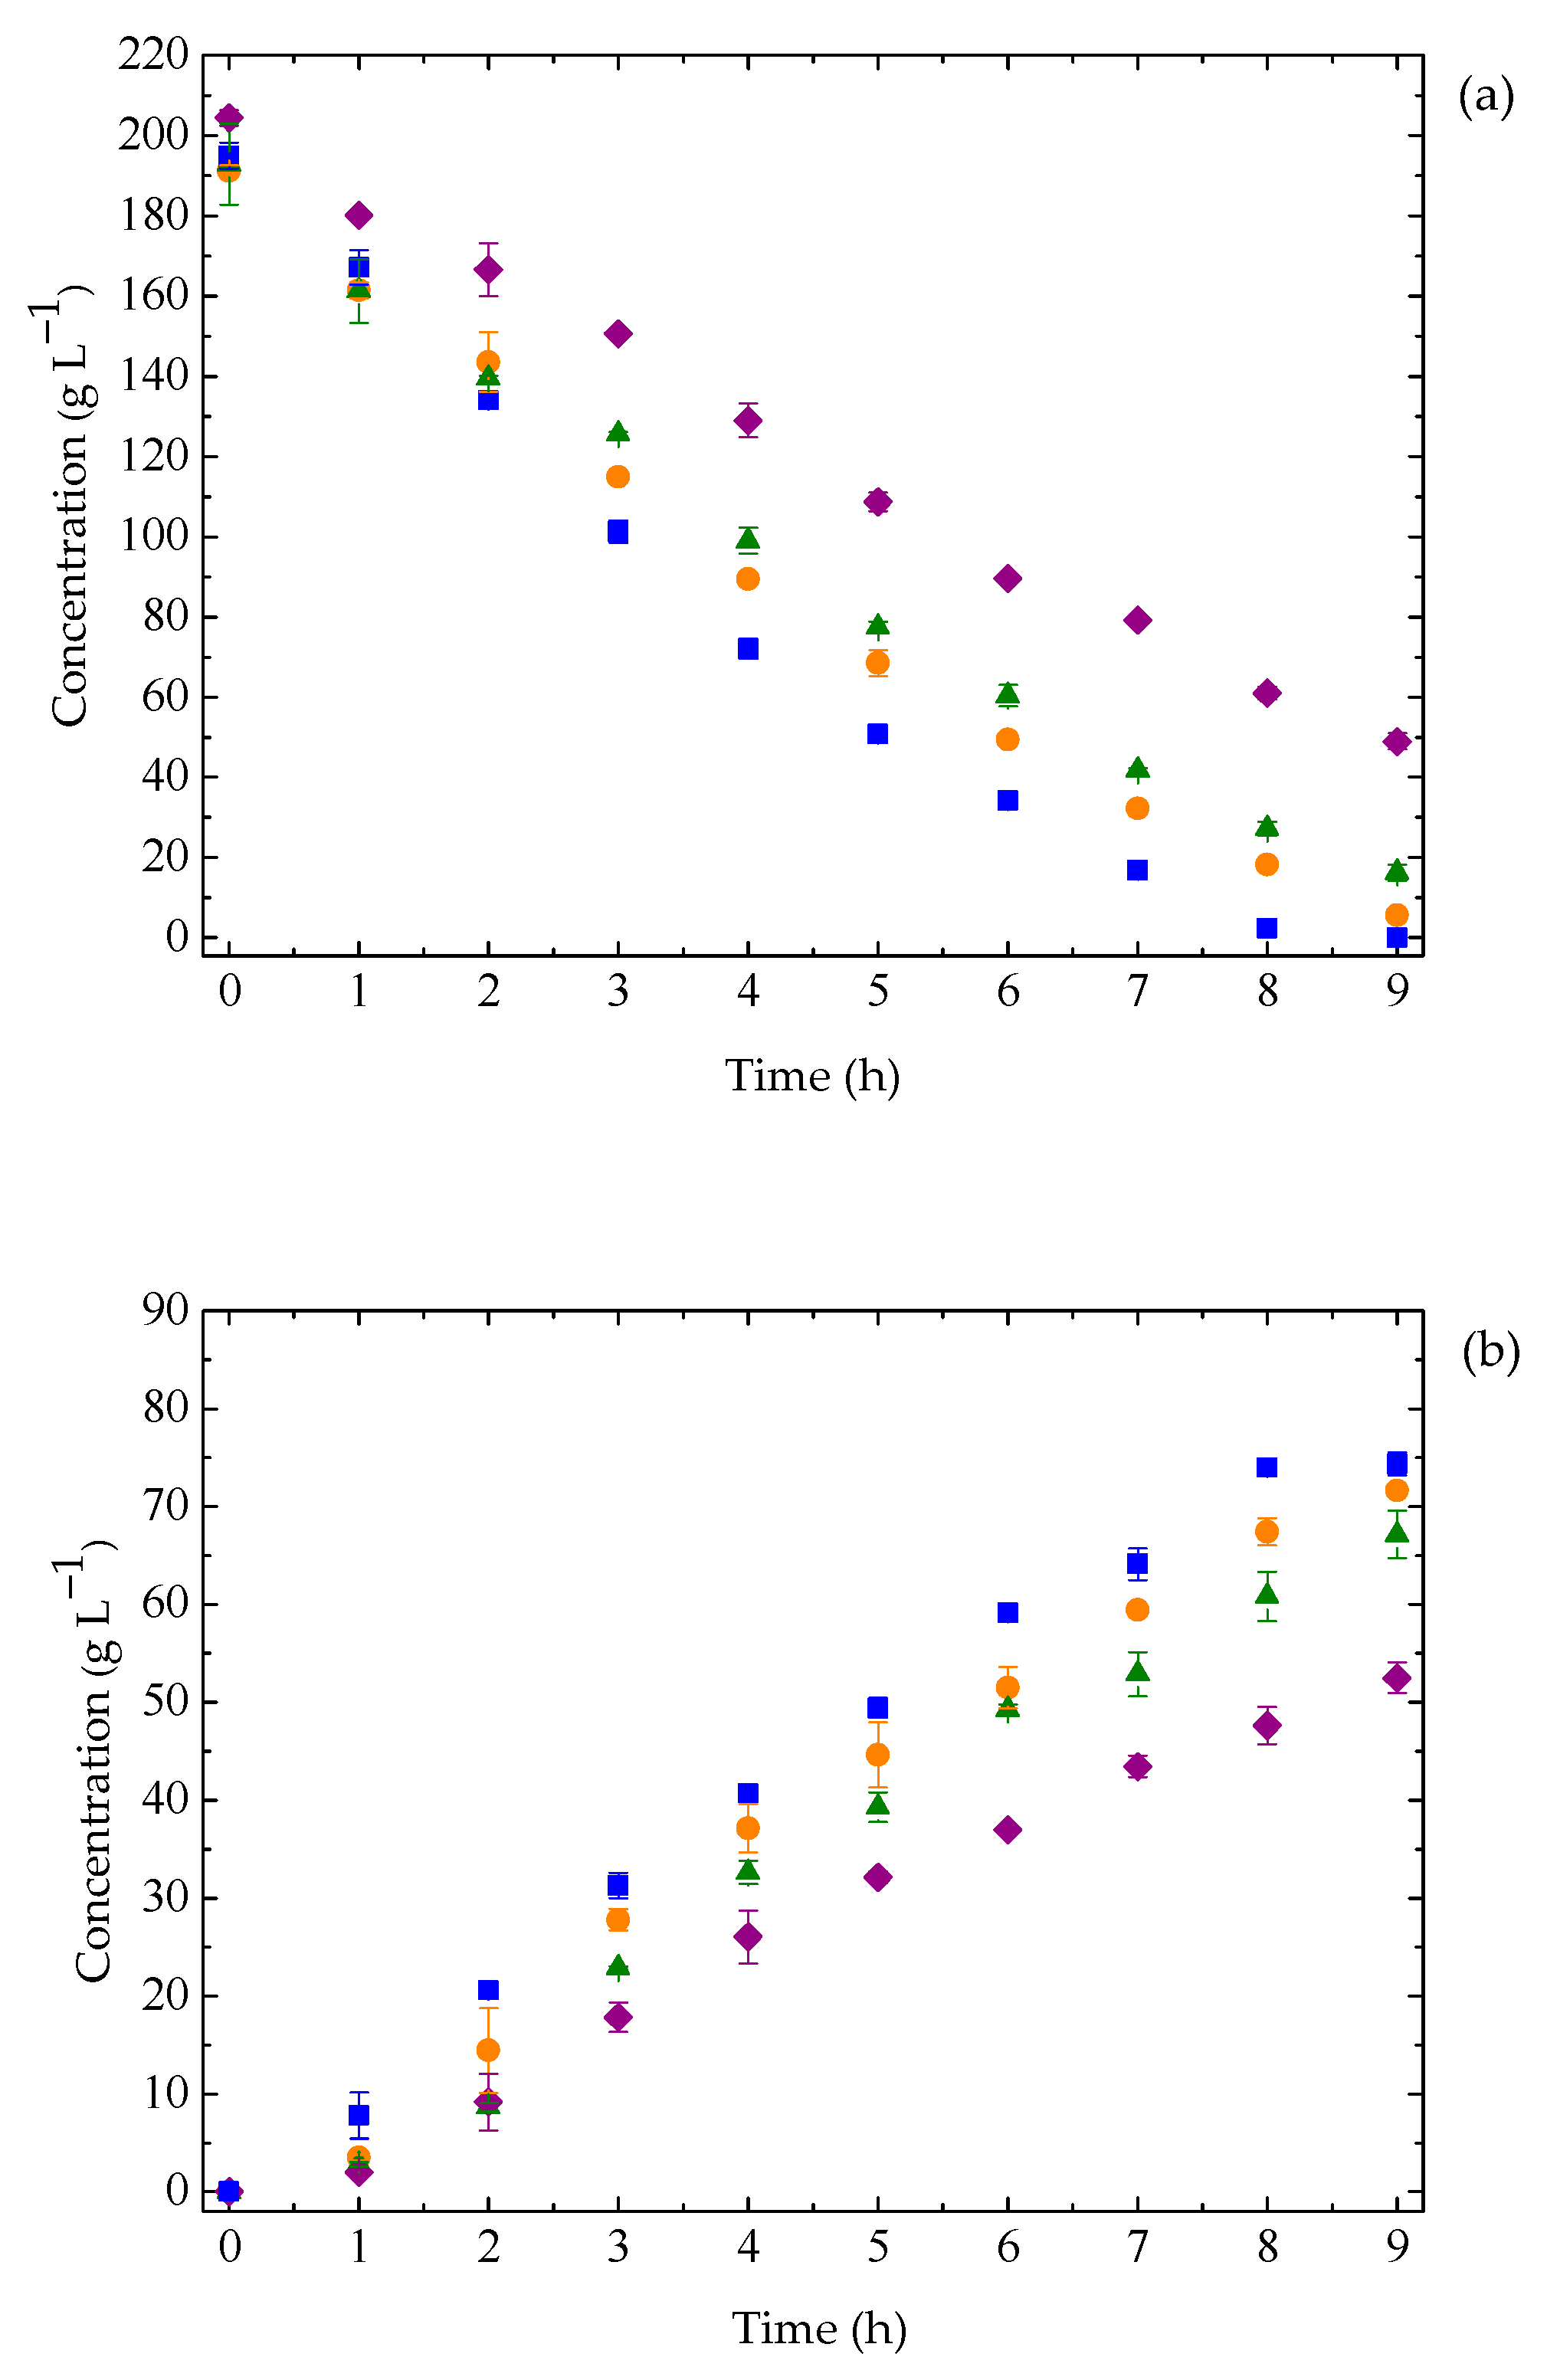
3.1. Effect of Hight Temperature on Ethanol Removal by CO2 Stripping

The removal rate constants for ethanol (kE) and water (kW) for each stripping experiment in the CCRD were determined by fitting the model prediction to the experimental data for the ethanol concentration (CE), water concentration (CW), and solution volume (V). The calculated data were obtained by solving the differential equations of the proposed model (Equations (1)–(3)). The CCRD matrix and experimental results for kE and kW from the CO2 stripping process of the hydroalcoholic ethanol solutions are presented in Table 1.
The data in Table 1 show that the ethanol removal rate constant (kE) and the water removal rate constant (kW) ranged from 0.044 to 0.155 h−1, and from 0.0017 to 0.0054 h−1, respectively. The highest values for kE and kW were achieved under the following operating conditions (run #8): ϕCO2 = 3.39 vvm (X1 = +1), CE0 = 53.9 g L−1 (X2 = +1), and TSol = 43.0 °C (X3 = +1). In run #8, the kE and kW values were higher compared to those values obtained in run #7 (ϕCO2 = 1.61 vvm (X1 = −1), CE0 = 53.9 g L−1 (X2 = +1), and TSol = 43.0 °C (X3 = +1)). The specific CO2 flow rate in run #7 was approximately half that of run #8, indicating that ethanol removal by CO2 stripping is favored by increasing the specific gas flow rate.
In run #13 (ϕCO2 = 2.5 vvm (X1 = 0), CE0 = 45.0 g L−1 (X2 = 0), and TSol = 35.0 °C (X3 = −1.68)), the values obtained were kE = 0.064 h−1 and kW = 0.0024 h−1. In comparison, run #14 (ϕCO2 = 2.5 vvm (X1 = 0), CE0 = 45.0 g L−1 (X2 = 0), and TSol = 45.0 °C (X3 = +1.68)) was carried out with a 10 °C increase in temperature, resulting in kE = 0.118 h−1 and kW = 0.004 h−1. This comparison indicates that increasing the solution temperature leads to higher ethanol removal rates.
Thus, increases in the specific CO2 flow rate and temperature enhanced the ethanol removal. Sonego et al. [28] reported similar effects of the CO2 flow rate and solution temperature on the values of kE and kW during ethanol stripping. Silva et al. [33] observed that higher CO2 flow rates resulted in greater fragmentation of the gas bubbles, which increased the interfacial area for mass transfer between gas and liquid. The effect of temperature on ethanol removal can be attributed to the fact that vapor pressure is highly temperature dependent, with higher temperatures promoting ethanol vaporization [28].

3.2. Experimental Design: Statistical Analysis and Mathematical Modeling

The results shown in Table 1 were used to evaluate the effects of the variables and obtain the regression coefficients for the polynomial models. These analyses were performed using Statistica v. 7.0 software, adopting a 90% confidence level.
The models that describe the removal rate constants for ethanol and water (kE and kW) as functions of the operational variables are given by Equations (14) and (15), respectively. Only statistically significant coefficients were included in the models; those p-values greater than 0.1 were excluded from the regression models.
kE (h−1) = 0.106656 + 0.023228·ϕCO2 − 0.007004·CE0 + 0.013094·Tsol + 0.012750·ϕCO2·Tsol
kW (h−1) = 0.003374 + 0.000559·ϕCO2 0.000711·CE0 + 0.000336·Tsol + 0.000338·ϕCO2 ·Tsol
An analysis of variance (ANOVA) was used to evaluate the significance of the adjusted models for both response variables (kE and kW). Since the calculated F values (11.88 for kE and 13.00 for kW) were greater than the tabular F value (2.48), the polynomial models are valid and reliable at a 90% confidence level.

3.3. Ethanol Fermentation by K. marxianus: Effect of Temperature

The effect of temperature on ethanol fermentation was analyzed in the range of 38 to 44 °C. As shown in Figure 1, increasing the temperature modified the profiles of sugar consumption, cell growth, and ethanol production.
Figure 1a shows that the substrate consumption profiles for the experiments carried out at 38 and 40 °C were similar over 9 h of fermentation. Fermentation at 38 °C resulted in slightly higher substrate consumption compared to 40 °C. This difference can be attributed to the higher initial cell concentration in the 38 °C fermentation (CX0 = 10.30 g L−1Figure 1c) compared to the experiment at 40 °C (CX0 = 9.55 g L−1). At 42 and 44 °C, however, the substrate uptake rate decreased, resulting in residual substrate levels of 16 and 49 g L−1, respectively, at the end of 9 h of fermentation.
The negative effect of temperatures of 42 and 44 °C on yeast growth was also evident in the ethanol production profile (Figure 1b). The ethanol concentrations obtained at the end of the fermentations were 74 g L−1 (38 °C), 72 g L−1 (40 °C), 67 g L−1 (42 °C), and 52 g L−1 (44 °C). The observed behavior in ethanol yield is associated with the increase in fermentation temperature. This effect was most pronounced at 44 °C (purple diamonds in Figure 1), which showed lower fermentation performance in the initial hours compared to other temperatures. The temperature of the medium is a key factor influencing ethanol fermentation, significantly impacting yeast physiology. High temperatures can destabilize the integrity of cellular structures and functions, thereby impairing the yeast’s fermentative capacity [40]. This reduction in capacity intensified during fermentation due to the combined negative effects of high temperature and the presence of ethanol. Ethanol accumulation in the broth can damage the yeast cell wall. Therefore, to carry out ethanol production at high temperatures, it is necessary to maintain adequate cultivation conditions to preserve the yeast’s fermentative capacity.
From the experimental data presented in Figure 1, the parameters of the fermentation process, namely, the cell yield coefficient, ethanol yield coefficient, volumetric ethanol productivity, and maximum specific cell growth rate (µmax), were calculated (Table 2).
From Table 2, it is observed that the values of the YX/S coefficient decreased as the temperature increased. The values of the YE/S coefficient were similar in the range of 38 to 44 °C, with a significant reduction in the fermentations at 44 °C. Additionally, the volumetric ethanol productivity decreased with increasing fermentation temperature, reaching the lowest value (PV = 5.83 ± 0.20 gE L−1 h−1) at a temperature of 44 °C. This behavior is consistent with the findings presented by Limtong, Sringiew, and Yongmanitchai [21], who observed similar effects when increasing the temperature from 37 to 40 °C during fermentation with K. marxianus DMKU3-1042, and Nuanpeng et al. [18], who reported similar results with thermotolerant S. cerevisiae DBKKU Y-53 in experiments at 30, 37, 40, 42, and 45 °C. For the maximum specific growth rate, a value of 0.14 h−1 was observed at 38 and 40 °C, while values of 0.097 and 0.087 h−1 were obtained at 42 and 44 °C, respectively. The data in Table 2 indicate that temperatures of 42 and 44 °C are not favorable for yeast growth. Conversely, a temperature of 40 °C appears to be optimal for high-temperature extractive fermentation with CO2 experiments.

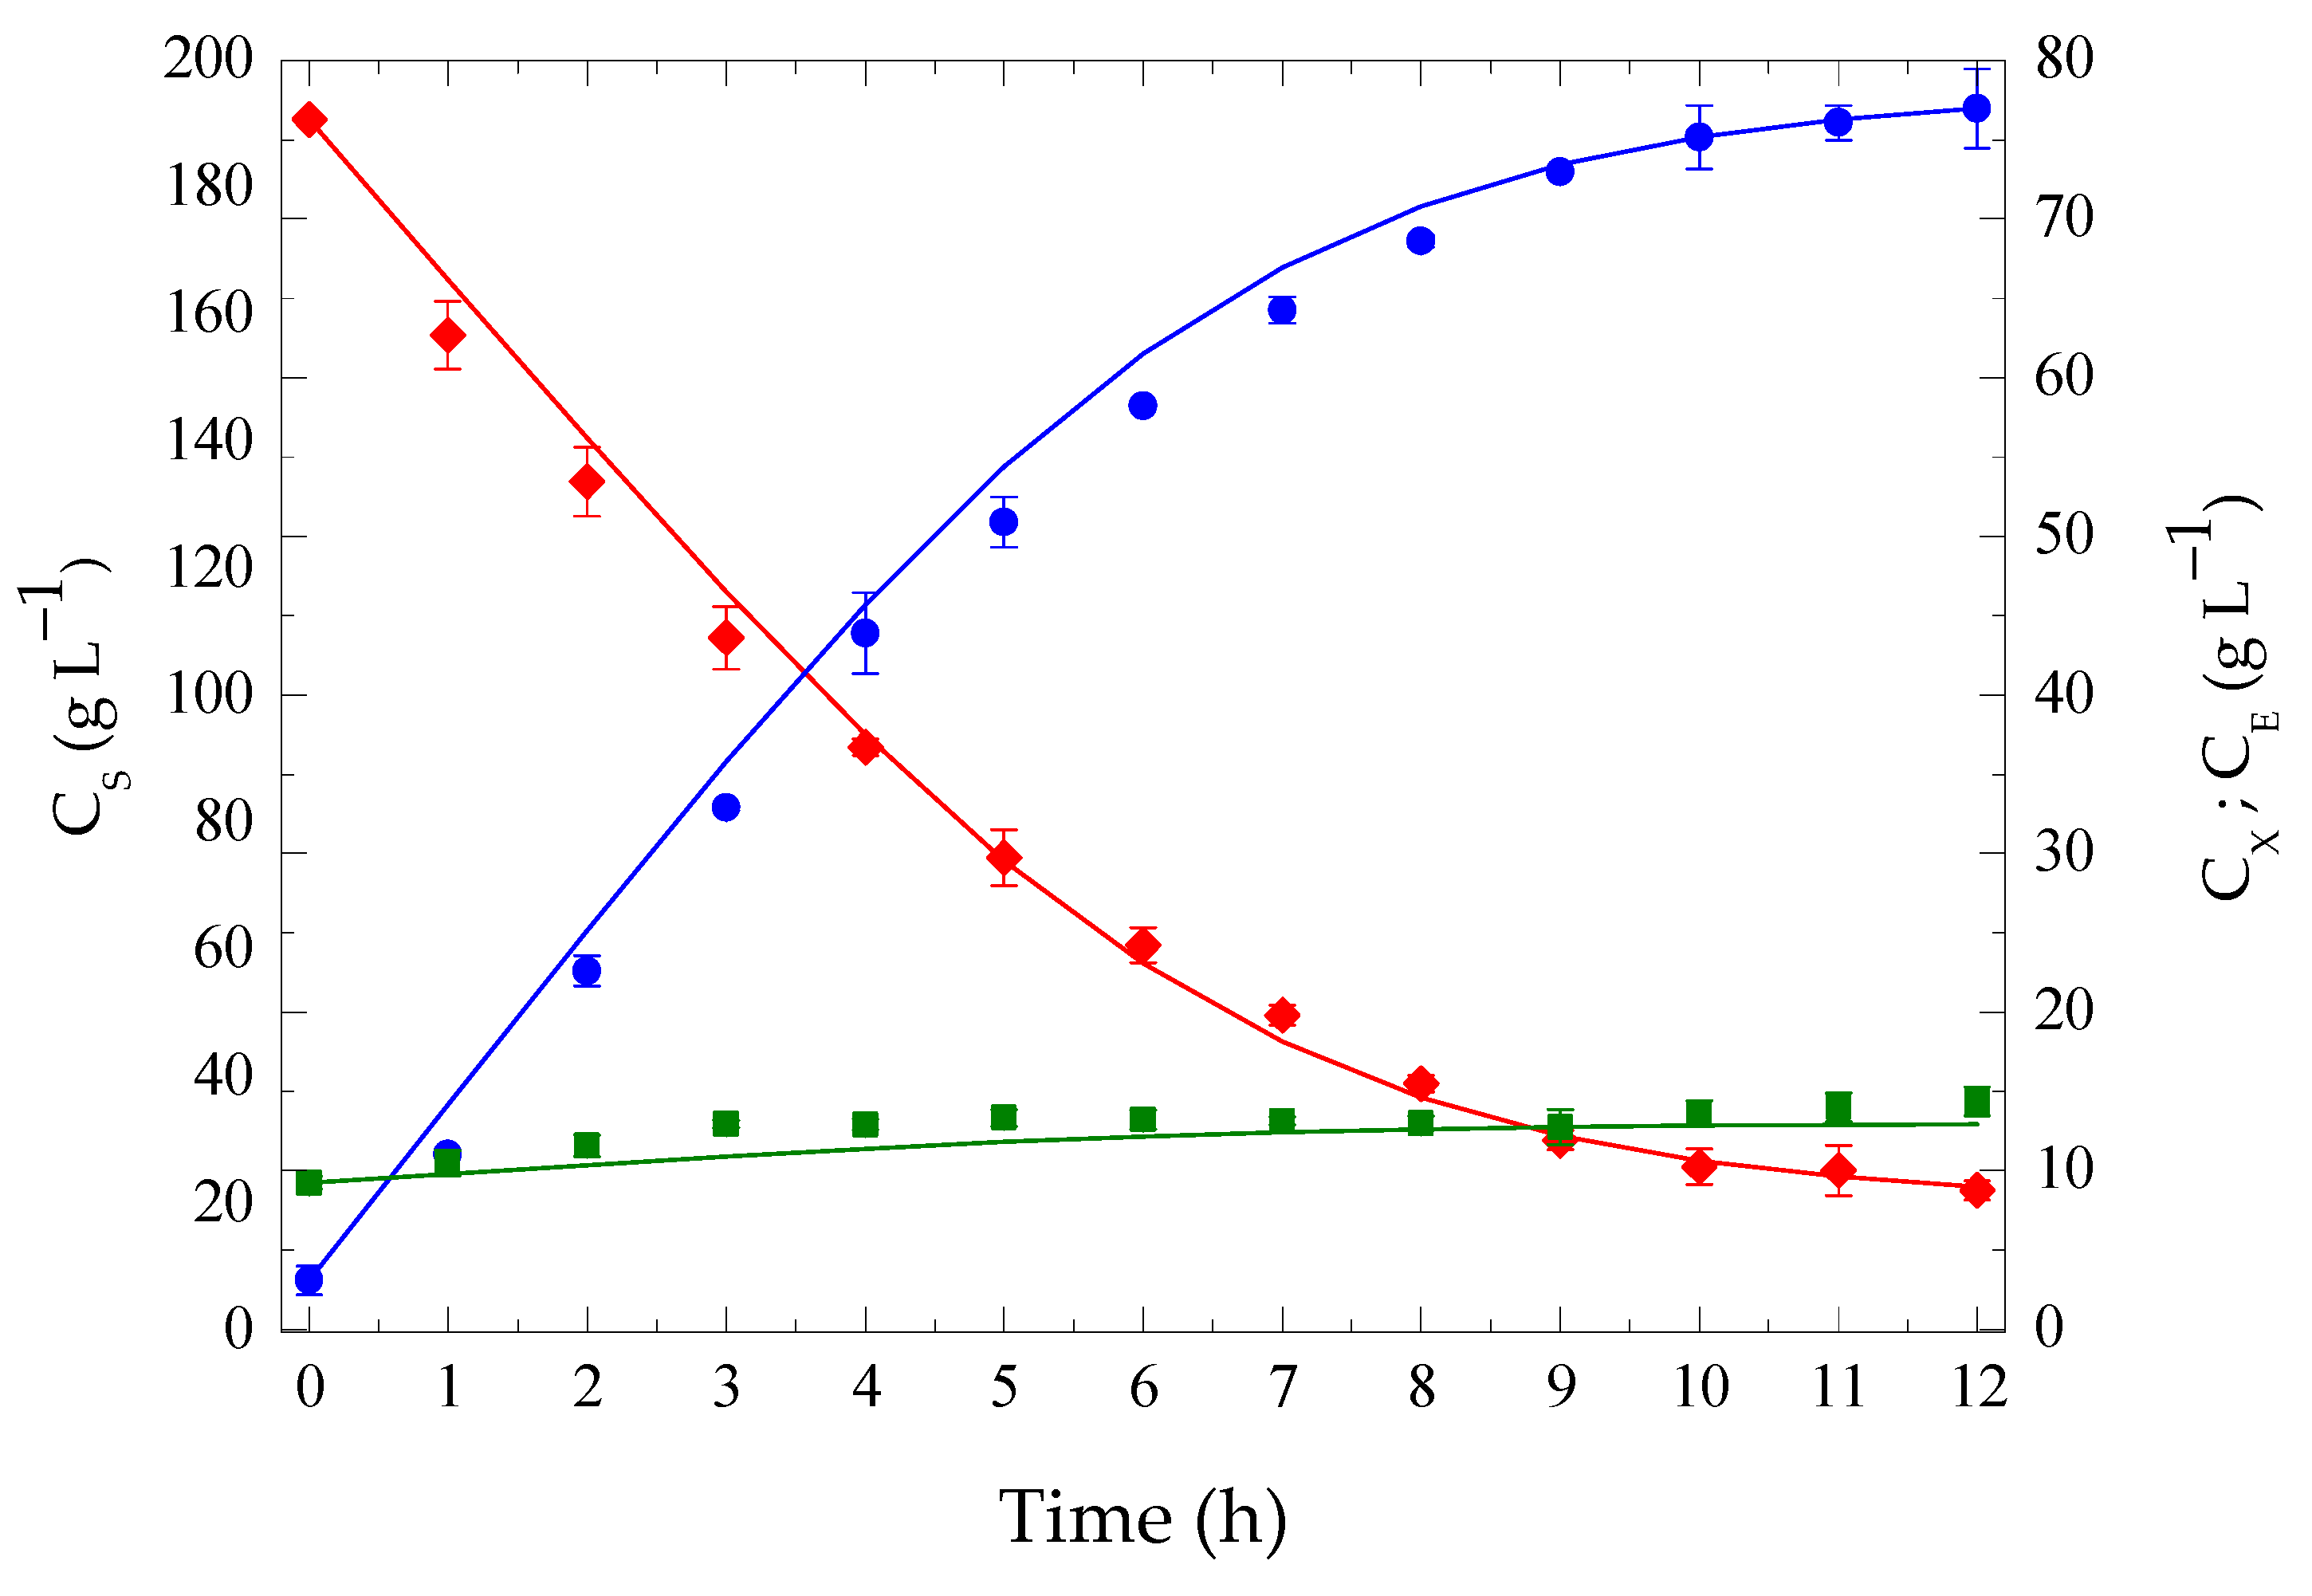
3.4. Conventional Batch Fermentation at High Temperature: Model Fitting

Conventional ethanol fermentation (CFHT) was carried out in the bioreactor at 40 °C. From the experimental data of the cell (CX), substrate (CS), and ethanol (CE) concentrations, the cell and ethanol yield coefficients (YX/S and YE/S) were calculated using Equations (8) and (9). The remaining kinetic parameters (μmax, KS, KIS, CEmax, and n) of the hybrid inhibition kinetic model were obtained by fitting the calculated values to the experimental data for CX, CS, and CE in the conventional batch ethanol fermentation with thermotolerant yeast, which was performed in duplicate. Table 3 shows the estimated values of these parameters for the conventional batch fermentation at high temperature.
The hybrid Andrews−Levenspiel model was found to be suitable for describing the kinetics of the conventional fermentation at high temperatures. A comparison of the calculated and experimental data for the cell (Cx), substrate (Cs), and ethanol (CE) concentrations during fermentation (Figure 2) shows that the model provided an excellent fit.
As shown in the conventional high-temperature fermentation (Figure 1), the sugars were not totally consumed, resulting in 22.14 g L−1 of residual sugars after 12 h. This outcome suggests that while the yeast K. marxianus exhibits thermotolerance (growth at 40 °C), it is also sensitive to ethanol. For the evaluated strain, a strong inhibition effect by ethanol was observed at ethanol concentrations exceeding 70.0 g L−1 in the broth.

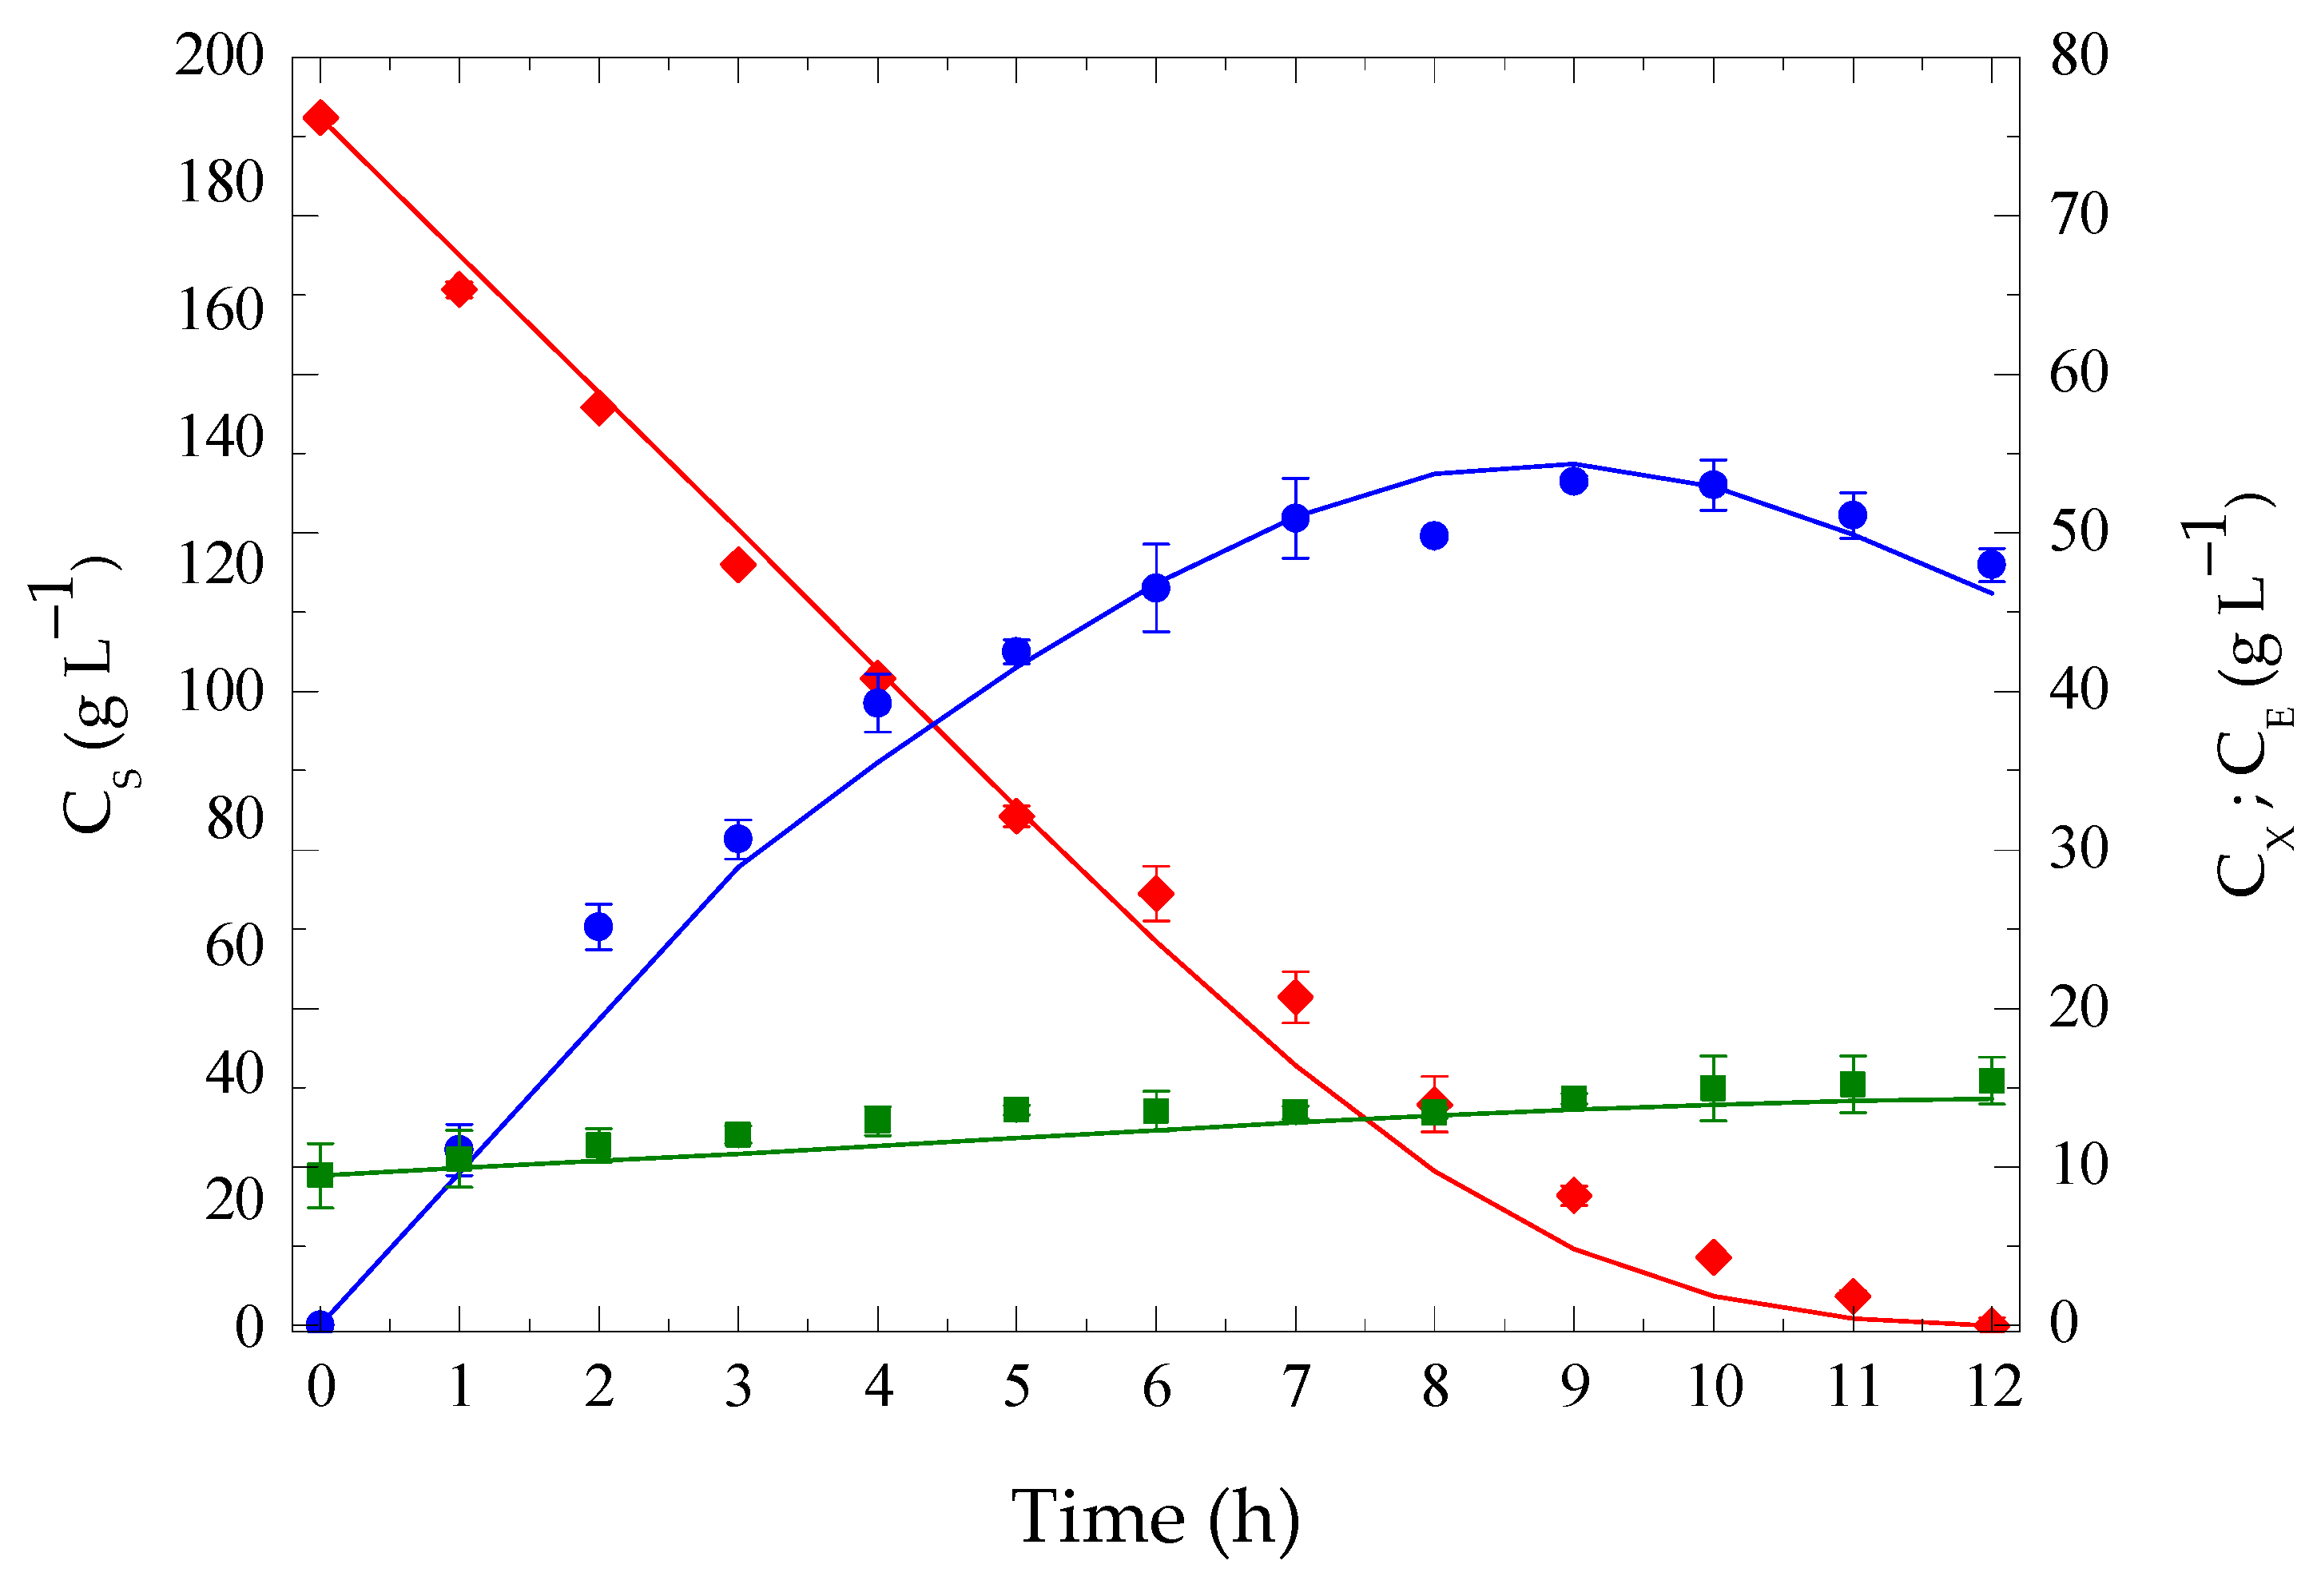
3.5. Extractive Batch Ethanol Fermentation

Fermentations were carried out to evaluate the effect of ethanol extraction by CO2 stripping on the dynamics of high-temperature fermentation with thermotolerant K. marxianus. The stripping parameters (kE and kW) were obtained from the experimental design and Equations (14) and (15). For the range of the specific CO2 flow rates (ϕ) used in the extractive ethanol fermentation, the stripping parameters values were as follows:
EFHT1: ϕ = 1.0 vvm, kE = 0.055 h−1, and kW = 0.0034 h−1
EFHT2: ϕ = 1.5 vvm, kE = 0.068 h−1, and kW = 0.0037 h−1
EFHT3: ϕ = 2.5 vvm; kE = 0.094 h−1, and kW = 0.0043 h−1
The stripping parameter values, the extractive batch fermentation model (Equations (10)–(13)), and the kinetic parameter values from Table 3 were used for computational simulations to assess the effect of ethanol removal.
The effects of high temperature were evaluated in extractive fermentations with CO2 stripping performed with an initial substrate concentration of approximately 190 g L−1 at 40.0 °C, with ethanol stripping by CO2 initiated after 3 h of fermentation, as described by [35].
Figure 3, Figure 4 and Figure 5 compare the simulated (lines) and experimental (symbols) values for extractive fermentation with CO2 stripping using thermotolerant yeast. The data reveal that the behavior of the extractive fermentations differed from that of conventional fermentation (Figure 2). Moreover, the proposed model accurately predicted the behavior of extractive fermentation at high temperatures.
From Figure 3, it can be observed that nearly complete substrate consumption was achieved, with only 0.96 g L−1 residual substrate remaining after 12 h of fermentation. The maximum ethanol concentration in the fermentation broth reached 66.44 g L−1, resulting in an ethanol productivity of 7.10 g L−1 h−1 (see Table 4).
According to Figure 4, the substrate was completely consumed after 12 h of fermentation, resulting in a maximum ethanol concentration in the fermentation broth of 62.12 g L−1 and an ethanol productivity of 7.01 g L−1 h−1 (Table 4).
From Figure 5, it can be observed that the substrate was totally consumed at 12 h of fermentation, resulting in a maximum ethanol concentration of 53.26 g L−1 in the fermentation broth. Under this condition, the ethanol productivity was 6.99 g L−1 h−1 (Table 4).
The application of extractive fermentation with CO2 stripping to remove part of the ethanol produced led to an increase in the substrate uptake rate in all experiments. As a result, total substrate consumption was achieved in the high-temperature fermentations (CFHT) compared to conventional assays. This approach also allowed for a notable increase in productivity.
The maximum ethanol concentrations obtained in the broth for extractive fermentations with CO2 stripping at high temperature were 66.44 (EFHT1), 62.12 (EFHT2), and 53.26 g L−1 (EFHT3). These values are lower than the maximum concentration of 76.89 g L−1 obtained in conventional fermentation. This indicates substantial removal of the ethanol due to gas stripping. In conventional fermentations at high temperature, the ethanol concentration increased up to 12 h of fermentation. However, in experiments EFHT2 and EFHT3, the ethanol concentration began to decrease in the final hours due to the continuous removal of ethanol by CO2 stripping and the substrate exhaustion in the broth. Sonego et al. [28] observed similar behavior in the ethanol concentration in extractive fermentations with CO2 stripping using the commercial yeast Saccharomyces cerevisiae at 34 °C with a specific CO2 flow rate of 2.0 and 2.5 vvm, respectively.
In the extractive fermentations with CO2 stripping conducted with K. marxianus at 40 °C, significant ethanol removal by stripping was achieved using a CO2 flow rate of 1.0 vvm (Figure 3; EFHT1). At this flow rate, complete substrate consumption was found by the end of 12 h of fermentation. This result highlights the positive effect of temperature on ethanol entrainment, as demonstrated by the removal rate constants (kE and kW) presented in Table 1.
Integrating the CO2 stripping technique with the high-temperature fermentation (T = 40 °C) allowed for improved process efficiency with a lower gas flow rate. This is advantageous, especially for industrial-scale applications, as it can reduce equipment costs related to the CO2 feed. Additionally, CO2 stripping helps manage the fermentation temperature by removing the heat generated during the process. According to Almeida et al. [8] and Campos et al. [6], the stripping process removes the heat from the fermentation broth, allowing a low CO2 flow rate to maintain the fermentation temperature without causing excessive cooling of the medium.
Therefore, studies on the production through extractive fermentation with CO2 stripping using thermotolerant yeast and ethanol removal by stripping are an alternative for the ethanol sector, particularly in tropical regions. Additionally, CO2 used as a carrying gas can be provided directly from the distillery, potentially at no additional cost.

4. Conclusions

Experiments were carried out using a two-level Central Composite Rotational Design (CCRD) to evaluate the influence of three operational variables on the performance of the ethanol stripping process: specific CO2 flow rate, solution temperature, and initial ethanol concentration on ethanol removal by CO2 stripping. The results indicate that increasing the specific CO2 flow rate and the solution temperature lead to higher ethanol removal rates. The hybrid Andrews−Levenspiel kinetic model provided an excellent fit to the experimental conventional fermentation at high temperature data. The model proposed for extractive fermentation with CO2 stripping was able to provide a satisfactory description of the behavior of extractive batch fermentation at high temperature with ethanol stripping by CO2. The extractive ethanol fermentation performed with the thermotolerant K. marxianus showed that significant ethanol removal by CO2 stripping was achieved using a low gas flow rate (1.0 vvm; EFHT1). Thus, the extractive fermentation with CO2 stripping at high temperature provides a more attractive process for industrial application, especially in tropical climate regions.

Author Contributions

Conceptualization, J.L.S.S., A.J.G.C. and A.C.B.; software, J.L.S.S., N.S.d.V. and A.J.G.C.; validation, J.L.S.S., J.M.d.M., N.S.d.V. and R.G.d.S.C.; formal analysis, J.L.S.S., J.M.d.M. and R.G.d.S.C.; investigation, J.L.S.S., J.M.d.M., N.S.d.V. and R.G.d.S.C.; resources, A.F.d.C., A.J.G.C. and A.C.B.; writing—original draft preparation, J.L.S.S.; writing—review and editing, J.L.S.S., A.J.G.C. and A.C.B.; visualization, J.L.S.S., A.J.G.C. and A.C.B.; supervision, A.J.G.C. and A.C.B.; project administration, A.C.B.; funding acquisition, A.J.G.C. and A.C.B. All authors have read and agreed to the published version of the manuscript.

Funding

The authors acknowledge the Brazilian Coordination for the Improvement of Higher Education Personnel (CAPES, Finance Code 001), the São Paulo Research Foundation (FAPESP, grant number 2012/50046-4), and the National Council for Scientific and Technological Development (CNPq, grant numbers 309728/2021-5 and 305919/2021-0) for the financial support of this work.

Institutional Review Board Statement

Not applicable.

Informed Consent Statement

Not applicable.

Data Availability Statement

The original contributions presented in the study are included in the article. Further inquiries can be directed to the corresponding author.

Conflicts of Interest

The authors declare no conflicts of interest.

References

  1. Vandenberghe, L.P.S.; Valladares-Diestra, K.K.; Bittencourt, G.A.; Zevallos Torres, L.A.; Vieira, S.; Karp, S.G.; Sydney, E.B.; de Carvalho, J.C.; Thomaz Soccol, V.; Soccol, C.R. Beyond sugar and ethanol: The future of sugarcane biorefineries in Brazil. Renew. Sustain. Energy Rev. 2022, 167, 112721. [Google Scholar] [CrossRef]
  2. Müller, C.; Scapini, T.; Rempel, A.; Abaide, E.R.; Camargo, A.F.; Nazari, M.T.; Tadioto, V.; Bonatto, C.; Tres, M.V.; Zabot, G.L.; et al. Challenges and opportunities for third-generation ethanol production: A critical review. Eng. Microbiol. 2023, 3, 100056. [Google Scholar] [CrossRef]
  3. Madeira, J.V., Jr.; Gombert, A.K. Towards high-temperature fuel ethanol production using Kluyveromyces marxianus: On the search for plug-in strains for the Brazilian sugarcane-based biorefinery. Biomass Bioenergy 2018, 119, 217–228. [Google Scholar] [CrossRef]
  4. Lopes, M.L.; Paulillo, S.C.d.L.; Godoy, A.; Cherubin, R.A.; Lorenzi, M.S.; Giometti, F.H.C.; Bernardino, C.D.; de Amorim Neto, H.B.; de Amorim, H.V. Ethanol production in Brazil: A bridge between science and industry. Braz. J. Microbiol. 2016, 47, 64–76. [Google Scholar] [CrossRef] [PubMed]
  5. Silva, E.H.; Lemos, D.A.; Cruz, A.J.G.; Badino, A.C.; Silva, R.G.; Soneno, J.L.S. Bioethanol Production Using Mixtures of Sorghum Juice and Sugarcane Molasses: Experimental Data and Kinetic Modeling. Sugar Tech 2024, 26, 799–808. [Google Scholar] [CrossRef]
  6. Campos, B.G.; Veloso, I.I.K.; Ribeiro, M.P.A.; Badino, A.C.; Cruz, A.J.G. Thermal analysis of extractive fed-batch ethanol fermentation with CO2 stripping: Modeling and simulation. Chem. Eng. Process.-Process Intensif. 2022, 182, 109185. [Google Scholar] [CrossRef]
  7. Zentou, H.; Abidin, Z.Z.; Yunus, R.; Biak, D.R.A.; Korelskiy, D. Overview of Alternative Ethanol Removal Techniques for Enhancing Bioethanol Recovery from Fermentation Broth. Processes 2019, 7, 458. [Google Scholar] [CrossRef]
  8. Almeida, L.P.; Silva, C.R.; Martins, T.B.; Pereira, R.D.; Esperança, M.N.; Cruz, A.J.G.; Badino, A.C. Heat transfer evaluation for conventional and extractive ethanol fermentations: Saving cooling water. J. Clean. Prod. 2021, 304, 127063. [Google Scholar] [CrossRef]
  9. Basso, L.; Basso, T.; Rocha, S. Ethanol production in Brazil: The industrial process and its impact on yeast fermentation. Biofuel Prod.-Recent Dev. Prospect. 2011, 1530, 85–100. [Google Scholar]
  10. Godoy, A.; Amorim, H.V.; Lopex, M.L.; Oliveira, A.J. Continuous and batch fermentation processes: Advantages and disadvantages of these processes in the Brazilian ethanol production. Int. Sugar J. 2008, 110, 175–181. [Google Scholar]
  11. Wheals, A.E.; Basso, L.C.; Alves, D.M.G.; Amorim, H.V. Fuel ethanol after 25 years. Trends Biotechnol. 1999, 17, 482–487. [Google Scholar] [CrossRef] [PubMed]
  12. Amorim, H.V.; Lopes, M.L.; de Castro Oliveira, J.V.; Buckeridge, M.S.; Goldman, G.H. Scientific challenges of bioethanol production in Brazil. Appl. Microbiol. Biotechnol. 2011, 91, 1267–1275. [Google Scholar] [CrossRef]
  13. Banat, I.M.; Nigam, P.; Singh, D.; Marchant, R.; McHale, A.P. Review: Ethanol production at elevated temperatures and alcohol concentrations: Part I—Yeasts in general. World J. Microbiol. Biotechnol. 1998, 14, 809–821. [Google Scholar] [CrossRef]
  14. Paulino de Souza, J.; Dias do Prado, C.; Eleutherio, E.C.A.; Bonatto, D.; Malavazi, I.; Ferreira da Cunha, A. Improvement of Brazilian bioethanol production—Challenges and perspectives on the identification and genetic modification of new strains of Saccharomyces cerevisiae yeasts isolated during ethanol process. Fungal Biol. 2018, 122, 583–591. [Google Scholar] [CrossRef]
  15. Prado, C.D.; Mandrujano, G.P.L.; Souza, J.P.; Sgobbi, F.B.; Novaes, H.R.; da Silva, J.P.M.O.; Alves, M.H.R.; Eliodório, K.P.; Cunha, G.C.G.; Giudici, R.; et al. Physiological characterization of a new thermotolerant yeast strain isolated during Brazilian ethanol production, and its application in high-temperature fermentation. Biotechnol. Biofuels 2020, 13, 178. [Google Scholar] [CrossRef] [PubMed]
  16. Kumar, S.; Dheeran, P.; Singh, S.P.; Mishra, I.M.; Adhikari, D.K. Cooling System Economy in Ethanol Production Using Thermotolerant Yeast Kluyveromyces Sp. IIPE453. Am. J. Microbiol. Res. 2013, 1, 39–44. [Google Scholar] [CrossRef]
  17. Eiadpum, A.; Limtong, S.; Phisalaphong, M. High-temperature ethanol fermentation by immobilized coculture of Kluyveromyces marxianus and Saccharomyces cerevisiae. J. Biosci. Bioeng. 2012, 114, 325–329. [Google Scholar] [CrossRef]
  18. Nuanpeng, S.; Thanonkeo, S.; Yamada, M.; Thanonkeo, P. Ethanol production from sweet sorghum juice at high temperatures using a newly isolated thermotolerant yeast Saccharomyces cerevisiae DBKKU Y-53. Energies 2016, 9, 253. [Google Scholar] [CrossRef]
  19. Gough, S.; Flynn, O.; Hack, C.J.; Marchant, R. Fermentation of molasses using a thermotolerant yeast Kluyveromyces marxianus IMB3: Simplex optimisation of media supplements. Appl. Microbiol. Biotechnol. 1996, 46, 187–190. [Google Scholar] [CrossRef]
  20. Abdel-Fattah, W.R.; Fadil, M.; Nigam, P.; Banat, I.M. Isolation of thermotolerant ethanologenic yeasts and use of selected strains in industrial scale fermentation in an Egyptian distillery. Biotechnol. Bioeng. 2000, 68, 531–535. [Google Scholar] [CrossRef]
  21. Limtong, S.; Sringiew, C.; Yongmanitchai, W. Production of fuel ethanol at high temperature from sugar cane juice by a newly isolated Kluyveromyces marxianus. Bioresour. Technol. 2007, 98, 3367–3374. [Google Scholar] [CrossRef]
  22. Pang, Z.-W.; Liang, J.-J.; Qin, X.-J.; Wang, J.-R.; Feng, J.-X.; Huang, R.-B. Multiple induced mutagenesis for improvement of ethanol production by Kluyveromyces marxianus. Biotechnol. Lett. 2010, 32, 1847–1851. [Google Scholar] [CrossRef]
  23. Kumar, S.; Dheeran, P.; Singh, S.P.; Mishra, I.M.; Adhikari, D.K. Kinetic studies of ethanol fermentation using Kluyveromyces sp. IIPE453. J. Chem. Technol. Biotechnol. 2013, 88, 1874–1884. [Google Scholar] [CrossRef]
  24. Radecka, D.; Mukherjee, V.; Mateo, R.Q.; Stojiljkovic, M.; Foulquié-Moreno, M.R.; Thevelein, J.M. Looking beyond Saccharomyces: The potential of non-conventional yeast species for desirable traits in bioethanol fermentation. FEMS Yeast Res. 2015, 15, fov053. [Google Scholar] [CrossRef]
  25. Nonklang, S.; Abdel-Banat, B.M.A.; Cha-aim, K.; Moonjai, N.; Hoshida, H.; Limtong, S.; Yamada, M.; Akada, R. High-temperature ethanol fermentation and transformation with linear DNA in the thermotolerant yeast Kluyveromyces marxianus DMKU3-1042. Appl. Environ. Microbiol. 2008, 74, 7514–7521. [Google Scholar] [CrossRef] [PubMed]
  26. Park, C.-H.; Geng, Q. Simultaneous Fermentation and Separation in the Ethanol and ABE Fermentation. Sep. Purif. Rev. 1992, 21, 127–174. [Google Scholar] [CrossRef]
  27. Lu, C.; Zhao, J.; Yang, S.-T.; Wei, D. Fed-batch fermentation for n-butanol production from cassava bagasse hydrolysate in a fibrous bed bioreactor with continuous gas stripping. Bioresour. Technol. 2012, 104, 380–387. [Google Scholar] [CrossRef] [PubMed]
  28. Sonego, J.L.S.; Lemos, D.A.; Rodriguez, G.Y.; Cruz, A.J.G.; Badino, A.C. Extractive Batch Fermentation with CO2 Stripping for Ethanol Production in a Bubble Column Bioreactor: Experimental and Modeling. Energy Fuels 2014, 28, 7552–7559. [Google Scholar] [CrossRef]
  29. Sonego, J.L.S.; Lemos, D.A.; Pinto, C.E.M.; Cruz, A.J.G.; Badino, A.C. Extractive Fed-Batch Ethanol Fermentation with CO2 Stripping in a Bubble Column Bioreactor: Experiment and Modeling. Energy Fuels 2016, 30, 748–757. [Google Scholar] [CrossRef]
  30. Albers, E.; Larsson, C.; Lidén, G.; Niklasson, C.; Gustafsson, L. Continuous estimation of product concentration with calorimetry and gas analysis during anaerobic fermentations of Saccharomyces cerevisiae. Thermochim. Acta 2002, 394, 185–190. [Google Scholar] [CrossRef]
  31. Rivera, E.C.; Costa, A.C.; Atala, D.I.P.; Maugeri, F.; Maciel, M.R.W.; Filho, R.M. Evaluation of optimization techniques for parameter estimation: Application to ethanol fermentation considering the effect of temperature. Process Biochem. 2006, 41, 1682–1687. [Google Scholar] [CrossRef]
  32. Pham, C.B.; Motoki, M.; Matsumura, M.; Kataoka, H. Simultaneous ethanol fermentation and stripping process coupled with rectification. J. Ferment. Bioeng. 1989, 68, 25–31. [Google Scholar] [CrossRef]
  33. Silva, C.R.; Esperança, M.N.; Cruz, A.J.G.; Moura, L.F.; Badino, A.C. Stripping of ethanol with CO2 in bubble columns: Effects of operating conditions and modeling. Chem. Eng. Res. Des. 2015, 102, 150–160. [Google Scholar] [CrossRef]
  34. Rodrigues, M.I.; Iemma, A.F. Experimental Design and Process Optimization; CRC Press: Boca Raton, FL, USA, 2014. [Google Scholar] [CrossRef]
  35. Ezeji, T.C.; Karcher, P.M.; Qureshi, N.; Blaschek, H.P. Improving performance of a gas stripping-based recovery system to remove butanol from Clostridium beijerinckii fermentation. Bioprocess Biosyst. Eng. 2005, 27, 207–214. [Google Scholar] [CrossRef]
  36. de Vrije, T.; Budde, M.; van der Wal, H.; Claassen, P.A.; López-Contreras, A.M. “In situ” removal of isopropanol, butanol and ethanol from fermentation broth by gas stripping. Bioresour. Technol. 2013, 137, 153–159. [Google Scholar] [CrossRef] [PubMed]
  37. Truong, K.N.; Blackburn, J.W. The stripping of organic chemicals in biological treatment processes. Environ. Prog. 1984, 3, 143–152. [Google Scholar] [CrossRef]
  38. Andrews, J.F. A mathematical model for the continuous culture of microorganisms utilizing inhibitory substrates. Biotechnol. Bioeng. 1968, 10, 707–723. [Google Scholar] [CrossRef]
  39. Levenspiel, O. The Monod equation: A revisit and a generalization to product inhibition situations. Biotechnol. Bioeng. 1980, 22, 1671–1687. [Google Scholar] [CrossRef]
  40. Eigenfeld, M.; Kerpes, R.; Becker, T. Understanding the Impact of Industrial Stress Conditions on Replicative Aging in Saccharomyces cerevisiae. Front. Fungal Biol. 2021, 2, 665490. [Google Scholar] [CrossRef]
Figure 1. Batch ethanol fermentations with thermotolerant K. marxianus at temperatures of 38 °C (blue squares), 40 °C (orange circles), 42 °C (green triangles), and 44 °C (purple diamonds). (a) Substrate concentration, (b) ethanol concentration, and (c) cell concentration. Error bars correspond to standard deviation.
Fermentation 11 00270 g001aFermentation 11 00270 g001b
Figure 2. Comparative plots of simulated (line) and experimental data for cell concentration (CX: green squares), substrate concentration (CS: red diamonds), and ethanol concentration (CE: blue circles) in the conventional batch fermentation at high temperature (CFHT). Error bars correspond to standard deviation.
Fermentation 11 00270 g002
Figure 3. Comparative plots of simulated (line) and experimental data for cell concentration (CX: green squares), substrate concentration (CS: red diamonds), and ethanol concentration (CE: blue circles) in the extractive batch fermentation at high temperature with stripping started after 3 h (CE = 35.72 g L−1) and specific CO2 flow rate of 1.0 vvm (EFHT1). Error bars correspond to standard deviation.
Fermentation 11 00270 g003
Figure 4. Comparative plots of simulated (line) and experimental data for cell concentration (CX: green squares), substrate concentration (CS: red diamonds), and ethanol concentration (CE: blue circles) in the extractive batch fermentation at high temperature with stripping started after 3 h (CE = 32.56 g L−1) and specific CO2 flow rate of 1.5 vvm (EFHT2). Error bars correspond to standard deviation.
Fermentation 11 00270 g004
Figure 5. Comparative plots of simulated (lines) and experimental data for cell concentration (CX: green squares), substrate concentration (CS: red diamonds), and ethanol concentration (CE: blue circles) in the extractive batch fermentation at high temperature with stripping started after 3 h (CE = 30.66 g L−1) and specific CO2 flow rate of 2.5 vvm (EFHT3). Error bars correspond to standard deviation.
Fermentation 11 00270 g005
Table 1. Matrix of CCRD and results for response variables.
RunIndependent VariablesResponse Variables
X1X2X3kE (h−1)kW (h−1)
1−1 (1.61)−1 (36.1)−1 (37.1)0.0840.0024
2+1 (3.39)−1 (36.1)−1 (37.1)0.1060.0028
3−1 (1.61)+1 (53.9)−1 (37.1)0.0840.0037
4+1 (3.39)+1 (53.9)−1 (37.1)0.0830.0035
5−1 (1.61)−1 (36.1)+1 (43.0)0.0760.0022
6+1 (3.39)−1 (36.1)+1 (43.0)0.1290.0032
7−1 (1.61)+1 (53.9)+1 (43.0)0.0850.0035
8+1 (3.39)+1 (53.9)+1 (43.0)0.1550.0054
9−1.68 (1.0)0 (45.0)0 (40.0)0.0440.0017
10+1.68 (4.0)0 (45.0)0 (40.0)0.1470.0044
110 (2.5)−1.68 (30.0)0 (40.0)0.0810.0019
120 (2.5)+1.68 (60.0)0 (40.0)0.0910.0044
130 (2.5)0 (45.0)−1.68 (35.0)0.0640.0024
140 (2.5)0 (45.0)+1.68 (45.0)0.1180.004
150 (2.5)0 (45.0)0 (40.0)0.1280.0042
160 (2.5)0 (45.0)0 (40.0)0.1230.0039
170 (2.5)0 (45.0)0 (40.0)0.1190.0037
X1: specific CO2 flow rate (ϕCO2), X2: initial ethanol concentration (CE0), and X3: solution temperature (Tsol).
Table 2. Cell and ethanol yield coefficients, ethanol productivity, and maximum specific cell growth rate obtained in the fermentations using thermotolerant K. marxianus at temperatures of 38, 40, 42, and 44 °C.
ParameterTemperature (°C)
38404244
YX/S (gx gs−1)0.032 ± 0.0031 a0.030 ± 0.0002 a0.023 ± 0.0004 ab0.019 ± 0.0041 b
YE/S (gE gs−1)0.38 ± 0.003 a0.39 ± 0.004 a0.38 ± 0.01 a0.34 ± 0.02 b
PV (gE L−1 h−1)8.26 ± 0.13 a7.96 ± 0.40 ab7.46 ± 0.30 b5.83 ± 0.20 c
µmax (h−1)0.14 ± 0.02 a0.14 ± 0.003 a0.097 ± 0.001 a0.087 ± 0.001 a
The superscript lowercase letters represent the Tukey test for multiple comparisons among columns (p < 0.05) of each temperature (38, 40, 42, and 44 °C).
Table 3. Values of the cell and ethanol yield coefficients and kinetic parameters for the hybrid Andrews−Levenspiel model of the batch ethanol fermentations at high temperature.
Yield CoefficientValue *
YX/S (gX gS−1)0.022 ± 0.003
YE/S (gE gS−1)0.44 ± 0.02
ParameterValue *
μmax (h−1)0.177 ± 0.014
KS (g L−1)33.45 ± 5.8
KIS (g L−1)94.60 ± 3.2
CEmax (g L−1)77.93 ± 0.60
n (-)0.62 ± 0.12
* Mean and standard deviation.
Table 4. Comparison between conventional (CFHT) and extractive (EFHT) fermentations performed with thermotolerant K. marxianus.
VariableUnitFermentation
CFHTEFHT1EFHT2EFHT3
CS0g L−1190.70193.82192.12190.53
CSfg L−122.140.960.00.0
Maximum CE in the brothg L−176.8966.4462.1253.26
Final CE in the fermentation brothg L−176.8964.8757.4847.98
Total CEf at the end of fermentationg L−176.8984.86 184.48 183.83 1
Ethanol volumetric productivity (PE)g L−1 h−16.41 27.10 27.04 26.99 2
1 Calculated considering CS0 for each fermentation and YE/S = 0.454 gE gS−1  ( C E f = C S 0 . Y E / S ). 2 Calculated based on CEf at the end of fermentation and on fermentation time ( P E = C E / t ) .
Disclaimer/Publisher’s Note: The statements, opinions and data contained in all publications are solely those of the individual author(s) and contributor(s) and not of MDPI and/or the editor(s). MDPI and/or the editor(s) disclaim responsibility for any injury to people or property resulting from any ideas, methods, instructions or products referred to in the content.

