Abstract
The aim of this work is to study the metabolism of Actinobacillus succinogenes in greater detail with the aim of optimizing succinate production and creating a metabolic model. The inhibitory properties of various substances were first investigated. It was found that the nature and availability of the gas can have a strong influence on metabolism. By studying the effects of different gas sources, it was found that when A. succinogenes lacks a CO2 source, the metabolism completely switches to the C3 pathway. This also completely changes the path within the pathway. In the presence of CO2, significantly more formate (2.44 ± 0.04 g L−1) and significantly less acetate (1.63 ± 0.03 g L−1) was produced. In contrast, in the absence of CO2, the formate concentration was 1.94 ± 0.12 g L−1, and the acetate concentration was 2.73 ± 0.15 g L−1. In addition, larger amounts of ethanol (1.34 ± 0.28 g L−1) were produced in the absence of CO2, whereas hardly any ethanol was produced otherwise. All these results show that, in the absence of a CO2 source, the organism has to regenerate much more NADH to NAD+ via the C3 pathway. In the subsequent investigation of the CO2 source, an increase in product concentration from 1.55 ± 0.13 g L−1 to 6.11 ± 0.09 g L−1 was achieved by combining gaseous CO2 with NaHCO3. It was shown that a microaerobic environment is not sufficient to influence the metabolism of the organism towards lactate formation. Using the model, it was possible to verify the main metabolic pathways observed during experimental bioreactor runs on a 2-L scale. By conducting further modification, it is now possible to use the model to predict the effects of an external electron supply on the redox metabolism.
1. Introduction
1.1. Microbial Succinate Production
In evaluating the viability of an organism for succinate production, the final product concentration is frequently the primary consideration. However, this approach overlooks crucial factors such as fermentation time and substrate utilization. Consequently, the succinate yield, defined as the efficiency of substrate conversion into the target product, is a pivotal parameter that incorporates substrate consumption for by-products and biomass. The theoretical yield of succinate from glucose in A. succinogenes is 1.12 g·g−1. However, productivity, defined as the amount of succinate produced per hour and liter, is also a crucial parameter. It is also important to consider the potential inhibitory effects of high substrate concentrations. Table 1 provides a summary of these parameters for a range of succinate producers, including natural and genetically modified organisms, from batch processes [1]. Moreover, the majority of the organisms listed are natural succinate producers. Only E. coli and S. cerevisiae were genetically modified to secrete larger quantities of succinate. Only batch processes were selected to enable better comparability with the experiments carried out in this study [2,3]. The highest product concentration of 52.7 g L−1 was achieved with A. succinogenes. This was also due to the high substrate concentration of 84.6 g L−1 glucose. The highest yield of 0.62 g·g−1 reported here was achieved at a lower glucose concentration of 70 g L−1 and was therefore within the range of B. succiniciproducens, which is already in commercial use. However, the productivity of 1.00 g L−1 h−1 achieved with A. succinogenes was significantly lower compared to A. succiniciproducens or M. succiniciproducens [4]. It can be assumed that a significant increase in productivity could still be achieved by optimizing the process control. It can be seen that A. succinogenes offers good starting conditions for the production of succinate. However, there is still room for optimization in process control that could enable higher yield and productivity, and, in this study, this is achieved by investigating metabolism and increasing electron availability.

Table 1.
Comparison of the performance criteria of different succinate-producing microorganisms.
1.2. Metabolic Modeling Approaches
Understanding the metabolism of A. succinogenes is essential to identify opportunities for optimization. Glucose as a substrate can be degraded to glyceraldehyde-3-phosphate (G3P) via glycolysis or the pentose phosphate pathway (PPP). This is followed by the conversion of G3P to phosphoenolpyruvate (PEP), which provides a reduction equivalent in the form of NADH. In contrast to glycolysis, another NADH is regenerated in the oxidative part of the PPP [10]. From PEP, metabolism can continue in the C3 and C4 or tricarboxylic acid (TCA) cycles. The C4 metabolic pathway has succinate as the final product, and, in the C3 metabolic pathway, acetate, ethanol, formate and lactate can be produced [11]. An overview of the individual metabolic steps described here can be seen in Figure 1. In the C4 pathway, PEP is converted to succinate via Oxaloacetate (OAA), which is often regarded as the critical point in succinate production. It breaks down CO2 into PEP and gains ATP in the process [10,12]. The step to OAA is catalyzed by the enzyme phosphoenolpyruvatecarboxykinase (PPCK). OAA is reduced to malate by malate dehydrogenase (MDH), which in turn is dehydrated to fumarate by fumarase (FUM) and finally reduced to succinate via (FRD2) [12]. The C3 pathway begins with the pyruvate kinase (PYK) reaction, which produces pyruvate and ATP. From pyruvate, there are many different pathways that result in different end products. The possible products are acetate, formate, ethanol and lactate [13]. Pyruvate is reduced to lactate by the enzyme lactate dehydrogenase (LDH) [14]. Lactate as a possible product is not undisputed and is therefore only partially included in the existing metabolic models. During the formation of lactate, an NADH would also be oxidized to NAD+ so that it would no longer be available for succinate production [15,16]. The C3 pathway that takes place is highly dependent on the selected process parameters. If the CO2 availability is reduced under anaerobic conditions, the formation of ethanol and formate is increased. As the CO2 concentration increases, the quantities of formate and ethanol formed decrease until, finally, at 100% CO2, no more ethanol is formed. The formation of ethanol can lead to a net decrease of one NADH or the equilibrium is completely balanced. During the formation of acetate, an additional NADH can be produced [13]. For both ethanol and acetate, the NADH balance depends on how the intermediate acetyl-CoA is formed. If the reaction is catalyzed by pyruvate formate lyase (PFL) with the formation of formate, no additional NADH is produced in this step. However, if the reaction is catalyzed by pyruvate dehydrogenase (PDH) without the formation of formate, additional NADH is produced. This additional NADH is then available for succinate synthesis in the case of acetate formation. During the formation of formate via PFL, no NADH is initially produced. However, formate can be oxidized to CO2 by formate dehydrogenase, which generates NADH. This CO2 and the corresponding NADH would then be available again for succinate synthesis [15].
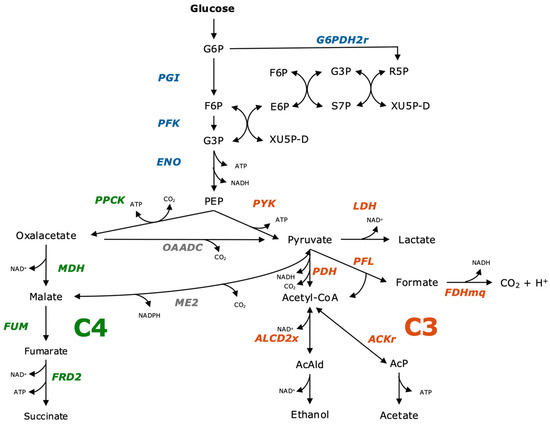
Figure 1.
Metabolic pathway of fermentation products in A. succinogenes from glucose to fermentation products via C4- and C3-branch. Figure modified according to McKinlay et al., Tix et al., Pereira et al. and Wu et al. [11,13,16,17].
1.3. Effects of Redox Potential
The redox ratio of the medium has a significant effect on the amount of succinate produced. This can be deduced from the fact that the overall reaction, starting from one monosaccharide via glycolysis to one mole of succinate, has a net consumption of one mole of NADH. This consumed NADH must inevitably be regenerated in order to maintain the redox balance in the organism [18]. The theoretical yield of succinate with glucose as substrate and the presence of CO2 is 1.71 mol moL−1 which corresponds to 1.12 g·g−1 [19]. This calculation ignores the fact that during glycolysis, only two moles of NADH are produced per mole of glucose, while two moles of NADH are also required to produce one mole of succinate. This means that two moles of NADH would be missing for a further mole of succinate. The missing moles of NADH are usually formed via the by-product formation of acetate and formate. However, this results in a significantly lower yield, as glucose is consumed for by-product formation. If the by-product formation is included and it is assumed that only acetate is produced via the PDH pathway, a theoretical yield of 0.87 g·g−1 would be possible, which corresponds to 1.33 mol moL−1 [20]. The fact that NADH has a limiting effect on succinate production leads to the assumption that more succinate can be formed by shifting the NADH/NAD+ equilibrium in the direction of NADH. There are various potential ways to achieve this shift [18]. A simple process-related possibility could be the use of a more reduced substrate such as sorbitol, which is more reduced than glucose and can therefore produce more reduced products, i.e., succinate and ethanol instead of acetate and formate. This is achieved by shifting the intracellular NADH/NAD+ ratio in favor of NADH. To maintain the redox balance, the extra NADH must be regenerated into NAD+, which can only be done with succinate or ethanol [21]. Another possibility to shift the reduction potential seems to be the introduction of H2 gas. The H2 can be used as an alternative reducing agent via the hydrogenase of A. succinogenes, eliminating the need for NADH regeneration via by-products. An increasingly attractive concept for shifting the reduction potential of a fermentation is the use of electrochemistry in a bioelectrochemical system (BES). This concept has already been used to increase succinate yields in A. succinogenes. It is becoming increasingly attractive as it offers the possibility of storing the ever-increasing surplus of regenerative energy in chemical energy rather than reducing it [22]. Electron transfer can take place directly via microorganisms’ own redox proteins, such as cytochromes or ferredoxins, or indirectly via mediators such as neutral red or carbon nanotubes [23,24]. In indirect electron transfer, the electrons are transferred from the electrode to the mediator so that it is reduced. These additional electrons could then supplement the reduction equivalents present in the MO, although the exact mechanism of action has not yet been described. To achieve this, the potential applied via the electrodes must at least correspond to the redox potential of the mediator used. With the frequently used neutral red mediator, this is guaranteed with a potential of −600 mV. If the two electrons are in one chamber, as in the system used in this work, this is referred to as a single-chamber system [11].
1.4. Substrate and Product Inhibition
In many organisms, high initial substrate concentrations, on the one hand, and the products accumulated during fermentation, on the other, can have an inhibitory effect. However, some A. succinogenes fermentations are carried out at very high glucose concentrations of over 100 g L−1. With these high initial concentrations, high final concentrations of succinate of about 50 g L−1 can be achieved [4]. An argument against such high initial concentrations is that substrate inhibition effects have already been observed in A. succinogenes when glucose is used From a glucose concentration of 2.8 g/L onwards, the lag phase is prolonged. Up to about 40 g L−1, the exponential growth rate could be increased. At higher concentrations, a linear decrease in growth rate was observed. The yield was also strongly dependent on the initial glucose concentration and was highest at 70 g L−1. However, it did not seem to be significantly lower at 30 g L−1 [25]. In all publications, it was found that succinate, acetate and formate had different inhibitory effects. Formate had the strongest inhibitory effect, and no more growth could be recorded from an initial concentration of 9–11 g L−1. The critical concentration of succinate was significantly higher at 40–46 g L−1. The critical concentration of acetate varied the most with a critical range of 10–33 g L−1 [25,26]. The same inhibition mechanisms were assumed for formate and acetate. Both acids can presumably cross the membrane freely in their undissociated form. Inside the cell, they then prevent the import of phosphate, which is required for the first step of glycolysis, the formation of glucose-6-phosphate. As phosphate import is an ATP-dependent transport, more ATP must be used to maintain the required import. This would then be lacking for other processes, such as biomass formation, and thus also indirectly for product formation. Succinate, on the other hand, appears to be less able to pass through the membrane, so that it can be less involved in intracellular inhibition processes [25]. In addition to the different inhibitory effects of the individual acids, it has also been hypothesized that they have a stronger inhibitory effect together than alone [27].
This study aims to deepen the understanding of A. succinogenes metabolism, particularly under varying gas compositions and redox conditions, to support process development for BES. In contrast to the conventional approach of using models to guide experiments, we reverse this logic by first conducting detailed bioreactor experiments and then using the resulting data to calibrate and validate a dynamic metabolic model. This strategy enables mechanistic insight into metabolic regulations and lays the groundwork for predictive modeling of electrofermentation conditions.
2. Materials and Methods
2.1. Growth Conditions
A. succinogenes 130Z (DSM-22257), obtained from the DSMZ-Deutsche Sammlung von Mikroorganismen und Zellkulturen GmbH in Braunschweig, Germany, was used in this study. Pre-cultures were prepared in a medium consisting of tryptic soy broth (TSB) [28]. The medium contained the following composition: casein peptone 17 g L−1, soy peptone 3 g L−1, D-glucose 2.5 g L−1, NaCl 5 g L−1 and K2HPO4 2.5 g L−1, all dissolved in distilled water. The pH of the medium was then adjusted to 6.8. The precultures were grown in 120 mL serum bottles with a working volume of 50 mL. Before inoculation, the bottles were degassed with N2 for 20 min to create anaerobic conditions. The prepared bottles were then inoculated with A. succinogenes in an anaerobic vinyl chamber (Anaerobic Vinyl Chamber Type C from Coy Laboratory Products Inc., Grass Lake, MI, USA). The inoculum was 10% (v/v) of the total volume. After inoculation, incubation was performed for 16 h at 37 °C and 80 rpm in an incubator (KS 4000 i control from IKA of IKA-Werke GmbH & Co. KG, Staufen, Germany). The precultures were used to inoculate the main cultures. A medium described by Wang et al. [29] with a pH of 6.8 was used to grow the main cultures. This medium contained glucose 30 g L−1, NaHPO4 12H2O 31.5 g L−1, NaHCO3 10 g L−1, NaH2PO4 8.5 g L−1 and 5 g L−1 yeast extract. The inoculum in these preparations was also 10% (v/v). In this work, the fermentation was carried out using different approaches. First, anaerobic serum bottles (120 mL working volume 50 mL) were used. These were first degassed with N2 for 20 min before inoculation and then gassed with CO2 for 10 min. They were then inoculated in the same way as the precultures and incubated at 37 °C and 80 rpm in an incubator (KS 4000 i control from IKA, IKA-Werke GmbH & Co KG, Staufen, Germany). Fermentation was also carried out in the bioreactor and it was carried out as described in Tix et al., 2024 [11].
2.2. Analytical Procedures
High-pressure liquid chromatography (HPLC) for the analysis of liquid samples from the fermentations was performed using an HPLC system (Infinity II 1100/1260 series from Agilent Technologies Inc., Santa Clara, CA, USA). The analytical methods used in this study were previously presented by our group in 2024 and further adapted in this work [30]. To determine the concentration of glucose, formate, acetate and lactate from the fermentation supernatant, a standard line was determined for each substance, which was added to the appendix. The HPLC analysis was performed on a Repromer H+ column (Dr Maisch HPLC GmbH, Ammerbuch, Germany) with a size of 300 × 8 mm. The temperature of the column was carefully maintained at 30 °C throughout the analysis. A sample injection volume of 5 µL was used for each analysis. A total of 5 mM sulfuric acid was used as mobile phase to improve the separation performance of the analytes analyzed. The analytes were detected using an Infinity II refractive index detector (Agilent Technologies Inc., Santa Clara, CA, USA). The run time for each chromatographic analysis was set to 30 min. The flow rate of the mobile phase was set at 0.6 mL min−1. To improve the analysis to prove lactate, and to allow separation and thus complete resolution between succinate and lactate, the configuration was maintained and the column temperature was increased to 80 °C. The mobile phase was changed from 5 mM sulfuric acid to 2.5 mM sulfuric acid to further improve separation efficiency.
2.3. Modeling
To simulate the metabolic fluxes during succinate production and the formation of other by-products in A. succinogenes, a dynamic model was created using Berkeley Madonna (Version 10.5.18, Berkeley Madonna Inc., University of California, Berkeley, CA, USA). This software provides a robust environment for solving complex differential equations and allows accurate simulation of biochemical processes over time. The metabolic model used in this study is based on a comprehensive network of the main enzymatic reactions involved in the central metabolism of A. succinogenes. These reactions were parameterized using data from experimental observations. The kinetic parameters of the model were calculated using the curve fit function of the program. As a starting point for the curve fit, all kinetic parameters were initially set to 1 and the limits were set to 0–5.0. The kinetic parameters were calculated in such a way that the substrate and product curves of the model reproduced the experimentally determined curves as precisely as possible. During the reactor runs, a sample was analyzed every two hours in the first 8 h with regard to the substrate and product concentrations, and then, again, in the range from 24 h to 32 h, a sample was analyzed every two hours, and after 48 h, another sample. In order to achieve a more accurate fit, the substrate and product curves were interpolated using the data processing AI Powerdrill (AI Powerdrill, Sacramento, CA, USA) so that a value was available every hour. Care was taken to ensure that only the gaps between the experimental data were filled, but no experimental data were changed. For the substrate and product inhibition parameters, the data described by Lin et al. were used, as they were more comprehensive [25]. The simulation included the production of succinate, lactate, acetate, formate, ethanol and biomass, capturing the dynamic behavior of the fermentation process under different substrate and environmental conditions. The model was validated by comparing the simulated metabolic product concentrations with experimental data from batch fermentation experiments. The experimental data for the basic reactor without potential and the BES are already described in Tix et al. [11]. The predictive ability of the model was tested under different conditions to ensure that the model could reliably simulate metabolic shifts and by-product formation. The model was iteratively adjusted to minimize the discrepancies between the experimental data and the simulation results, and sensitivity analyses were performed to identify the key parameters affecting succinate production. The code of the model and the parameters can be found in Supplementary Materials.
2.4. Calculation
The following equations were used to calculate the Monod kinetics and substrate inhibition. The classical Monod kinetics (Equation (1)) should therefore be extended by a substrate inhibition term (Equation (2)), as already described in the literature for A. succinogenes [25]. The term Cs represents the critical glucose concentration above which no further growth occurs.
where
- : Spcific growth rate;
- max: Maximum specific growth rate;
- Substrate concentration;
- : Critical substrate concentration at which inhibition occurs;
- : Monod half-saturation constant.
Since here and in the literature a product inhibition could be found in addition to the substrate inhibition, the formula should be extended by a product inhibition term (Equation (3)). An individual inhibition term (cp*) is used for each product. The term cp* stands for the critical concentration of the respective product above which the product completely inhibits growth [25].
where
- : Specific growth rate;
- max: Maximum specific growth rate;
- Substrate concentration;
- : Critical substrate concentration at which inhibition occurs;
- : Monod half-saturation constant;
- Product concentration of product i;
- c*pi: Critical Product concentration of product i at which growth is fully inhibited.
3. Results and Discussion
3.1. Influence of Inhibiting Substances on the Metabolism
The aim was to investigate the influence of the initial substrate concentration on the metabolism of A. succinogenes and how this affects growth, product yield and productivity. For this purpose, the glucose concentration of the Wang medium was varied in the range of 20–120 g L−1. A comparison of the specific growth rates at the different initial glucose concentrations, plotted in Figure 2, shows the typical course of microbial growth in the presence of substrate over-inhibition. Initially, the growth rate increased to a maximum (µmax). Here, the maximum growth rate of 0.57 ± 0.03 h−1 was determined at a glucose concentration of 60 g L−1. In classical Monod kinetics, no further change in µ from µmax would occur when the substrate concentration was increased. Here, however, a further increase in the glucose concentration resulted in a significant decrease in the growth rate, which was only 0.44 ± 0.01 h−1 at 120 g L−1. Lin et al. also determined the maximum growth rate at 60 g L−1 [25]. However, at 0.57 ± 0.03 h−1 it was higher than the 0.5 h−1 determined there. In Lin et al., the specific growth rate at 120 g L−1. was lower at about 0.2 h−1. The decrease in growth rate from 60 to 120 g L−1. corresponded to a slope of −0.005 L g h−1. However, the values obtained here only showed a slope of −0.002 L g h−1. Lin et al. used the evolution of the specific growth rate to identify 155 L g h−1 as the critical glucose concentration above which growth ceased. Since the growth rate decreased less rapidly with increasing glucose concentration, a higher critical concentration would be possible. Assuming a strictly linear decline in growth rate, the critical concentration would only be reached at 335 L g h−1. A possible explanation for the differences in growth rates may lie in the different media compositions. For example, Lin et al. used 30 g L−1 MgCO3 as a CO2 source instead of 10 g L−1 NaHCO3 [25]. At this concentration, the MgCO3 is likely to precipitate and could have a negative effect on growth. However, the final product concentrations, yields and STY shown in Figure 3 are more decisive for the economic efficiency of such a process. In contrast to the growth rate, the highest values for these criteria were obtained with 20 g L−1 glucose. Like the growth rate, the lowest values were obtained at 120 g L−1 glucose. A further significant decrease was observed for all values compared to 90 g L−1. The product concentration at 20 was the highest at 6.86 ± 0.37 g L−1. This was just above the 6.64 ± 0.09 g L−1 achieved with 30 g L−1 glucose. However, it should be noted that the standard deviation is higher at 20 g L−1 than at 30 g L−1. Therefore, the final concentration at 20 g L−1 could be even lower than that at 30 g L−1. The remaining values at 30 g L−1 were also like those at 20 g L−1. The values at 60 and 90 g L−1 were also very similar despite the different growth rates. Product concentration, yield and STY decreased significantly from 30 to 60 and 90 g L−1, although the growth rate at 60 g L−1 was higher than at 30 g L−1. For example, the yield decreased from 0.65 ± 0.04 g·g−1 to 0.47 ± 0.01 g·g−1 from 30 to 60 g L−1. This decrease could be explained by the yield (YFA) of acetate formed in relation to the formate formed in g g−1. At 30 g L−1, the YFA was 1.51 ± 0.14 g g1, while at 60 g L−1, the YFA was only 1.33 ± 0.02 g·g−1. A higher YFA indicates that more acetate was produced via PDH, and, therefore, more NADH was produced. This additional NADH could then have been used to produce succinate. However, this difference is far too small to explain the large difference in YSG yield. The analysis could also be a strong influencing factor. The theoretical initial glucose value was used to calculate the yield. If this value deviates too much upwards from the actual initial concentration, this could be the reason for the poorer yield. In order to finally clarify whether 30 or 60 g L−1 glucose provides the better conditions, comparative tests in controlled and better mixed systems would be necessary. The better mixing would allow more precise substrate and product analysis. However, as 30 g L−1 still gave high growth rates and some of the highest yields overall, we continued to work with 30 g L−1 in the following experiments.
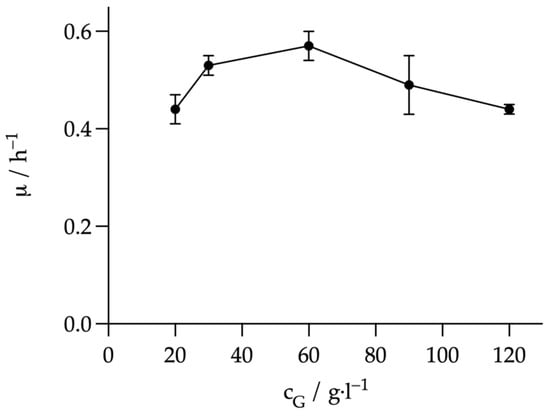
Figure 2.
Comparison of the specific growth rates at different initial glucose concentrations. The glucose concentrations in g L−1 are plotted on the X-axis and the corresponding growth rate µ in h−1 on the Y-axis. Experimental parameters: anaerobic, 20–120 g L−1 glucose, 37 °C, 80 rpm, initial pH = 7.0. HPLC parameters: Repromer H+ column, 5 mM H2SO4, t = 30 min, flow rate 0.6 mL min−1 at 30 °C.
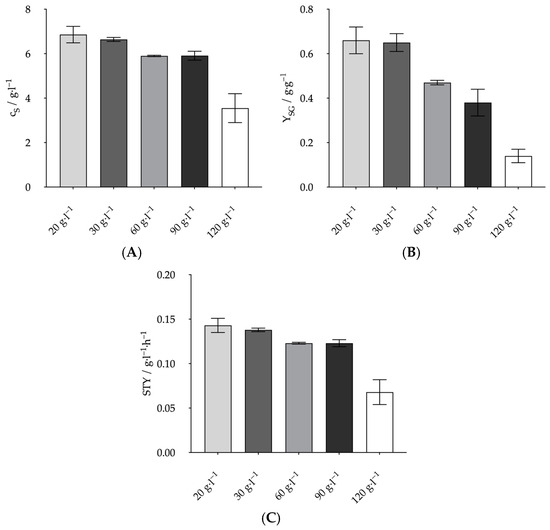
Figure 3.
Comparison of fermentation results at different glucose concentrations. Final product concentration (A), space–time yield (B) and yield (C). Experimental parameters: anaerobic, 20–120 g L−1 glucose, 37 °C, 80 rpm, initial pH = 7.0. HPLC parameters: Repromer H+ column, 5 mM H2SO4, t = 30 min, flow rate 0.6 mL min−1 at 30 °C.
In addition to substrate inhibition, many organisms are inhibited by the products formed, especially when they produce acids. The aim of the following experiments was to investigate the influence of the products succinate, acetate and formate formed by A. succinogenes on growth and product formation. This was also carried out in the batch serum flasks with a working volume of 50 mL and a glucose concentration of 30 g L−1. The products were weighed into the medium either individually or all three products together. This was done before adjusting the pH to 7.0 with 5 M NaOH. Succinic and acetate were weighed in their acid form. Formate was weighed as the sodium salt due to its inaccessible acid form. The first step was to determine how strongly the three products inhibited when they were present at the concentration found at the end of a 48 h batch fermentation in the reactor. The target concentrations were 18 g L−1 succinate (S18), 7.5 g L−1 acetate (A7.5) and 2 g L−1 formate (F2). All growth rates were reduced compared to the positive control. The growth rate at 2 g L−1 formate (F2) was 0.42 ± 0.06 h−1, which was closest to the control, which had a growth rate of 0.53 ± 0.02 h−1. However, the dry biomass at t48 of 1.01 ± 0.08 g L−1 was significantly higher than the 0.50 ± 0.12 g L−1 of the positive control. In the culture where all three products were used in combination, no growth rate was recorded. There was only a slight increase in biomass from 24 to 48 h. The biomass increased from 0.01 ± 0.00 g L−1 to 0.04 ± 0.03 g L−1. A significant increase was only observed from 48 to 72 h, from 0.04 ± 0.03 g L−1 to 0.16 ± 0.04 g L−1. The growth rates of the S18 culture at 0.36 ± 0.07 h-1 and the A7.5 culture at 0.21 ± 0.03 h−1 were both significantly reduced compared to the positive control. The measured final succinate concentration of 6.77 ± 0.24 g L−1 for F2 was even slightly higher than the 6.64 ± 0.09 g L−1 measured for the positive control. Correspondingly, the STY of 0.14 ± 0.01 g L−1 h−1 was just as high as that of the positive control. The final succinate concentrations of the S18 and A7.5 cultures were very similar at 3.59 ± 0.38 g L−1 and 3.27 ± 0.11 g L−1, respectively, and almost halved compared to the positive control. The same was observed for the STY, which were 0.08 ± 0.01 and 0.07 ± 0.01 g L−1 h−1. However, the highest yield of all was obtained with the S18 culture at 0.68 ± 0.01 g L−1. The STY of the culture with all three products was the lowest at 0.01 ± 0.01 g L−1.
As shown in Figure 4, all three products caused a reduction in one of the measured parameters compared to the positive control. At a concentration of 2 g L−1 formic acid, only the growth rate was reduced. This is in agreement with Lin et al.’s study in which the specific growth rate decreased linearly with increasing formate concentration [25]. Here, approximately 11 g L−1 formate was reported as the critical formate concentration at which the growth rate would be 0% of the maximum growth rate. The 2 g L−1 chosen here should therefore result in a 20% reduction in the growth rate of the positive control, i.e., 0.42 h−1. This is exactly the proven growth rate [25]. However, the final concentration of succinate was slightly higher than in the positive control, and the STY was the same. The reduced growth rate at the beginning seemed to lead to increased growth later in the fermentation as the dry biomass after 48 h was double that of the positive control at 1.01 ± 0.08 g L−1. This could be explained by the same STY and approximately the same succinate concentration. Thus, this concentration did not appear to be sufficient to significantly affect fermentation. The succinate concentration of 18 g L−1 and the acetate concentration of 7.5 g L−1 had a similar strong effect on the RDA and the final succinate concentration. This confirmed the significantly stronger inhibitory effect of acetate compared to succinate on fermentation [25]. In addition, it was shown that not only the critical concentration above which no growth occurs, but also typical concentrations of these two products that occur during fermentation can lead to a significant deterioration in fermentation results. This was again confirmed by the fact that a combination of these three products led to an almost complete inhibition of fermentation. However, the formation of succinate alone without the formation of the by-products seems rather unlikely [16]. Since the inhibitory effect of the combination of these three products was so much stronger than that of the three products alone, the question arose as to whether this was a combinatorial effect or whether it was simply due to the approximately 10 g L−1 higher acid concentration. Such a combinatorial effect had already been suggested by Corona-González et al. [27]. This effect would mean that all three acids in combination would have a stronger inhibitory effect than one acid alone, if the total acid concentration is equal to the concentration of one acid alone.
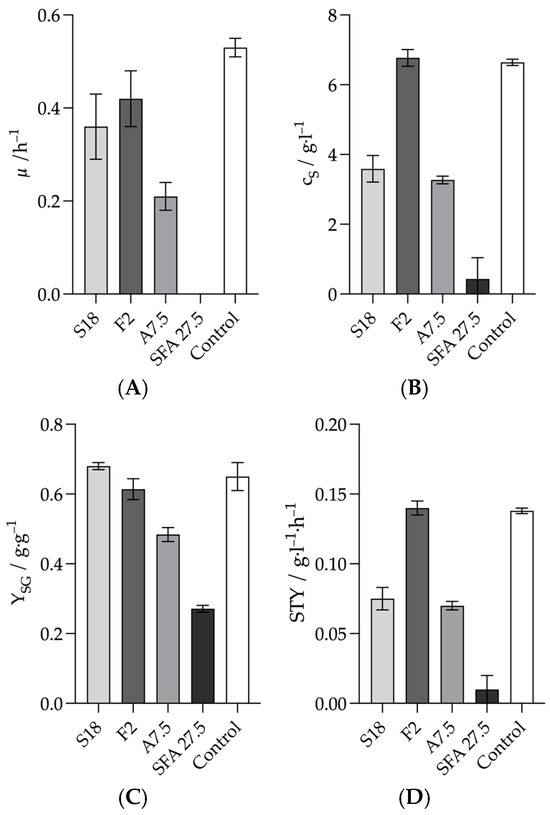
Figure 4.
Effects of product inhibition on the fermentation results of the three fermentation products at typical fermentation concentrations. (A) Growth rate, (B) Product concentration after 48 h, (C) Yield after 48 h, (D) STY after 48 h. Experimental parameters: anaerobic, 20–120 g L−1 glucose, 37 °C, 80 rpm, initial pH = 7.0. HPLC parameters: Repromer H+ column, 5 mM H2SO4, t = 30 min, flow rate 0.6 mL min−1 at 30 °C.
3.2. Alignment of the Metabolism in the Absence of a CO2 Source
Most experiments with A. succinogenes are aimed at improving the production of succinate. CO2 is usually used, either as a carbonate or as a gas, or in combination. CO2 is used as carbonate, gas or in combination. Pereira et al. have already shown that a reduction in CO2 availability leads to an increase in ethanol and formate formation. However, this study did not investigate the metabolic behaviors in the complete absence of CO2 [13]. The effects on anaerobic metabolism in the complete absence of CO2 are therefore investigated below. It is also investigated whether these conditions favor lactate production. First, the effect of the absence of CO2 on growth was determined. For this purpose, the main culture medium was prepared without NaHCO3 and without CO2 gassing, but only with N2 gassing for 20 min to ensure an anaerobic environment. The glucose concentration in these experiments was 20 g L−1, and growth was compared with a culture in Wang’s medium containing 10 g L−1 NaHCO3. The medium of this culture was gassed with CO2 for 10 min in addition to the 20 min N2 gassing prior to inoculation. This was performed to ensure saturation of the medium with CO2. The product formation of the two cultures was compared. The two cultures with and without CO2 initially showed similar growth behaviors. No prolonged storage phase was observed without CO2. However, growth without CO2 was generally slightly slower and this was reflected in the growth rate. The growth rate without CO2 was only 0.26 ± 0.02 h−1, while the growth rate with CO2 was 0.44 ± 0.01 h−1. Both cultures entered the transition phase after approximately 6–7 h and they reached maximum biomass after 24 h. The maximum dry biomass without CO2 was 0.61 ± 0.05 g L−1, significantly lower than with CO2, which reached 1.27 ± 0.15 g L−1. Product formation was clearly shifted, as shown in Figure 5. Glucose consumption in the culture without CO2 was reduced by 39% compared to the culture with CO2, and only 32% of the initial glucose was consumed. Succinate production was 0.15 ± 0.14 g L−1 in the culture without CO2 and 6.86 ± 0.37 g L−1 in the culture with CO2. A total of 1.94 ± 0.12 g L−1 formate was produced in the culture with CO2.
Figure 5.
A. Succinogenes product formation with and without available CO2 source. Experimental parameters: anaerobic, 20 g L−1 glucose, 37 °C, 80 rpm, initial pH = 7.0. HPLC parameters: Repromer H+ column, 5 mM H2SO4, t = 30 min, flow rate 0.6 mL min−1 at 30 °C.
In the culture without CO2, the amount produced was significantly higher at 2.44 ± 0.04 g L−1. The opposite was observed for the amount of acetate produced. In the culture with CO2, significantly more acetate was produced (2.73 ± 0.15 g L−1) than in the culture without CO2 (1.63 ± 0.03 g L−1). In the culture with CO2, almost no ethanol was produced with 0.35 ± 0.06 g L−1. In contrast, 1.34 ± 0.28 g L−1 ethanol was produced in the culture without CO2. In the culture without CO2, the yield of formate relative to the sum of acetate and ethanol was 0.94 ± 0.20 mol moL−1. CO2 has been shown to be a valuable source for the metabolism of A. succinogenes. The organism is able to utilize the CO2 via C4 metabolism with the ultimate production of succinate. The C4 metabolism allows the organism to achieve significantly improved growth, which is reflected in the significantly increased growth rate and higher maximum dry biomass concentrations when cultivated with a CO2 source compared to cultivation without a CO2 source. This is further supported by the fact that significantly less glucose was consumed in the culture without CO2, suggesting that glycolysis was much less efficient. In principle, the organism should only be able to synthesize succinate in the presence of CO2, as it incorporates it into PEP via PPCK to produce oxaloacetate. This step is necessary for the subsequent production of succinate [31]. As PEP could only be degraded via the C3 pathway in the culture without CO2, there was a significant increase in the two products’ formate and acetate. Only the production of acetate was reduced compared to the culture with CO2. In the culture with CO2, more acetate was produced as this enabled the organism to generate NADH for succinate production [32]. The yield of formate in relation to the sum of acetate and ethanol in molsuccinate molglucose−1 was approximately 1, indicating that both ethanol and acetate were produced almost exclusively via PFL. This pathway does not produce any additional NADH, which would have to be regenerated to NAD+. Glycolysis produces two NADH and two PEP from one molecule of glucose. One PEP can be degraded via the PFL to one molecule of acetate and one molecule of formate, but no additional NADH is produced. The second PEP can then be degraded via the PFL to ethanol, regenerating the two NADH from glycolysis to NAD+. In this way, the organism can maintain its NADH/NAD+ ratio in balance when it is unable to use the C4 pathway. If A. succinogenes were to degrade all of its PEP to lactate, it could also maintain the NADH/NAD+ balance, as two NADHs would also be degraded [17]. It therefore seems more advantageous for the organism to maintain the balance by producing ethanol.
3.3. Optimization of Succinate Production Through the Combination of Sodium Hydrogen Carbonate and Gaseous CO2
The aim of this series of experiments was to investigate whether the combination of CO2 with NaHCO3 leads to an improvement in product formation compared to the use of NaHCO3 alone. Zou et al. have previously shown that the combination of MgCO3 and gaseous CO2 results in increased product formation [33]. However, as MgCO3 precipitates at high concentrations and thus complicates process control, it was investigated whether this positive effect could also be demonstrated with NaHCO3. The experiments were performed in batch serum bottles with a working volume of 50 mL. The glucose concentration was 30 g L−1. Both cultures contained a NaHCO3 concentration of 10 g L−1. One of the two cultures was gassed with N2 for 10 min, then with CO2 for 10 min and then again with N2 for 10 min to remove dissolved CO2 in the medium. The 10 min CO2 gassing was necessary to bring the pH, which had risen to 7.5 after autoclaving, back down to 7.0. However, the subsequent gassing with N2 caused the pH to rise again to 7.5. Due to this increased pH, fermentation was only carried out for 24 h. Due to the higher initial pH, without gaseous CO2, the pH would not have fallen below the critical value of 6.0 until much later in the experiments, and production would have taken longer. However, as the aim was to achieve pH-regulated fermentation in the reactor, where the pH would be maintained in the optimum range, the two cultures were only compared in the optimum pH range. The other culture was first gassed with N2 for 20 min. It was then gassed with CO2 for 10 min to saturate the medium with CO2. Figure 6 illustrates that the combination of NaHCO3 and gaseous CO₂ yielded improved results across all criteria. The succinate concentration of 6.11 ± 0.09 g L−1 after 24 h was almost four times higher than in the culture with NaHCO3 alone, where only 1.55 ± 0.13 g L−1 was achieved. Dry biomass was twice as high at 1.32 ± 0.15 g L−1. The yield of succinate, relative to the glucose consumed, was also significantly higher with the combination at 0.60 ± 0.01 g·g−1 compared to 0.43 ± 0.04 g·g−1 when only NaHCO3 was used. The yield of succinate as by-products was 1.10 ± 0.1 g·g−1 with the combination and only 0.74 ± 0.16 g·g−1 with NaHCO3 alone. Thus, it could be shown that the combination of NaHCO3 with CO2, similar to the combination of MgCO3 with CO2, is able to significantly increase the succinate production and the growth of A. succinogenes compared to carbonate alone [6,33]. The difference in absolute concentration was most pronounced. This was increased almost fourfold. The yield of succinate in relation to the by-products shows how the availability of CO2 influences the orientation of the metabolism towards the C4 or C3 pathway. Higher CO2 concentrations lead to higher levels of phosphoenolpyruvate carboxykinase and thus to increased turnover of PEP generated by glycolysis via the C4 pathway. At the same time, PEP is used less via the C3 pathway. Accordingly, the ratio of succinate to C3 metabolites increases. In the future, it could be investigated whether increasing the NaHCO3 concentration beyond the 10 g L−1 used here leads to a further increase in succinate production, similar to that observed for MgCO3 by Zou et al. [33].
Figure 6.
Comparison of cultures with only NaHCO3 and NaHCO3 in combination with gaseous CO2. (A) Comparison of succinate production and biomass formation. (B) Comparison of succinate yield in terms of glucose consumed (YSG) and secondary products produced (YSSP). Experimental parameters NaHCO3 culture: anaerobic, 30 g L−1 glucose, 37 °C, 80 rpm, initial pH = 7.5, fermentation time: 24 h. Experimental parameters NaHCO3 culture CO2: anaerobic, 30 g L−1 glucose, 37 °C, 80 rpm, initial pH = 7.2, fermentation time: 24 h. HPLC parameters: Repromer H+ column, 5 mM H2SO4, t = 30 min, flow rate 0.6 mL min−1 at 30 °C.
3.4. Modeling the Metabolism
The final aim of the study was to summarize the collected data, in particular the electro-bioreactor data, in a Berkeley Madonna metabolic model of Actinobacillus succinogenes. For this purpose, the main metabolic reactions of the organism were visualized in a flow chart. Overly complex metabolic steps were simplified, resulting in the flow chart shown in Figure 7. Glycolysis was simplified to a single step, as the individual intermediate reactions were not relevant for the present study. Instead, the focus was on the breakdown into the C3 and C4 pathways, which lead to different end products and only occur from phosphoenolpyruvate (PEP) onwards. This procedure is suitable for the model we were aiming at here, which has a strong focus on the NADH/NAD+ balance and in which during glycolysis only is NADH regenerated during the step from G3P to PEP. For this reason, the model was equipped with an NADH/NAD+ balance, as can be seen in the upper left corner of the flow diagram. This balance was equipped with an electron pump (e-pump). This e-pump makes it possible to visualize the influence of an external electron supply, as is the case with BES. Figure 8 shows the result of the fit to the results of the control run, in which no additional electrons were provided by a potential. Only the experimentally determined data and no data interpolated using the AI Power Drill are listed there. The kinetic parameters determined by this fit thus formed the basis for the prediction of changes due to the supply of external electrons in the BES. In contrast to the conventional sequence in which modeling precedes and guides experimental design, this study adopts a reverse approach: constructing and validating a dynamic model based on experimental fermentation data. By using experimental observations to calibrate and validate the model, we ensured a mechanistically faithful representation of substrate utilization, by-product formation and redox behavior. Such an approach aligns with established practices in systems and metabolic biology, where iterative model refinement using experimental data is essential for predictive reliability [34]. This validation-focused modeling strategy enables the model to be confidently applied in subsequent predictive simulations, such as assessing the impact of external electron supply in BES. As can be seen, the course of the substrate consumption of glucose in the model could be adapted very well to the experimental data. This can also be seen from the total glucose consumed, which only deviates by 0.3 g L−1 from the experimental substrate consumption of 23.47 ± 0.28 g L−1, which corresponds to a deviation of 1.27%. The curves of the three experimentally determined products succinate, formate and acetate, could also be modeled well in principle. However, the product formation of succinate in the model deviates upwards by 0.66 g L−1 from the experimental data, which corresponds to a percentage deviation of 5.2% and thus a greater deviation than the substrate consumption. The two products of the C3 metabolism deviate to a similar extent. Formate formation deviates downwards by 5.9%, and acetate formation deviates upwards by 3.7%. A more frequent repetition of the control reactor run with a corresponding curve fitting of the model could further reduce this deviation. The course of the dry biomass deviated most strongly from the experimental data. Here, the dry biomass showed a concentration of approx. 0.9 g L−1 directly at the beginning, whereas it was only 0.03 g L−1 in the experimental data. The model then predicted a continuous, very slow increase until the end, so that a concentration of 1.48 g L−1 was reached after 48 h. In the experimental run, on the other hand, there was an increase from t0 to t24 to 1.40 g L−1. The biomass then fell again until a concentration of 0.75 g L−1 was reached at t48. Adjusting the growth curve by increasing or decreasing the growth parameters did not lead to a more realistic curve. On the contrary, this even led to biomass concentrations above 5 g L−1, which could not be detected at this level during any reactor run. However, it is generally very difficult to obtain reliable experimental data, as the photometric biomass determination method used here only measures cells in solution and not cells embedded in biofilm. Since A. succinogenes is a strong biofilm former, there is a strong discrepancy between the photometrically measured biomass concentration and the total biomass, which also includes the biofilm. It would greatly improve the model if total biomass values were included here in future. However, it would also be important to determine how much of this total biomass actually contributes to succinate productivity, as large amounts of biofilm are often formed by dead cells [35]. The approach chosen here, in which the kinetic parameters of the intermediate reactions were derived only from the experimental results of the starting substrate and the end products, corresponds to a classic metabolic flux analysis. In order to be able to verify the kinetic parameters of the enzymes of the intermediate reactions calculated by the model, a high-resolution 13 C metabolic flux analysis would be useful in future experiments. This investigation would enable the direct determination of the reaction parameters of the intermediate steps [36,37].
Figure 7.
Illustration of the main reactions of A. succinogenes metabolism in the Berkeley Madonna Flowchart. The blue reservoirs represent the concentrations of the substrates, intermediates and end products. The yellow dots represent the kinetic parameters of the metabolic reactions. These largely comprise the components of Michaelis–Menten kinetics, such as vmax, the substrate concentration and the Km value. The blue arrows with the circles are the flow arrows of the reactions. Here, the basic reaction rate is coupled with the dry biomass to calculate the actual reaction rate.
Figure 8.
Substrate and product curves in Berkeley Madonna after curve fit to the bioreactor control run. Experimental parameters: anaerobic, gassing 0.25 vvm (20% N2/80% CO2), surface carbon fiber = 414 cm2, main culture medium. V = 2 L, n = 50 rpm, T = 37 °C, pH = 6.8, pH controlled with 5 M NaOH.
As a result of the successful curve fit, realistic values were calculated for the kinetic parameters of the model and these parameters can be found in the appendix under ‘Kinetic Parameters’. This should have made it possible to map the fermentation results of the BES without a further curve fit and only by adjusting the electron supply through the e-pump. As has already been shown, additional electron supply leads, above all, to an increase in succinate production, with acetate and formate production remaining the same or even decreasing. The proportion of succinates in all products therefore increases [11]. This can be clearly seen in Figure 9, where the proportions of succinate, acetate and formats in the total product quantity of the control reactor and two BES, as well as the calculated values of the model, are shown. The bars labeled “A” represent the experimentally determined data, while the bars labeled “B” show the simulation of these data using the modified model with adjusted electron supply from the e-pump.
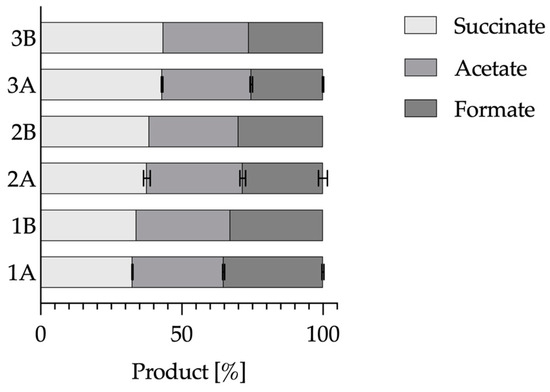
Figure 9.
Percentage distribution of the fermentation products of the control reactor, the BES and the Berkeley Madonna model values. Experimental parameters: anaerobic, gassing 0.25 vvm (20% N2/80% CO2), surface area of the carbon fiber = 414 cm2, A. succinogenes in the main nutrient medium. V = 2 L, n = 50 rpm, T = 37 °C, pH = 6.8, pH control with 5 M NaOH. 1A: Control bioreactor, 1B: Berkeley Madonna basis model e-pump = 0, 2A: 100 µM neutral red and a potential of −0.6 V, 2B: Berkeley Madonna model with e-pump = 0.3, 3A: 500 µg mL−1 hydrophilic carbon nanotubes and a potential of −0.6 V, 3B: Berkeley Madonna model with e-pump = 0.7.
First of all, you can see that this ratio of the products of the control reactor could be simulated with the basic model. Only the proportion of formate was approximately 2.5 percentage points too low at 32.8%. The trend towards an increase in the proportion of succinate in BES could, in principle, be abolished by adjusting the model via the e-pump.
In the BES where 100 µM neutral red and a potential of −0.6 V (2A) were used, the succinate content increased to 37.62 ± 1.22% compared to the control reactor (1A) where this content was only 32.5 ± 0.16%. By adjusting the e-pump to a value of 0.3, the proportion of succinate in the model could be increased to 38.5%. Although the model value was 0.9 percentage points too high, it was still within the standard deviation of the BES. In the BES where 500 µg mL−1 hydrophilic carbon nanotubes were used together with a potential of −0.6 V (3A), the succinate content could even be increased to 43.1 ± 0.3%. By increasing the e-pump value of the model to 0.7 (3B), a succinate content of 43.5% could be displayed. The value generated here was therefore only slightly above the standard deviation range and reflected the general trend well. Overall, the deviation of the model from the experimental data was always less than 2.5 percentage points and was always very close to the standard deviation of the experimental value. Thus, it could be shown for two BES systems that the shift of the product proportion towards the succinate can be described by the e-pump in the model. It would therefore be conceivable to use the model to predict the effects of certain quantities of external electrons. However, to make this actually feasible, the model would have to be compared and optimized with further BES reactor runs and the quantities of external electrons added.
4. Conclusions
This study is dedicated to elucidating the significant role of gaseous substrates, in particular CO2, in modulating the central carbon flux distribution in A. succinogenes. These findings have direct implications for optimized succinate biosynthesis. The results show a clear bifurcation of metabolic pathways between the reductive C4 pathway and the fermentative C3 pathway, which is closely determined by the availability of inorganic carbon and redox equivalents. In the absence of CO2, metabolic flux is redirected to formate and ethanol production, highlighting the organism’s compensatory strategy to maintain NAD+ regeneration under carbon-limited conditions. Conversely, the combined application of dissolved bicarbonate and gaseous CO2 significantly increased succinate titers and yields, revealing a synergistic effect of phase-dissolved CO2 supply. In addition, the development of a dynamic Berkeley-Madonna-based kinetic model enabled the accurate prediction of metabolic shifts in response to substrate and electron flow perturbations, even under electrochemical stimulation. The integration of an artificial electron input (“e-pump”) allowed the simulation of scenarios for BES that showed high agreement with the experimental data. This illustrates the robustness of the model and its potential applicability for predicting electro fermentative processes. Overall, this integrative approach combining metabolic physiology, gas-phase engineering and kinetic modeling improves the mechanistic understanding of A. succinogenes metabolism and provides a quantitative framework for rational bioprocess optimization. These findings contribute to the strategic positioning of this organism as a chassis for sustainable C4 dicarboxylate production in future CO2-integrated bioproduction platforms.
Supplementary Materials
The following supporting information can be downloaded at: https://www.mdpi.com/article/10.3390/fermentation11050263/s1.
Author Contributions
Conceptualization, J.T.; methodology, J.T. and J.B.; software, J.B.; validation, J.T. and J.B.; formal analysis, J.T. and J.B.; investigation, J.T., J.B. and L.G.; resources, N.T.; data curation, J.T. and J.B.; writing—original draft preparation, J.T. and J.B.; writing—review and editing, J.T., J.B. and N.T.; visualization, J.T. and J.B.; supervision, N.T.; project administration, N.T.; funding acquisition, N.T. All authors have read and agreed to the published version of the manuscript.
Funding
This project is funded by the Fachagentur Nachwachsende Rohstoffe e.V. under the funding code 2221 NR021A. Funded by the Federal Ministry of Food and Agriculture on the basis of a resolution of the German Bundestag.
Institutional Review Board Statement
Not applicable.
Informed Consent Statement
Not applicable.
Data Availability Statement
The original contributions presented in the study are included in the article; further inquiries can be directed to the corresponding author.
Acknowledgments
We would like to thank Kynol Europa GmbH for providing the carbon fiber used as an electrode in our BES.
Conflicts of Interest
The authors declare no conflicts of interest. The funders had no role in the design of the study; in the collection, analyses, or interpretation of data; in the writing of the manuscript; or in the decision to publish the results.
References
- Meynial-Salles, I.; Dorotyn, S.; Soucaille, P. A New Process for the Continuous Production of Succinic Acid from Glucose at High Yield, Titer, and Productivity. Biotech. Bioeng. 2008, 99, 129–135. [Google Scholar] [CrossRef]
- Dickson, R.; Mancini, E.; Garg, N.; Woodley, J.M.; Gernaey, K.V.; Pinelo, M.; Liu, J.; Mansouri, S.S. Sustainable Bio-Succinic Acid Production: Superstructure Optimization, Techno-Economic, and Lifecycle Assessment. Energy Environ. Sci. 2021, 14, 3542–3558. [Google Scholar] [CrossRef]
- Saxena, R.K.; Saran, S.; Isar, J.; Kaushik, R. Production and Applications of Succinic Acid. In Current Developments in Biotechnology and Bioengineering; Elsevier: Amsterdam, The Netherlands, 2017; pp. 601–630. ISBN 978-0-444-63662-1. [Google Scholar]
- Zhu, L.-W.; Wang, C.-C.; Liu, R.-S.; Li, H.-M.; Wan, D.-J.; Tang, Y.-J. Actinobacillus succinogenes ATCC 55618 Fermentation Medium Optimization for the Production of Succinic Acid by Response Surface Methodology. J. Biomed. Biotechnol. 2012, 2012, 626137. [Google Scholar] [CrossRef]
- Stylianou, E.; Pateraki, C.; Ladakis, D.; Vlysidis, A.; Koutinas, A. Optimization of Fermentation Medium for Succinic Acid Production Using Basfia Succiniciproducens. Environ. Technol. Innov. 2021, 24, 101914. [Google Scholar] [CrossRef]
- Song, H.; Lee, J.W.; Choi, S.; You, J.K.; Hong, W.H.; Lee, S.Y. Effects of Dissolved CO2 Levels on the Growth ofMannheimia Succiniciproducens and Succinic Acid Production. Biotechnol. Bioeng. 2007, 98, 1296–1304. [Google Scholar] [CrossRef] [PubMed]
- Raab, A.M.; Gebhardt, G.; Bolotina, N.; Weuster-Botz, D.; Lang, C. Metabolic Engineering of Saccharomyces Cerevisiae for the Biotechnological Production of Succinic Acid. Metab. Eng. 2010, 12, 518–525. [Google Scholar] [CrossRef] [PubMed]
- Zhang, W.; Zhu, J.; Zhu, X.; Song, M.; Zhang, T.; Xin, F.; Dong, W.; Ma, J.; Jiang, M. Expression of Global Regulator IrrE for Improved Succinate Production under High Salt Stress by Escherichia coli. Bioresour. Technol. 2018, 254, 151–156. [Google Scholar] [CrossRef]
- Nghiem, N.P.; Davison, B.H.; Suttle, B.E.; Richardson, G.R. Production of Succinic Acid by Anaerobiospirillum succiniciproducens. Appl. Biochem. Biotechnol. 1997, 63–65, 565–576. [Google Scholar] [CrossRef]
- Salma, A.; Djelal, H.; Abdallah, R.; Fourcade, F.; Amrane, A. Well Knowledge of the Physiology of Actinobacillus succinogenes to Improve Succinic Acid Production. Appl. Microbiol. 2021, 1, 304–328. [Google Scholar] [CrossRef]
- Tix, J.; Gotthardt, L.; Bode, J.; Karabacak, B.; Nordmann, J.; Hengsbach, J.-N.; Ulber, R.; Tippkötter, N. Enhancement of Succinic Acid Production by Actinobacillus succinogenes in an Electro-Bioreactor. Fermentation 2024, 10, 504. [Google Scholar] [CrossRef]
- Dessie, W.; Xin, F.; Zhang, W.; Jiang, Y.; Wu, H.; Ma, J.; Jiang, M. Opportunities, Challenges, and Future Perspectives of Succinic Acid Production by Actinobacillus succinogenes. Appl. Microbiol. Biotechnol. 2018, 102, 9893–9910. [Google Scholar] [CrossRef] [PubMed]
- Pereira, B.; Miguel, J.; Vilaça, P.; Soares, S.; Rocha, I.; Carneiro, S. Reconstruction of a Genome-Scale Metabolic Model for Actinobacillus succinogenes 130Z. BMC Syst. Biol. 2018, 12, 61. [Google Scholar] [CrossRef] [PubMed]
- Li, Q.; Wang, D.; Song, Z.; Zhou, W.; Wu, Y.; Xing, J.; Su, Z. Dual-Phase Fermentation Enables Actinobacillus succinogenes 130ZT to Be a Potential Role for High-Level Lactate Production from the Bioresource. Bioresour. Technol. 2010, 101, 7665–7667. [Google Scholar] [CrossRef]
- McKinlay, J.B.; Laivenieks, M.; Schindler, B.D.; McKinlay, A.A.; Siddaramappa, S.; Challacombe, J.F.; Lowry, S.R.; Clum, A.; Lapidus, A.L.; Burkhart, K.B.; et al. A Genomic Perspective on the Potential of Actinobacillus succinogenes for Industrial Succinate Production. BMC Genom. 2010, 11, 680. [Google Scholar] [CrossRef]
- McKinlay, J.B.; Shachar-Hill, Y.; Zeikus, J.G.; Vieille, C. Determining Actinobacillus succinogenes Metabolic Pathways and Fluxes by NMR and GC-MS Analyses of 13C-Labeled Metabolic Product Isotopomers. Metab. Eng. 2007, 9, 177–192. [Google Scholar] [CrossRef]
- Wu, J.; Li, Y.; Yin, J.; Wang, C.; Qi, X.; Zhou, Y.; Liu, H.; Wu, P.; Zhang, J. Mutation Breeding of High-Stress Resistant Strains for Succinic Acid Production from Corn Straw. Appl. Microbiol. Biotechnol. 2024, 108, 278. [Google Scholar] [CrossRef] [PubMed]
- Almqvist, H.; Pateraki, C.; Alexandri, M.; Koutinas, A.; Lidén, G. Succinic Acid Production by Actinobacillus succinogenes from Batch Fermentation of Mixed Sugars. J. Ind. Microbiol. Biotechnol. 2016, 43, 1117–1130. [Google Scholar] [CrossRef]
- Kádár, Z.; Fonseca, C. Bio-Products from Sugar-Based Fermentation Processes. In Biorefinery; Bastidas-Oyanedel, J.-R., Schmidt, J.E., Eds.; Springer International Publishing: Cham, Switzerland, 2019; pp. 281–312. ISBN 978-3-030-10960-8. [Google Scholar]
- Bradfield, M.F.A.; Nicol, W. Continuous Succinic Acid Production by Actinobacillus succinogenes in a Biofilm Reactor: Steady-State Metabolic Flux Variation. Biochem. Eng. J. 2014, 85, 1–7. [Google Scholar] [CrossRef][Green Version]
- Li, J.; Jiang, M.; Chen, K.; Shang, L.; Wei, P.; Ying, H.; Ye, Q.; Ouyang, P.; Chang, H. Enhanced Production of Succinic Acid by Actinobacillus succinogenes with Reductive Carbon Source. Process Biochem. 2010, 45, 980–985. [Google Scholar] [CrossRef]
- Quraishi, M.; Wani, K.; Pandit, S.; Gupta, P.K.; Rai, A.K.; Lahiri, D.; Jadhav, D.A.; Ray, R.R.; Jung, S.P.; Thakur, V.K.; et al. Valorisation of CO2 into Value-Added Products via Microbial Electrosynthesis (MES) and Electro-Fermentation Technology. Fermentation 2021, 7, 291. [Google Scholar] [CrossRef]
- Li, J.; Cheng, G.; Dong, S. Direct Electron Transfer to Cytochrome c Oxidase in Self-Assembled Monolayers on Gold Electrodes. J. Electroanal. Chem. 1996, 416, 97–104. [Google Scholar] [CrossRef]
- Gong, Z.; Yu, H.; Zhang, J.; Li, F.; Song, H. Microbial Electro-Fermentation for Synthesis of Chemicals and Biofuels Driven by Bi-Directional Extracellular Electron Transfer. Synth. Syst. Biotechnol. 2020, 5, 304–313. [Google Scholar] [CrossRef]
- Lin, S.K.C.; Du, C.; Koutinas, A.; Wang, R.; Webb, C. Substrate and Product Inhibition Kinetics in Succinic Acid Production by Actinobacillus succinogenes. Biochem. Eng. J. 2008, 41, 128–135. [Google Scholar] [CrossRef]
- Li, Q.; Wang, D.; Wu, Y.; Yang, M.; Li, W.; Xing, J.; Su, Z. Kinetic Evaluation of Products Inhibition to Succinic Acid Producers Escherichia Coli NZN111, AFP111, BL21, and Actinobacillus succinogenes 130ZT. J. Microbiol. 2010, 48, 290–296. [Google Scholar] [CrossRef] [PubMed]
- Corona-González, R.I.; Bories, A.; González-Álvarez, V.; Pelayo-Ortiz, C. Kinetic Study of Succinic Acid Production by Actinobacillus succinogenes ZT-130. Process Biochem. 2008, 43, 1047–1053. [Google Scholar] [CrossRef]
- 545: TRYPTONE SOYA BROTH (TSB). Available online: https://www.dsmz.de/microorganisms/medium/pdf/DSMZ_Medium545.pdf (accessed on 3 July 2024).
- Wang, Z.; Li, H.; Feng, J.; Zhang, A.; Ying, H.; He, X.; Jiang, M.; Chen, K.; Ouyang, P. Enhanced Succinic Acid Production from Polyacrylamide-pretreated Cane Molasses in Microbial Electrolysis Cells. J. Chem. Tech. Biotech. 2018, 93, 855–860. [Google Scholar] [CrossRef]
- Tix, J.; Moll, F.; Krafft, S.; Betsch, M.; Tippkötter, N. Hydrogen Production from Enzymatic Pretreated Organic Waste with Thermotoga Neapolitana. Energies 2024, 17, 2938. [Google Scholar] [CrossRef]
- Zhang, W.; Yang, Q.; Wu, M.; Liu, H.; Zhou, J.; Dong, W.; Ma, J.; Jiang, M.; Xin, F. Metabolic Regulation of Organic Acid Biosynthesis in Actinobacillus succinogenes. Front. Bioeng. Biotechnol. 2019, 7, 216. [Google Scholar] [CrossRef]
- Guarnieri, M.T.; Chou, Y.-C.; Salvachúa, D.; Mohagheghi, A.; St. John, P.C.; Peterson, D.J.; Bomble, Y.J.; Beckham, G.T. Metabolic Engineering of Actinobacillus succinogenes Provides Insights into Succinic Acid Biosynthesis. Appl. Environ. Microbiol. 2017, 83, e00996-17. [Google Scholar] [CrossRef]
- Zou, W.; Zhu, L.-W.; Li, H.-M.; Tang, Y.-J. Significance of CO2 Donor on the Production of Succinic Acid by Actinobacillus succinogenes ATCC 55618. Microb. Cell Fact. 2011, 10, 87. [Google Scholar] [CrossRef]
- Chassagnole, C.; Noisommit-Rizzi, N.; Schmid, J.W.; Mauch, K.; Reuss, M. Dynamic Modeling of the Central Carbon Metabolism of Escherichia coli. Biotech. Bioeng. 2002, 79, 53–73. [Google Scholar] [CrossRef] [PubMed]
- Mokwatlo, S.C.; Nicol, W. Structure and Cell Viability Analysis of Actinobacillus succinogenes Biofilms as Biocatalysts for Succinic Acid Production. Biochem. Eng. J. 2017, 128, 134–140. [Google Scholar] [CrossRef]
- Van Eunen, K.; Rossell, S.; Bouwman, J.; Westerhoff, H.V.; Bakker, B.M. Quantitative Analysis of Flux Regulation Through Hierarchical Regulation Analysis. In Methods in Enzymology; Elsevier: Amsterdam, The Netherlands, 2011; Volume 500, pp. 571–595. ISBN 978-0-12-385118-5. [Google Scholar]
- Long, C.P.; Antoniewicz, M.R. High-Resolution 13C Metabolic Flux Analysis. Nat. Protoc. 2019, 14, 2856–2877. [Google Scholar] [CrossRef] [PubMed]


Disclaimer/Publisher’s Note: The statements, opinions and data contained in all publications are solely those of the individual author(s) and contributor(s) and not of MDPI and/or the editor(s). MDPI and/or the editor(s) disclaim responsibility for any injury to people or property resulting from any ideas, methods, instructions or products referred to in the content. |
© 2025 by the authors. Licensee MDPI, Basel, Switzerland. This article is an open access article distributed under the terms and conditions of the Creative Commons Attribution (CC BY) license (https://creativecommons.org/licenses/by/4.0/).