Article

The Effect of Skin Contact, β-Lyase and Fermentation Gradient Temperature on Fermentation Esters and Free Volatile Thiols in Oregon Chardonnay Wine

by
Angelica Iobbi
1,
James Osborne
1,
Yanming Di
2 and
Elizabeth Tomasino
1,*
1
Department of Food Science and Technology, Oregon State University, Corvallis, OR 97331, USA
2
Department of Statistics, Oregon State University, Corvallis, OR 97331, USA
*
Author to whom correspondence should be addressed.
Fermentation 2025, 11(5), 250; https://doi.org/10.3390/fermentation11050250
Submission received: 13 March 2025 / Revised: 24 April 2025 / Accepted: 27 April 2025 / Published: 1 May 2025
(This article belongs to the Special Issue Alcoholic Fermentation)

Abstract

:
This study investigated specific winemaking procedures that could increase fermentation esters and volatile thiols in Chardonnay wine during fermentation. These compounds together are known to cause tropical fruit aromas. Two levels of pre-fermentative skin contact (10 °C for 18 h) (yes/no), two levels of β-lyase addition (40 μL/L) (yes/no), and three levels of fermentation gradient temperature, FG0 (constant 13 °C), FG1 (started at 20 °C and after 96 h dropped to 13 °C), and FG2 (started at 20 °C and after ~11.5 °Brix dropped to 13 °C), were evaluated using laboratory-scale ferments in a full factorial design. Esters and the volatile thiols, 3-sulfanylhexan-1-ol (3SH), 3-sulfanylhexyl acetate (3SHA), and 4-methyl-4-sulfanylpentan-2-one (4MSP), were quantified using gas and liquid chromatography methods, respectively. The combination of skin contact and FG1 or FG2 resulted in the greatest levels of esters and thiols in Chardonnay wine. The fermentation gradient was shown to be efficient in reducing volatile compounds normally lost due to evaporation during fermentation. With these different processing techniques, it will be possible for winemakers to achieve different wine qualities depending on their chosen wine style.

1. Introduction

Several winemaking practices have been efficiently used to alter and improve the aroma quality of white wines [1]. Known practices, such as the use of different yeast strains, the addition of sulfur dioxide to prevent oxidation, pre-fermentation skin contact, fermentation temperature, vessel type and use of oak, among others, can produce different wine styles [2,3,4,5]. A wide array of Chardonnay wine styles can be found in the market, from oaky and buttery to floral and fruity [1]. The creation of these various Chardonnay styles is due to specific winemaking processes and the volatile compounds associated with these processes, as Chardonnay is considered an aromatically neutral wine grape. For example, the presence of oak lactones and aldehydes, from the usage of oak during winemaking or aging, is responsible for the oaky and buttery styles [6]. Varietal compounds, such as monoterpenes and volatile thiols, extracted during wine processing, cause the floral and fruity aromas in white wines [7,8].
Chardonnay grapes are grown in every wine region in the world and are an economically important wine grape [1]. In Oregon (USA), Chardonnay is the third most widely planted grape variety [9]. Depending on where the grape is grown, grape quality and the resulting wine style can vary [10]. With ever-changing, growing challenges due to climate change, understanding the cause of specific aroma quality markers and processes that can impact their formation is important for winemakers to achieve the wine quality and style they desire.
Chardonnay wines can contain tropical fruit aroma characteristics (such as passionfruit, grapefruit, and guava) [11]. Research has shown the presence of cysteinylated and glutathionylated precursors of volatile thiols in Chardonnay clusters [12]. During fermentation, these compounds are released to their aroma-active form of volatile thiols [13]. The concentration of volatile thiols in Chardonnay wines from Australia was found at concentrations well above their perception threshold [14]. Further sensory analysis revealed that these wines had tropical fruit aromas, which were well accepted by Australian consumers in their study [14]. Tropical fruit aromas have been shown to be an important fruity aroma descriptor in commercially available Chardonnay wine produced in Oregon [15]. However, the volatile composition of Chardonnay wine from Oregon and the causes of tropical fruit aroma are unclear.
Volatile thiols 3-sulfanylhexan-1-ol (3SH), 3-sulfanylhexyl acetate (3SHA), and 4-methyl-4-sulfanylpentan-2-one (4MSP) are typically associated with Sauvignon Blanc wines [16]. They are potent aroma compounds, found in trace levels in wine (ng/L range), and impart passionfruit, grapefruit, guava, citrus peel, and boxwood aromas [17,18]. During fermentation, 3SH and 4MSP are formed from their precursors by β-lyase enzymes present in yeast [18]. The compound 3SHA is formed by the acetylation of 3SH by the yeast enzymeacetyltransferase Atf1p [18]. Strong correlations have been found between these thiols and the tropical fruit aroma of Sauvignon Blanc wines [14,19,20,21]. Additional work has shown that, at concentrations found in Chardonnay wines, the volatile thiols alone impart grassy and earthy aromas and are not the cause of tropical fruit aromas [22]. A tropical fruit aroma was achieved with ester and thiol combinations or esters themselves [19,22]. Based on these findings, winemaking processes that support the formation of thiols and esters are needed if tropical fruit aroma notes are desired in the final wine.
When attempting to increase ester and thiol compounds in wine, much research has been conducted investigating yeast strains and must supplementation, as they play a fundamental role in volatile compound synthesis [23]. Despite the focus on these winemaking practices, other wine processes may alter the content of esters and thiols in wine. Fermentation temperature is known to influence the formation and retention of aroma compounds [24]. When considering white wine styles with higher levels of esters and thiols, fermentation temperature offers a challenge as it is an antagonistic process for these aroma families: higher fermentation temperature increases thiol production, but higher temperature is known to reduce ethyl esters [24,25,26]. A fermentation temperature regime, where the fermentation temperature is purposely changed during fermentation, could affect the process to obtain wines with greater levels of esters and thiols [19].
The objective of this work was to investigate specific winemaking processes, besides yeast strain or must nutrition, that could increase the concentrations of both esters and thiols in Chardonnay wine from Oregon. These processes, including pre-fermentation skin contact, the addition of commercially available β-lyase, and two fermentation gradient temperature schemes, were investigated on the production of ethyl esters and thiols in Chardonnay wine. This was conducted using full fermentation replicates. By understanding which processes alter aroma composition, which in turn alters wine aroma quality, winemakers will be able to achieve their desired wine quality and styles despite the potential for challenging growing conditions each year.

2. Materials and Methods

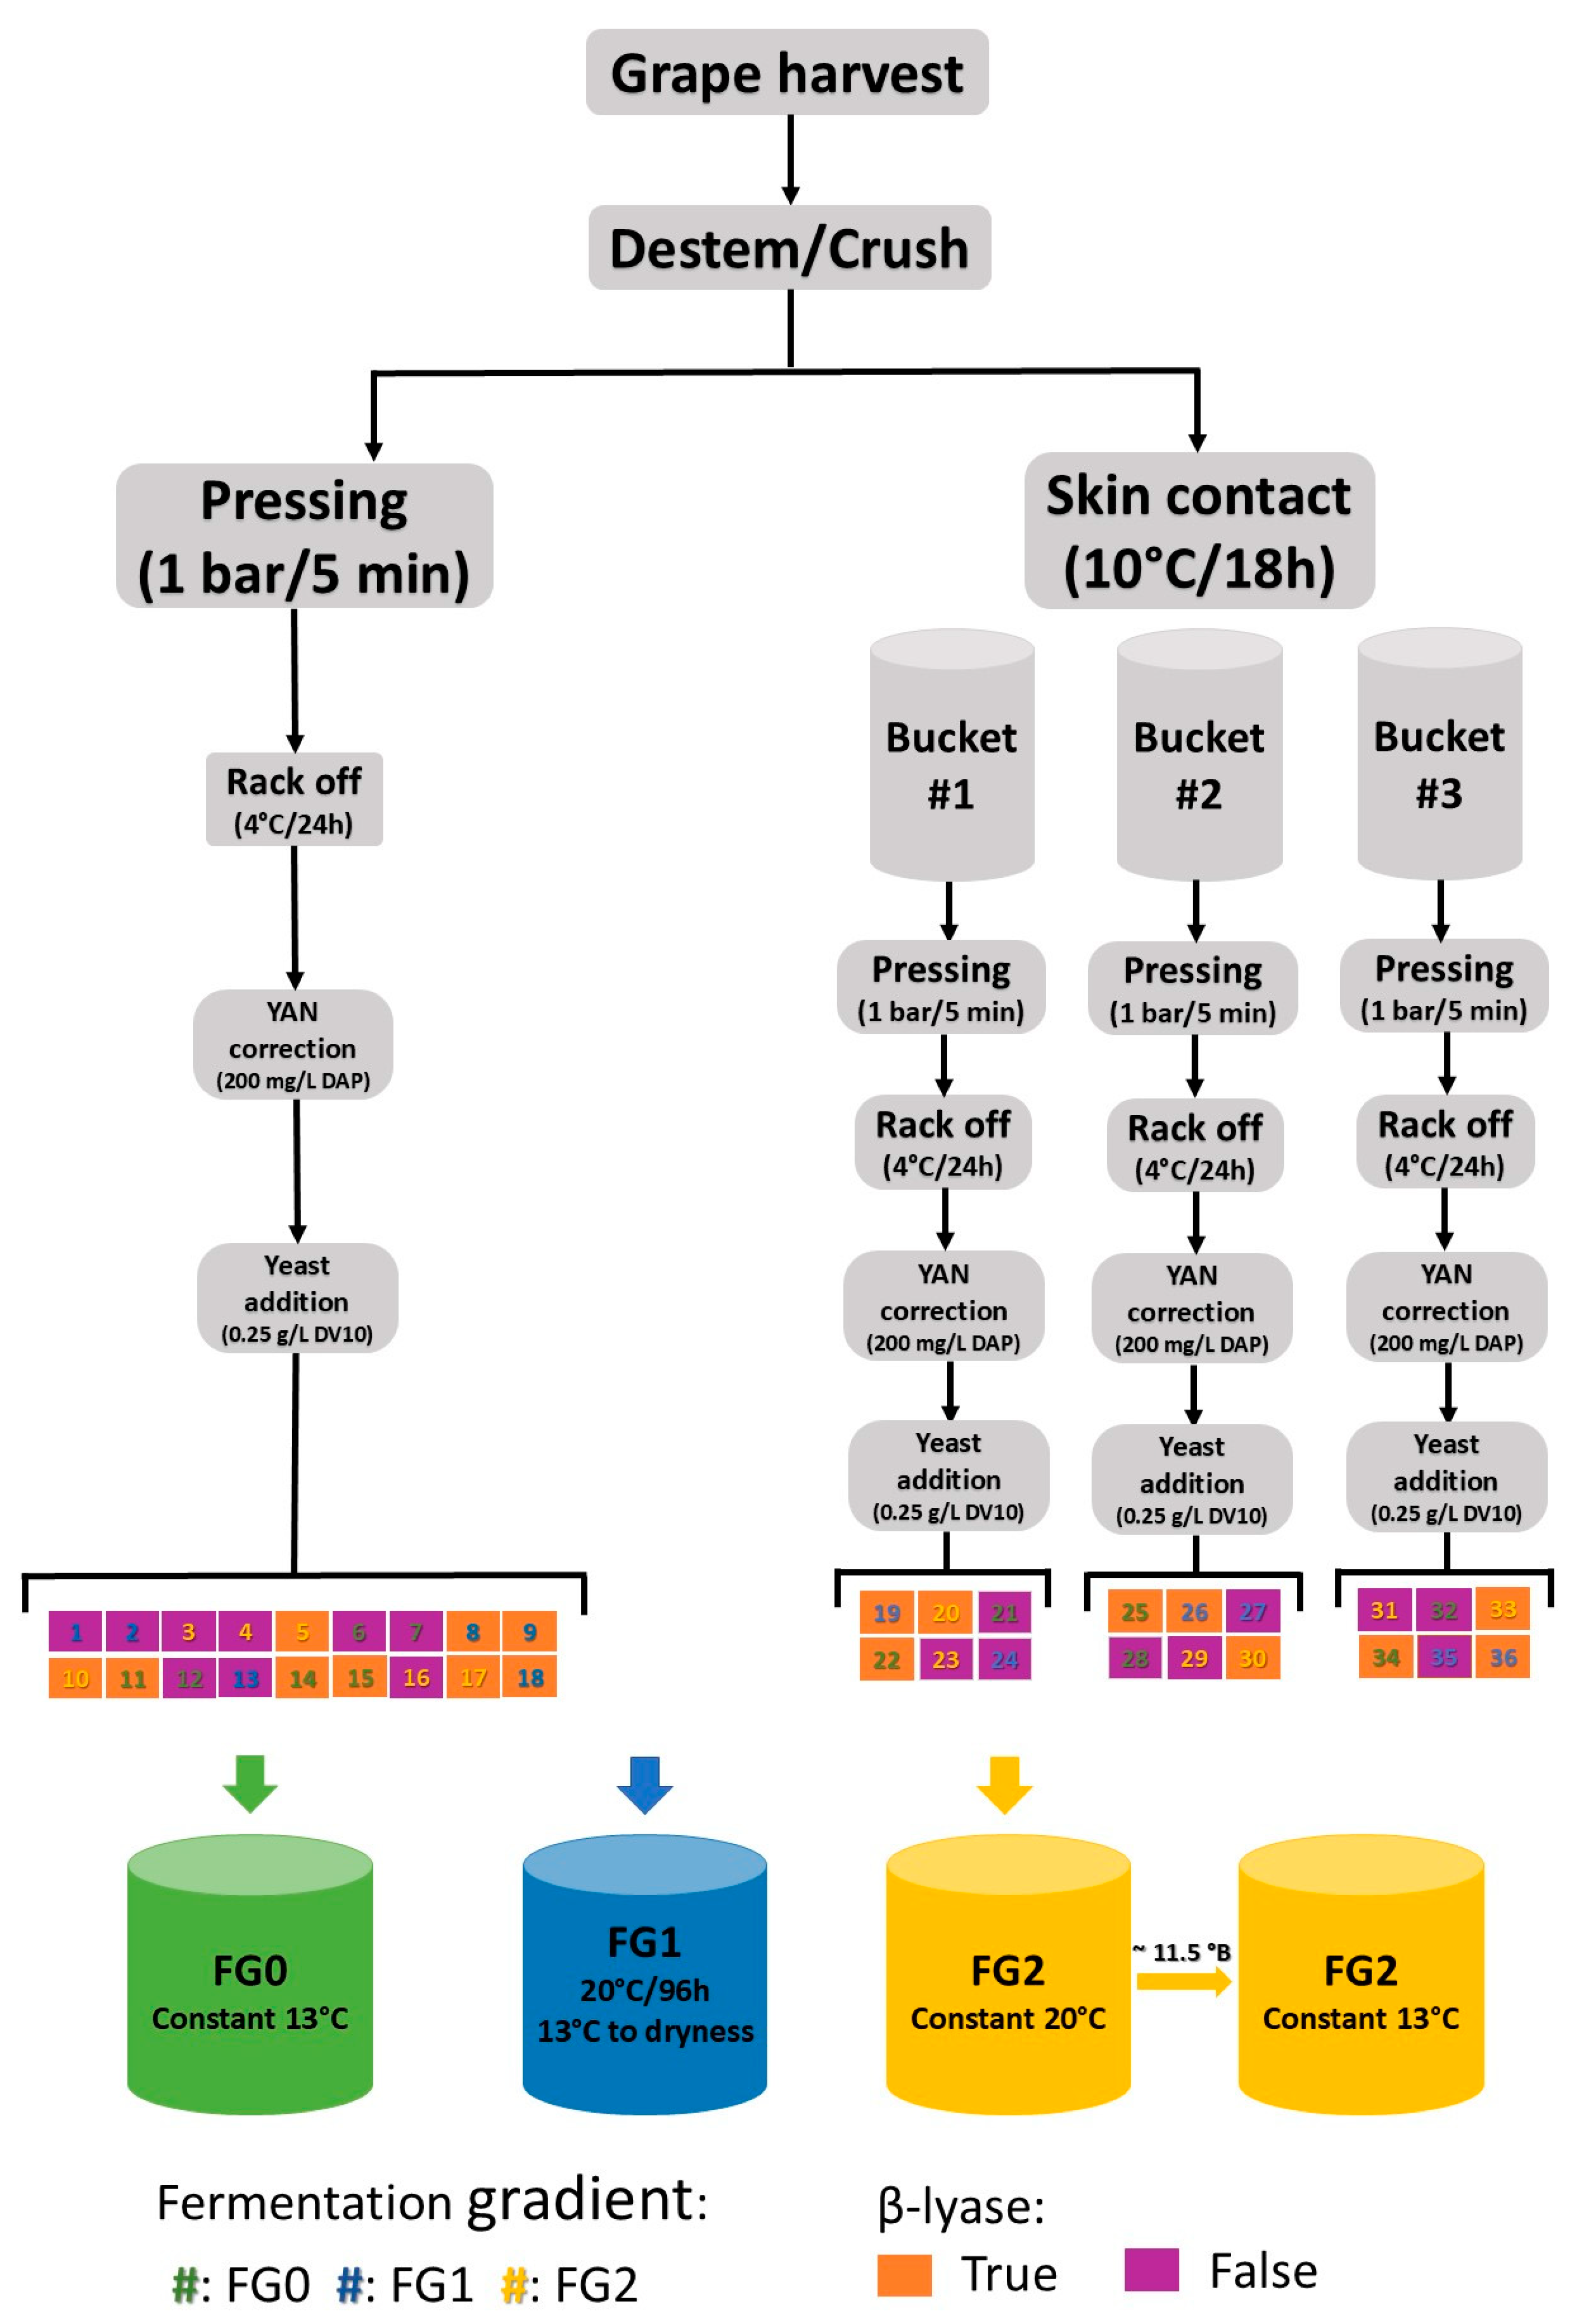
2.1. Experimental Design

Three factors were evaluated using a 2 × 2 × 3 factorial design, resulting in twelve combinations (Table 1). A complete repetition of the experiment (R1 and R2) was performed to ensure that the outcomes of this study were a result of the factors investigated. Each combination was performed in triplicate, resulting in 36 experimental units for each experimental repetition (72 experimental units total). As the number of experimental units was large, 1 L fermentation volume (laboratory-scale ferments) was used to screen for treatment combinations that resulted in higher concentrations of yeast-derived esters and volatile thiols. The different treatments were assigned to four stainless steel glycol-jacketed 100 L fermentation tanks in which fermentation schedules (FG0, FG1, and FG2) occurred (Figure 1). Those tanks were considered the main source of variation in the experiment due to temperature fluctuations that could occur. Treatments assigned to the same fermentation schedule were not independent of each other as they occurred in the same tank.

2.2. Winemaking Protocol

Approximately 1 ton of Chardonnay grapes was harvested in October 2020 (~23 °Brix, clone 108, rootstock 101-14). Grapes were grown at Oregon State University (OSU) Woodhall Vineyard in Monroe, Oregon. After being transported to the OSU winery, they were stored overnight at 4 °C. The following day, grapes were evenly split for repetition 1 and repetition 2 (R1 and R2) and were processed as shown in Figure 1. The only differences between R1 and R2 were the different bottle randomizations assigned to the treatment factors as well as the fermentation tanks. All 1 L bottles used for the laboratory-scale ferments were sterilized at 121 °C for 15 min in an autoclave (CSS, Billerica, MA, USA), and autoclave-indicative tape (Fisher Scientific, Waltham, MA, USA) was used to ensure that sterilization was successful.
Grape processing was as follows: Grapes were destemmed and crushed using a stainless steel motorized grape crusher/destemmer (VLS Technologies, Treviso, Italy). The crushed grapes were subsequently split into two equal parts, in which one part went through skin contact and the other did not. The part that did not go through skin contact (T1, T3–5, and T9–10) was pressed for 5 min at 1.5 bar using a pneumatic press (Europress, Donald, OR, USA). After pressing, the juice was transferred to a 100 L stainless steel tank, 50 mg/L SO2 (as K2S2O5) was added, and the juice settled for 24 h at 4 °C. The following day, the no skin contact juice was racked off to another 100 L stainless steel tank to eliminate solids. The yeast assimilable nitrogen (YAN) concentration was corrected by topping up to 200 mg/L with the addition of diammonium phosphate (DAP). The juice was poured into 1 L fermentation bottles (VWR, Radnor, PA, USA), closed with airlock silicone bungs, labeled, and stored at 10 °C overnight. The bottles were brought to room temperature (~ 20 °C) for yeast inoculation. Saccharomyces cerevisiae DV10 (Lallemand, Montreal, Canada) was added to all bottles at a rate of 0.25 g/L following the manufacturer’s instructions. Endozym Thiol (AEB®, California, USA) was added at 40 μL/L to the previously assigned bottles on the second day of fermentation, following the manufacturer’s instructions.
Crushed grapes belonging to the skin contact treatments (T2, T6–8, and T11–12) were evenly split into three plastic buckets. Skin contact was performed at 10 °C for 18 h. The content from the three buckets was pressed individually, 50 mg/L SO2 was added, and was stored at 4 °C to settle for 24 h, following the same procedures used for the no skin contact trial until fermentation completion.
Four stainless steel glycol-jacketed 100 L fermentation tanks (AAA, The Dalles, OR, USA) were used as water baths and previously tested to ensure tanks reached and maintained the desired water temperatures. Water was filled up to the bottleneck level to avoid differences in temperature inside the bottles. The temperatures and the levels of each FG schedule for each tank were as follows:
  • Tank 1: set at a constant 13 °C for the FG0 schedule;
  • Tank 2: set at 20 °C for 96 h and dropped to 13 °C for the FG1 schedule;
  • Tank 3: set at a constant 20 °C for the FG2 schedule;
  • Tank 4: set at a constant 13 °C for the FG2 schedule.
The bottles were randomly assigned to the fermentation gradient schedules (tanks FG0, FG1, and FG2) using a balanced design, in which each tank contained 12 bottles (Figure 1). As the temperature drop for FG2 was associated with the level of sugar in the ferments and variations between bottles were anticipated, a fourth tank was required for this schedule. Alcoholic fermentation was monitored daily by changes in degree Brix over time using a digital densitometer (Anton Paar, Santner Foundation, Graz, Austria). When the sugar content in the bottles associated with the FG2 schedule was ~11.5 °Brix, measurements were taken twice daily to ensure that the transfer from tank 3 to tank 4 was successful. The laboratory-scale ferments were fermented to dryness. Upon fermentation completion, 50 mg/L of SO2 was added to all wines, and they were cold settled at 4 °C for ~48 h and racked off to clean and sanitized 1 L media bottles. The wines were subsequently sampled in duplicate using 50 mL Falcon conical centrifuge tubes (VWR, Radnor, PA, USA) and stored at −20 °C until volatile analysis. One aliquot of 150 mL was collected for further analysis.

2.3. Basic Wine Chemistry

YAN, sugar content (°Brix), and titratable acidity (TA) were measured in the juice sample in duplicate. The concentration of juice YAN was calculated from the sum of free amino acid-N (FAN-N) as determined by the OPA (o-Phthaldialdehyde) colorimetric assay and ammonium-N by enzymatic assay (Ammonia assay kit, Sigma-Aldrich, St. Louis, MO, USA). The sugar content was determined using a digital densitometer (Anton Paar, Santner Foundation, Graz, Austria), and TA was measured by titration with 0.1 N NaOH [27].
Titratable acidity, pH, residual sugars, malic acid, acetic acid, and ethanol were measured within approximately 2 months after winemaking. A pH meter was used to determine the concentration of hydrogen ions in solution (Thermo Fisher Scientific, Waltham, MA, USA), and TA was measured by titration with 0.1 N NaOH. Residual sugars, malic acid, and acetic acid were measured by enzymatic test kits (Megazyme, Bray, Ireland), and ethanol was determined using an Alcolyzer (Anton Paar, Santner Foundation, Graz, Austria). All basic chemistry analyses were performed in duplicate.

2.4. Ester Analysis

2.4.1. Chemicals

Analysis parameters, compound purity, and supplier information for all volatile compounds are found in Tables S1 and S2. The purity of all reference and isotopically labeled (deuterated) compounds and their retention times were checked prior to use by GC-MS at a concentration of 5 mg/L. Milli-Q water was obtained from a Millipore Continental water system (EMD-Millipore, Billerica, MA, USA). HPLC-grade ethyl alcohol was obtained from Pharmco-AAPER (Vancouver, WA, USA).

2.4.2. Preparation of Standards

The concentration of esters in the samples was determined using a stable isotope dilution assay (SIDA) [28]. Reference and isotopically labelled internal standard stock solutions (1 g/L) of each compound were prepared in 100% ethanol, except for ethyl butanoate (3 g/L), 3-methylbutyl acetate (5 g/L), and ethyl acetate (40 g/L), which required higher concentrations based on the levels anticipated in the wines. Subsequently, two composites were made from reference and internal standards, separately, by combining the standard stock solutions at specific concentrations in 14% (v/v) aqueous solutions. Standard stock solutions and composites were stored at −20 °C until use. A six-point calibration curve was created by adding 100 µL of the internal standard and the reference standards to the desired concentrations into a dearomatized white wine (Tables S1 and S2). All compounds were quantified using six-point calibration curves.

2.4.3. Sample Preparation

For wine analysis, 500 uL aliquots of each wine sample and 8.4 mL matrix (1 g/L citric acid solution with saturated NaCl), followed by 100 uL of composite internal standard solution, were added to a Solid Phase Micro-Extraction (SPME) vials (Restek Corp., Bellefonte, PA, USA), which were tightly capped with 18 mm PTFE-lined screw caps (Sigma-Aldrich, St. Louis, MO, USA). All samples were held at 8 °C prior to SPME injection in a stacked cooler attached to the Combi-Pal autosampler (CTC-Analytics, Zwingen, Switzerland). All wine samples were analyzed in duplicate.

2.4.4. Headspace Solid-Phase Microextraction Gas Chromatography Mass Spectrometry (HS-SPME-GC-MS)

Stableflex Divinylbenzene/Carboxen/Polydimethylsiloxane (DVB/CAR/PDMS) SPME fibers (50/30 µm thickness, 2 cm long, 24 gauge) were purchased from Supelco (Bellafonte, Pennsylvania, USA). This fiber is compatible with the analysis of volatile and semi-volatile flavor compounds containing 3–20 carbon units. Extraction and desorption conditions were optimized to obtain the best compromise for the simultaneous analysis of all 30 studied esters. To provide specificity for the method, deuterated ethyl esters were used as internal standards. The SPME fiber was conditioned at 250 °C in the injection port for 1 h prior to use on a conditioning station attached to the Combi-Pal autosampler used with the Shimadzu GC-MS instrument (Shimadzu Scientific Instruments, Kyoto, Japan). The SPME fiber was further conditioned before each sample analysis at 250 °C for 10 min and replaced with a new one after approximately 224 samples.
Calibration curves of all ester compounds were calculated using two methods. It was not possible to employ a single GC-MS procedure to determine all compounds measured in this study due to a few compounds having similar retention times, which required two headspace-solid phase microextraction (HS-SPME)-GC-MS methods to achieve the desired separation and the sensitivity needed for accurate quantitation.
  • Method 1: Nineteen ester compounds were analyzed by adapting a method for the quantitative determination of wine esters by (HS-SPME)-GC-MS [29]. Briefly, samples were analyzed in a Shimadzu QP2010 GC-MS instrument (Shimadzu Scientific Instruments, Kyoto, Japan) equipped with a CTC Combi-Pal autosampler (CTC-Analytics) and with a split injector. The chromatography configuration contained two columns connected in sequence, Stablewax (30 m × 0.25 mm ID × 0.25 µm film thickness, Restek Corp., Bellefonte, PA, USA) connected to an Rxi column (15 m × 0.25 mm ID × 0.25 µm film thickness, Restek Corp., Bellefonte, PA, USA) using a universal press-tight connector (Restek Corp., Bellefonte, PA, USA). The method parameters for the oven were as follows: the injector temperature was set at 250 °C. The column oven was held at 35 °C for 10 min and then increased to 250 °C at 4 °C/min and held at this temperature for 10 min. The flow control mode was set using the pressure mode at a constant 32.2 kPa. The prepared diluted (tenfold) samples were incubated and agitated for 10 min at 60 °C. The GC used helium as the carrier gas, set at a linear velocity of 21.5 cm/s. The ion source and interface temperatures were set at 200 °C and 250 °C, respectively. The MS spectra were operated in electron impact (EI) mode at an ionization energy of 70 eV, switching between full scan mode and selective ion mode (SIM), with variable gain factors for SIM mode (Tables S3 and S4). The total run time was 73.75 min per sample. The MS acquisition mode was set to full scan for all 41 compounds. The NIST05 (National Institute of Standards and Technology) mass spectral library and reference standards, composed of pure compounds, were used to confirm the identities of all standards used. Quantitative parameters for all compounds and labelled standards are shown in Table S1.
  • Method 2. Nineteen ester compounds were analyzed using a similar procedure to method 1. Quantitative parameters for all compounds and labelled standards are shown in Table S2. The oven ramp and MS spectra mode for full scan and SIM modes were altered from method 1 based on the different compounds analyzed (Tables S5 and S6). The column oven was held at 35 °C for 10 min, and then increased to 200 °C at 4 °C/min and held at this temperature for 1 min, then increased to 250 °C at a rate of 10 °C/min and held at that temperature for 5 min.

2.5. Volatile Thiol Analysis

2.5.1. Chemicals

Chemicals used for analysis included 3-sulfanylhexan-1-ol (CAS#51755-83-0, <100%), 3-sulfanylhexyl acetate (CAS#136954-20-6, ≥98%), 4-methyl-4-sulfanylpentan-2-one (CAS#19872-52-7, ≥95%), carbon tetrachloride (CAS#56-23-5, 99.9%), and acetyl chloride-d3 (CAS#19259-90-6), purchased from Sigma-Aldrich (St. Louis, MO, USA). Milli-Q water was obtained from a Millipore Continental water system (EMD-Millipore, Billerica, MA, USA). HPLC grade ethyl alcohol was obtained from Pharmco-AAPER (Vancouver, WA, USA).

2.5.2. Internal Standard Synthesis

The internal standard d3-3SH was synthesized as follows. To a solution of 3-sulfanylhexan-1-ol (1.34 g, 10.0 mmol) in carbon tetrachloride (10 mL, 1 M), at room temperature, was added acetylchloride-d3 (1.22 g, 15.0 mmol). The reaction mixture was stirred for 12 h. The reaction mixture was concentrated by rotary evaporation. Flash column chromatography gave the following products (1.76 g, 10.0 mmol, 100%): 1H NMR (700 MHz, CDCl3) δ 4.27–4.21 (m, 2 H), 2.88 (qt, J = 8.4, 4.2 Hz, 1 H), 2.04–1.99 (m, 1 H), 1.72 (tq, J = 9.8, 5.6 Hz, 1 H), 1.65–1.62 (m, 1 H), 1.56–1.47 (m, 2 H), 1.44–1.40 (m, 1 H), 1.38 (d, J = 7.0 Hz, 1 H), 0.92 (t, J = 7.0 Hz, 3 H):13C NMR (176 MHz, CDCl3) δ 171.2, 62.2, 41.2, 37.7, 37.4, 20.4 (m, J = 19.4 Hz), 20.2, 13.8.

2.5.3. Volatile Thiol Derivatization and Concentration

Samples were prepared as described by Capone et al. [30]. Samples were transferred to 2 mL amber screw top vials (9 mm, bonded cap, Thermo Scientific, Waltham, MA, USA), and stored at −20 °C until HPLC-MS/MS analysis. Extractions were performed in duplicate for each sample.

2.5.4. Liquid Chromatography-Tandem Mass Spectrometry (LC-MS/MS) Analysis

Quantitative analysis of thiols was performed on a Waters TQ-XS triple quadrupole with a Waters I class UPLC (Milford, MA, USA). A GL Sciences InertSustain C18 Column, 2.1 mm × 150 mm (Tokyo, Japan), was used. The solvents were MS-grade water and acetonitrile (Fisher Chemical, Fairlawn, NJ, USA) with 0.1% formic acid (Sigma-Aldrich, St. Louis, MO, USA). The linear gradient and flow rates for solvents can be found in Table S7. An injection volume of 3 µL was used. The mass spectrometer was used in Positive MRM ionization mode, and the source conditions were as follows: source temp 150 °C, desolvation temp 600 °C, desolvation gas flow 1000 L/h, cone gas flow 150 L/h. Argon was used as the collision gas and was set to 0.15 mL/min. The triple quadrupole was operated in Positive MRM mode according to the settings found in Table S8. Compounds were identified by comparison to pure compounds that had been through the derivatization procedure. Additional quantification parameters can be found in Table S10. Calibration curve samples were made up in dearomatized wine, as described in Section 2.4.2, and then derivatized.

2.6. Limit of Detection (LOD), Limit of Quantitation (LOQ), and Method Validation

LOD and LOQ were calculated as described in Miller and Miller [31] and Callejon et al. [32] for method 1. For method 2, the LOD and LOQ were calculated using the blank determination method as described in Shrivastava et al. [33]. The standard 4, from the calibration curve, was prepared prior to every analytical run and measured over the course of the analysis period to measure internal standard stability and reproducibility [34]. Composite standards used for the calibration curve were analyzed in duplicate prior to running the samples, with every calibration curve having a high coefficient of determination R2 > 0.99 (Tables S1 and S2). Compound concentrations were obtained by plotting the peak area ratios (peak area of the ester standard/peak area of the corresponding internal standard) against the concentration ratios (ester standard/corresponding internal standard). All (HS-SPME)-GC-MS optimization tests were performed in duplicate.

2.7. Repeatability, Reproducibility, and Accuracy

During each analytical run, the 20th sample was spiked withstandard concentrations used to determine method accuracy. The spiked recoveries were calculated by the difference in concentrations of the compounds between the spiked and the original sample, divided by the concentration of the compounds in standard 4 [34]. As the Chardonnay wines were fermented to dryness and matrix effects were not anticipated, three wine samples were randomly selected and measured over the course of 2 days every 12 h to test for repeatability and reproducibility during each run [35].

2.8. Data Analysis

Three-way ANOVA and Tukey’s honest significant difference (HSD) post hoc adjustment were used to compare the mean differences of esters, thiols, and wine chemistry attributes (pH, tartaric acid, residual sugars, acetic acid, malic acid, and ethanol) measured in wines produced at two levels of skin contact (yes/no), two levels of β-lyase addition (yes/no), and three levels of fermentation gradient temperatures (FG0, FG1, and FG2). The analyses were performed to examine the main effects and interaction effects of the factors on the volatile compounds and wine chemistry attributes. Two-way ANOVA was used to compare the mean concentrations of esters and thiols obtained for each treatment in R1 and R2. Overall, the mean concentrations of esters and thiols were similar between R1 and R2, with R1 showing consistently higher concentrations of volatile compounds for specific compounds in comparison to R2 (Table S8, Figure S1). Therefore, Repetition (R) was treated as a random effect, and skin contact (SC), β-lyase (BL), and fermentation gradient (FG) were treated as fixed effects in this model. Significance was associated with values reported at p-value ≤ 0.05.
Canonical variate analysis (CVA) was used to determine which volatile compounds (esters and thiols) were associated with the wine treatments. The classification variable for CVA was the treatment. The ANOVA models and Tukey HSD tests were performed using SAS® 9.4. CVA analysis was performed using XLSTAT software, version 2021.2.1.1129 (Addinsoft 1995–2019).

3. Results

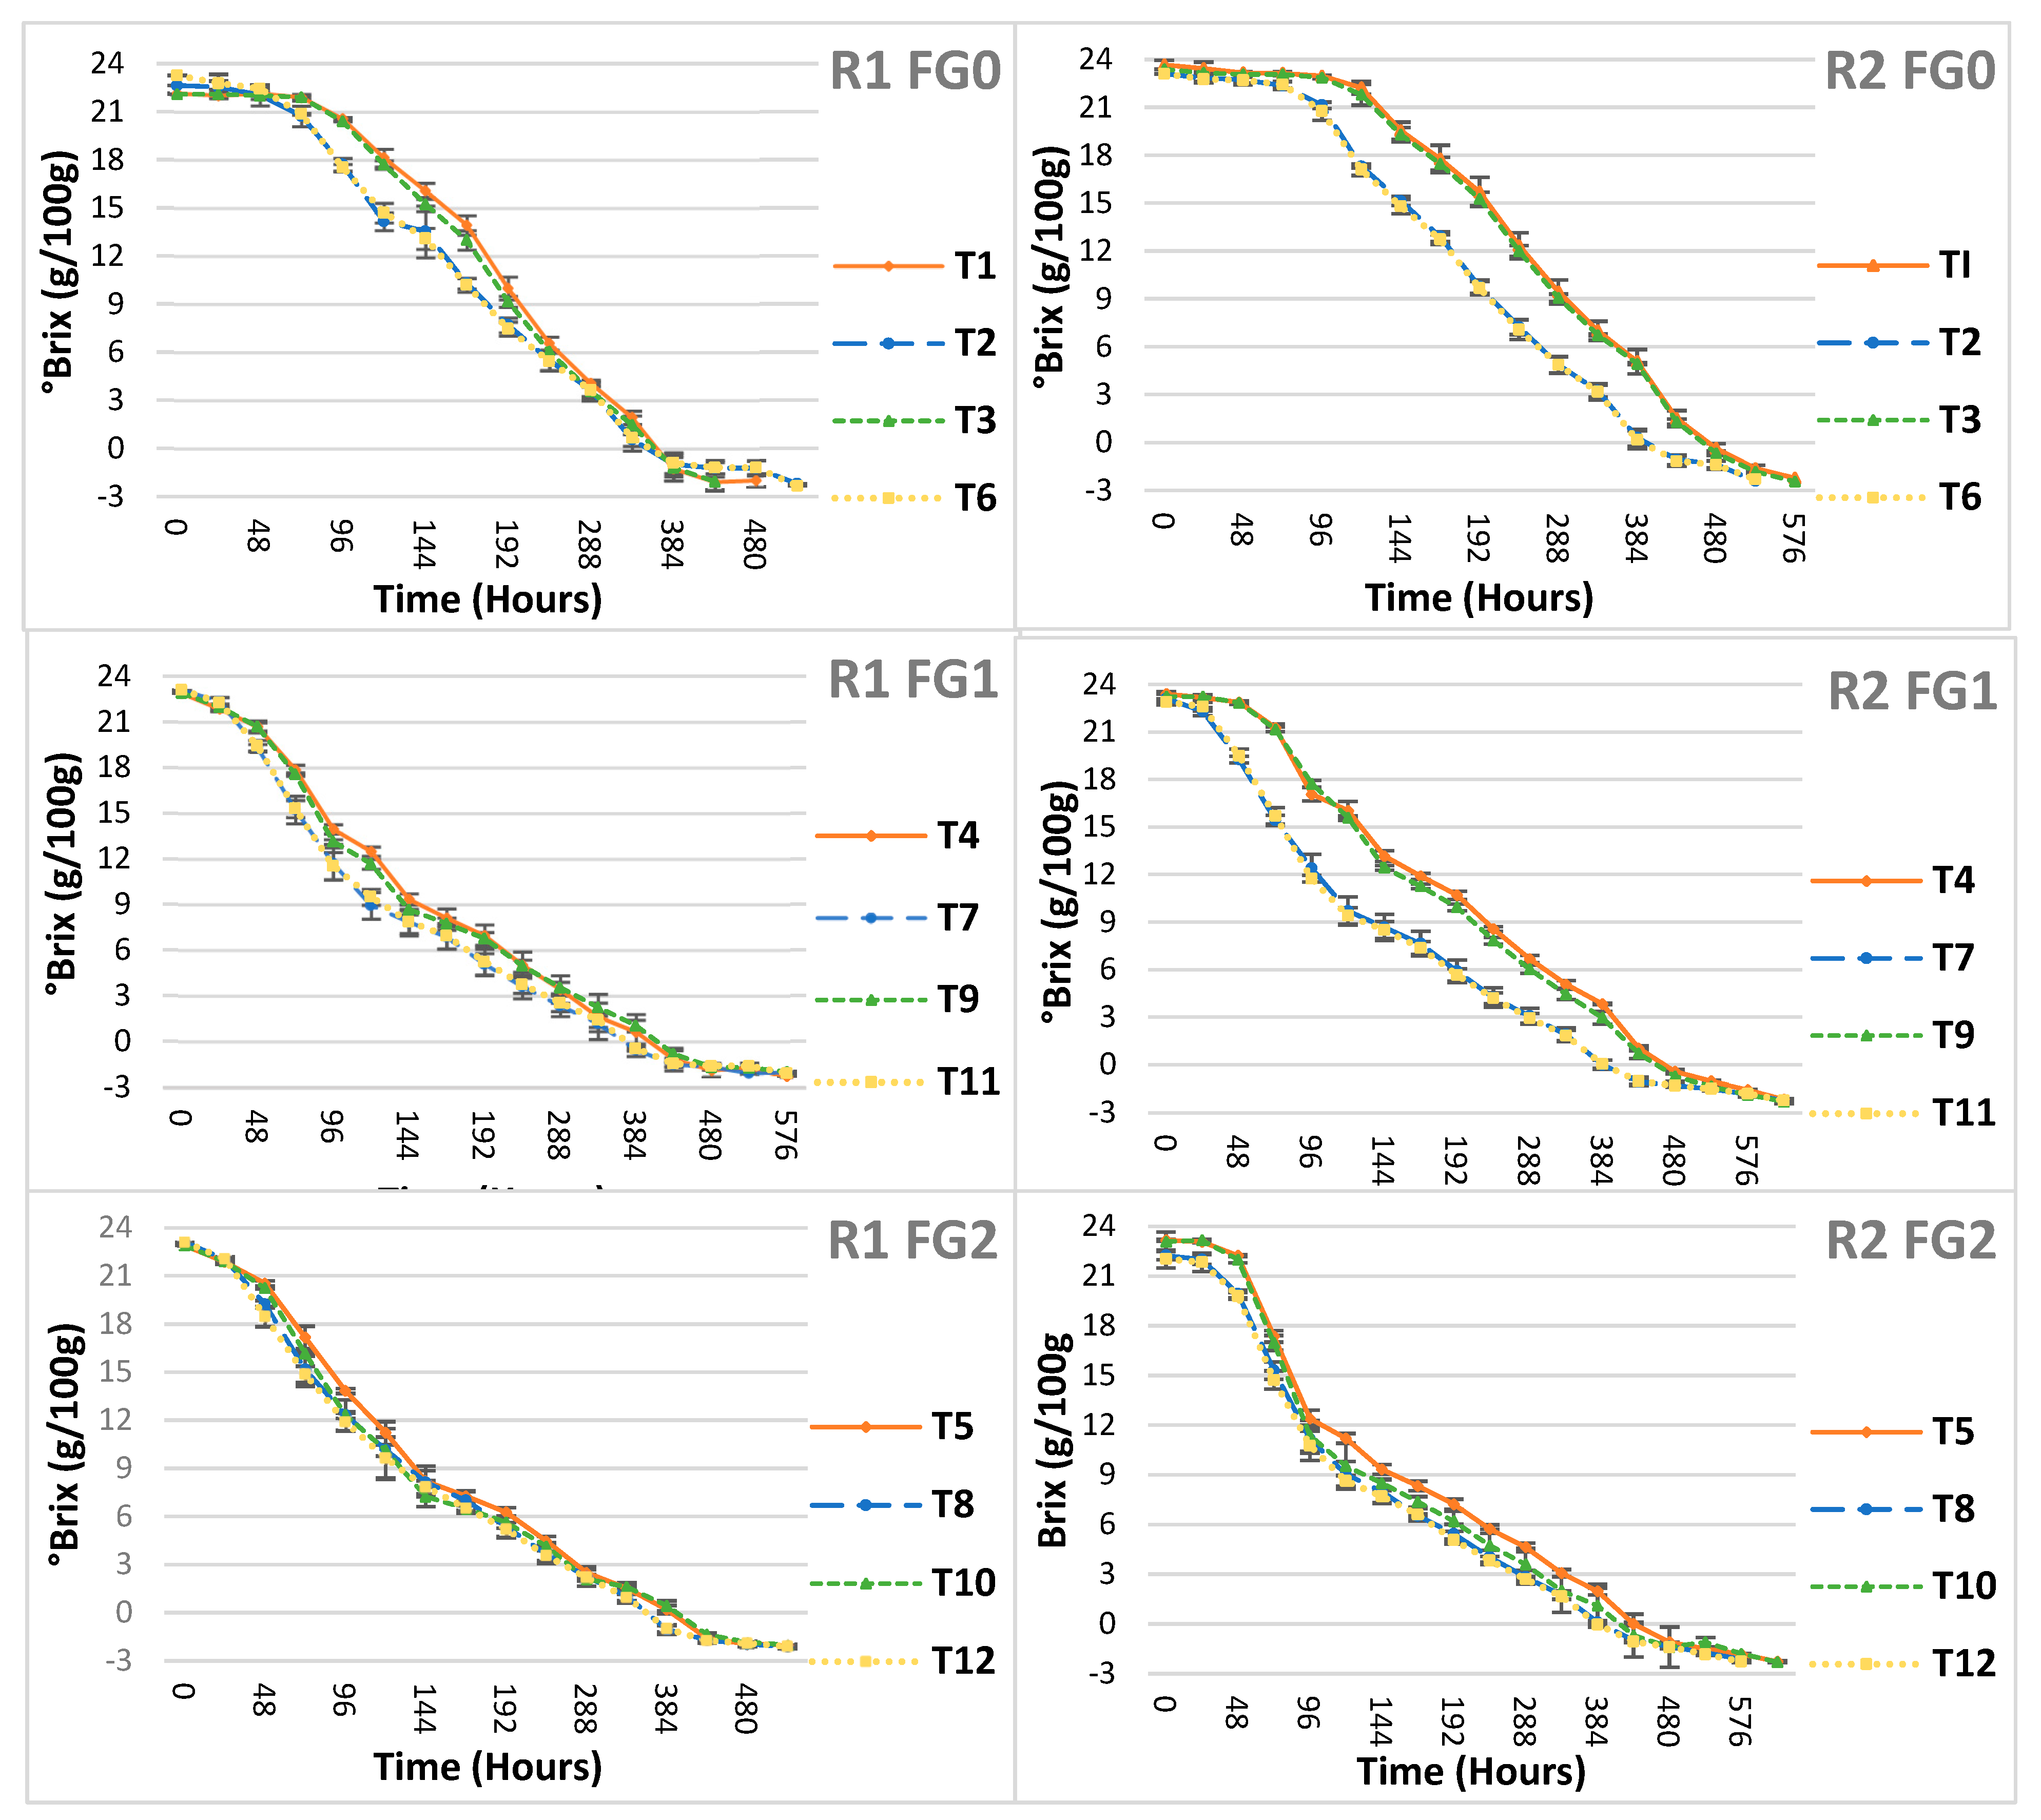
3.1. Experimental Repetitions

The volatile thiols 3SH, 3SHA, and 4MSP did not show significant differences between fermentation replicates, R1 and R2 (α = 0.05). Thirteen out of the thirty ester compounds showed significant differences (α = 0.05) between R1 and R2 (Table S9). Overall, higher mean concentrations for total esters were consistently obtained for R1, except for ethyl furan-2-carboxylate, ethyl nonanoate, and 2-phenylethyl acetate, where mean concentrations were consistently higher for R2 (Figure S1).
In order to visualize any differences between the fermentation replicates, CVA was conducted. The CVA plots for R1 and R2 were similar to each other, except for wine T5 in R2, which was associated with nine ester compounds and separated from the other wine treatments along F1 (Figure S2). The concentrations of most of these nine esters were higher in R1 than R2 for T5 (Table S10), which was consistent with the trends in compound concentrations observed between the experimental repetitions. Therefore, the data from T5 in R2 were maintained in the model. The experimental repetitions show enough evidence that the results were due to the treatment effects, as similar trends in compound concentrations were obtained for R1 and R2.

3.2. Wine Basic Chemistry

The basic chemistry parameters of the wines that showed significant differences among the factors were titratable acidity, residual sugar, acetic acid, and malic acid (Table 2). While differences in the mean values were seen for these attributes, only TA and malic acid showed significant differences based on skin contact. β-lyase did not alter the basic chemistry attributes of the wines. Fermentation gradient schedules FG1 and FG2 showed significantly higher concentrations of TA and residual sugar, but lower concentrations of acetic acid, compared to FG0. Interaction effects between skin contact and fermentation gradient were observed for acetic acid, and between β-lyase and the fermentation gradient for residual sugars (Table S10). The basic chemistry of Chardonnay grape juice is available in Table S11.

3.3. Fermentation Gradient Schedules

The fermentation curves of each schedule for both R1 and R2 are found in Figure 2. Overall, the treatments that underwent skin contact (T2, T6, T7, T8, T11, and T12) showed slightly higher fermentation rates. The fermentation length was between 480 and 624 h (20–26 days), with R2 taking nearly 48 h longer for fermentation to complete in comparison to R1. Fermentation was finished when sugar concentration was approximately −2 °Brix as measured on a digital densitometer. The fermentation temperature changed from 20 °C to 13 °C for FG1 at the ~96th hour. The FG2 temperature change was dependent on the sugar concentration in the wine at approximately 11.5 °Brix (±0.5). This level of Brix occurred between ~96 and 120 h (Table S12). The fermentation rate was slower at the lower temperature for FG1 and FG2.

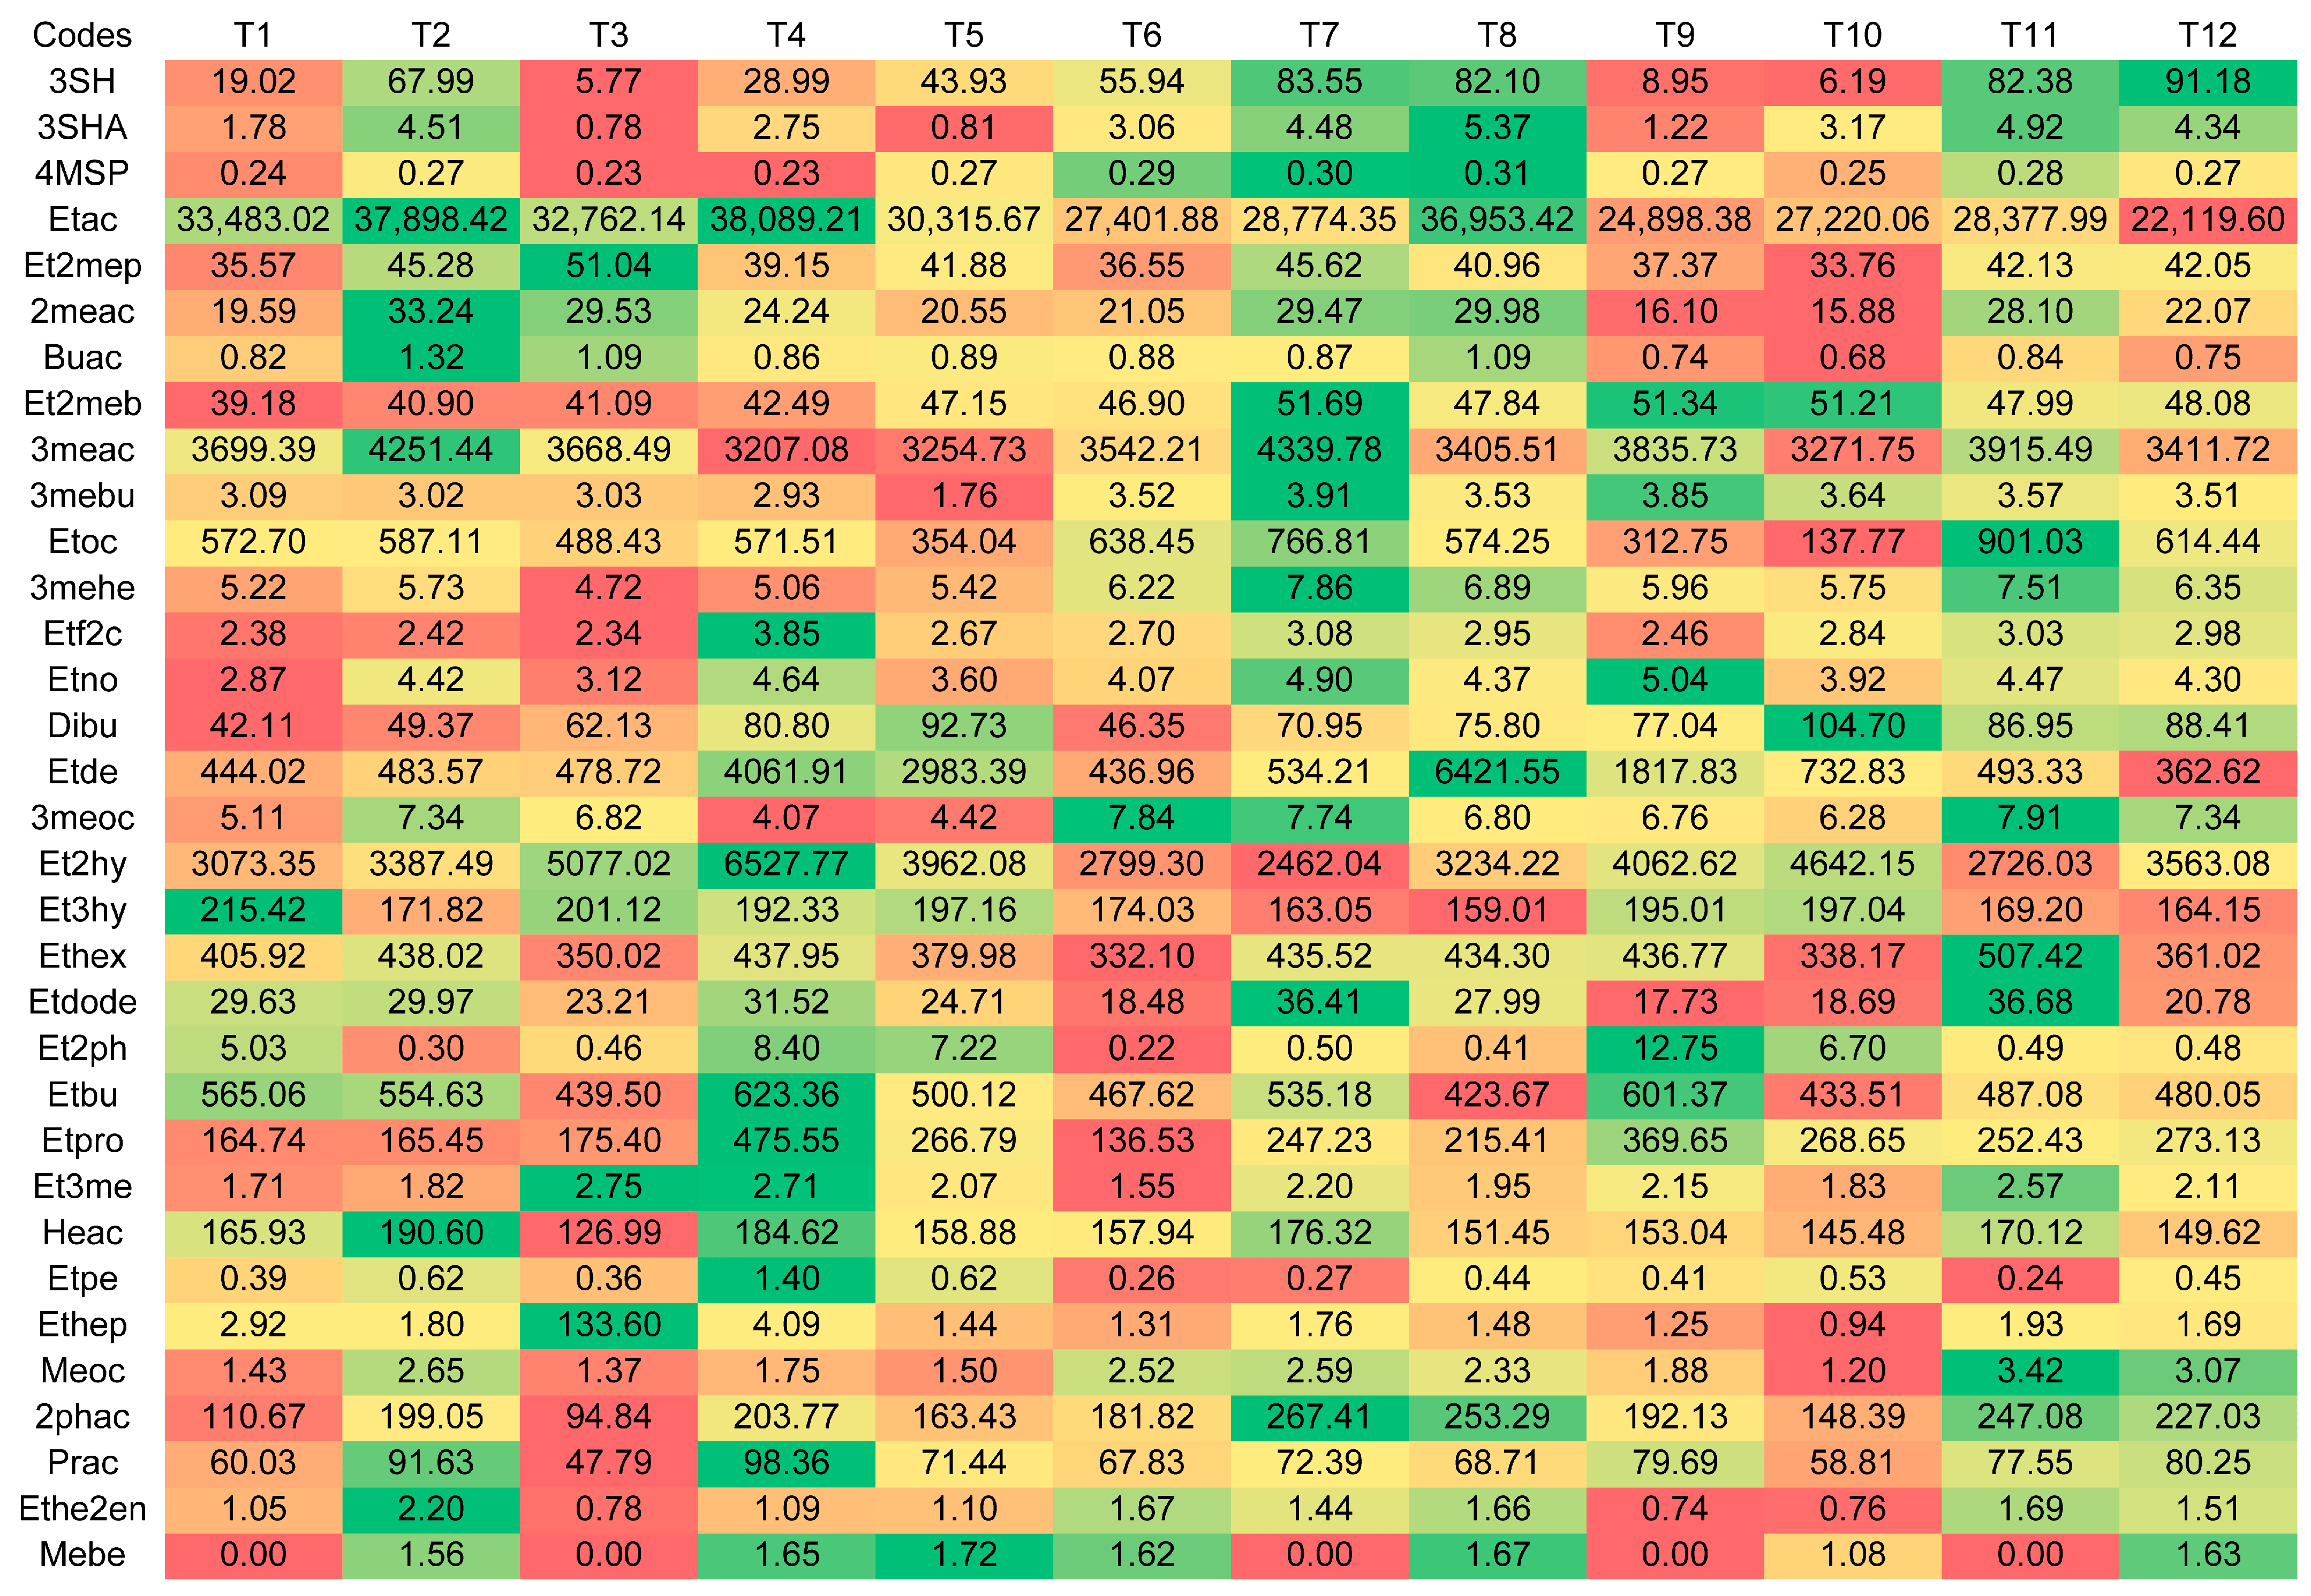
3.4. Ester Concentrations

Thirty ester compounds were measured using method 1 and method 2 (Table 3). All three main factors and their respective levels, skin contact (yes/no), β-lyase (yes/no), and fermentation gradient (FG0, FG1, and FG2) presented significant differences (α = 0.05) for specific esters (Table 3). Eight esters (2-methylpropyl acetate, 3-methylbutyl acetate, 3-methylbutyl butanoate, ethyl octanoate, 3-methylbutyl hexanoate, 3-methylbutyl octanoate, methyl octanoate, and 2-phenylethyl acetate) showed higher concentrations when skin contact was performed as opposed to four esters (ethyl 2-hydroxypropanoate, ethyl 3-hydroxybutanoate, ethyl 2-phenylacetate, and ethyl propanoate), which presented higher concentrations when skin contact was not performed. Three esters (3-methylbutyl butanoate, 3-methylbutyl octanoate, and methyl octanoate) presented higher concentrations when β-lyase was added to the wines, in contrast to not adding this enzyme, which resulted in four esters (butyl acetate, ethyl dodecanoate, ethyl pentanoate, and 2-phenylethyl acetate) with higher concentrations. A total of 19 esters were statistically significant for the fermentation gradient factor. Overall, FG1 and FG2 resulted in higher ester concentrations in comparison to FG0. Some esters increased based on the fermentation gradient, while others were lower in concentration (Table 3).
Twelve esters showed significant differences (α = 0.05) for skin contact and fermentation gradient (SC×FG), followed by seven esters for β-lyase and fermentation gradient (BL×FG), six esters for skin contact and β-lyase (SC×BL), and four esters for skin contact, β-lyase, and fermentation gradient (SC×BL×FG) (Table 4). Interestingly, ester 3-methylbutyl butanoate was strongly significant for all main factors as well as their interactions.

3.5. Thiol Concentrations

The main factors, skin contact and fermentation gradient, showed significant differences (α = 0.05) for the thiol compounds (Table 3). The compound 4MSP was found at significantly higher concentrations when skin contact occurred. It is worth noting that 3SH and 3SHA showed higher concentrations with skin contact, but no statistical significance was observed due to the great variance within skin contact factor (3SH SC = Yes: 139.12 ng/L, SC = No: 19.59 ng/L; 3SHA SC = Yes: 8.06 ng/L, SC = No: 1.53 ng/L). No statistical differences for the thiols were observed for β-lyase. The compounds 3SH and 3SHA were statistically significant for fermentation gradient, where higher concentrations of these compounds were obtained for FG1 and FG2 in comparison to FG0. Skin contact and fermentation gradient (SC×FG) showed a significant difference (α = 0.05) for 3SH, BL×FG for 4MSP, and SC×BL×FG for 3SH (Table 4).

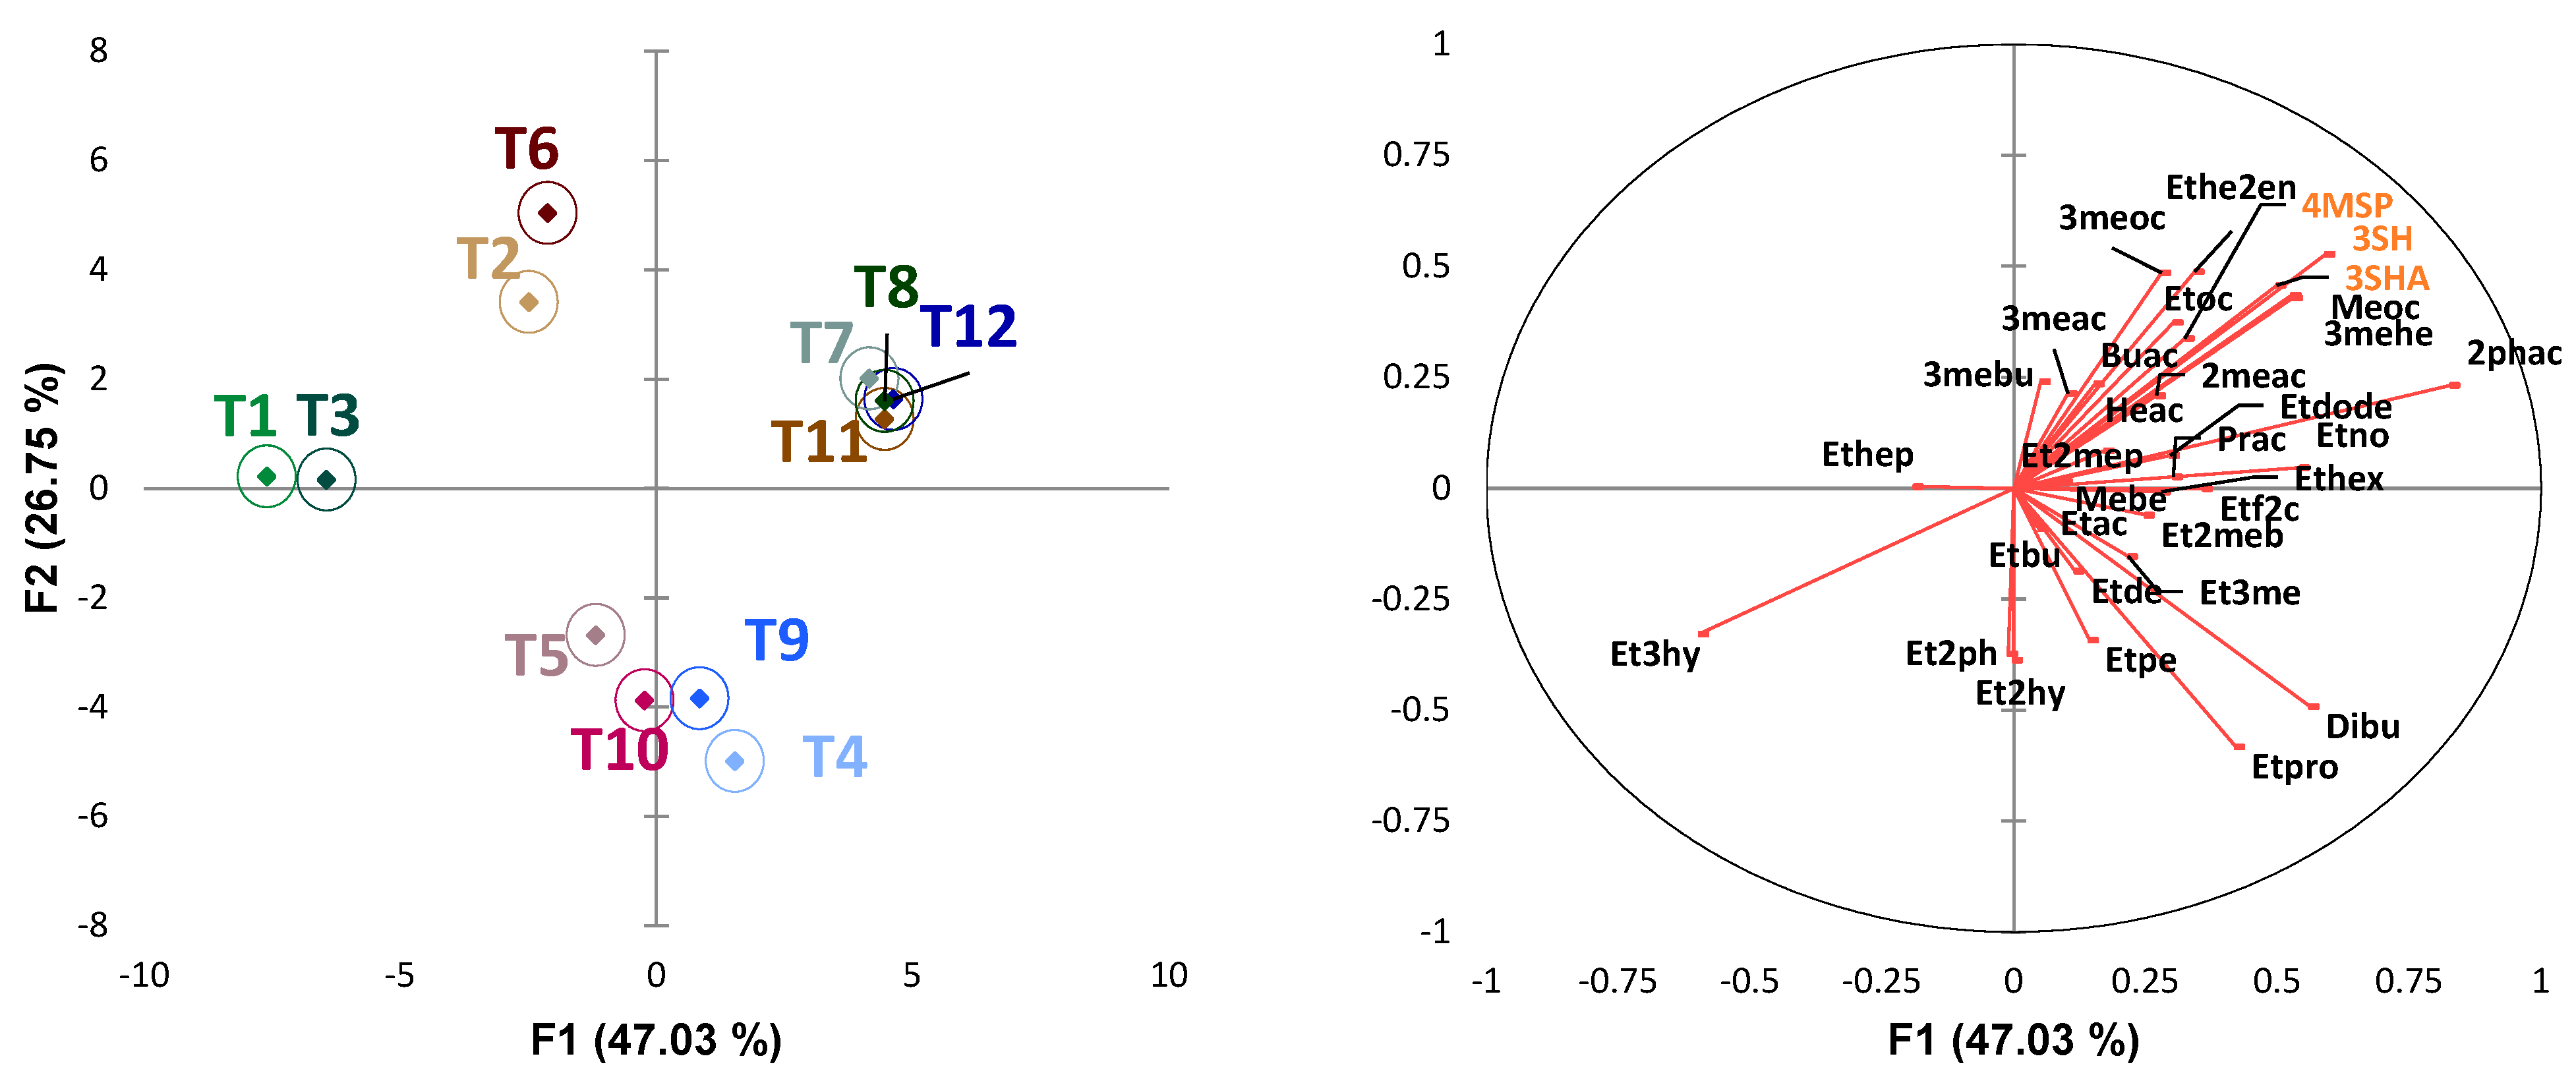
3.6. Assessing the Contribution of Esters and Thiols to the Wine Treatments

To understand how all the factor combinations alter ester and thiol concentrations, statistical analysis was performed on the overall wine treatments. A heatmap shows the contribution of the different compounds to each treatment (Figure 3). It was possible to see treatments that were characterized primarily by high and low ester concentrations, as well as treatments with high and low concentrations of esters and thiols. T7 and T11 had higher concentrations of esters and thiols. T1 and T3 with lower concentrations of most compounds, T4 with lower thiols and higher esters, T2 and T5 with lower concentrations of both compound classes, T8 and T12 with higher thiol levels and lower ester concentrations. Within these characterizations, however, the high versus low concentrations of esters varied for each treatment.It was difficult to see any specific trends between treatments based on specific esters or ester groups.
Wine treatments, their similarities, and their correlations to ester and thiol concentrations can be visualized in the CVA plot (Figure 4). The first two factors of CVA explained 73.78% of the total variance (F1= 47.03% and F2= 26.75%). The other CVA factors did not greatly contribute to the total variance, so they were not considered for further statistical analysis (Figure S3). Wine T3, the β-lyase treatment, is very similar to wine T1 (control), which shows that β-lyase did not have an effect on the thiol levels in the wines, as the two wine treatments are in the negative F1 axis and are not strongly associated with either thiol or ester compounds. Similarly, all other treatments having β-lyase (T6, T9, T10, T11, and T12) were near treatments having the same factor combinations, thus emphasizing that β-lyase did not play an effective role in changing compound concentrations. For example, wines T2 (SC = yes) and T6 (SC = yes + BL = yes) are similar to each other, and both wines are associated with several esters and the thiol compounds by F2. While wines T5 and T10 are correlated with few ester compounds, wines T4 and T9 are associated with several esters. Interestingly, wines T9 and T10 are very similar, but wines T4 and T5 are not as similar to each other. Finally, the 95% confidence intervals of wines T7, T8, T11, and T12 overlap, thus clearly showing that there are no statistical differences between these wines. Additionally, these treatments have combinations of skin contact and fermentation gradient FG1 or FG2, which indicates an interaction between these two factors to increase both ester and thiol concentrations in Chardonnay wine. These four wine treatments were strongly correlated with several esters and the three thiol compounds studied.

4. Discussion

In this study, the influence of skin contact, β-lyase enzyme, and fermentation gradient temperature on the concentration levels of free volatile thiols and yeast-derived esters in Chardonnay wine was assessed. The hypothesis was that the β-lyase enzyme would result in greater levels of thiols, skin contact would increase both thiol and ester concentrations, and fermentation temperature gradient would produce greater levels of thiols while maintaining ester levels.

4.1. Effect of Winemaking Process on Basic Wine Chemistry and Fermentation Rate

The lower levels of titratable acidity in the skin contact (SC) wines may have occurred as a result of precipitation of potassium bitartrate caused by an increase in the level of potassium in the pre-fermented must [36]. A reduction in malic acid was also observed for the SC wines (Table 2). Plausible explanations for the lower levels of malic acid in SC wines are that (1) malic acid was metabolized by yeast to produce succinic acid during the Krebs cycle or (2) lactic acid bacteria (LAB) present in the grape skins might have been converted from malic to lactic acid, although SO2 was added to the must prior to skin contact [37]. The fermentation rate of the SC was accelerated (Figure 2), most likely due to an increase in yeast assimilable nitrogen extracted from skins to juice (Table S11), increasing yeast cell yield, and higher sugar consumption compared to the no SC wines [37]. The slightly higher TA levels found in FG1 and FG2 were significant when compared to FG0. Increased TA with higher fermentation temperature has been previously reported [25].
Although residual sugar levels were low in all wines, the modestly higher sugar levels seen in FG1 and FG2 could be explained by the sudden decrease in temperature during fermentation, which reduced the fermentation rate. Finally, acetic acid has been shown to be found in lower levels in white wines fermented at low temperatures [3], however, our study showed a higher concentration of this compound in FG0. Although these levels are not indicative of spoilage, this could be explained by the lower level of ethyl acetate in FG0 (Table 3), the acetate of acetic acid, meaning that either acetic acid was not esterified to ethyl acetate or hydrolysis may have occurred in the FG1 and FG2 wines.

4.2. Effect of Skin Contact on Volatile Thiols and Esters Concentrations

Skin contact is known to affect the volatile composition of white wines [2]. This study showed increased concentrations of volatile thiols (3SH, 3SHA, and 4MSP) and some yeast-derived esters for the SC wines. Volatile thiols are present in the grapes as precursors, in their cysteinylated and glutathionylated versions [17]. These precursors are mostly found in the grape skins [18]. Therefore, the increase in thiol content in the wine is due to the greater extraction of precursors from the skins during SC [2,27,38].
As for the ester compounds, the effect of SC was more pronounced for the acetate esters (Table 3). While all six acetate esters showed greater levels for SC, the effect for fatty acid ethyl esters (FAEEs) showed various results, with eight out of eighteen compounds showing higher levels for SC. The greater concentration of acetate esters may be due to the esterification of higher alcohols with carboxylic acids [39]. Higher alcohols, in turn, are a byproduct of amino acid metabolism [40]. Grape skins are rich in amino acids, which are consumed by yeast as a source of nitrogen during alcoholic fermentation and might have contributed to the observed increase in acetate esters in this study. Unfortunately, a more comprehensive analysis of amino acids in the juice was not conducted.
The remaining ethyl esters showed statistical significance for SC. Ethyl 2-hydroxypropanoate, ethyl 3-hydroxybutanoate, ethyl 2-phenylacetate, and ethyl propanoate were found at greater concentrations with no SC. Ethyl esters have been found at lower concentrations in Chenin Blanc wine that underwent skin contact [41]. Finally, the fatty acids of methyl and isoamyl esters (methyl octanoate, 3-methylbutyl hexanoate, 3-methylbutyl butanoate, and 3-methylbutyl octanoate) were significantly higher for SC wine. Previous studies investigating the effect of SC have not included these compounds, although they have been found in Chardonnay wines [42].
An important aspect to consider when comparing research investigating skin contact is higher temperatures and longer SC time, which might explain why a different result was observed in our study. Additionally, it was not possible to extend the conclusions from previous work to this study because confounding variables, such as grape vintage and variety, yeast strain, and specific winemaking processes, also affect the volatile composition of wine [43].

4.3. Effect of β-Lyase on Volatile Thiols and Esters Concentrations

Higher concentrations of free volatile thiols were expected with the β-lyase addition. This enzyme cleaves the carbon–sulfur bond of varietal thiol precursors during fermentation, thus increasing the levels of free 3SH, 3SHA, and 4MSP in the wine [17,18]. Unfortunately, no change in thiol concentrations for the β-lyase factor was observed in this study. The highest recommended dosage of this commercial product was used (40 µL/L), following the manufacturer’s instructions. This recommended dosage might be effective for Sauvignon Blanc wine, which has much higher levels of volatile thiol precursors than Chardonnay [44]. Higher concentrations of Endozym® thiol (5 mg/L) have successfully increased free volatile thiols in Chardonnay and Sauvignon Blanc wines, thus showing its efficacy if greater dosages of this product are used [45]. Another possible explanation for this result is that the enzymes present in this commercially available product were no longer active when they were added to the wines, or the conditions of fermentation made enzyme activity difficult, although enzymatic activity was not measured at the time.

4.4. Effect of Fermentation Gradient Temperature on Thiols and Esters Concentrations

Our work investigated the impact of fermentation gradient temperature on the alteration of thiols and esters in Chardonnay. Based on what is known about fermentation temperature and how it affects the volatile composition of wine, in this case, thiols and esters, we attempted to increase the concentrations of both aroma families by employing fermentation gradient temperature (FG1 and FG2). Fermentation temperature plays an antagonistic effect on these aroma families, that is, while higher fermentation temperatures (~20 °C) are required to increase thiol concentrations in the wine, esters require lower fermentation temperatures (~13 °C) to allow for their retention [46,47]. FG1 and FG2 clearly affected the concentrations of both free volatile thiols and yeast-derived esters (Table 3). Both 3SH and its acetate 3SHA showed significantly higher concentrations of FG1 and FG2 compared to the baseline fermentation (FG0). A minor increase of 0.01 ng/L was also observed for 4MSP. Similar trends in concentration increase were obtained in Sauvignon Blanc fermented at temperatures between 18 °C and 24 °C for 3SH, 3SHA, and 4MSP [23,24].
Swiegers et al. [23] measured volatile thiols during fermentation, and their results showed that higher thiol levels were obtained only at the beginning of fermentation, reaching their maximum concentrations at approximately 96 h of fermentation [23]. As fermentation progressed, the higher temperature ferments (23 °C and 28 °C) showed a decrease in volatile thiols due to evaporation, while the lower temperature fermentations (18 °C) maintained their levels of thiols. While we did not measure volatile thiols during fermentation in this study, we believe that thiol release from their precursors occurred in the early stages of fermentation as a result of yeast enzymatic activity. Additionally, the subsequent drop in temperature to 13 °C preserved thiol concentrations, thus allowing for higher levels of thiols in the final wines.
White wines are normally fermented at lower temperatures, ranging from 11 to 25 °C, to preserve fresh and fruity characteristics [3,23,48]. White wines fermented at higher temperatures have lower concentrations of FAEE and acetate esters, mainly due to evaporative loss [46]. Other esters, such as ethyl octanoate and ethyl decanoate, have been found to increase at higher temperatures, and ethyl hexanoate concentrations were not impacted by fermentation temperature [48]. In general, ester concentrations in wine are mostly dependent on substrate, enzyme activity involved in the synthesis of those compounds, and ester hydrolysis. Any influences directly affecting these three factors will alter ester concentration in wine [23].
We believe that minimal evaporation loss occurred in the FG1 and FG2 wines due to the change in temperature. Both FG1 and FG2 resulted in higher concentrations of several ethyl and acetate esters compared to FG0, which was fermented at a constant 13 °C. The elevated temperatures at the beginning of the FG1 and FG2 fermentations accelerated the fermentation rate and yeast metabolism, resulting in greater synthesis of these compounds. Thus, the reduction in fermentation temperature to 13 °C was crucial to maintaining ester levels in the wine. Although there was no wine treatment fermented at a constant 20 °C, it is hypothesized that the volatile composition of this wine would be lower compared to FG1 and FG2 [44,45]. Finally, FG2 obtained overall slightly lower concentrations of esters compared to FG1. The temperature change point for this wine was based on its sugar level (11.5 °Brix), which on average took place ~24 h after FG1, depending on fermentation replicates (Table S12). The lower ester levels in FG2 are most likely due to evaporation; thus, the fixed temperature drop point at 96 h after yeast inoculation was found to be more efficient for maintaining ester levels under the conditions studied.

4.5. The Effect of Combining SC and FG on Thiols and Esters Concentrations

The combination of SC and FG1 or FG2 in one treatment (T7 and T8) resulted in greater levels of thiols and most esters compared to the wines in which either SC (T2) or FG (T4 and T5) alone were investigated. As previously discussed, the addition of β-lyase did not affect the levels of thiols and esters; therefore, the wines T7, T8, T11, and T12 presented similar levels of these compounds (Figure 4, Table S12). A nearly 2-fold increase in 3SH levels was obtained in T7–8 and T11–12 compared to T2 and T4–5. The acetate 3SHA, and, to a lower extent, 4MSP, also resulted in greater levels of thiols with the SCxFG combinations (Figure 3, Table 4). This outcome was expected as SC extracted thiol precursors from grape skins into the must, and FG accelerated fermentation onset and increased yeast enzymatic activity, thus optimizing the release of free volatile thiols to the wines. Several ethyl and acetate esters were increased in the SCxFG wines. Similar to volatile thiols, all acetate and isoamyl esters increased with T7–8 and T11–12, possibly due to the enrichment of the must with specific amino acids during SC, as previously discussed. While most short-chain FAEEs (ethyl acetate, ethyl propanoate, ethyl butanoate, ethyl propanoate, and ethyl pentanoate) were more strongly associated with T4 and T9, the medium-chain fatty acid (MCFA) ethyl esters (ethyl hexanoate, ethyl octanoate, ethyl nonanoate, and ethyl dodecanoate) were correlated with the T7–8 and T11–12 wines (Figure 4). It is possible that the MCFA ethyl esters in SCxFG wines are higher due to an increase of biosynthetic intermediates for lipids (such as fatty acids) in SC musts, as seen in Valero et al. [37]. When combined with SC, FG altered yeast metabolism and yeast membrane cell structure, thus facilitating the excretion of longer ester molecules.

4.6. Feasibility of FG in Large-Scale Production in the Winery

It is important to discuss the FG application to large-scale fermentations and any anticipated challenges, as this is not a standard practice. Wineries with controlled temperature fermentation tanks have the capability of implementing the FG process. However, the temperature drop (from 20 °C to 13 °C) in large-scale tanks would take significantly more time; thus, adjustments of when to drop the fermentation temperature should be considered. Another aspect is the energy cost of reducing the temperature, which would potentially be more costly than fermenting at a constant temperature. Lastly, yeast stress could lead to sluggish fermentation in large-scale fermentations, although our laboratory-scale fermentations did reach dryness.
Larger-scale ferments would also be necessary to determine if any of the investigated processes altered other sensory qualities of the wine. For example, skin contact prior to fermentation for white wines is typically used to extract more aroma and flavor precursors, but may also extract more phenolic compounds [49,50]. Although Sokolowsky et al. [51] found that the extraction of these phenols that would result in a change in bitterness, perception depends on the grape variety. It is also unknown if any of the other aromatic or flavor changes may be altered with the winemaking processes used, as compounds such as monoterpenes are also known to increase with skin contact (ref).

5. Conclusions

This study showed the impact of skin contact, β-lyase enzyme addition, and fermentation gradient temperature on fermentation esters and free volatile thiol levels in Chardonnay wine. The factors investigated did not drastically change the basic wine components, except for a reduction in titratable acidity in the skin contact wines. Higher levels of volatile thiols and acetate esters were obtained for the skin contact wines. Surprisingly, β-lyase did not increase free volatile thiols. Increases in volatile thiols, mainly 3SH and 3SHA, and specific fermentation esters were observed in the fermentation gradient temperature trials. The total ester concentration was higher in FG1 compared to FG2, probably due to the temperature drop occurring earlier in the former treatment. Finally, the greatest levels of both esters and volatile thiols were obtained with treatment combinations of SCxFG. This combination resulted in a winemaking strategy for the creation of a specific Chardonnay wine style. Additional work is needed, specifically to scale up the successful fermentations in this study, to determine if the changes in esters and thiols can occur at larger fermentation sizes. Larger fermentations will also allow for sensory analysis to confirm that esters and thiols cause fruity aromas in Chardonnay wines.

Supplementary Materials

The following supporting information can be downloaded at: https://www.mdpi.com/article/10.3390/fermentation11050250/s1, Quantification parameters for the headspace-solid phase microextraction GC-MS analysis of the compounds in Method 1 (Table S1); Quantification parameters for the headspace-solid phase microextraction GC-MS analysis of the compounds in Method 2 (Table S2); Scan and Selective Ion Mode (SIM) for Method 1 (Table S3); Gain factors for Method 1 (Table S4); Scan and Selective Ion Mode (SIM) for Method 2 (Table S5) Gain factors for Method 2 (Table S6); Solvent program for HPLC for thiol analysis (Table S7); Selected reaction monitoring (SRM) conditions for qualitative analysis of varietal thiols with LC-MS/MS (Table S8); p-values associated with wine treatments, experimental repetitions, and their interactions (Table S9); Statistically significance interactions between skin contact (SC), β-lyase (BL), and fermentation gradient temperature (FG) for the wine basic chemistry parameters in the experimental Chardonnay wines (Table S10); Average concentrations for initial YAN value, °Brix, TA, and pH for the skin contact and no skin contact juices for R1 and R2 (Table S11); Sugar concentrations (°Brix) in the FG2 triplicate laboratory-scale ferments for R1 and R2 during their temperature change points (Table S12); Sugar concentrations (°Brix) in the FG2 triplicate laboratory-scale ferments for R1 and R2 during their temperature change points (Table S13); Average concentrations of the 13 ester compounds that were significantly different between experimental replications (Figure S1); Separation of the treatment wines by ester and thiol concentrations using CVA for experimental repetitions R1 and R2 (Figure S2); Scree plot showing the cumulative variability (%) for the factors of the CVA plot (Figure S3).

Author Contributions

Conceptualization, A.I. and E.T.; methodology, J.O. and E.T.; formal analysis, A.I., Y.D. and E.T.; investigation, A.I.; writing—original draft preparation, A.I.; writing—review and editing, E.T.; supervision, E.T.; project administration, E.T.; funding acquisition, E.T. All authors have read and agreed to the published version of the manuscript.

Funding

This research was funded by the American Vineyard Foundation, grant numbers 2479 and NIH #1S10OD026922-01.

Institutional Review Board Statement

Not applicable.

Informed Consent Statement

Informed consent was obtained from all subjects involved in the study

Data Availability Statement

Data have been made available in the Supplementary Material. Any additional data not provided may be requested from the corresponding author.

Acknowledgments

The authors thank Christopher Beaudry and Xiaojie Zhang for the ITSD compound synthesis and the Mass Spectrometry Center at Oregon State University for assisting with the volatile thiol analysis.

Conflicts of Interest

The authors declare no conflicts of interest.

Abbreviations

The following abbreviations are used in this manuscript:
3SH3-sulfanylhexan-1-ol
3SHA3-sulfanylhexyl acetate
4MSP4-methyl-4-sulfanylpentan-2-one
HS-SPME-GC-MSHeadspace solid-phase microextraction gas chromatography mass spectrometry
LC-MS/MSLiquid chromatography-tandem mass spectrometry
FGFermentation gradient
SCSkin contact
BLβ-lyase
HPLCHigh-performance liquid chromatography
SIDAStable isotope dilution assay
DVB/CAR/PDMSStableflex Divinylbenzene/Carboxen/Polydimethylsiloxane
SIMSingle ion mode
LODLimit of detection
LOQLimit of quantification
HSDHonest significant difference
CVACanonical variate analysis
LABLactic acid bacteria
FAEEFatty acid ethyl esters

References

  1. Gambetta, J.M.; Bastian, S.E.P.; Cozzolino, D.; Jeffery, D.W. Factors Influencing the Aroma Composition of Chardonnay Wines. J. Agric. Food Chem. 2014, 62, 6512–6534. [Google Scholar] [CrossRef] [PubMed]
  2. Maggu, M.; Winz, R.; Kilmartin, P.A.; Trought, M.C.T.; Nicolau, L. Effect of Skin Contact and Pressure on the Composition of Sauvignon Blanc Must. J. Agric. Food Chem. 2007, 55, 10281–10288. [Google Scholar] [CrossRef] [PubMed]
  3. Torija, M.J.; Beltran, G.; Novo, M.; Poblet, M.; Guillamón, J.M.; Mas, A.; Rozès, N. Effects of Fermentation Temperature and Saccharomyces Species on the Cell Fatty Acid Composition and Presence of Volatile Compounds in Wine. Int. J. Food Microbiol. 2003, 85, 127–136. [Google Scholar] [CrossRef]
  4. Belda, I.; Ruiz, J.; Esteban-Fernández, A.; Navascués, E.; Marquina, D.; Santos, A.; Moreno-Arribas, M. Microbial Contribution to Wine Aroma and Its Intended Use for Wine Quality Improvement. Molecules 2017, 22, 189. [Google Scholar] [CrossRef] [PubMed]
  5. Tian, T.; Ruppel, M.; Osborne, J.; Tomasino, E.; Schreiner, R.P. Fertilize or Supplement: The Impact of Nitrogen on Vine Productivity and Wine Sensory Properties in Chardonnay. Am. J. Enol. Vitic. 2022, 73, 148–161. [Google Scholar] [CrossRef]
  6. Garde-Cerdán, T.; Ancín-Azpilicueta, C. Review of Quality Factors on Wine Ageing in Oak Barrels. Trends Food Sci. Technol. 2006, 17, 438–447. [Google Scholar] [CrossRef]
  7. Tomasino, E.; Song, M.; Fuentes, C. Odor Perception Interactions between Free Monoterpene Isomers and Wine Composition of Pinot Gris Wines. J. Agric. Food Chem. 2020, 68, 3220–3227. [Google Scholar] [CrossRef]
  8. Chen, L.; Capone, D.L.; Jeffery, D.W. Analysis of Potent Odour-Active Volatile Thiols in Foods and Beverages with a Focus on Wine. Molecules 2019, 24, 2472. [Google Scholar] [CrossRef]
  9. University of Oregon. 2020 Oregon Vineyard and Winery Report. Available online: https://industry.oregonwine.org/wp-content/uploads/sites/2/2020-Winery-Vineyard-Report-8-31-21-Rev.pdf (accessed on 21 August 2022).
  10. Vaudour, E. The quality of grapes and wine in relation to geography: Notions of terroir at various scales. J. Wine Res. 2002, 13, 117–141. [Google Scholar] [CrossRef]
  11. Capone, D.; Francis, L.; Williamson, P.; Herderich, M.; Johnson, D. Struck match, freshness and tropical fruit: Thiols and Chardonnay flavor. Wine Vitic. J. 2017, 32, 31–35. [Google Scholar]
  12. Jeffery, D.W. Spotlight on varietal thiols and precursors in grapes and wines. Aust. J. Chem. 2016, 69, 1323–1330. [Google Scholar] [CrossRef]
  13. Grant-Preece, P.A.; Pardon, K.H.; Capone, D.L.; Cordente, A.G.; Sefton, M.A.; Jeffery, D.W.; Eslsey, G.M. Synthesis of wine thiol conjugates and labeled analogues: Fermentation of glutathione conjugate 3-mercaptohexan-1-ol yields the corresponding cysteine conjugate and free thiol. J. Agric. Food Chem. 2010, 58, 1383–1389. [Google Scholar] [CrossRef]
  14. Capone, D.L.; Barker, A.; Williamson, P.O.; Francis, I.L. The Role of Potent Thiols in Chardonnay Wine Aroma: Potent Thiols in Chardonnay Wine. Aust. J. Grape Wine Res. 2018, 24, 38–50. [Google Scholar] [CrossRef]
  15. Iobbi, A.; Tomasino, E. Adapting Polarized Projective Mapping to Investigate Fruitiness Aroma Perception of White Wines from Oregon. Beverages 2021, 7, 46. [Google Scholar] [CrossRef]
  16. Tominaga, T.; Furrer, A.; Henry, R.; Dubourdieu, D. Identification of New Volatile Thiols in the Aroma of Vitis vinifera L. Var. Sauvignon Blanc Wines. Flavour Fragr. J. 1998, 13, 4. [Google Scholar] [CrossRef]
  17. Coetzee, C.; du Toit, W.J. A Comprehensive Review on Sauvignon Blanc Aroma with a Focus on Certain Positive Volatile Thiols. Food Res. Int. 2012, 45, 287–298. [Google Scholar] [CrossRef]
  18. Roland, A.; Schneider, R.; Razungles, A.; Cavelier, F. Varietal Thiols in Wine: Discovery, Analysis and Applications. Chem. Rev. 2011, 111, 7355–7376. [Google Scholar] [CrossRef] [PubMed]
  19. King, E.S.; Osidacz, P.; Curtin, C.; Bastian, S.E.P.; Francis, I.L. Assessing Desirable Levels of Sensory Properties in Sauvignon Blanc Wines—Consumer Preferences and Contribution of Key Aroma Compounds: Consumer Preference of Sauvignon Blanc Flavours. Aust. J. Grape Wine Res. 2011, 17, 169–180. [Google Scholar] [CrossRef]
  20. Benkwitz, F.; Tominaga, T.; Kilmartin, P.A.; Lund, C.; Wohlers, M.; Nicolau, L. Identifying the Chemical Composition Related to the Distinct Aroma Characteristics of New Zealand Sauvignon Blanc Wines. Am. J. Enol. Vitic. 2012, 63, 62–72. [Google Scholar] [CrossRef]
  21. Green, J.A.; Parr, W.V.; Breitmeyer, J.; Valentin, D.; Sherlock, R. Sensory and Chemical Characterization of Sauvignon Blanc Wine: Influence of Source of Origin. Food Res. Int. 2011, 44, 2788–2797. [Google Scholar] [CrossRef]
  22. Iobbi, A.; Di, Y.; Tomasino, E. Revealing the sensory impact of different levels and combinations of esters and volatile thiols in Chardonnay wines. Heliyon 2023, 9, e12862. [Google Scholar] [CrossRef] [PubMed]
  23. Swiegers, J.H.; Pretorius, I.S. Modulation of Volatile Sulfur Compounds by Wine Yeast. Appl. Microbiol. Biotechnol. 2007, 74, 954–960. [Google Scholar] [CrossRef]
  24. Killian, E.; Ough, C.S. Fermentation Esters: Formation and Retention as Affected by Fermentation Temperature. Am. J. Enol. Vitic. 1979, 30, 5. [Google Scholar] [CrossRef]
  25. Masneufpomarede, I.; Mansour, C.; Murat, M.; Tominaga, T.; Dubourdieu, D. Influence of Fermentation Temperature on Volatile Thiols Concentrations in Sauvignon Blanc Wines. Int. J. Food Microbiol. 2006, 108, 385–390. [Google Scholar] [CrossRef]
  26. Swiegers, J.H.; Francis, I.L.; Herderich, M.J.; Pretorius, I.S. Meeting Consumer Expectations through Management in Vineyard and Winery. Wine Ind. J. 2006, 21, 10. [Google Scholar]
  27. Acquaviva, V.; D’Auria, M.; Racioppi, R. Changes in Aliphatic Ester Composition of White Wines during Exposition to Light. An HS-SPME-GC-MS Study. J. Wine Res. 2014, 25, 63–74. [Google Scholar] [CrossRef]
  28. Siebert, T.E.; Smyth, H.E.; Capone, D.L.; Neuwöhner, C.; Pardon, K.H.; Skouroumounis, G.K.; Herderich, M.J.; Sefton, M.A.; Pollnitz, A.P. Stable Isotope Dilution Analysis of Wine Fermentation Products by HS-SPME-GC-MS. Anal. Bioanal. Chem. 2005, 381, 937–947. [Google Scholar] [CrossRef] [PubMed]
  29. Antalick, G.; Perello, M.-C.; de Revel, G. Development, Validation and Application of a Specific Method for the Quantitative Determination of Wine Esters by Headspace-Solid-Phase Microextraction-Gas Chromatography–Mass Spectrometry. Food Chem. 2010, 121, 1236–1245. [Google Scholar] [CrossRef]
  30. Capone, D.L.; Ristic, R.; Pardon, K.H.; Jeffery, D.W. Simple Quantitative Determination of Potent Thiols at Ultratrace Levels in Wine by Derivatization and High-Performance Liquid Chromatography–Tandem Mass Spectrometry (HPLC-MS/MS) Analysis. Anal. Chem. 2015, 87, 1226–1231. [Google Scholar] [CrossRef]
  31. Miller, J.; Miller, J.C. Statistics and chemometrics for analytical chemistry. Pearson education 2018.
  32. Callejόn, R.M.; González, A.G.; Troncoso, A.M.; Morales, M.L. Optimization and validation of headspace sorptive extraction for the analysis of volatile compounds in wine vinegars. J. Chromatogr. A 2008, 1204, 93–103. [Google Scholar] [CrossRef] [PubMed]
  33. Shrivastava, A.; Gupta, V.B. Methods for the Determination of Limit of Detection and Limit of Quantitation of the Analytical Methods. Chron Young Sci. 2011, 2, 21–25. [Google Scholar] [CrossRef]
  34. Song, M.; Xia, Y.; Tomasino, E. Investigation of a Quantitative Method for the Analysis of Chiral Monoterpenes in White Wine by HS-SPME-MDGC-MS of Different Wine Matrices. Molecules 2015, 20, 7359–7378. [Google Scholar] [CrossRef]
  35. Tomasino, E.; Harrison, R.; Breitmeyer, J.; Sedcole, R.; Sherlock, R.; Frost, A. Aroma Composition of 2-Year-Old New Zealand Pinot Noir Wine and Its Relationship to Sensory Characteristics Using Canonical Correlation Analysis and Addition/Omission Tests: Chemistry and Sensory of New Zealand Pinot Noir. Aust. J. Grape Wine Res. 2015, 21, 376–388. [Google Scholar] [CrossRef]
  36. Olejar, K.J.; Fedrizzi, B.; Kilmartin, P.A. Enhancement of Chardonnay Antioxidant Activity and Sensory Perception through Maceration Technique. LWT—Food Sci. Technol. 2016, 65, 152–157. [Google Scholar] [CrossRef]
  37. Valero, E.; Millan, M.C.; Mauricio, J.C.; Ortega, J.M. Effect of Grape Skin Maceration on Sterol, Phospholipid, and Fatty Acid Contents of Saccharomyces Cerevisiae During Alcoholic Fermentation. Am. J. Enol. Vitic. 1998, 49, 119–124. [Google Scholar] [CrossRef]
  38. Patel, P.; Herbst-Johnstone, M.; Lee, S.A.; Gardner, R.C.; Weaver, R.; Nicolau, L.; Kilmartin, P.A. Influence of Juice Pressing Conditions on Polyphenols, Antioxidants, and Varietal Aroma of Sauvignon Blanc Microferments. J. Agric. Food Chem. 2010, 58, 7280–7288. [Google Scholar] [CrossRef]
  39. Sumby, K.M.; Grbin, P.R.; Jiranek, V. Microbial Modulation of Aromatic Esters in Wine: Current Knowledge and Future Prospects. Food Chem. 2010, 121, 1–16. [Google Scholar] [CrossRef]
  40. Waterhouse, A.L.; Sacks, G.L.; Jeffery, D.W. Understanding Wine Chemistry; John Wiley & Sons: Hoboken, NJ, USA, 2016. [Google Scholar]
  41. Aleixandre-Tudo, J.L.; Weightman, C.; Panzeri, V.; Nieuwoudt, H.; du Toit, W.J. Effect of Skin Contact before and during Alcoholic Fermentation on the Chemical and Sensory Profile of South African Chenin Blanc White Wines. S. Afr. J. Enol. Vitic. 2015, 36, 366–377. [Google Scholar] [CrossRef]
  42. Burin, V.M.; Caliari, V.; Bordignon-Luiz, M.T. Nitrogen Compounds in Must and Volatile Profile of White Wine: Influence of Clarification Process before Alcoholic Fermentation. Food Chem. 2016, 202, 417–425. [Google Scholar] [CrossRef]
  43. Molina, A.M.; Swiegers, J.H.; Varela, C.; Pretorius, I.S.; Agosin, E. Influence of Wine Fermentation Temperature on the Synthesis of Yeast-Derived Volatile Aroma Compounds. Appl. Microbiol. Biotechnol. 2007, 77, 675–687. [Google Scholar] [CrossRef] [PubMed]
  44. Bonnaffoux, H.; Roland, A.; Schneider, R.; Cavelier, F. Spotlight on release mechanisms of volatile thiols in beverages. Food Chem 2021, 339, 127628. [Google Scholar] [CrossRef]
  45. Tondini, F.; Gambetta, J.; Chen, L. The Effects of Pre-Fermentative Additions on Yeast Volatile Aromas and Thiols in Sauvignon Blanc and Chardonnay. 17th Australian Wine Technical Conference Proceedings. Available online: https://chrome-extension://efaidnbmnnnibpcajpcglclefindmkaj/https://static1.squarespace.com/static/6552af6c68af6b453550c54c/t/65b9a86b282daf6754629043/1706666182338/17th+AWITC+Proceedings.pdf (accessed on 21 August 2022).
  46. Swiegers, J.H.; Pretorius, I.S. Yeast Modulation of Wine Flavor. In Advances in Applied Microbiology; Elsevier: Amsterdam, The Netherlands, 2005; Volume 57, pp. 131–175. [Google Scholar] [CrossRef]
  47. Morakul, S.; Mouret, J.-R.; Nicolle, P.; Aguera, E.; Sablayrolles, J.-M.; Athès, V. A Dynamic Analysis of Higher Alcohol and Ester Release During Winemaking Fermentations. Food Bioprocess Technol. 2013, 6, 818–827. [Google Scholar] [CrossRef]
  48. Saerens, S.M.G.; Delvaux, F.; Verstrepen, K.J.; Van Dijck, P.; Thevelein, J.M.; Delvaux, F.R. Parameters Affecting Ethyl Ester Production by Saccharomyces Cerevisiae during Fermentation. Appl. Environ. Microbiol. 2008, 74, 454–461. [Google Scholar] [CrossRef]
  49. Bene, Z.S.; Kállay, M. Polyphenol contents of skin-contact fermented white wines. Acta Aliment. 2019, 48, 515–524. [Google Scholar] [CrossRef]
  50. García-Romero, E.; Pérez-Coello, M.; Cabezudo, M.D.; Sánchez-Muñoz, G.; Martín-Alvarez, P.J. Fruity flavor increase of Spanish Airén white wines made by brief fermentation skin contact/Aumento del aroma afrutado de los vinos blancos Airén fermentados en presencia de hollejos. Food Sci. Technol. Int. 1999, 5, 149–157. [Google Scholar] [CrossRef]
  51. Sokolowsky, M.; Rosenberger, A.; Fischer, U. Sensory impact of skin contact on white wines characterized by descriptive analysis, time–intensity analysis and temporal dominance of sensations analysis. Food Qual. Prefer. 2015, 39, 285–297. [Google Scholar] [CrossRef]
Figure 1. Winemaking flow diagram showing the randomization for β-lyase and fermentation schedules for the 36 bottles in R1. Bottle numbers highlighted in green, blue, and yellow belonged to FG0, FG1, and FG2, respectively. Orange and purple boxes correspond to the addition or non-addition of β-lyase to the bottles.
Fermentation 11 00250 g001
Figure 2. Change in Brix during fermentation of the experimental Chardonnay wines by R1 and R2 and fermentation schedules FG0, FG1, and FG2. Standard deviations are represented by the error bars.
Fermentation 11 00250 g002
Figure 3. Heatmap with concentration averages corresponding to the esters and thiols for the wine treatments. The relative content is illustrated using an achromatic scale (from dark green, minimum, to dark red, maximum) for each compound. Abbreviations for each compound are found in Table 3.
Fermentation 11 00250 g003
Figure 4. Separation of the treatment wines by ester and thiol concentrations using CVA. Treatments are positioned using the centroids for the wines. Circles represent 95% confidence intervals surrounding the wine means. Scores are plotted on the left, and loadings for the esters and thiols concentrations on the right. Esters are in black and thiols are in orange. The compound names are in Table 3.
Fermentation 11 00250 g004
Table 1. Fermentation processes used in each treatment (SC = skin contact, BL = β-lyase, FG = fermentation gradient).
TreatmentSCBLFG
T1 (Control)NoNo0
T2YesNo0
T3NoYes0
T4NoNo1
T5NoNo2
T6YesYes0
T7YesNo1
T8YesNo2
T9NoYes1
T10NoYes2
T11YesYes1
T12YesYes2
Table 2. Average measurements (with standard deviations) for basic wine chemistry parameters for the skin contact (SC), β-lyase (BL), and fermentation gradient temperature (FG) factors in the experimental Chardonnay wines.
Parameters *SCBLFG
NoYesNoYes012
pH3.02 (±0.08) a3.15 (±0.03) b3.09 (±0.08) a3.08 (±0.09) a3.1 (±0.08) a3.08 (±0.09) a3.07 (±0.08) a
TA (g/L)8.2 (±0.86) a6.5 (±0.28) b7.3 (±1.08) a7.4 (±1.05) a7.13 (±1.21) a7.39 (±0.9) b7.53 (±1.04) b
RS (g/L)0.14 (±0.06) a0.22 (±0.08) a0.17 (±0.08) a0.19 (±0.08) a0.16 (±0.07) a0.19 (±0.09) ab0.19 (±0.08) b
AA (g/L)0.05 (±0.03) a0.05 (±0.03) a0.05 (±0.03) a0.05 (±0.03) a0.07 (±0.04) a0.04 (±0.02) b0.04 (±0.02) b
MA (g/L)2.67 (±0.42) a2.34 (±0.16) b2.5 (±0.35) a2.52 (±0.36) a2.48 (±0.34) a2.52 (±0.36) a2.51 (±0.37) a
EtOH (% v/v)13.37 (±0.43) a13.44 (±0.18) a13.4 (±0.3) a13.41 (±0.37) a13.46 (±0.34) a13.4 (±0.33) a13.36 (±0.33) a
* TA = titratable acidity; RS = residual sugars; AA = acetic acid; MA = malic acid; EtOH = ethanol. Values with different letters are significantly different (p < 0.05) by Tukey’s HSD test.
Table 3. Average concentrations and standard deviations of the volatile compounds measured in the experimental Chardonnay wines by skin contact, β-lyase, and fermentation gradient factors.
CompoundsCodesSkin Contactβ-LyaseFermentation Gradient
YesNoYesNo012
3-sulfanylhexan-1-ol (ng/L) 3SH139.12 (±72.33) a19.59
(±38.04) a
79.52
(±82.83) a
79.20
(±83.43) a
51.88 (±56.79) a93.14 (±89.50) b93.06
(±91.46) b
3-sulfanylhexyl acetate (ng/L)3SHA8.06
(±4.46) a
1.53
(±3.50) a
4.56
(±5.06) a
5.03
(±5.26) a
3.5
(±3.47) a
5.66
(±5.64) b
5.23
(±5.80) b
4-methyl-4-sulfanylpentan-2-one (ng/L)4MSP<2.2 a<2.2 a<2.2 a<2.2 a<2.2 a<2.2 a<2.2 a
Ethyl acetate (μg/L)Etac53,992.06 (±24,104.11) a55,957.90 (±36,536.01) a52,952.61 (±34,850.53) a56,997.35 (±26,364.40) a51,962.41 (±17,742.49) a58,419.29 (±39,913.79) a54,543.24 (±30,784.72) a
Ethyl propanoate (μg/L)Etpro370.40 (±122.32) a454.71 (±222.80) b412.41 (±155.84) a412.70 (±209.46) a257.83 (±79.92) a534.62 (±193.23) c445.22 (±136.30) b
Ethyl butanoate (μg/L)Etbu841.14 (±192.58) a847.41 (±269.79) a810.65 (±186.30) a877.90 (±270.04) a833.42 (±256.81) ab905.06 (±172.22) a794.35 (±250.85) b
Ethyl pentanoate (μg/L)Etpe0.72
(±0.63) a
0.95
(±0.74) a
0.70
(±0.51) a
0.97
(±0.81) b
0.58 (±0.35) a0.94 (±0.89) b0.9915 (±0.65) b
Ethyl hexanoate (μg/L)Ethex732.02 (±248.65) a651.37 (±278.09) a690.03 (±285.6) a693.37 (±246.66) a601.64 (±208.53) a784.68 (±283.89) b688.78 (±269.76) ab
Ethyl heptanoate (μg/L)Ethep2.79
(±0.95) a
16.22
(±80.88) a
15.98 (±80.90) a3.04
(±2.26) a
22.72 (±98.40) a3.34
(±2.10) a
2.47
(±1.11) a
Ethyl octanoate (μg/L)Etoc1202.16 (±495.14) a694.93 (±510.05) b990.06 (±618.82) a907.03 (±497.57) a899.71 (±430.42) ab1107.89 (±632.96) a838.04 (±570.14) b
Ethyl nonanoate (μg/L)Etno7.38
(±1.11) a
6.52
(±1.24) a
6.95
(±1.08) a
6.95
(±1.40) a
6.34
(±1.21) a
7.77 (±1.05) b6.75
(±1.02) a
Ethyl decanoate (μg/L)Etde1633.05 (±5119.57) a2518.55 (±4306.41) a1549.59 (±2879.39) a2602.02 (±6025.17) a749.82 (±246.89) a2361.92 (±4157.42) ab3115.67 (±6888.71) b
Ethyl dodecanoate (μg/L)Etdode48.58 (±22.08) a40.18
(±14.36) a
39.60 (±18.72) a49.16
(±18.25) b
38.17 (±16.85) a53.61 (±22.48) b41.36
(±13.11) a
Ethyl 2-methylpropanoate (μg/L)Et2mep70.46 (±11.90) a67.92
(±19.31) a
68.62 (±16.82) a69.76
(±15.30) a
68.52 (±17.39) a70
(±14.50) a
69.05
(±16.20) a
Ethyl 2-methylbutanoate (μg/L)Et2meb79.57 (±2.51) a79.12
(±2.53) a
79.35 (±2.25) a79.34
(±2.78) a
78.65 (±2.16) a80.20 (±3.12) b79.18
(±1.88) ab
Ethyl 3-methylbutanoate (μg/L)Et3me3.57
(±1.20) a
3.60
(±1.28) a
3.67
(±1.35) a
3.49
(±1.11) a
3.14
(±1.20) a
4.012 (±1.17) b3.60
(±1.18) ab
Ethyl (E)-hex-2-enoate (μg/L)Ethe2en2.84
(±0.99) a
1.64
(±0.60) a
2.18
(±1.03) a
2.31
(±1) a
2.21
(±1.17) a
2.24
(±0.91) a
2.28
(±0.94) a
Ethyl furan-2-carboxylate (μg/L)Etf2c4.91
(±0.59) a
4.54
(±1.09) a
4.61
(±0.63) a
4.84
(±1.09) a
4.40
(±0.46) a
5
(±1.33) b
4.78
(±0.48) b
Ethyl 2-phenylacetate (μg/L)Et2ph0.69
(±0.31) a
8.73
(±17.86) b
5.81 (±16.65) a3.60
(±8.48) a
1.19
(±3.58) a
6.766125 (±18.37) a6.16
(±12.58) a
Ethyl 2-hydroxypropanoate (μg/L)Et2hy5408.59 (±2344.33) a7196.76 (±3149.32) b6565.87 (±2972.79) a6039.48 (±2834.94) a5560.11 (±2402.33) a6345.68 (±3255.87) a7002.23 (±2846.91) a
Ethyl 3-hydroxybutanoate (μg/L)Et3hy279.68 (±30.97) a339.63 (±51.43) b308.39 (±46.01) a310.91 (±57.28) a331.72 (±57.83) a295.88 (±45.38) b301.36
(±44.18) b
Methyl octanoate (μg/L)Meoc4.72
(±1.42) a
2.68
(±1.03) b
3.98
(±1.89) a
3.44
(±1.20) b
3.25
(±1.36) a
4.13
(±1.71) b
3.73
(±1.61) ab
Methyl benzoate (μg/L)Mebe1.25
(±2.55) a
0.95
(±2.28) a
1.03
(±2.35) a
1.17
(±2.50) a
0.78 (±2.07) a0.25 (±1.22) a2.27
(±3.11) b
Diethyl butanedioate (μg/L)Dibu117.25 (±35.74) a124.67 (±37.91) a126.42 (±38.43) a115.49 (±34.71) a81.68 (±20.53) a130.40 (±23.18) a150.79
(±25.12) a
3-Methylbutyl butanoate (μg/L)3mebu5.92
(±0.15) a
5.43
(±1.42) b
5.85
(±0.18) a
5.50
(±1.43) b
5.92 (±0.17) a5.91 (±0.19) a5.18
(±1.67) b
3-Methylbutyl hexanoate (μg/L)3mehe11.47 (±1.61) a9.27
(±1.05) b
10.27 (±1.93) a10.48 (±1.53) a9.82 (±1.48) a11.07 (±1.94) b10.22 (±1.55) a
3-Methylbutyl octanoate (μg/L)3meoc12.65 (±3.22) a9.41
(±2.17) b
12.13 (±2.70) a9.94
(±3.26) b
11.13 (±3.31) a11.41 (±3.18) a10.56 (±3.01) a
Propyl acetate (μg/L)Prac132.75 (±45.56) a112.42 (±49.50) a118.87 (±44.89) a126.30 (±51.86) a108.83 (±49.76) a135.62 (±41.26) b123.30 (±50.61) ab
Butyl acetate (μg/L)Buac1.69
(±0.64) a
1.26
(±0.68) a
1.33
(±0.62) a
1.60
(±0.73) b
1.46 (±0.80) a1.41 (±0.49) a1.53
(±0.74) a
Hexyl acetate (μg/L)Heac283.48 (±66.04) a254.61 (±82.19) a258.09 (±68.10) a280
(±81.59) a
260.51 (±83.55) a285.60 (±68.99) a261.02 (±71.77) a
2-Methylpropyl acetate (μg/L)2meac48.29 (±18.55) a34.34 (±21.21) b38.39 (±19.94) a44.23 (±21.84) a38.24 (±19.50) a44.52 (±18.73) a41.18 (±24.22) a
3-Methylbutyl acetate (μg/L)3meac6544.29 (±1396.71) a5795.03 (±1481.85) b6073.77 (±1312.52) a6265.55 (±1638.98) a6264.56 (±1561.82) ab6472.76 (±1209.87) a5771.66 (±1574.38) b
2-Phenylethyl acetate (μg/L)2phac383.98 (±68.31) a255.47 (±84.97) b307.88 (±99.02) a331.57 (±100.29) b245.15 (±95.82) a381.30 (±69.10) c332.74 (±82.09) b
Thiols total (ng/L)-147.67 (±75.40) a21.55
(±39.05) a
84.53 (±86.50) a84.70 (±87.64) a55.83 (±59.16) a99.26 (±94.58) b98.75 (±95.16) b
Ester total (mg/L)-72.23 (±28.32) a75.50
(±39.36) a
71.47 (±37.34) a76.26 (±30.83) a68.45 (±20.14) a78.47 (±42.50) a74.66 (±35.66) a
Values with different letters in each factor level are significantly different (p < 0.05) by Tukey’s HSD test.
Table 4. Statistically significant interactions between skin contact (SC), β-lyase (BL), and fermentation gradient temperature (FG) for ester and thiol concentrations in the experimental Chardonnay wines.
Codes SCBLFGSC×BLSC×FGBL×FGSC×BL×FG
3SHnsns***ns***ns*
3SHAnsns**nsnsnsns
4MSP*nsnsnsns*ns
Etacnsnsns**ns*ns
Et2mepnsnsnsnsnsns*
2meac***nsns*nsnsns
Buacns**nsnsnsnsns
Et2mebnsns**nsnsns*
3meac**ns**nsnsns
3mebu********************
Etoc*ns*nsnsnsns
3mehe***ns***ns**nsns
Etf2c*ns***nsns***
Etnonsns***ns***nsns
Dibu********ns***
Etdensns*nsns*ns
3meoc*****nsns*nsns
Et2hy*nsnsnsns*ns
Et3hy***ns**nsnsnsns
Ethexnsns**nsns*ns
Etdodens******ns***nsns
Et2ph***ns*nsnsnsns
Etbunsns*ns*nsns
Etpro***ns***ns***nsns
Et3mensns***nsnsnsns
Heacns*nsnsnsnsns
Etpens****ns**ns
Ethepnsnsnsnsnsnsns
Meoc********nsnsns
2phac********ns***nsns
Pracnsns**ns**nsns
Ethe2ennsnsnsnsnsnsns
Mebensns***ns*nsns
Total thiols (ng/L)nsns***ns***ns*
Total esters (mg/L)nsnsns*ns*ns
ns = p ≥ 0.05, * = p < 0.05, ** = p < 0.01, and *** = p < 0.001. Compound names are listed in Table 3.
Disclaimer/Publisher’s Note: The statements, opinions and data contained in all publications are solely those of the individual author(s) and contributor(s) and not of MDPI and/or the editor(s). MDPI and/or the editor(s) disclaim responsibility for any injury to people or property resulting from any ideas, methods, instructions or products referred to in the content.

