Abstract
The regulation of intracellular NADPH levels is currently a hotspot for research into bacterial modification and fermentation process optimization, and Corynebacterium glutamicum, an important industrial microorganism, achieves enhanced L-lysine production by regulating intracellular NADPH levels. In previous studies, transcriptome analysis was performed on C. glutamicum with different intracellular NADPH levels. The results showed that the expression level of transcription factor AtrN changed significantly. Moreover, experiments showed that transcription factor AtrN can sense high intracellular levels of NADPH and negatively regulate its synthesis. In this study, we integrated the pntAB gene of Escherichia coli into the genome of C. glutamicum XQ-5, successfully constructing a chassis cell with a high intracellular NADPH level. It was named TQ-1. On this basis, we knocked out and complemented the AtrN in strain TQ-1, resulting in strains TQ-2 and TQ-3, respectively. Then, the changes in cell growth, intracellular redox substances and cell membrane among these three strains were investigated. We found that the growth of TQ-2 was inhibited in the early growth stage and the cell survival rate was decreased because of the high increase in the intracellular NADPH level. In addition, the deletion of the AtrN gene also led to a decrease in the fluidity and an increase in the permeability of the cell membrane. Compared with TQ-1, TQ-3 showed slow growth only in the late growth stage, and the fluidity of its cell membrane was also enhanced. This indicates that AtrN guides the cells to make some adaptive changes to maintain cell growth when facing excessive intracellular reductive stress. This will facilitate future research on how potential upstream regulatory genes regulate AtrN and how AtrN regulates downstream genes to cope with cellular reductive stress. It also provides theoretical guidance for the specific modification of high-yield lysine-producing strains.
1. Introduction
Reductive stress refers to the excessive accumulation of reductive substances within cells, leading to an imbalance between oxidation capacity and reductive capacity [1,2,3,4]. Reductive agents (such as NADPH and NADH) are essential for regulating normal physiological metabolism and maintaining intracellular redox balance [5,6,7]. An overaccumulation of reductive agents leads to reductive stress, which can be detrimental to the cells. Under normal physiological conditions, intracellular redox buffers are capable of maintaining a balance between oxidants and reductants. However, when cells suffer damage caused by oxidative or reductive stress, the redox buffers adjust accordingly to counteract these stresses and restore balance. When this compensatory mechanism exceeds a certain threshold, cells experience oxidative or reductive stress. For example, Yu Q et al. found that under normal perfusion conditions, overexpression of Nox4 or dominant-negative Nox4 significantly affected the redox status of the mouse heart. Dominant-negative Nox4 exhibited reductive stress, while Nox4 overexpression exhibited oxidative stress [8]. Dialynas G et al. found that human LMNA mutations activate intracellular signaling pathways and alter the redox homeostasis of muscle tissues, thus leading to reductive stress because of the activation of the NRF-2 pathway and an increase in NADPH levels [9]. In addition, Gameiro PA et al. found that mitochondrial NNT enzymes are crucial for maintaining mitochondrial NADPH levels [10,11]. Overexpression of NNT increased the NADPH/NADP+ ratio, placing melanoma cells in a state of reductive stress. Similarly, Lin YT et al. found that in SK-Hep1 cells, the knockdown of the NNT gene led to reductive stress in the cells. It was manifested as a decrease in the total NADPH/total NADP(H) ratio in both the cells and mitochondria. Meanwhile, the intracellular production of superoxide anion radical(O2•−) increased [12]. These findings indicated that excessive intracellular NADPH levels can lead to reductive stress.
NADPH is a critical reductive cofactor within C. glutamicum cells, because it regulates the intracellular redox state through its involvement in redox reactions, thereby influencing the cell’s physiological functions and transmembrane transport of substances [13,14]. As an electron acceptor, NADPH provides reducing power and participates in various primary and secondary metabolic reactions [15,16]. In C. glutamicum, NADPH acts as an electron acceptor in amino acid biosynthesis (e.g., leucine, isoleucine), so the intracellular NADPH level can be modulated to enhance amino acid production. For example, Junko Ohnishi and colleagues induced a mutation in the gnd gene to increase the intracellular NADPH levels because of more carbon flux into the pentose phosphate pathway, and thus promoted lysine production [17]. With the advancement of cofactor engineering, the research focus on cofactors has also intensified [18,19,20]. Aloke K. Bera and colleagues enhanced intracellular NADPH levels by overexpressing a heterologous NADP-dependent GAPDH enzyme to improve the xylose fermentation of the strain [21]. However, in general, the excessive accumulation of NADPH in C. glutamicum can negatively impact cell proliferation, sugar utilization, and product accumulation [22,23]. Therefore, we assessed the physiological changes in C. glutamicum at high NADPH levels.
The AraC-type transcription factors were first discovered in Escherichia coli, and their C-terminal DNA-binding domain is highly conserved, typically consisting of 99 amino acids. However, there are variations in the regions outside the DNA-binding domain, indicating that different AraC family transcriptional regulators have distinct functions [24]. Currently, research on AraC-type transcription factors primarily focuses on various pathogenic microorganisms. For instance, the AraC family transcriptional regulator Prkc from Bacillus subtilis phosphorylates enzymes in the metabolic pathway to regulate the bacterium’s own metabolism [25]. Moreover, the AraC family transcriptional regulator ToxT from Vibrio cholerae promotes virulence by activating cholera toxin and synergistically regulating the expression of pili [26]. Additionally, a novel AraC family transcriptional regulator, Rsp, has been identified in Staphylococcus aureus that can inhibit biofilm formation [27]. However, research on AraC-type transcriptional regulators in C. glutamicum is limited. As far as we know, only PheR [28] and RipA [29] were investigated in C. glutamicum, which regulate phenol degradation and ferrous ion transmembrane transport, respectively. Interestingly, our previous studies have shown that a novel AraC-type transcription factor, AtrN (encoded by gene Cgl2680) in C. glutamicum could respond to high intracellular NADPH levels [30]. However, AtrN does not directly interact with NADPH, indicating that AtrN is not a direct sensor protein for NADPH fluctuations. Therefore, how does AtrN respond to changes in intracellular NADPH levels? Moreover, what changes AtrN induce in cell growth, proliferation, and physiological functions to mitigate reductive stress? To address these questions, we heterologously expressed the pntAB gene from Escherichia coli in the XQ-5 strain preserved in our laboratory [30]. The resulting strain was named TQ-1, which enabled the conversion of intracellular NADH to NADPH. In this way, we created cells with high intracellular NADPH levels. Subsequently, we constructed an AtrN-deficient strain (TQ-2) and an AtrN-complemented strain (TQ-3) under the high-NADPH condition. High intracellular NADPH levels often lead to reductive stress in cells. Understanding the changes that occur in the bacteria when the transcription factor AtrN combats intracellular reductive stress. This objective is consistent with the research idea of this paper. However, the intracellular NADPH level of the XQ-5 strain is only 0.698 ± 0.12 μmol/g, while the intracellular NADPH level of TQ-1 is 2.27 times that of XQ-5. Therefore, the XQ-5 strain does not meet the condition of a high intracellular NADPH level. Therefore, we used the recombinant strain (TQ-1) with high intracellular NADPH levels as a control for the subsequent measurement of various parameters. Then, the physiological role of AtrN in regulating intracellular NADPH levels and the anti-reductive stress response in C. glutamicum were analyzed using high-throughput fluorescence screening, fluorescence double staining, and gas chromatography techniques. These results provide deeper insights into the physiological adaptation strategies of C. glutamicum under reductive stress and offer a theoretical basis for enhancing cell defense mechanisms by modulating redox stress-related elements, alleviating reductive stress, and improving product synthesis capacity under high NADPH conditions.
2. Materials and Methods
2.1. Strains and Plasmid
The strains and plasmids used in this study are listed in Table 1, and the specific primers designed for this study are shown in Table 2. The XQ-5 strain used in this study is an L-lysine production strain derived from C. glutamicum ATCC 13032 [30]. The GenBank accession number of the pntAB gene is: AY605712. The GenBank accession number of the cgl2680(cg2965) gene is: PV276162. The pK18mobsacB plasmid was used to knock out the target genes. The pTRCmob plasmid was used to enhance the transcription and translation of specific genes. All gene fragments in this experiment were amplified by PCR using 2×Phanta Flash Master MIX (Vazyme, Nanjing, China). All plasmid constructions were performed using ClonExpress II One Step Cloning Kit (Vazyme, Nanjing, China). Plasmid extraction and DNA purification were carried out using FastPure Plasmid Mini Kit-Box2 (Vazyme, Nanjing, China) and FastPure Gel DNA Extraction Mini Kit (Vazyme, Nanjing, China).

Table 1.
Strains and plasmids used in this study.
Table 2.
Primers used in this study.
2.2. Growth Medium and Culture Conditions
C. glutamicum strains were cultured in liquid or solid LB-glucose (LBG) or LB-brain heart infusion-sorbitol (LBHIS) media at 30 °C. Kanamycin (50 mg/L) was used to select target plasmids and strains. The EPO liquid medium was used for the preparation of competent cells of C. glutamicum. Escherichia coli strains were cultured in Luria–Bertani (LB) medium at 37 °C, with 50 μg/mL kanamycin added. E. coli JM109 was used as the host for recombinant plasmid cloning.
Detection principles of NADPH and NADP⁺: The oxidized form of thiazolyl blue (MTT) is reduced to formazan by NADPH through the hydrogen transfer by PMS. The NADPH content is determined by measuring the absorbance at 570 nm using a spectrophotometer (Spectrum, Shanghai, China). The NADP⁺ is reduced to NADPH by glucose-6-phosphate dehydrogenase in the presence of glucose-6-phosphate, and the NADP⁺ content is measured in a similar way to that for NADPH. Detection principles of Acetyl-CoA and CoA: Using the coupled reactions of malate dehydrogenase and citrate synthase, the acetyl-CoA content is proportional to the rate of NADH production. Additionally, α-ketoglutarate dehydrogenase is utilized to catalyze the conversion of CoA, α-ketoglutarate, and NAD⁺ to NADH. The CoA content is proportional to the rate of NADH production. We determined the levels of acetyl-CoA and CoA by monitoring the changes in absorbance at 340 nm.
NADPH and NADP+ were quantified using a commercial kit purchased from Shanghai Yuanxin Biotechnology Co., Ltd. (Shanghai, China), Acetyl-CoA and CoA levels were measured using Acetyl-CoA and CoA detection kits from SolarBio (Beijing, China) and Shanghai Enzyme-linked Biotechnology Co., Ltd. (Shanghai, China), respectively, following the detailed steps provided in the kit instructions.
Branched thiol is a cofactor of maleoylpyruvate isomerase. When the concentrations of the enzyme (MDMPI) and its substrate (maleoylpyruvate) are much greater than the concentration of the branched-chain cofactor, the amount of the branched-chain cofactor is linearly related to the enzyme reaction rate. However, the fumarylpyruvate generated in the experiment will affect the experimental results, which is eliminated by adding an excessive amount of fumarylpyruvate hydrolase. Cells of different strains at the mid-stationary phase of growth were centrifuged to be harvested, and then a 3% perchloric acid solution was added to them. The mixture was centrifuged at 6000 rpm for 10 min, and collected the supernatant after reacting at room temperature for 30 min. The supernatant was diluted 200-fold in 50 mM Tris-HCl buffer. The diluted sample was added to a reaction mixture (120 μM maleoylpyruvate, 20 U/mL MDMPI, 3 U/mL FPH, 50 mM Tris-HCl buffer, pH 8.0, 25 °C), and the change in absorbance at 330 nm was detected. The enzyme activity was calculated using the following formula:
E is the MDMPI enzyme activity, ΔA is the change in absorbance, and ε300 is the molar extinction coefficient of maleoylpyruvate at 330 nm (ε300 = 13,000 M−1 cm−1). A standard curve was drawn using different concentrations of branch sulfur, and branch sulfur content in the samples was calculated from the curve [33].
2.3. Intracellular ROS Detection
Strain cells grown to the mid-log phase were inoculated in LBG medium and cultured overnight. After harvesting, the cells were washed twice with 1 mL PBS. Then, the strain cells were centrifuged at 2000 rpm for 6 min, and the precipitate was resuspended in 1 mL PBS. Next, the precipitate was centrifuged again. After that, A 1 μmol/mL CM-H2DCFDA fluorescent probe solution was added to the cell suspension. Subsequently, the mixture was incubated at 37 °C for 30 min. Using forward scatter (FS) and side scatter (SS) as parameters, the intracellular reactive oxygen species (ROS) content was analyzed with a flow cytometer (Becton, Dickinson and Company, Franklin Lakes, NJ, USA). Finally, ROS intensity was determined based on the logarithm of relative fluorescence probe readings and cell number [34].
2.4. Flow Cytometry for Cell Membrane Permeability
The strain cells were centrifuged at 4000 rpm for 10 min, and the precipitate was collected. Then, the precipitate was pre-treated with 2 g/L EDTA and 0.6 U/mL penicillin. The cells in the precipitate were treated with 1 mg/mL lysozyme at 32 °C for 2 h. After that, protoplasts were prepared after washing with hypertonic solution. Using the FDA/PI double staining method proposed by Aeschbacher et al. [35], 15 μL of propidium iodide (PI) dye at a concentration of 4 μmol/L and 10 μL of fluorescein diacetate (FDA) dye at a concentration of 2 μmol/L were added to 500 μL of protoplasts. The mixture was incubated at room temperature in the dark for 15 min. A higher ratio of double-stained cells to the total number of cells indicates better cell membrane permeability.
2.5. GC-MS Analysis of Cell Membrane Lipid Composition
The fermentation broth was treated with an 11% perchloric acid solution. The strain cells were centrifuged at 10,000 rpm for 20 min and the precipitate was collected. The bacterial cells were disrupted by ultrasonic treatment for one hour. Then, the bacterial cells were centrifuged again at 3000 rpm for 10 min, and the cell debris was collected. Next, lipids were extracted using chloroform–methanol (v:v = 1:2). The extracted lipids were washed with distilled water. The organic phase was evaporated under nitrogen to yield phospholipids. Phospholipids were gradually added to a methanol–toluene solution (v:v = 4:1), and then 200 μL of chloroacetic acid was added. The mixture was then reacted in a boiling water bath for 1 h to methylate the fatty acids. Afterward, 5 mL of 6% Na2CO3 solution was added to neutralize the reaction [36]. The upper organic phase was collected and analyzed for membrane fatty acid composition using GC-MS [37].
2.6. ANS Method for Cell Membrane Fluidity
The strain cells were centrifuged at 6000 rpm for 5 min and the precipitate was collected. The precipitate was washed three times with 2 mL of Tris–-HCl buffer. Then, the 2 mmol/L ANS stock solution was diluted to 0.1 mmol/L and added to the cell suspension. The concentration of ANS in the sample was 2.5 × 10⁻5 mmol/L. The cells were incubated at 26 °C for 20 min, and fluorescence intensity was measured using a microplate reader (Bio Tek, Winooski, VT, USA) (excitation at 385 nm and emission at 425 nm).
3. Results and Discussion
3.1. Construction of Chassis Cell with High Intracellular NADPH Levels
As an example, the XQ-5ΔputA::pntAB strain was constructed by designing specific primers to amplify the upstream and downstream homologous arms (1000 bp) of the putA gene from the XQ-5 genome. The pntAB gene was amplified from the JM109 genome. These three fragments were fused by overlapping PCR and inserted between the BamHI and XbaI restriction sites of the pK18mobsacB to construct the pK18mobsacB-ΔputA::pntAB. The recombinant plasmid was then transformed into XQ-5 via electroporation and plated onto LBHIS solid agar plates. Colony PCR was performed to verify the strain with pK18mobsacB-ΔputA::pntAB. The strain containing the pK18mobsacB-ΔputA::pntAB was inoculated into 10 mL LBG+S medium and cultured for 48 h. Resistance was confirmed by streaking on LBG and LBG K50 plates. Strains that did not grow on the resistance plates but grew on non-resistant plates were selected, and colony PCR was performed to screen the strain XQ-5ΔputA::pntAB (named TQ-1) (Figure 1A). To verify the expression of the pntAB gene in the strain, protein expression was performed. The protein sizes were consistent with the expected values (i.e., 48.7 kDa for PntA and 54.6 kDa for PntB), indicating that the pntAB gene has been successfully expressed in the strain (Figure 1B). Using the same method, an AtrN gene knockout mutant, i.e., TQ-1 ΔAtrN (named TQ-2) was constructed based on the TQ-1 strain (Figure 1C). Subsequently, specific primers were designed to amplify the AtrN gene fragment from the XQ-5 genome and insert it between the BamHI and XbaI restriction sites of the pTRCmob, constructing the pTRCmob-Cgl2680. The vector pTRCmob-Cgl2680 was transformed into TQ-1 via electroporation to construct strain TQ-3 (Figure 1D).
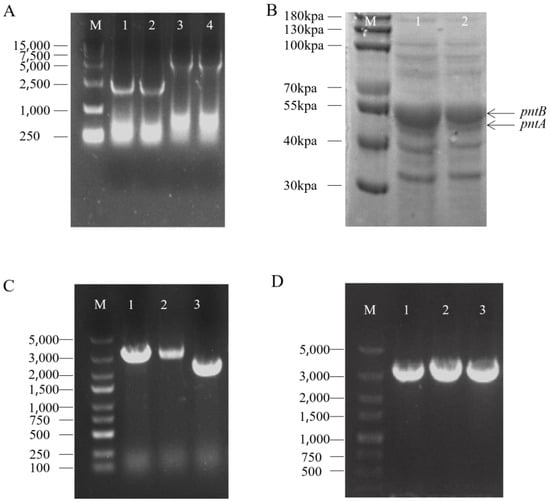
Figure 1.
Construction of Chassis Cell. Validation of Chassis Cell Construction (A) Agarose gel electrophoresis results for the chassis cells with the putA gene knockout and pntAB gene insertion. Lane M is the 15000 marker; lanes 1 and 2 are negative controls; lanes 3 and 4 are samples with successful integration of pntAB. (B) SDS-PAGE analysis of pntAB gene expression in the modified chassis cells. Lane M is the 180 kpa marker; Lanes 1 and 2 are samples with successful expression of the pntAB. (C) Agarose gel verification of successful AtrN gene knockout. Lane M is the 5000 marker; lanes 1 and 2 are negative controls; lane 3 is sample with successful knock out AtrN. (D) Agarose gel confirmation of successful introduction of the AtrN complement vector into the chassis cells. Lane M is the 5000 marker; lanes 1–3 are samples with successful complementation of AtrN.
3.2. Determination of Cell Growth and Cell Survival Rate
The effect of AtrN on cell growth was firstly investigated. To do this, the strains TQ-1, TQ-2, and TQ-3 were inoculated into 30 mL LBG medium and cultured at 30 °C for 60 h. Samples were taken every 4 h to measure the change in OD600. The results showed that the growth of TQ-1 and TQ-3 was similar during the first 16 h. However, TQ-3 exhibited a decelerated growth rate after 20 h of cultivation. Meanwhile, TQ-2 consistently demonstrated a weaker growth performance than both TQ-1 and TQ-3 (Figure 2A). This suggested that AtrN has positive role in promoting cell growth under high intracellular NADPH levels. Based on the growth curves (Figure 2A), we selected strains cultured for 12, 24, 36, and 48 h to measure cell viability and mortality, thus establishing a correlation model of AtrN’s impact on cell viability under high intracellular NADPH levels. The results showed that the cell survival rate of TQ-3 was similar to that of TQ-1 in the early growth stage. TQ-3 displayed higher cell viability in the early growth phase. However, cell viability in TQ-3 declined during the growth at the mid-log phase, resulting in a lower total biomass compared to TQ-1. In contrast, TQ-2 exhibited lower cell viability in early growth, and its total biomass was significantly lower than that of TQ-1 (Figure 2B). These results indicated that the absence of AtrN induces reductive stress within the cells, and thus leading to cell death and maintaining low cell viability.
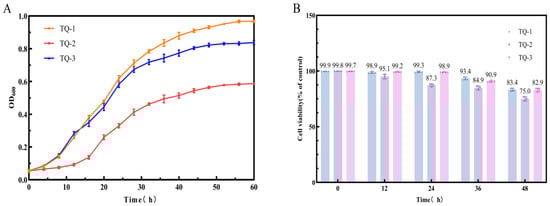
Figure 2.
Analysis of Cell Growth and Survival Rates. (A) Growth curves of strains TQ-1, TQ-2, and TQ-3 over a 60 h period. (B) Survival rates of strains TQ-1, TQ-2, and TQ-3 at 12, 24, 36, and 48 h post-treatment.
3.3. Detection of Intracellular Redox Molecules
The NADPH/NADP⁺ ratio is not only a major indicator of the cell’s redox state but also plays a critical regulatory role in the antioxidant metabolism. We extracted NADP⁺ and NADPH from the samples using both acidic and basic extraction solutions [38]. The results showed that the NADPH level in TQ-2 was significantly lower than that in TQ-1. The NADPH level in TQ-3 was similar to that in TQ-1. The NADP⁺ content followed a similar trend (Figure 3A). The strain without AtrN displays an elevated NADPH/NADP⁺ ratio (Figure 3B), suggesting that NADPH rapidly accumulates in the AtrN-deficient strain. NADPH accumulation results in an overabundance of reducing equivalents and causes a shift toward a reduced cellular state. Conversely, the wild-type strain and the AtrN-complemented strain preserve the normal NADPH levels. This phenomenon indicates that AtrN plays a negative regulatory role in controlling intracellular NADPH levels.
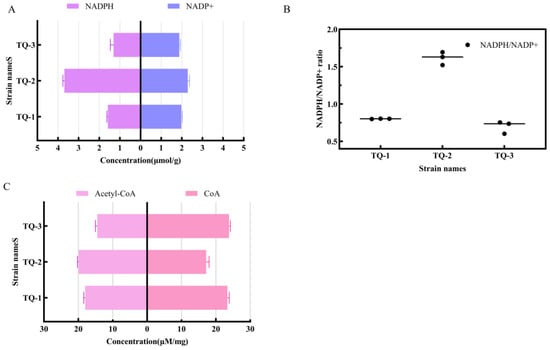
Figure 3.
Analysis of Intracellular REDOX Metabolites and Coenzymes in Different Strains. (A) Comparison of intracellular NADPH and NADH concentrations across different strains. (B) Ratio of intracellular NADPH to NADH across different strains. (C) Levels of intracellular acetyl-CoA and CoA in different strains.
Acetyl-CoA and NADPH are closely linked in the processes of oxidative phosphorylation and fatty acid synthesis in cells. Adequate NADPH supply promotes the utilization of acetyl-CoA, thereby facilitating the synthesis of fatty acids and cholesterol. The results showed that acetyl-CoA levels in TQ-2 were significantly higher than those in TQ-1, while the levels in TQ-3 were similar to those in TQ-1 (Figure 3C). The CoA levels in TQ-2 were lower than those in TQ-1, while the levels in TQ-3 were similar to those in TQ-1. Knockout of AtrN led to increase in acetyl-CoA levels in TQ-2, while the levels of CoA decreased. This suggests that negatively AtrN regulates intracellular acetyl-CoA levels, but positively regulates CoA levels.
Branched thiols are important antioxidants in biological systems because they are involved in scavenging reactive oxygen species (ROS) and reactive nitrogen species (RNS) [39]. Therefore, as a crucial antioxidant in C. glutamicum, the content of branched thiols reflects the cell’s redox state. The results indicate that the branched thiol content varied among the TQ-1, TQ-2, and TQ-3 strains, whereas the deletion of AtrN (i.e., strain TQ-2) resulted in increased branched thiol levels (Table 3). This change was closely associated with the differences in NADPH content.
Table 3.
Quantitative analysis of intracellular branched thiols in different strains.
3.4. Detection of Intracellular ROS Levels
ROS (reactive oxygen species) and NADPH play opposing yet interdependent roles within the cell. They exert bidirectional effects in the regulation of cell apoptosis and proliferation [40]. Using the fluorescent probe CM-H2DCFDA and flow cytometry, we analyzed the accumulation of ROS in different strains. The mean values of FITC-A for each strain were 1561, 2712, and 1568, respectively. The results indicate that ROS levels in TQ-2 are significantly higher than those in TQ-1 and TQ-3 (Figure 4). This suggests that the deletion of AtrN significantly increases ROS accumulation, thereby negatively regulating ROS elimination. This phenomenon is closely associated with the excessive accumulation of NADPH.
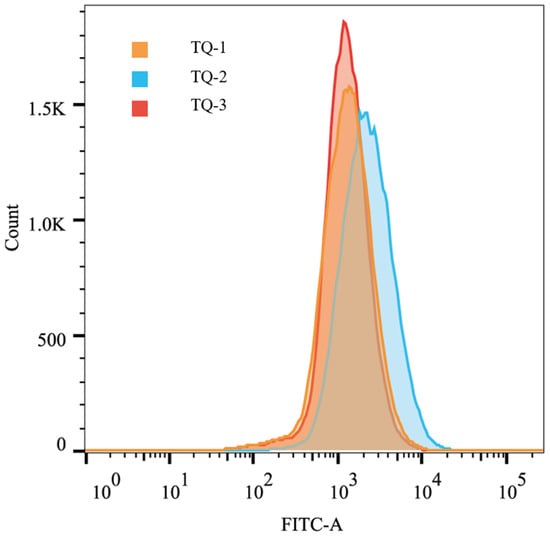
Figure 4.
Two-dimensional histogram of intracellular ROS content analyzed by flow cytometry.
3.5. Detection of Cell Membrane Permeability
Cell membrane permeability is influenced by multiple factors, including temperature, pH, membrane protein expression, and metabolic activity [41]. As mentioned earlier, the AtrN negatively regulates intracellular NADPH levels and NADPH is an important component for reflecting metabolic activity. Therefore, based on previous results, cell membrane permeability may have changed due to variations in NADPH content. To evaluate the effect of AtrN on cell membrane permeability, we used FDA and PI to stain the protoplasts of different strains. The proportion of double-stained cells was used to assess AtrN’s effect on cell membrane permeability. The results show that the proportion of double-stained cells in TQ-1 was 11.4%, in TQ-2 it was 36.4%, and in TQ-3 it was 26.4% (Figure 5). Clearly, the deletion of AtrN significantly increased membrane permeability. Meanwhile, the AtrN-complemented strain exhibited a reduced permeability. This may be due to changes in AtrN expression levels, which affect the synthesis of certain fatty acids or proteins in the cell membrane. In some studies, the permeability of sodium ion channels can be directly or indirectly regulated by tyrosine kinases through certain membrane effects [42]. AtrN may also have similar functions.
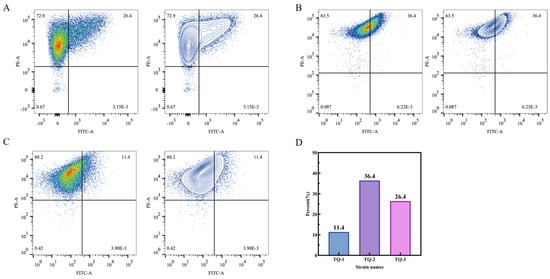
Figure 5.
Analysis of cell membrane permeability using flow cytometry. (A–C) Fluorescence double-staining results of strains TQ-1, TQ-2, and TQ-3, respectively; (D) the proportion of successfully double-stained cells relative to the total cell population for each strain.
3.6. Detection of Cell Membrane Lipids and Membrane Fluidity
Cell membranes contain various lipid components, which play a crucial role in influencing membrane fluidity and permeability [43]. In this study, five fatty acids were primarily detected. C16:0, C18:1 and C18:0 account for the largest proportion among these five fatty acids. The proportions of these fatty acids in TQ-1 were 57.49%, 7.55%, and 13.03%, respectively. And they were 53.23%, 4.17%, and 15.65% in TQ-2, while they were 51.19%, 6.75%, and 12.63% in TQ-3. Additionally, seven other fatty acids were present in smaller amounts. It was observed that the proportion of saturated fatty acids was higher in all strains (i.e., 72.92%, 71.33%, and 66.48%, respectively), while the proportion of unsaturated fatty acids was lower (i.e., 8.39%, 4.68%, and 7.14%, respectively) (Figure 6A). This indicates that the synthesis of unsaturated fatty acids is impaired in the AtrN deletion strain, leading to a relative increase in the fatty acid saturation. As a result, the fluidity of the cell membrane decreases, making the cell membrane rigid, which in turn affects the transport of substances and signal transduction [44]. It should be noted that no significant difference in fatty acid saturation is observed between the complemented strain and the wild-type strain.
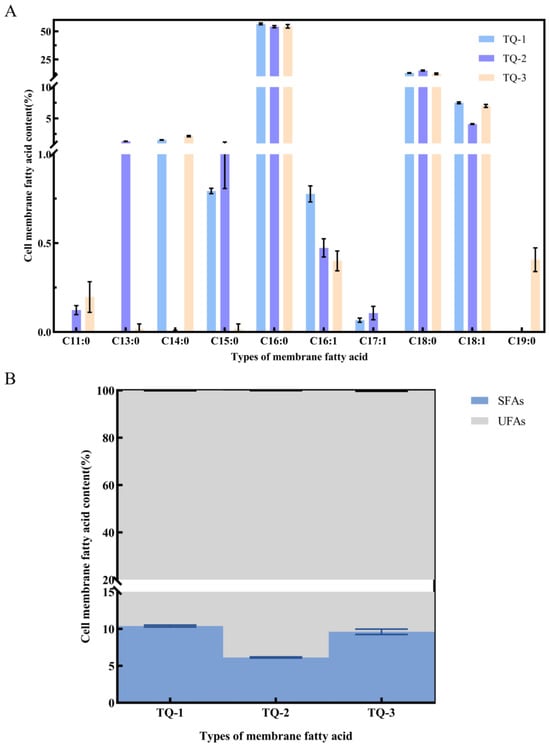
Figure 6.
Analysis of cell membrane fatty acid composition in strains using GC-MS. (A) Fatty acid composition profiles of strains TQ-1, TQ-2, and TQ-3; (B) the ratio of saturated fatty acids (SFAs) to unsaturated fatty acids (UFAs) relative to the total fatty acids in each strain.
The ratio of unsaturated fatty acids to saturated fatty acids (UFA/SFA) is commonly used as an indirect indicator of membrane fluidity [45]. A higher UFA/SFA ratio typically corresponds to greater membrane fluidity. We determined the UFA/SFA ratios for TQ-1, TQ-2, and TQ-3, and indicated that the UFA/SFA ratios were 0.115, 0.065 and 0.101, respectively (Figure 6B). The results show that the ratio in TQ-2 is significantly lower than those TQ-1 and TQ-3, while TQ-3 exhibits a slight decrease compared to TQ-1.
Additionally, we assessed the membrane fluidity of each strain using the ANS method [45]. The results indicated that TQ-2 showed significantly higher fluorescence intensity than that of TQ-1 and TQ-3, while TQ-3 had slightly higher fluorescence intensity compared to that of TQ-1 (Figure 7). This finding is consistent with the membrane fluidity reduced based on the ratio of unsaturated fatty acids to saturated fatty acids (UFA/SFA). The data suggest that the absence of AtrN decreases cell membrane fluidity, which may be attributed to the regulatory role of AtrN in the expression of certain membrane proteins. In this way, it indirectly alters membrane fluidity.
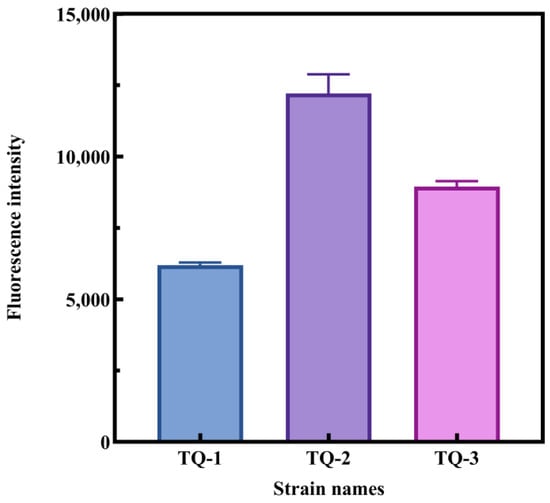
Figure 7.
Assessment of cell membrane fluidity in different strains using ANS fluorescence assay.
4. Conclusions
C. glutamicum is a key strain for amino acid production. It can be engineered to overproduce L-lysine, tryptophan, and other compounds. Studies have shown that modulating intracellular NADPH levels can effectively regulate the synthesis of L-leucine and L-lysine. Therefore, we hypothesize that C. glutamicum has a regulatory network that not only senses intracellular NADPH redox pressure and mitigates redox stress but also affects cell physiology and metabolism. Our results indicate that transcription factor AtrN regulates the C. glutamicum response to NADPH-induced reductive stress. Deletion of AtrN negatively impacts cell growth and survival under high NADPH conditions because excessive reducing substances were accumulated in the AtrN-deficient strain. In addition, deletion of AtrN increased cell membrane permeability and decreased cell membrane fluidity. In this study, we just explored the physiological function of AtrN in regulating intracellular NADPH levels and the anti-reductive stress response in C. glutamicum. In order to fully understand the function of AtrN in alleviating intracellular redox stress, future studies can focus on metabolic pathway analysis. Specifically, they should examine membrane proteins involved in transporting or using intracellular reducing equivalents. Genome-wide library screens can be used to identify upstream genes that regulate AtrN. After that, detailed studies of its binding regions and protein interactions can be carried out. These insights are crucial for understanding how C. glutamicum uses NADPH. They are also important for constructing high-yielding amino acid strains.
Author Contributions
G.X. conducted the experiments, and wrote the paper. S.T. performed the data analysis. Z.G. prepared the tables and figures. J.X. contributed to the conception and design of the experiments. All authors have read and agreed to the published version of the manuscript.
Funding
This work was supported by the Green Bio-fabrication Program of China (Grant number 2021YFC2100900), the National Natural Science Foundation of China (Grant number 32271534), the Class I project of independent innovation of agricultural science and technology in Jiangsu Province (grant numbers CX (22) 1012), and the Top-Notch Academic Programs Project of Jiangsu Higher Education Institutions, the 111 project (Grant number 111-2-06).
Institutional Review Board Statement
Not applicable.
Informed Consent Statement
Not applicable.
Data Availability Statement
Data are contained within the article.
Conflicts of Interest
The authors declare no conflicts of interest.
References
- Sarsour, E.H.; Kumar, M.G.; Chaudhuri, L.; Kalen, A.L.; Goswami, P.C. Redox control of the cell cycle in health and disease. Antioxid. Redox Signal. 2009, 11, 2985–3011. [Google Scholar] [CrossRef] [PubMed]
- Loscalzo, J. Adaptions to hypoxia and redox stress: Essential concepts confounded by misleading terminology. Circ. Res. 2016, 119, 511–513. [Google Scholar] [CrossRef] [PubMed]
- Handy, D.E.; Loscalzo, J. Redox regulation of mitochondrial function. Antioxid. Redox Signal. 2012, 16, 1323–1367. [Google Scholar] [CrossRef]
- Gores, G.J.; Flarsheim, C.E.; Dawson, T.L.; Nieminen, A.-L.; Herman, B.; Lemasters, J.J. Swelling, reductive stress, and cell death during chemical hypoxia in hepatocytes. Am. J. Physiol.-Cell Physiol. 1989, 257, C347–C354. [Google Scholar] [CrossRef]
- Wu, J.; Jin, Z.; Zheng, H.; Yan, L.-J. Sources and implications of NADH/NAD+ redox imbalance in diabetes and its complications. Diabetes Metab. Syndr. Obes. Targets Ther. 2016, 9, 145–153. [Google Scholar]
- Lloret, A.; Fuchsberger, T.; Giraldo, E.; Vina, J. Reductive stress: A new concept in Alzheimer’s disease. Curr. Alzheimer Res. 2016, 13, 206–211. [Google Scholar] [CrossRef]
- Handy, D.E.; Loscalzo, J. Responses to reductive stress in the cardiovascular system. Free Radic. Biol. Med. 2017, 109, 114–124. [Google Scholar] [CrossRef]
- Yu, Q.; Lee, C.F.; Wang, W.; Karamanlidis, G.; Kuroda, J.; Matsushima, S.; Sadoshima, J.; Tian, R. Elimination of NADPH oxidase activity promotes reductive stress and sensitizes the heart to ischemic injury. J. Am. Heart Assoc. 2014, 3, e000555. [Google Scholar] [CrossRef]
- Dialynas, G.; Shrestha, O.K.; Ponce, J.M.; Zwerger, M.; Thiemann, D.A.; Young, G.H.; Moore, S.A.; Yu, L.; Lammerding, J.; Wallrath, L.L. Myopathic lamin mutations cause reductive stress and activate the nrf2/keap-1 pathway. PLoS Genet. 2015, 11, e1005231. [Google Scholar] [CrossRef]
- Rydström, J. Mitochondrial NADPH, transhydrogenase and disease. Biochim. Biophys. Acta (BBA)-Bioenerg. 2006, 1757, 721–726. [Google Scholar] [CrossRef]
- Houtkooper, R.H.; Cantó, C.; Wanders, R.J.; Auwerx, J. The secret life of NAD+: An old metabolite controlling new metabolic signaling pathways. Endocr. Rev. 2010, 31, 194–223. [Google Scholar] [CrossRef] [PubMed]
- Gameiro, P.A.; Laviolette, L.A.; Kelleher, J.K.; Iliopoulos, O.; Stephanopoulos, G. Cofactor Balance by Nicotinamide Nucleotide Transhydrogenase (NNT) Coordinates Reductive Carboxylation and Glucose Catabolism in the Tricarboxylic Acid (TCA) Cycle. J. Biol. Chem. 2013, 288, 12967–12977. [Google Scholar] [CrossRef] [PubMed]
- Zhu, J.; Schwörer, S.; Berisa, M.; Kyung, Y.J.; Ryu, K.W.; Yi, J.; Jiang, X.; Cross, J.R.; Thompson, C.B. Mitochondrial NADP (H) generation is essential for proline biosynthesis. Science 2021, 372, 968–972. [Google Scholar] [CrossRef] [PubMed]
- Li, W.; Kou, J.; Qin, J.; Li, L.; Zhang, Z.; Pan, Y.; Xue, Y.; Du, W. NADPH levels affect cellular epigenetic state by inhibiting HDAC3–Ncor complex. Nat. Metab. 2021, 3, 75–89. [Google Scholar] [CrossRef]
- Ying, W. NAD+/NADH and NADP+/NADPH in cellular functions and cell death: Regulation and biological consequences. Antioxid. Redox Signal. 2008, 10, 179–206. [Google Scholar] [CrossRef]
- Yang, Y.; Sauve, A.A. NAD+ metabolism: Bioenergetics, signaling and manipulation for therapy. Biochim. Biophys. Acta (BBA) Proteins Proteom. 2016, 1864, 1787–1800. [Google Scholar] [CrossRef]
- Bera, A.K.; Ho, N.W.; Khan, A.; Sedlak, M. A genetic overhaul of Saccharomyces cerevisiae 424A (LNH-ST) to improve xylose fermentation. J. Ind. Microbiol. Biotechnol. 2011, 38, 617–626. [Google Scholar] [CrossRef]
- Xu, J.-Z.; Yang, H.-K.; Zhang, W.-G. NADPH metabolism: A survey of its theoretical characteristics and manipulation strategies in amino acid biosynthesis. Crit. Rev. Biotechnol. 2018, 38, 1061–1076. [Google Scholar] [CrossRef]
- Liu, J.; Liu, M.; Shi, T.; Sun, G.; Gao, N.; Zhao, X.; Guo, X.; Ni, X.; Yuan, Q.; Feng, J. CRISPR-assisted rational flux-tuning and arrayed CRISPRi screening of an L-proline exporter for L-proline hyperproduction. Nat. Commun. 2022, 13, 891. [Google Scholar] [CrossRef]
- Li, S.; Ye, Z.; Moreb, E.A.; Hennigan, J.N.; Castellanos, D.B.; Yang, T.; Lynch, M.D. Dynamic control over feedback regulatory mechanisms improves NADPH flux and xylitol biosynthesis in engineered E. coli. Metab. Eng. 2021, 64, 26–40. [Google Scholar] [CrossRef]
- Ohnishi, J.; Katahira, R.; Mitsuhashi, S.; Kakita, S.; Ikeda, M. A novel gnd mutation leading to increased L-lysine production in Corynebacterium glutamicum. FEMS Microbiol. Lett. 2005, 242, 265–274. [Google Scholar] [CrossRef] [PubMed]
- Xu, J.-Z.; Ruan, H.-Z.; Chen, X.-L.; Zhang, F.; Zhang, W. Equilibrium of the intracellular redox state for improving cell growth and L-lysine yield of Corynebacterium glutamicum by optimal cofactor swapping. Microb. Cell Factories 2019, 18, 65. [Google Scholar] [CrossRef] [PubMed]
- Wu, W.; Zhang, Y.; Liu, D.; Chen, Z. Efficient mining of natural NADH-utilizing dehydrogenases enables systematic cofactor engineering of lysine synthesis pathway of Corynebacterium glutamicum. Metab. Eng. 2019, 52, 77–86. [Google Scholar] [CrossRef] [PubMed]
- Seybold, U.; Kourbatova, E.V.; Johnson, J.G.; Halvosa, S.J.; Wang, Y.F.; King, M.D.; Ray, S.M.; Blumberg, H.M. Emergence of community-associated methicillin-resistant Staphylococcus aureus USA300 genotype as a major cause of health care—Associated blood stream infections. Clin. Infect. Dis. 2006, 42, 647–656. [Google Scholar] [CrossRef]
- Diep, B.A.; Chan, L.; Tattevin, P.; Kajikawa, O.; Martin, T.R.; Basuino, L.; Mai, T.T.; Marbach, H.; Braughton, K.R.; Whitney, A.R. Polymorphonuclear leukocytes mediate Staphylococcus aureus Panton-Valentine leukocidin-induced lung inflammation and injury. Proc. Natl. Acad. Sci. USA 2010, 107, 5587–5592. [Google Scholar] [CrossRef]
- Novick, R.P.; Ross, H.; Projan, S.; Kornblum, J.; Kreiswirth, B.; Moghazeh, S. Synthesis of staphylococcal virulence factors is controlled by a regulatory RNA molecule. EMBO J. 1993, 12, 3967. [Google Scholar] [CrossRef]
- Cheung, G.Y.; Wang, R.; Khan, B.A.; Sturdevant, D.E.; Otto, M. Role of the accessory gene regulator agr in community-associated methicillin-resistant Staphylococcus aureus pathogenesis. Infect. Immun. 2011, 79, 1927–1935. [Google Scholar] [CrossRef]
- Chen, C.; Zhang, Y.; Xu, L.; Zhu, K.; Feng, Y.; Pan, J.; Si, M.; Zhang, L.; Shen, X. Transcriptional control of the phenol hydroxylase gene phe of Corynebacterium glutamicum by the AraC-type regulator PheR. Microbiol. Res. 2018, 209, 14–20. [Google Scholar] [CrossRef]
- Küberl, A.; Mengus-Kaya, A.; Polen, T.; Bott, M. The iron deficiency response of Corynebacterium glutamicum and a link to thiamine biosynthesis. Appl. Environ. Microbiol. 2020, 86, e00065-20. [Google Scholar] [CrossRef]
- Wang, L.; Yu, H.; Xu, J.; Ruan, H.; Zhang, W. Deciphering the crucial roles of AraC-type transcriptional regulator Cgl2680 on NADPH metabolism and L-lysine production in Corynebacterium glutamicum. World J. Microbiol. Biotechnol. 2020, 36, 82. [Google Scholar] [CrossRef]
- Schäfer, A.; Tauch, A.; Jäger, W.; Kalinowski, J.; Thierbach, G.; Pühler, A. Small mobilizable multi-purpose cloning vectors derived from the Escherichia coli plasmids pK18 and pK19: Selection of defined deletions in the chromosome of Corynebacterium glutamicum. Gene 1994, 145, 69–73. [Google Scholar] [CrossRef] [PubMed]
- Liu, Q.; Ouyang, S.-p.; Kim, J.; Chen, G.-Q. The impact of PHB accumulation on l-glutamate production by recombinant Corynebacterium glutamicum. J. Biotechnol. 2007, 132, 273–279. [Google Scholar] [CrossRef] [PubMed]
- Feng, J.; Che, Y.; Milse, J.; Yin, Y.-J.; Liu, L.; Ruckert, C.; Shen, X.-H.; Qi, S.-W.; Kalinowski, J.; Liu, S.-J. The gene ncgl2918 encodes a novel maleylpyruvate isomerase that needs mycothiol as cofactor and links mycothiol biosynthesis and gentisate assimilation in Corynebacterium glutamicum. J. Biol. Chem. 2006, 281, 10778–10785. [Google Scholar] [CrossRef]
- Kalyanaraman, B.; Darley-Usmar, V.; Davies, K.J.A.; Dennery, P.A.; Forman, H.J.; Grisham, M.B.; Mann, G.E.; Moore, K.; Roberts, L.J.; Ischiropoulos, H. Measuring reactive oxygen and nitrogen species with fluorescent probes: Challenges and limitations. Free Radic. Biol. Med. 2012, 52, 1–6. [Google Scholar] [CrossRef]
- Aeschbacher, M.; Reinhardt, C.A.; Zbinden, G. A rapid cell membrane permeability test using flourescent dyes and flow cytometry. Cell Biol. Toxicol. 1986, 2, 247–255. [Google Scholar] [CrossRef]
- Jeucken, A.; Molenaar, M.R.; van de Lest, C.H.; Jansen, J.W.; Helms, J.B.; Brouwers, J.F. A comprehensive functional characterization of Escherichia coli lipid genes. Cell Rep. 2019, 27, 1597–1606.e1592. [Google Scholar] [CrossRef]
- Brands, M.; Gutbrod, P.; Dörmann, P. Lipid analysis by gas chromatography and gas chromatography–mass spectrometry. In Plant Lipids: Methods and Protocols; Springer: New York, NY, USA, 2021; pp. 43–57. [Google Scholar]
- Xiao, W.; Loscalzo, J. Metabolic responses to reductive stress. Antioxid. Redox Signal. 2020, 32, 1330–1347. [Google Scholar] [CrossRef]
- Vogelsang, L.; Dietz, K.-J. Regulatory thiol oxidation in chloroplast metabolism, oxidative stress response and environmental signaling in plants. Biochem. J. 2020, 477, 1865–1878. [Google Scholar] [CrossRef]
- Ray, P.D.; Huang, B.-W.; Tsuji, Y. Reactive oxygen species (ROS) homeostasis and redox regulation in cellular signaling. Cell. Signal. 2012, 24, 981–990. [Google Scholar] [CrossRef]
- Ginez, L.D.; Osorio, A.; Vázquez-Ramírez, R.; Arenas, T.; Mendoza, L.; Camarena, L.; Poggio, S. Changes in fluidity of the E. coli outer membrane in response to temperature, divalent cations and polymyxin-B show two different mechanisms of membrane fluidity adaptation. FEBS J. 2022, 289, 3550–3567. [Google Scholar] [CrossRef]
- Feranchak, A.P.; Kilic, G.; Wojtaszek, P.A.; Qadri, I.; Fitz, J.G. Volume-sensitive Tyrosine Kinases Regulate Liver Cell Volume through Effects on Vesicular Trafficking and Membrane Na+ Permeability*. J. Biol. Chem. 2003, 278, 44632–44638. [Google Scholar] [CrossRef] [PubMed]
- Li, X.; Zhou, J.; Han, R.; Yu, F.; Liu, K.; Zhao, M.; Liu, Y.; Xue, Z.; Zhao, S. Phosphatase A1 accessory protein PlaS from Serratia marcescens controls cell membrane permeability, fluidity, hydrophobicity, and fatty acid composition in Escherichia coli BL21. Int. J. Biol. Macromol. 2023, 253, 126776. [Google Scholar] [CrossRef] [PubMed]
- Hirose, M.; Ueno, T.; Nagumo, H.; Sato, Y.; Sakai-Kato, K. Enhancing the Endocytosis of Phosphatidylserine-Containing Liposomes through Tim4 by Modulation of Membrane Fluidity. Mol. Pharm. 2022, 19, 91–99. [Google Scholar] [CrossRef] [PubMed]
- Lenaz, G.; Bertoli, E.; Curatola, G.; Mazzanti, L.; Bigi, A. Lipid protein interactions in mitochondria: Spin and fluorescence probe studies on the effect of n-alkanols on phospholipid vesicles and mitochondrial membranes. Arch. Biochem. Biophys. 1976, 172, 278–288. [Google Scholar] [CrossRef]
Disclaimer/Publisher’s Note: The statements, opinions and data contained in all publications are solely those of the individual author(s) and contributor(s) and not of MDPI and/or the editor(s). MDPI and/or the editor(s) disclaim responsibility for any injury to people or property resulting from any ideas, methods, instructions or products referred to in the content. |
© 2025 by the authors. Licensee MDPI, Basel, Switzerland. This article is an open access article distributed under the terms and conditions of the Creative Commons Attribution (CC BY) license (https://creativecommons.org/licenses/by/4.0/).