Article

The Effect of Carbon Sources on Carotenoid Synthesis by the Novel Rhodococcus corynebacterioides TAO1

by
Elif Yürümez Canpolat
and
Tuba Artan Onat
*
Department of Biotechnology, Faculty of Science, Niğde Ömer Halisdemir University, Niğde 51240, Türkiye
*
Author to whom correspondence should be addressed.
Fermentation 2025, 11(10), 599; https://doi.org/10.3390/fermentation11100599
Submission received: 19 September 2025 / Revised: 16 October 2025 / Accepted: 18 October 2025 / Published: 21 October 2025
(This article belongs to the Special Issue Microbial Metabolism Focusing on Bioactive Molecules)

Abstract

The financial feasibility of microbial carotenoid synthesis can be markedly improved by using widely available and renewable carbon sources. In this study, different carbon sources including molasses, were tested as carbon sources for Rhodococcus corynebacteioides TAO1. The effect of different molasses concentrations (50–250 mL/L) on bacterial growth, carotenoid synthesis, and exopolysaccharide production was determined during a 30-day period. The results demonstrated an upward trend between molasses concentration and bacterial dry weight up to 200 mL/L, with the highest dry weight measured as 0.656 ± 0.049 g. Bacterial growth was decreased at 250 mL/L molasses concentration due to possible carbon-source inhibition. However, carotenoid production exhibited a negative interaction with a maximum yield of 1.572 ± 0.108 mg/g in basal medium, while the lowest carotenoid production was determined as 0.84 ± 0.007 mg/g at 250 mL/L molasses concentration, showing that increased carbon availability might inhibit pigment biosynthesis. FTIR analysis indicated significant functional groups, such as C=O, O-H, C=C, and =CH, with significant peaks at 1713, 1655, and 1459 cm−1, indicating the presence of carotenoid intermediates. The data highlight the interaction between carbon source concentration and microbial metabolism, emphasizing the importance of optimal nutrient factors for improving both carotenoid and EPS production. This research presents significant insights into economical biotechnological methods for the production of microbial pigments and biopolymers from industrial by-products.

1. Introduction

Certain pigments, which give organisms their color, also help plants produce oxygen through photosynthesis and increase pollination. Similarly, microbes frequently contain pigments, and carotenoids are the most prevalent type of pigment found in bacteria [1,2]. Carotenoids, a class of organic pigments, are primarily categorized into xanthophylls (such as astaxanthin, cantaxanthin, and zeaxanthin) and carotenes (such as beta-carotene, lycopene, and phytoene) [3]. These pigments play a crucial role in electron transport processes. Carotenoids are naturally synthesized secondary metabolites that exhibit potent anti-cancer, anti-inflammatory, antioxidant and coloring properties. Due to these biological and functional characteristics, they have become a significant focus of interest in the nutraceutical, pharmaceutical, food, textile and cosmetic industries [4]. Carotenoids including beta-carotene, alpha-carotene, and cryptoxanthin serve as precursors to vitamin A. With increasing public awareness of the potential toxicity of synthetic food additives, there is a growing demand for naturally derived carotenoids. Regulatory restrictions on synthetic carotenoids have further driven interest in microbial production as a safer and more sustainable alternative [5,6,7].
Research efforts are focused on large-scale microbial production of carotenoids due to their ability to scavenge free radicals. Microbial synthesis is favored over other methods due to its efficiency and sustainability [2,8]. The controlled cultivation of carotenoid-rich microbial biomass in bioreactors using cost-effective substrates presents a promising approach for industrial production [6]. Extensive studies have explored carotenoid production in various genera, including Staphylococcus, Micrococcus, Paracoccus, Pseudomonas, Dietzia, Flavobacterium, and Chromobacterium [9,10]. Additionally, research has examined carotenoid biosynthesis in cyanobacteria and yeast, Mycobacterium tuberculosis, Novosphingobium aromaticivorans, Bradyrhizobium sp., Rhodotorula mucilaginosa, Sporidiobolus pararoseus, Pseudomonas paucimobilis, Sphingopyxis alaskensis, Plesiocystis sp., and other marine bacteria. New biotechnological applications ought to be employed in order to meet these demands. By identifying the ideal natural conditions, it is possible to exactly scale up the production of any microbial product. The goal of recent research is to meet the global need for naturally synthesized carotenoids by high-carotenoid-producing yeasts such as Rhodotorula sp., using agro-industrial wastes and optimized bioreactor designs [11]. Among photosynthetic bacteria, Rhodobacter sphaeroides, Rhodopseudomonas palustris, and Rhodospirillum rubrum are known to produce significant amounts of carotenoids [12,13,14,15].
Various strains of Rhodococcus are capable of producing diverse carotenoid pigments. Some strains not only synthesize beta-carotene but also rare aromatic carotenoids such as chloroactene and isorenieratene. Additionally, Rhodococcus species have demonstrated potential in producing biosurfactants, carotenoids, triacylglycerols, and antimicrobial compounds [16,17,18]. Rhodococcus sp. are metabolically versatile, non-sporulating, Gram-positive bacteria capable of surviving in diverse environments, with remarkable abilities in biocatalysis, bioremediation, biosynthesis, and lignin utilization. Their capacity to degrade a wide range of organic pollutants and produce valuable compounds, such as carotenoids, biosurfactants, and triacylglycerols, highlights their potential as efficient hosts for protein expression and as sustainable platforms for biotechnological applications [19]. This study focuses on a novel carotenoid-producing strain, Rhodococcus corynebacterioides TAO1, isolated from a wastewater discharge site in Niğde, Türkiye. The strain was identified using molecular techniques, and its ability to synthesize carotenoids was evaluated using different carbon sources, including acetate, glucose, mannitol, sucrose, and molasses. Additionally, the study investigated the effect of molasses concentration on carotenoid production.

2. Materials and Methods

2.1. Bacterial Strain Isolation and Identification

The R. corynebacterioides TAO1 strain was isolated from the Akkaya Dam which was the wastewater discharge area of Niğde. A single colony was inoculated onto nutrient agar and incubated at room temperature for three days. The strain was identified by genomic DNA extraction and by 16S rDNA sequencing. A Power Soil DNA Extraction Kit (Qiagen, Mo Bio Laboratories, Hilden, Germany) was used for genomic DNA isolation as performed by Jiang et al. (2018) [20], PCR amplification was conducted using 27F and 1492R universal primers in a 25 μL reaction mixture containing 10 mM forward and reverse primers, Dream Taq Master mix (Thermo Fisher Scientific Inc., Waltham, MA, USA), and the DNA template. Reaction conditions consisted of preheating at 94 °C for 3 min and the subsequent 30 cycles of 94 °C (1 min), 55 °C (1 min), and 72 °C (3 min). After the completion of 30 cycles, final chain elongation was conducted at 72 °C for 5 min. The 16S rDNA gene sequence was compared with available sequences in the GenBank database via BLAST (Basic Local Alignment Search Tool) (http://www.ncbi.nlm.nih.gov/blast/, accessed on 13 January 2023), and phylogenetic analysis was performed using MEGA (version 11.0) software.

2.2. Carotenoid Production

Pigment production was carried out in a medium containing 5 g/L peptone, 3 g/L yeast extract, and 10 g/L of various carbon sources, including glucose, acetate, mannitol, sucrose, and molasses. Sugar beet molasses was obtained from Bor Sugar Factory (Niğde, Türkiye).
For the molasses concentration experiments, a stock solution was prepared by modifying the method described by Kabadayı et al. (2025) [21]. Briefly, 300 g/L stock molasses solution was treated with 1.0% H2SO4, and subsequently diluted with distilled water to a final concentration of 1% (v/v). The broth medium containing 1% molasses, 0.5 g KH2PO4 and 1 g (NH4)2SO4 was assigned as basal medium (BM). The effect of molasses concentration on carotenoid synthesis was determined at final molasses concentrations of 50, 100, 150, 200, and 250 mL/L by adding respective volumes of stock solution. The inoculation ratio was maintained at 1/100 mL/mL, and cultures were incubated for one month.
After the incubation period the culture media were centrifuged at 10,000 rpm for 20 min, followed by rinsing with distilled water and drying at 60 °C overnight. The bacterial dry biomass was then suspended in 3 M HCl, stirred at 28 °C at 100 rpm for 30 min, and centrifuged at 10,000 rpm for 20 min. Carotenoid extraction was performed by suspending the pellet in 40 mL of acetone, followed by stirring at 150 rpm for 40 min at 30 °C. The extracted carotenoid was collected in the supernatant and quantified by measuring absorbance at 480 nm using a spectrophotometer (Jenway, Cole-Parmer Ltd., Vernon Hills, IL, USA).
The carotenoid yield in R. corynebacterioides TAO1 was determined using the following equation:
Carotenoid yieldg carotenoid/g dry cell weight) = (A × D × V)/0.16 × W
where A represents the absorbance at 480 nm, D is the dilution factor, V is the solvent volume (mL), and W is the dry weight of the bacterial biomass [5,22]. All measurements were performed in triplicate and the results were presented in µg/g.

2.3. Determination of EPS Production

The method for determining exopolysaccharide (EPS) production was adapted from Frengova et al. (2000) [23]. After incubating the bacterial strains at 37 °C for 18 h, 1 mL of the culture was collected and boiled at 100 °C for 10 min before allowing it to cool to room temperature. The sample was then centrifuged at 10,000 rpm for 15 min at 20 °C, and the supernatant was discarded. To precipitate EPS, twice the volume of cold ethanol was added, followed by incubation at −20 °C for 24 h. The centrifugation step was repeated under the same conditions at 4 °C, after which the supernatant was removed, and the remaining ethanol was evaporated. The resulting pellet was dissolved in 1 mL of distilled water and stored at 4 °C until further analysis. The EPS concentration was quantified spectrophotometrically using the phenol-sulfuric acid method, with a glucose standard curve as reference [23]. All measurements were performed in triplicate and the results were presented in mg/L.

2.4. UV-Vis and FT-IR Spectroscopy Analyses

The carotenoid extracts obtained in Section 2.2 were scanned between 200 and 800 nm wavelength to find the maximum absorption spectra [24]. The light absorption of pigments isolated from R. corynebacterioides TAO1 was determined using a UV-Vis spectrophotometer (Multiskan GO, Thermo, Waltham, MA, USA). The functional groups of carotenoids were detected by Fourier Transform Infrared spectroscopy (FTIR) (Vertex 70, Bruker, Ettlingen, Germany) analysis in the frequency range of 400–4000 cm−1 using an Attenuated Total Reflectance (ATR) attachment.

2.5. Statistical Analysis

All experiments in this study were conducted as triplicate and the means of carotenoid yield, dry weight, and EPS were presented as the responsive values. Analysis of variance (ANOVA) and Duncan’s multiple range tests (p < 0.05) were used to determine the significant differences in investigated parameters of R. corynebacterioides TAO1 grown with various carbon sources, using IBM Statistical Package for Social Sciences (SPSS, Version 24.0, SPSS Inc., Chicago, IL, USA) software.

3. Results and Discussion

This study emphasizes the use of molasses in pigment and EPS production by the newly isolated bacterium. The pigment molecules were identified by UV-Vis and FT-IR spectroscopy, and the importance of microbial pigments is expressed based on previous research [25,26,27].

3.1. Identification of the Bacterial Strain TAO1

The TAO1 strain was isolated from Akkaya Dam, located within Niğde Ömer Halisdemir University campus. The Rhodococcus genus comprises Gram-positive, aerobic bacteria with coccoid to rod-like morphology. Sequence analysis using BLAST revealed 99% similarity to the 16S rDNA gene sequence of R. corynebacterioides TAO1. This sequence was deposited in GenBank under the accession number OQ249664. Phylogenetic analysis was conducted using the Maximum Likelihood method in MEGA11. The resulting phylogenetic tree, which compares the obtained sequence with those of other Rhodococcus species and includes Escherichia coli as an outgroup, is presented in Figure 1.

3.2. The Effect of Different Carbon Sources on Carotenoid Production

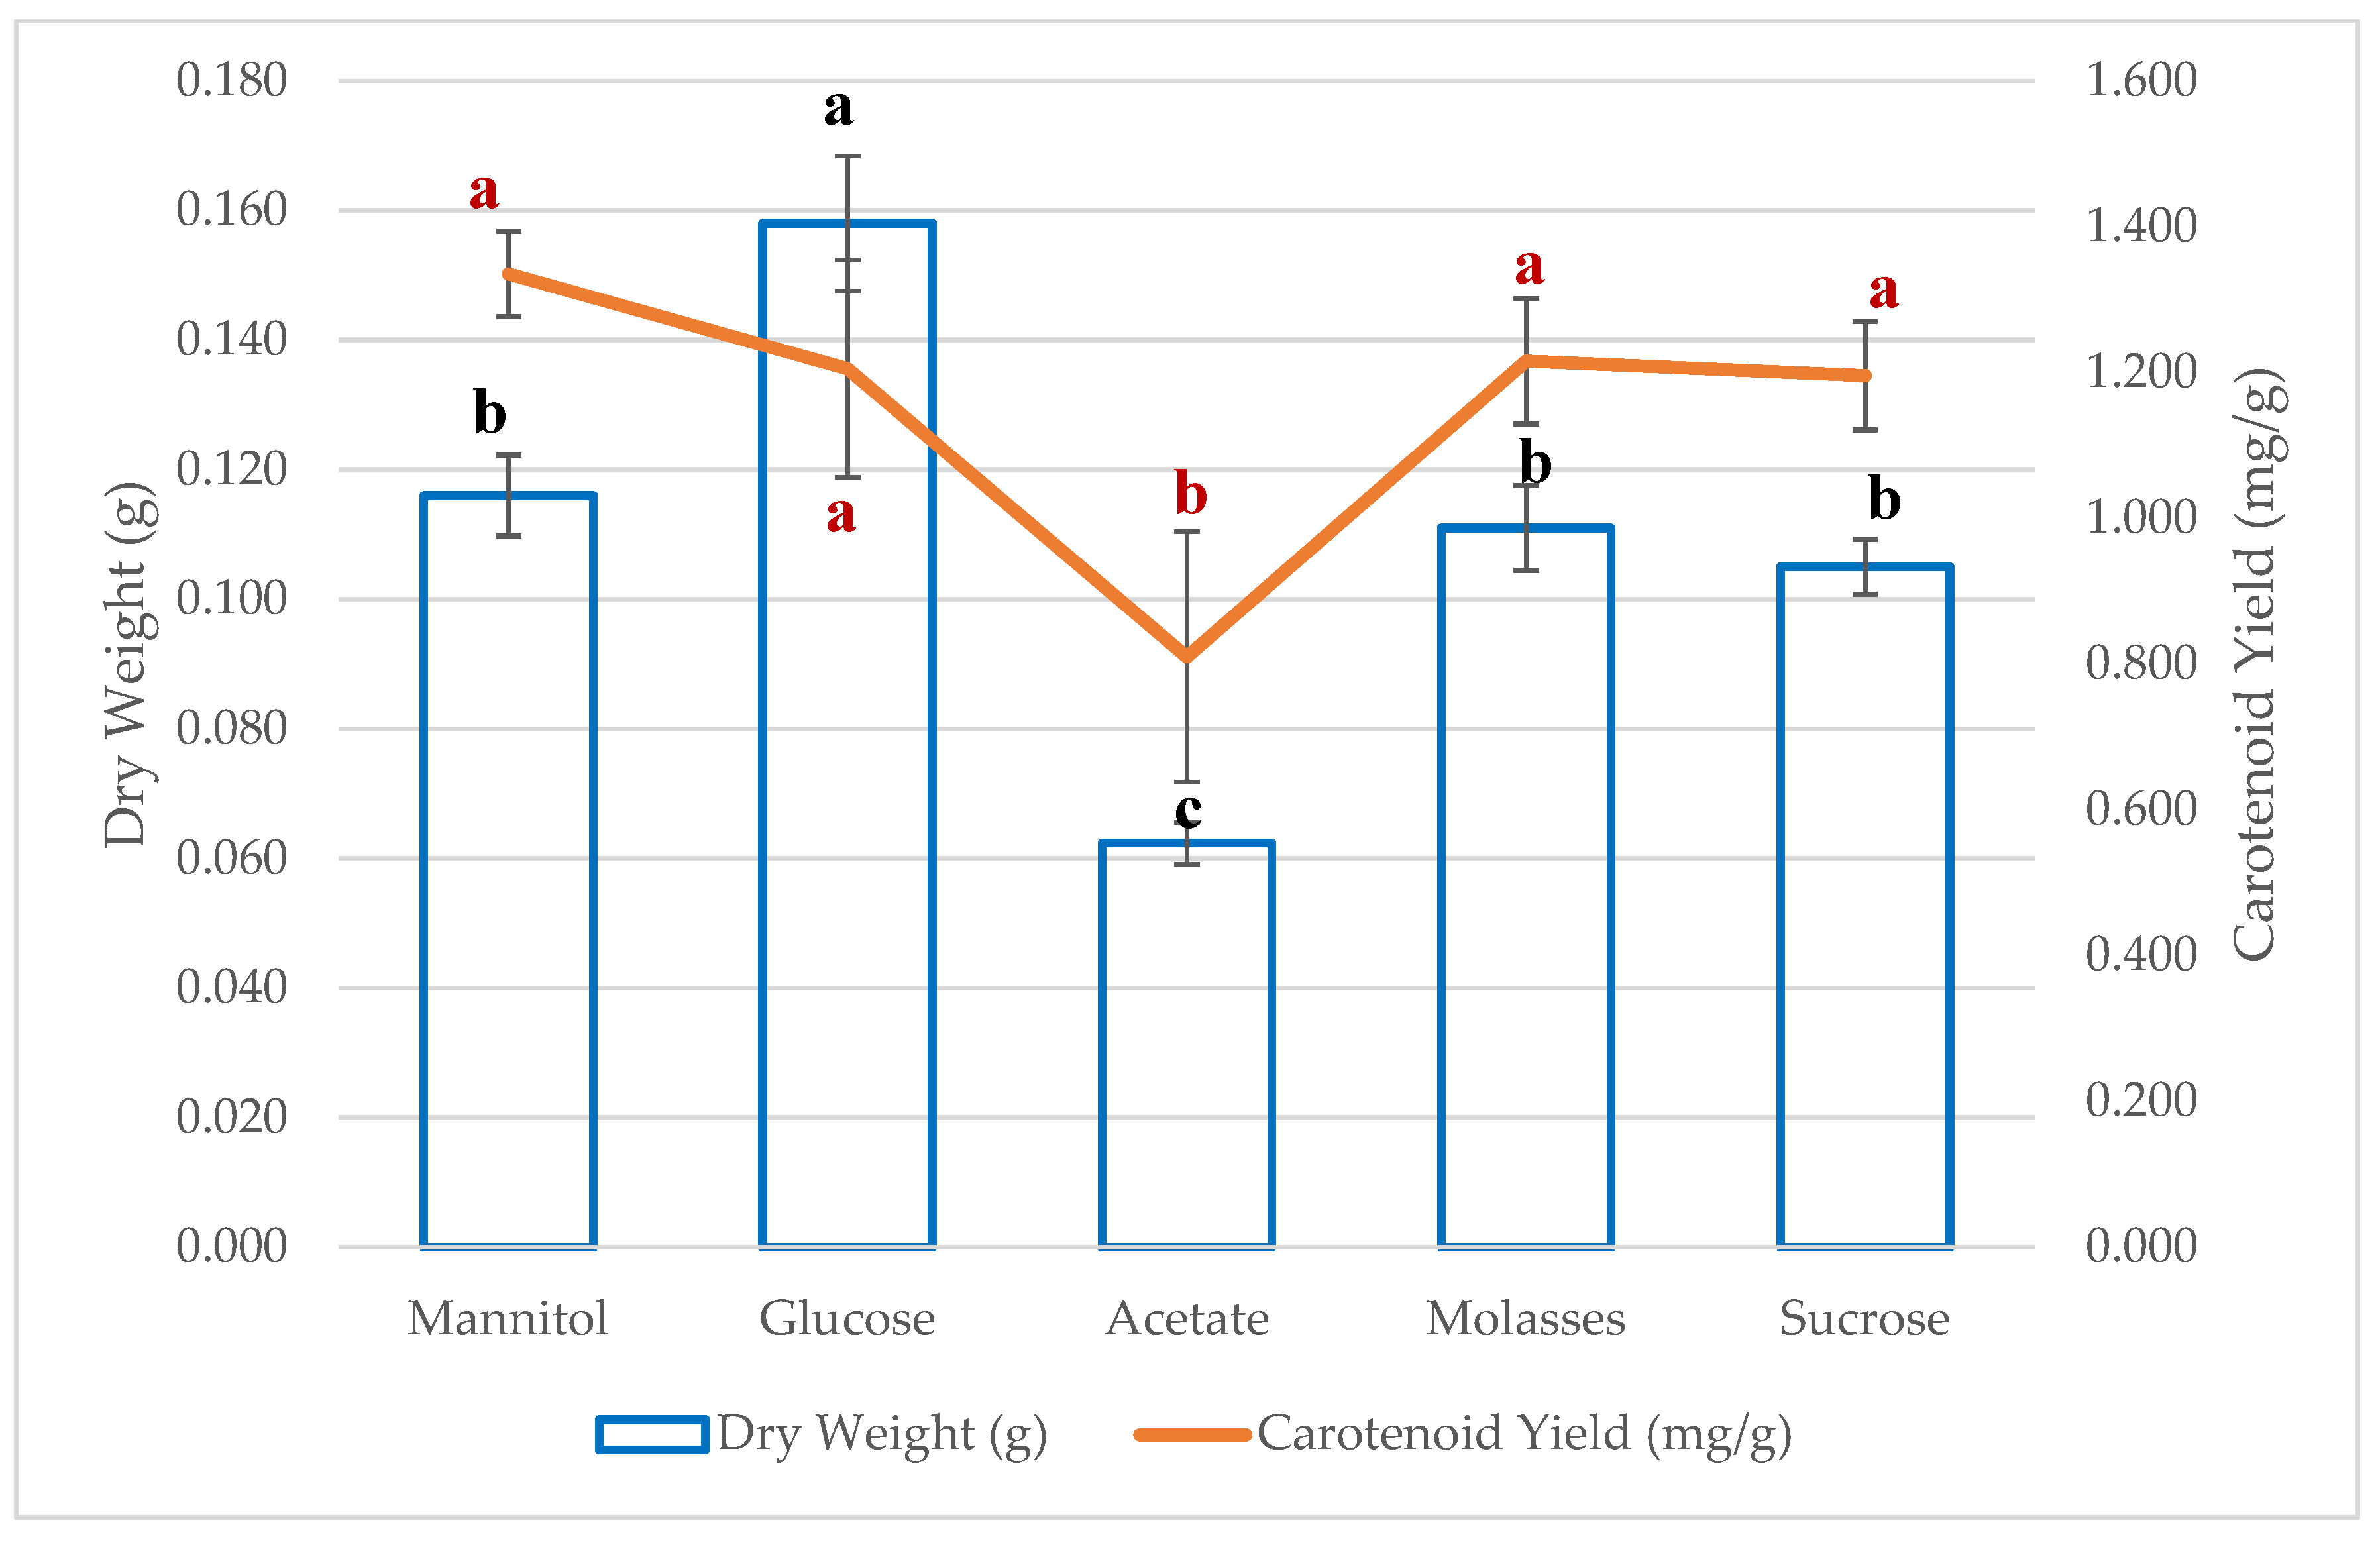
In this study, the dry weight, carotenoid yield, and EPS production of R. corynebacterioides TAO1 were evaluated in response to different carbon sources (glucose, sucrose, mannitol, acetate, and molasses) after a 30-day incubation period at room temperature. The bacterial dry weight was recorded as 0.158 ± 0.01 g for glucose, while values for mannitol, molasses, sucrose, and acetate were 0.116 ± 0.006 g, 0.111 ± 0.22 g, 0.105 ± 0.004 g, and 0.062 ± 0.003 g, respectively (Table 1, Figure 2).
Carotenoid production in non-photosynthetic bacteria such as Rhodococcus plays a crucial role in protecting against oxidative stress. An increase in biomass generally correlates with higher carotenoid yields, highlighting the importance of cost-effective carbon sources like glucose and glycerol in culture media [16]. Various studies have investigated alternative carbon sources, including artificial sugar wastewater, date syrup, and sugarcane molasses [28,29,30].
The carotenoid yield of R. corynebacterioides TAO1 was calculated based on its absorbance and dry weight. High carotenoid levels were observed in cultures supplemented with mannitol (1.335 ± 0.058 mg/g) and molasses (1.216 ± 0.348 mg/g), followed closely by glucose (1.205 ± 0.149 mg/g) and sucrose (1.196 ± 0.074 mg/g). Acetate, which inhibited biomass synthesis, yielded the lowest carotenoid output (0.81 ± 0.172 mg/g). A study on Rhodotorula sp. found that glucose, fructose, sucrose, and treated/untreated molasses yielded total carotenoid contents of 1.8 mg, 1.6 mg, and 1.7 mg, respectively [28]. Similarly, Marzieh et al. (2009) [30] reported total carotenoid contents of 6.72 mg and 6.89 mg for cultures supplemented with glucose and date syrup, respectively. In another study examining the effect of glucose, xylose, fructose, and sucrose on carotenoid production by Rhodococcus aetherivorans N1, cultures with 30 g/L fructose produced 13.6 mg/L of carotenoids, with a maximum carotenoid yield of 4.6 mg/g. When glucose was the sole carbon source, the highest carotenoid yield reached 6.4 mg/g, with a carotenoid titer of 11.3 mg/L [17]. These findings suggest that both bacterial growth and carotenoid production vary significantly depending on the carbon source used. According to the literature, this part of the biomass, besides containing microbial cell constituents, may also contain bacteriochlorophylls and carotenoids [4]. These represent other important products worth investigating as a perspective of this study. Indeed, according to the literature, these compounds have significant relevance in various industrial applications (e.g., food, pharmaceutical, and cosmetic sectors). For instance, carotenoids are commonly used as coloring agents in food and as additives in cosmetics, whereas bacteriochlorophylls show promise as chemical compounds for photodynamic therapy [17].
EPS production by R. corynebacterioides TAO1 was also evaluated, with sucrose yielding the highest EPS level (28.0 ± 0.167 mg/L). Glucose and molasses had similar effects, resulting in EPS levels of 18.774 ± 1.857 mg/L and 18.407 ± 0.962 mg/L, respectively. The lowest EPS yields were observed with mannitol (10.354 ± 1.16 mg/L) and acetate (10.664 ± 0.198 mg/L) (Table 1). EPS is a macromolecule containing repetitive monosaccharide structures secreted by microorganisms on the extracellular surface. It has high solubility in water and typically adheres to the cell surface to combat abnormal conditions such as excessive salinity, temperature, and pH, as well as ultraviolet (UV) light. Furthermore, environmental stress can potentially stimulate EPS production and confer various physiological activities and properties, including antioxidant, antibacterial, antitumor, emulsifying, and flocculation activities, thereby contributing to the comprehensive applications of EPS in the food, pharmaceutical, and environmental industries [31,32]. Due to their ability to synthesize unique biomolecules, Rhodococcus bacteria have great potential for industrial applications in the food and medical industries. Previous studies have investigated the structure of EPS produced by Rhodococcus sp. 33, Rhodococcus rhodochrous S-2, Rhodococcus sp. RHA1, and Rhodococcus erythropolis PR4, including its monosaccharide composition and glycosidic bonds [33,34,35,36]. While various biometabolites produced by Rhodococcus bacteria are widely used, further research is needed on the structural properties and yield of EPS.
In a study investigating the effects of pH, temperature, and salinity on EPS production, it was reported that the newly identified Rhodococcus qingshengii QDR4-2 bacterium achieved a maximum EPS production of 3.85 g/L [37]. The study also highlighted the stimulatory and restrictive effects of environmental factors on EPS production and contributed to elucidating the chemical structures of the produced EPS molecules.
Although molasses contains 50% sugar and various compounds, it was found to have the second highest carotenoid production value when compared to the performance of other pure carbon sources. Therefore, different molasses concentrations were tested to determine their effect on carotenoid production in the R. corynebacterioides TAO1 strain. Among the tested carbon sources, molasses was identified as an effective substrate for enhancing carotenoid production and was therefore selected as the carbon source for further optimization studies. Various molasses concentrations were investigated to determine the more effective concentration for optimal carotenoid production. The next part of this study discusses the effect of concentration on growth of bacteria and the production of carotenoids.

3.3. The Effect of Molasses Concentration on Carotenoid Production

Molasses, a by-product of sugar beet and sugar cane processing, is often used as a cost-effective substrate in fermentation processes due to its high sucrose content and rich composition of essential minerals and vitamins [38]. Determining the optimum molasses concentration is essential for optimizing carotenoid biosynthesis, bacterial growth, and exopolysaccharide (EPS) production.
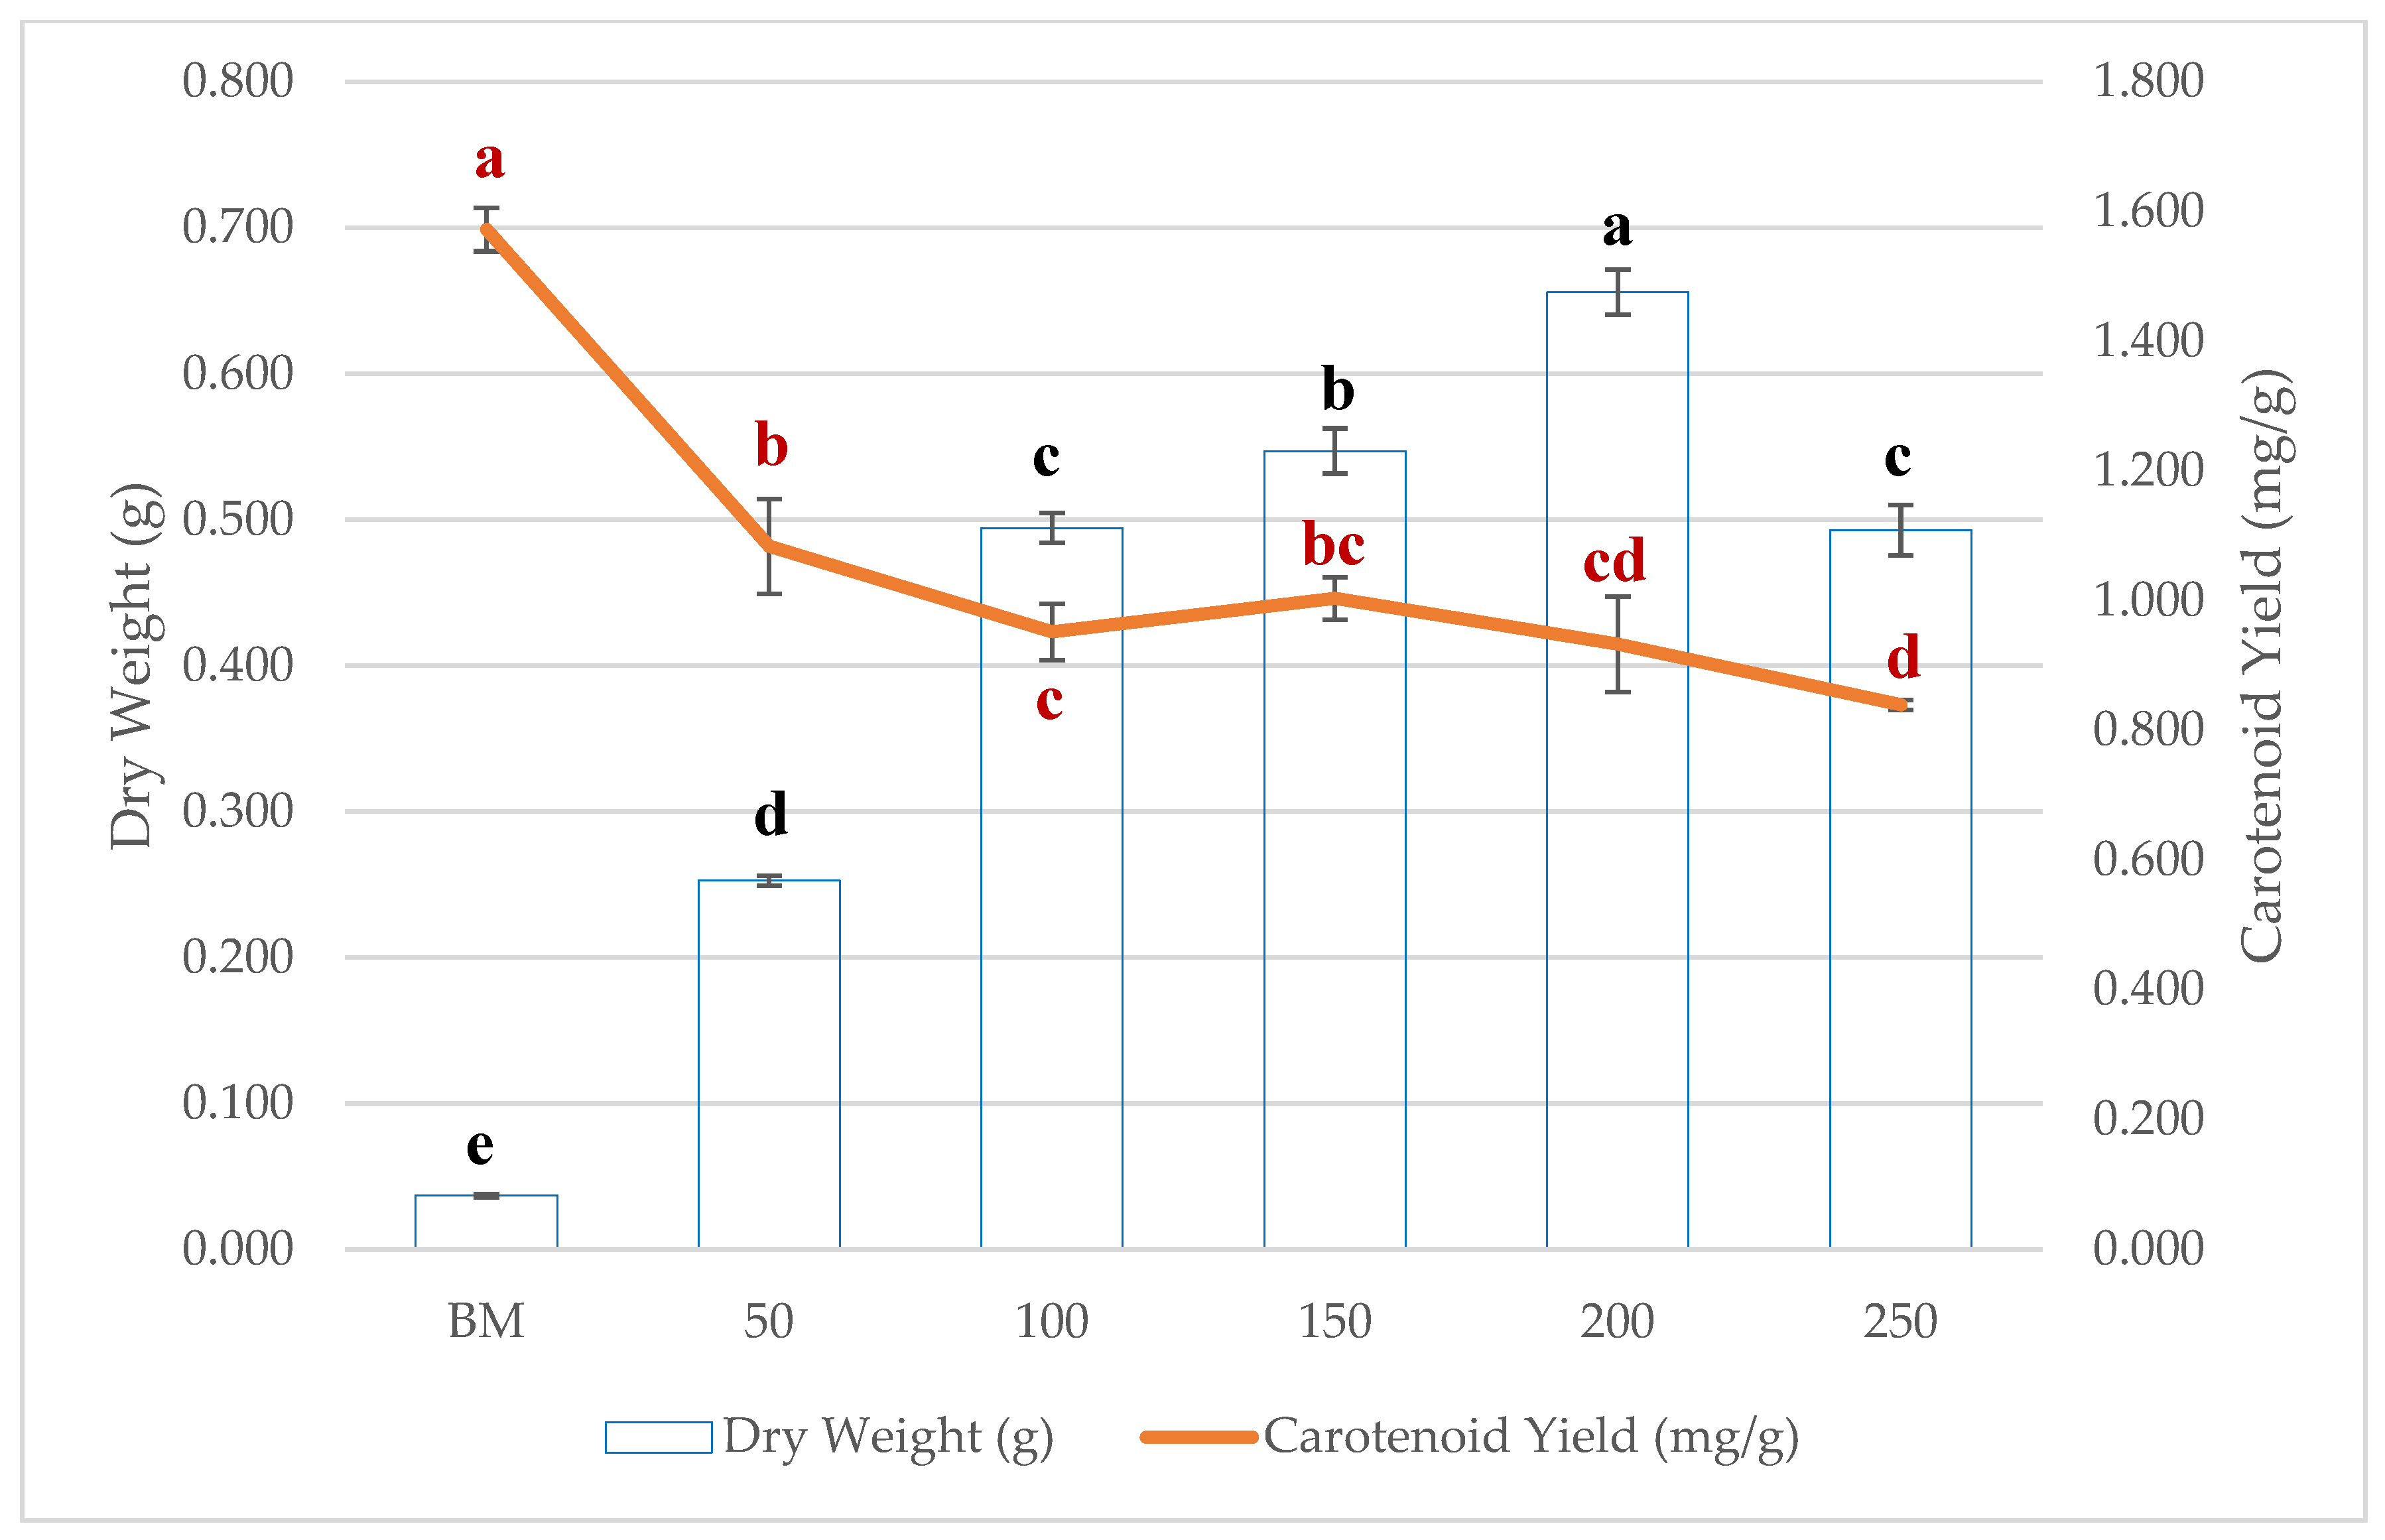
During a 30-day incubation period at room temperature, the dry weight, carotenoid content, and EPS production of R. corynebacterioides TAO1 were determined at different molasses concentrations (50, 100, 150, 200, and 250 mL/L). The results indicated that bacterial dry weight increased with molasses concentration up to 200 mL/L but decreased at 250 mL/L. The highest dry weight was recorded at 200 mL/L molasses (0.656 ± 0.049 g), whereas the lowest was observed in BM (0.037 ± 0.001 g). The dry weight values at 50, 100, 150, and 250 mL/L molasses were measured as 0.253 ± 0.003 g, 0.494 ± 0.01 g, 0.547 ± 0.035 g, and 0.493 ± 0.052 g, respectively (Table 2). The carotenoid content of R. corynebacterioides TAO1 was quantified using Equation (1), based on bacterial dry weight. The results (Table 2) showed that increasing molasses concentration did not enhance carotenoid production. Instead, the highest carotenoid yield (1.572 ± 0.108 mg/g) was observed in BM. At molasses concentrations of 50, 100, 150, 200, and 250 mL/L, carotenoid production was measured as 1.084 ± 0.073 mg/g, 0.952 ± 0.044 mg/g, 1.004 ± 0.033 mg/g, 0.934 ± 0.074 mg/g, and 0.84 ± 0.007 mg/g, respectively (Figure 3). In contrast, EPS production exhibited a positive correlation with molasses concentration. EPS levels were measured as 17.449 ± 0.835 mg/L, 19.496 ± 0.056 mg/L, 23.105 ± 1.192 mg/L, 28.643 ± 1.486 mg/L, 41.346 ± 2.526 mg/L, and 71.583 ± 6.265 mg/L at increasing molasses concentrations (Table 2).
The lowest carotenoid production (0.84 ± 0.007 mg/g) was observed at a molasses concentration of 250 mL/L. The decrease observed in carotenoid production parallel to the increase in molasses concentration can be attributed to the inhibitory effect of high substrate levels on cellular metabolism. An excessive carbon source may limit the synthesis of secondary metabolites by causing cells to prioritize growth and energy production pathways. This situation becomes particularly apparent in energy-requiring biosynthetic processes such as pigment synthesis. These results are consistent with earlier research showing that higher carbon levels can suppress the growth of bacteria and the production of carotenoid pigments. It has been demonstrated that excessive carbon availability inhibits the growth of microorganisms and the production of pigments [39]. In Rhodopseudomonas faecalis, for instance, growth rates and carotenoid production were decreased when malic acid concentrations were raised to 1.6% and 3.2% [14]. In order to shield cells from environmental stress, carotenoid accumulation is usually a stress response that is triggered when nutrients are scarce [40]. The greatest carotenoid yield was obtained in a continuous system at 25 g/L molasses, and a similar pattern was noted in D. natronolimnaea, where biomass growth plateaued at high molasses concentrations [38]. The studies were performed also consistently showed that carotenoid synthesis decreased as molasses concentrations increased. Since substrate costs constitute a major portion of microbial fermentation expenses, utilizing low-cost and renewable resources can significantly improve the economic feasibility of carotenoid production [41]. The capacity of Rhodococcus species to metabolize a variety of aromatic chemicals, such as aromatic acids and phenolic compounds, is well recognized [42]. The ability of R. corynebacterioides TAO1 to use molasses, a widely accessible industrial waste, as a carbon source for carotenoid biosynthesis was assessed in this work. Similar research has looked at the manufacture of carotenoid from agricultural leftovers such as maize cob, rice straw, and wheat straw hydrolysates. For example, these hydrolysates yielded 3.04 mg/g, 2.90 mg/g, and 3.01 mg/g of carotenoids for the R. aetherivorans N1 strain, respectively. Furthermore, it has been observed that when cultivated using glycerol as a carbon source, R. opacus PD630 and Rhodococcus sp. ANT-H53B yield 0.1 mg/g carotenoids [6,43]. This study shows that R. corynebacterioides TAO1 strain is an efficient carotenoid producer due to its wide substrate utilization spectrum.
The production of pigments from microorganisms requires intensive investigation in aquatic ecosystems with diverse bacterial populations. It has been demonstrated that the utilization of agricultural and industrial residues in water leads to increased pigment production, and this strategy has been shown to reduce pigment production costs across various industries [44]. Therefore, different approaches are needed to understand the synergistic effect of substrates and culture conditions on pigment production in bacteria isolated from aquatic ecosystems. Industrial needs can be met by using waste in bacterial pigment production, and the risks posed by synthetic pigments used in food and medicine can be eliminated.

3.4. UV-Vis and FTIR Spectroscopy Analyses

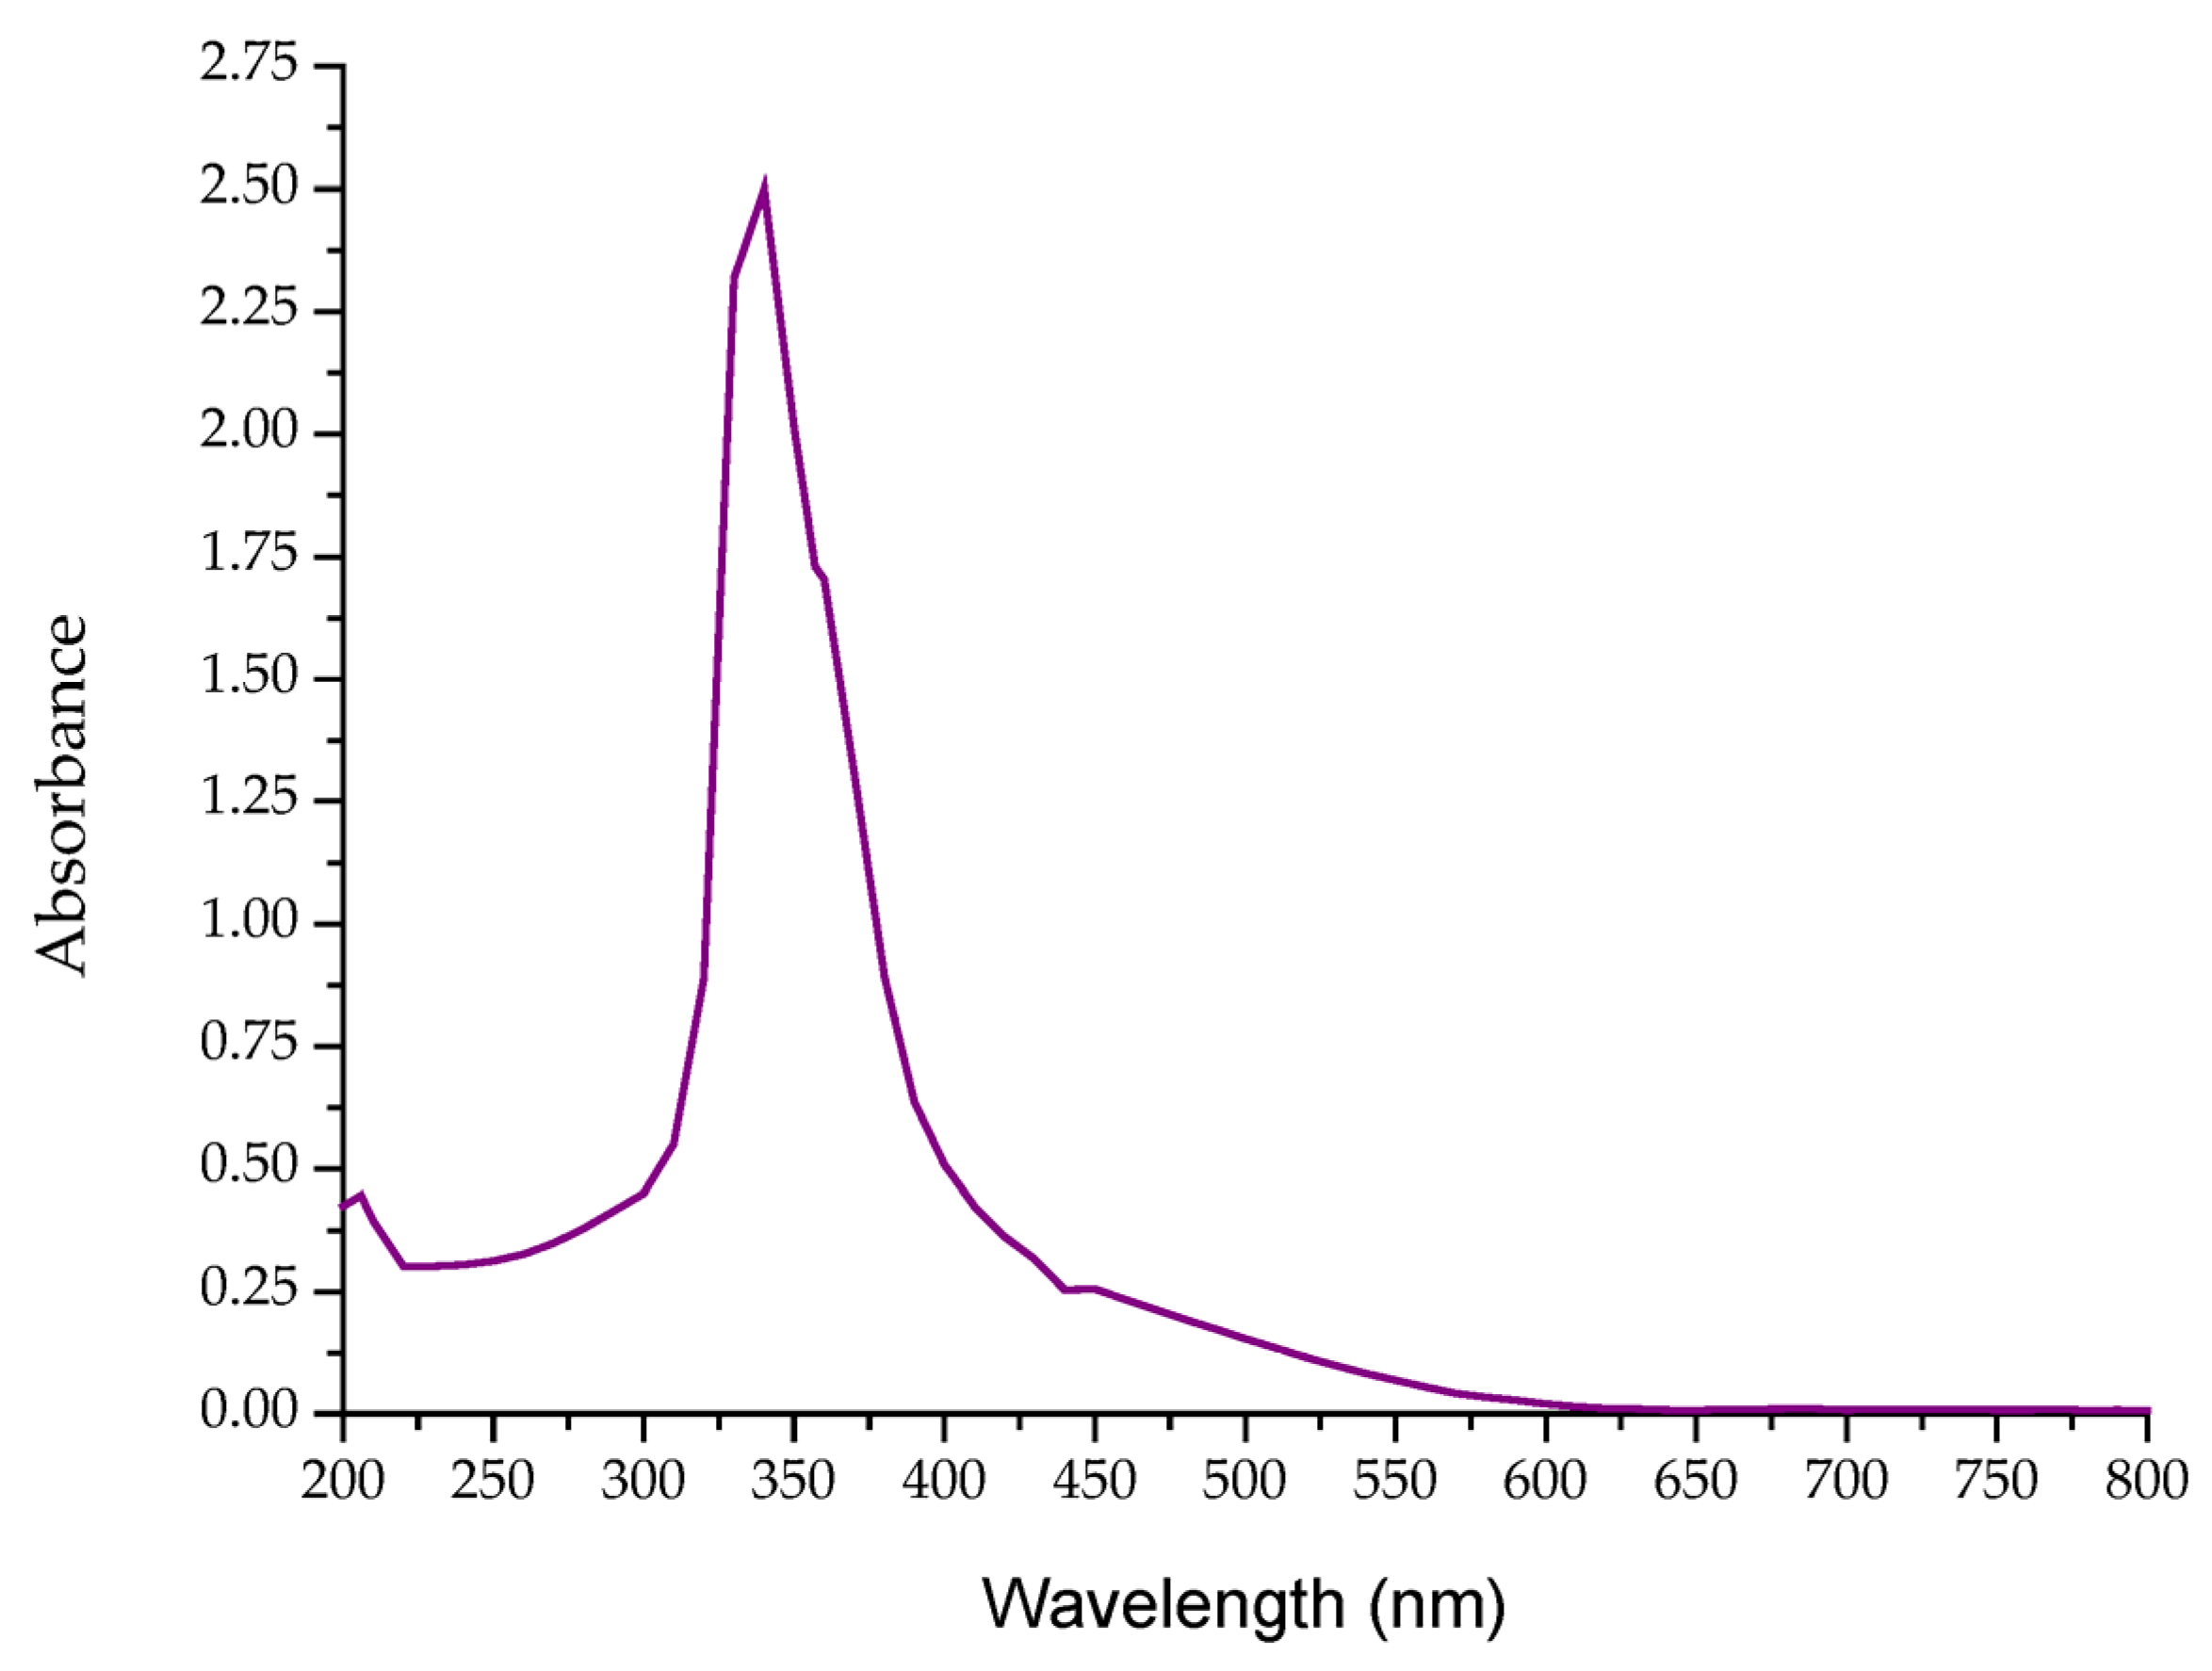
Carotenoids are the second most abundant natural compounds after chlorophyll. Chemically they are made of eight isoprene units (typically tetra-terpenoids) joined in a head-to-tail arrangement. Carotenoids are classified into various groups based on function, structure, source and end groups, etc. [25]. Considering previous research in the literature and the importance of microbial pigments, the main objective of our study is to describe colorful molecules of microbial pigments obtained from our isolate with some techniques such as UV-visible spectroscopy and FT-IR spectroscopy. The absorption spectrum of the total pigments obtained in this study was scanned and compared with the existing literature. The spectra of the dominant substances in the total pigments have been determined from various absorption spectra as shown in Figure 4.
The mixture of total pigments extracted from this bacterium showed absorption peaks in the regions ranging from 200 to 480 nm, indicating abundant carotenoids and their derivatives, most likely from the same pigment synthesis pathway. As shown in Figure 4, absorption peaks of pigments from R. corynebacterioides TAO1 could be seen at 330–370 nm. The peak values of the pigments extracted from bacteria grown in media containing various carbon sources were recorded in the 330–380 nm region, indicating that the pigment absorption profiles of this bacterium grown with different carbon sources have been similar.
In this study, the peaks seen intensely between 200 and 500 nm were thought to belong to the intermediate metabolite carotenoids. In the literature, absorption peaks of various carotenoid pigments are seen at 286 nm for phytoene, 348 nm for phytofluene, 452 nm for beta carotene, 472 nm for Lycopen, and 475 nm for Cantaxanthin. For example, some astaxanthin pigments have a peak at wavelengths of 475–480 nm [45]. Some microorganisms have produced various carotenoids such as bacterioruberin, lycopene, and β-carotene. In some archaea such as Halorubrum, bacterioruberin has been found to be the predominantly produced carotenoid. β-carotene, astaxanthin, lutein, canthaxanthin, and lycopene are important examples. Some of them may be used as precursors for the synthesis of other carotenoids including lycopene, retinal, and the members of the bacterioruberin group. Some bacterial species may also produce the ketocarotenoid canthaxanthin in addition to other carotenoids [46].
In various studies, there might be shifts in the appearance of some absorption peaks in the absorption spectra and FTIR analysis depending on the conditions of obtaining and storing the pigments. For example, exposure to UV light and oxygen has also been found to shift the absorption spectrum of pigments [47,48].
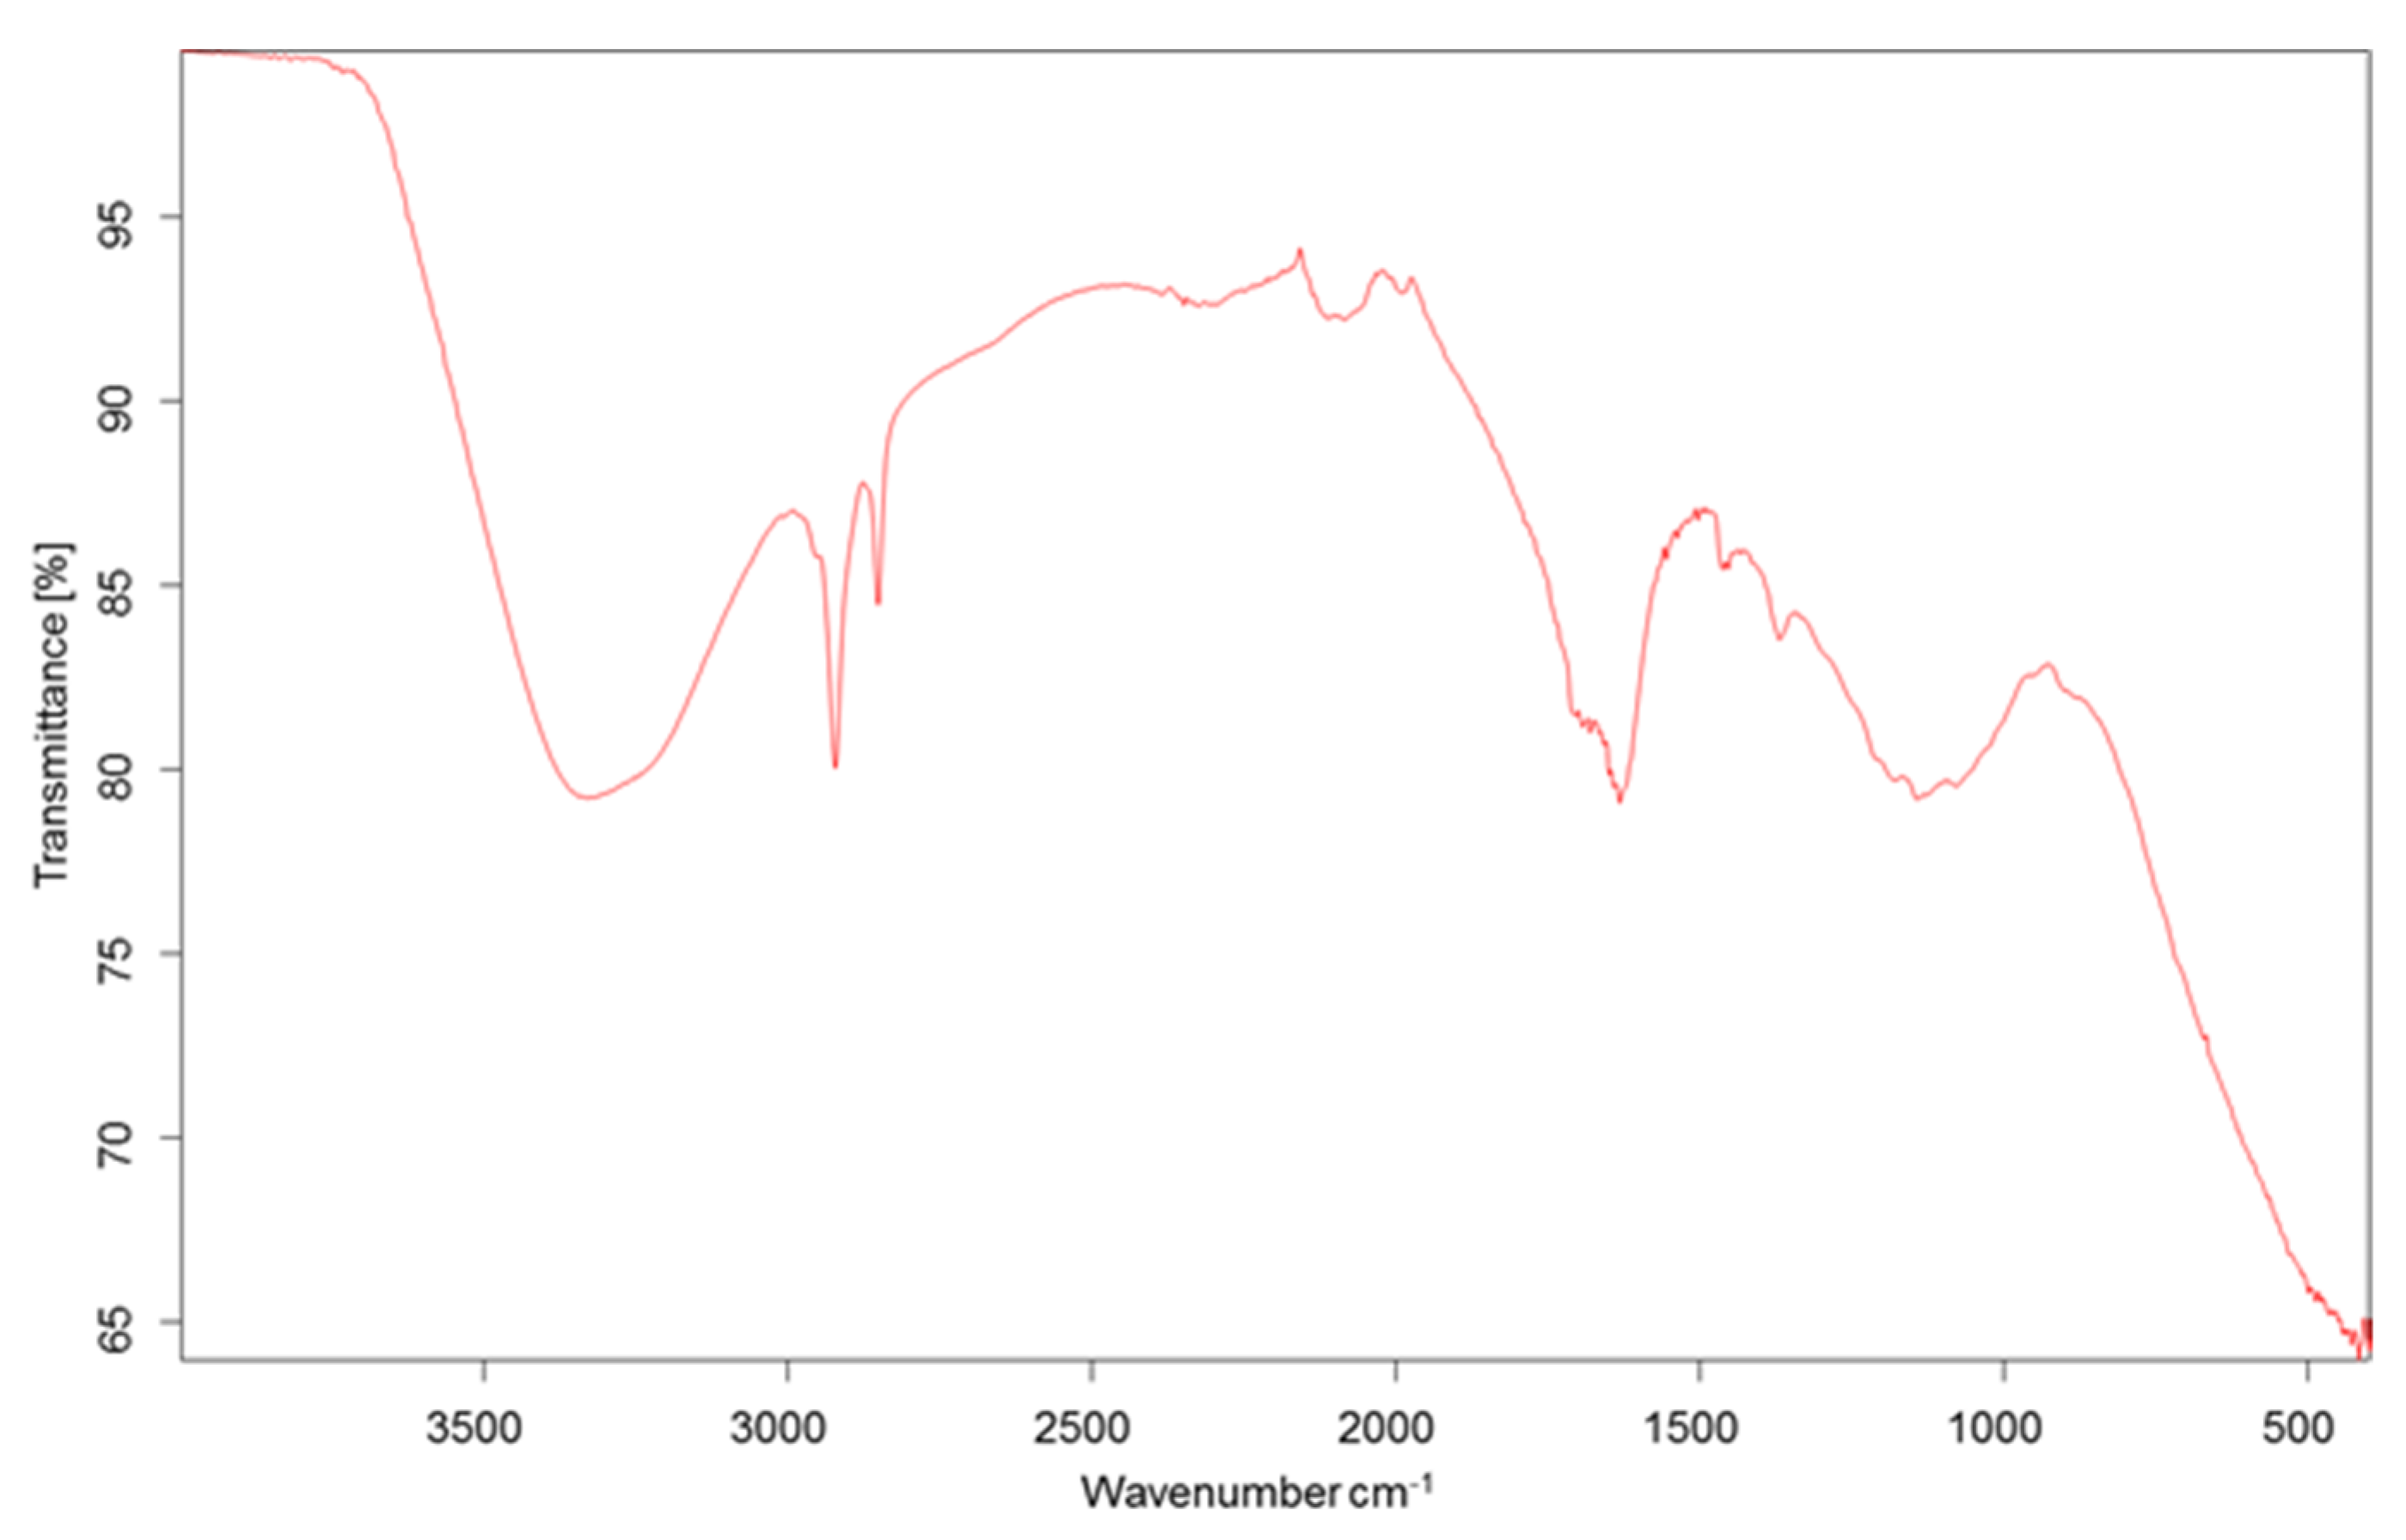
In the pigment mixture, some characteristic functional groups (C-C, C-O, C-H-O, O-H, etc.) were identified using infrared spectroscopy. The peaks belonging to the functional groups of various intermediate metabolites that emerged in the pigment synthesis pathway of the microorganism were evaluated. FTIR analysis indicated the formation of a complex structure, as evidenced by absorption peaks corresponding to carbonyl (C=O), hydroxyl (O-H), double bond (C=C), and methine (=CH) groups at specific wavenumbers: 1700–1500 cm−1, 3400–3300 cm−1, 1600–1450 cm−1, and 3100–2800 cm−1, respectively. The mixture of carotenoid pigments obtained from the bacterium in the medium, however, produced fingerprint peaks at 1713, 1655, 1459, 1377, 1214, and 1076 cm−1, as depicted in Figure 5. The representative band at 1459 cm−1 appears to be the bending vibration of the methylene (–CH2) group while peaks between 1370 and 1070 cm−1 of these mixed pigments could be attributed to C-H and (–CH) symmetrical bending of the carotenoids.
FT-IR research indicated that the pigment complex derived from the strain is likely a carotenoid complex. This procedure generated unique and extra information, facilitating the identification of the pigment’s chemical composition and its reliance on diverse reaction conditions. Lóránd et al. (2002) [49] assert that FT-IR spectroscopy is especially advantageous for the efficient study of physiologically significant carotenoids, particularly when the amounts of samples are constrained.
The FT-IR spectra identified unique functional groups in the pigment complex, featuring a large O-H peak at 3349 cm−1, along with C-H2 and C-H3 stretching vibrations at 2924 cm−1 and 2853 cm−1, respectively. A prominent carbonyl (C=O) signal was observed at 1713 cm−1, in conjunction with a C=C peak at 1655 cm−1. Asymmetrical aromatic C-C peaks, presumably linked to the cyclohexane ring, were seen at 1459 cm−1 and 1377 cm−1.
The composite pigment indicates the existence of carotenoids, including lutein, astaxanthin, and beta-carotene. Despite phytoene, a recognized colorless step in the carotenoid biosynthesis pathway, often exhibiting absorption at 286 nm [50]. Furthermore, oxidative carotenoid derivatives, including zeaxanthin and violaxanthin—produced through the oxidation of beta-carotene—were recognized [51]. The extensive O-H peak detected at around 3400 cm−1 further corroborates the existence of hydroxylated carotenoid derivatives. In this FT-IR study, the presence of a wide OH peak at approximately 3400 cm−1 was shown. Peaks detected between 1000 and 1200 cm−1 signified the establishment of C-O-C ester linkages, presumably derived from carotenoid derivatives. Distinct absorption bands associated with the C-O group were seen at 1070, 1216, and 1374 cm−1. Furthermore, some carotenoid pigments—such as lycopene, β-carotene, canthaxanthin, zeaxanthin, and astaxanthin—were produced by the transformation of colorless phytoene into β-carotene in the bacterial carotenoid biosynthetic pathway. The existence of intermediary metabolites was apparent from the many absorption peaks illustrated in Figure 5. The FT-IR spectra indicated that the pigment mixture consisted of a complex array of carotenoid intermediates and derivatives, rather than a singular carotenoid, illustrating the microorganism’s dynamic metabolic processes.

4. Conclusions

In the last twenty years, the metabolic flexibility of Rhodococcus species has been widely documented, with applications in industrial, environmental, and medicinal fields such as biofuel generation, metal bioremediation, and innovative medicine discovery. This work identified a novel carotenoid-producing strain, R. corynebacterioides TAO1, and studied its carotenoid production with various carbon sources and molasses concentrations in a peptone-yeast medium. Among the tested carbon sources, molasses yielded the second highest carotenoid production level.
The results showed that R. corynebacterioides TAO1 efficiently utilized molasses, a cost-effective and renewable carbon source, to promote microbial growth and EPS synthesis. Bacterial dry weight demonstrated a positive correlation with molasses concentration, maximum value at 0.656 ± 0.049 g at 200 mL/L, followed by a decrease at 250 mL/L, suggesting that high carbon availability may induce metabolic stress. Carotenoid production exhibited an inverse trend, with the highest yield (1.572 ± 0.108 mg) detected in BM, suggesting that higher carbon concentrations might inhibit pigment biosynthesis. EPS production increased in parallel with rising molasses concentration and exhibited lower sensitivity to changes in carbon concentration.
These results highlight the biotechnological potential of R. corynebacterioides TAO1 for the sustainable production of carotenoids and EPS utilizing molasses as a carbon source. This strategy could promote cost-effective and environmentally sustainable bioprocesses, emphasizing the significance of valorizing industrial wastes in microbial biotechnology. The study underlines the metabolic flexibility of R. corynebacterioides TAO1, establishing it as a viable candidate for the effective production of carotenoids and biopolymers using sustainable substrates like molasses.

Author Contributions

Conceptualization, E.Y.C. and T.A.O.; methodology, E.Y.C. and T.A.O.; software, E.Y.C. and T.A.O.; formal analysis, E.Y.C. and T.A.O.; investigation, E.Y.C. and T.A.O.; data curation, E.Y.C. and T.A.O.; writing—original draft preparation, E.Y.C. and T.A.O.; writing—review and editing, E.Y.C. and T.A.O.; visualization, E.Y.C. and T.A.O. All authors have read and agreed to the published version of the manuscript.

Funding

This research received no external funding.

Institutional Review Board Statement

Not applicable.

Informed Consent Statement

Not applicable.

Data Availability Statement

The original contributions presented in this study are included in the article. Further inquiries can be directed to the corresponding author.

Acknowledgments

The authors would like to thank to Ayten ÖZTÜRK (Department of Biotechnology, Niğde Ömer Halisdemir University) for her help during FTIR analysis.

Conflicts of Interest

The authors declare no conflicts of interest.

Abbreviations

The following abbreviations are used in this manuscript:
EPSExopolysaccharide
FTIRFourier Transform Infrared Spectroscopy
UV-VisUltra violet-visible spectrophotometer

References

  1. Khaneja, R.; Perez-Fons, L.; Fakhry, S.; Baccigalupi, L.; Steiger, S.; To, E.; Sandmann, G.; Dong, T.C.; Ricca, E.; Fraser, P.D.; et al. Carotenoids found in Bacillus. J. Appl. Microbiol. 2010, 108, 1889–1902. [Google Scholar] [CrossRef]
  2. Cohen, A.C.; Dichiara, E.; Jofré, V.; Antoniolli, A.; Bottini, R.; Piccoli, P. Carotenoid profile produced by Bacillus licheniformis Rt4M10 isolated from grapevines grown in high altitude and their antioxidant activity. Int. J. Food Sci. Technol. 2018, 53, 2697–2705. [Google Scholar] [CrossRef]
  3. Das, A.; Yoon, S.H.; Lee, S.H.; Kim, J.Y.; Oh, D.K.; Kim, S.W. An update on microbial carotenoid production: Application of recent metabolic engineering tools. Appl. Microbiol. Biotechnol. 2007, 77, 505–512. [Google Scholar] [CrossRef]
  4. Saubenova, M.; Rapoport, A.; Venkatachalam, M.; Dufossé, L.; Yermekbay, Z.; Oleinikova, Y. Production of carotenoids by microorganisms. Fermentation 2024, 10, 502. [Google Scholar] [CrossRef]
  5. Gu, Z.; Deming, C.; Yongbin, H.; Zhigang, C.; Feirong, G. Optimization of carotenoids extraction from Rhodobacter sphaeroides. LWT-Food Sci. Technol. 2008, 41, 1082–1088. [Google Scholar] [CrossRef]
  6. Thanapimmetha, A.; Suwaleerat, T.; Saisriyoot, M.; Chisti, Y.; Srinophakun, P. Production of carotenoids and lipids by Rhodococcus opacus PD630 in batch and fed-batch culture. Bioprocess Biosyst. Eng. 2017, 40, 133–143. [Google Scholar] [CrossRef]
  7. Venil, C.K.; Dufossé, L.; Renuka Devi, P. Bacterial pigments: Sustainable compounds with market potential for pharma and food industry. Front. Sustain. Food Syst. 2020, 4, 100. [Google Scholar] [CrossRef]
  8. Crespo, T.J.; Montero, Z.; Fuentes, J.L.; Reig Garcia-Galbis, M.; Garbayo, I.; Vílchez, C.; Martínez-Espinosa, R.M. Exploring the valuable carotenoids for the large-scale production by marine microorganisms. Mar. Drugs 2018, 16, 203. [Google Scholar] [CrossRef] [PubMed]
  9. Samanta, A.K.; Chaudhuri, S.; Dutta, D. Antioxidant efficacy of carotenoid extract from bacterial strain Kocuria marina DAGII. Mater. Today Proc. 2016, 3, 3427–3433. [Google Scholar] [CrossRef]
  10. Naik, R.; Gupte, S. Characterization of pigment produced by high carotenoid yielding bacteria Paracoccus marcusii RSPO1 and evaluation of its anti-diabetic, anti-microbial and antioxidant properties. Nat. Prod. Res. 2024, 38, 968–977. [Google Scholar] [CrossRef]
  11. Mata-Gómez, L.C.; Montañez, J.C.; Méndez-Zavala, A.; Aguilar, C.N. Biotechnological production of carotenoids by yeasts: An overview. Microb. Cell Factories 2014, 13, 12. [Google Scholar] [CrossRef]
  12. Han, M.; He, Q.; Zhang, W.G. Carotenoids production in different culture conditions by Sporidiobolus pararoseus. Prep. Biochem. Biotechnol. 2012, 42, 293–303. [Google Scholar] [CrossRef]
  13. Maeda, I.; Inaba, A.; Koike, H.; Yoneyama, K.; Ueda, S.; Yoshida, K. Acyclic carotenoid and cyclic apocarotenoid cleavage by an orthologue of lignostilbene-α, β-dioxygenase in Rhodopseudomonas palustris. J. Biochem. 2013, 154, 449–454. [Google Scholar] [CrossRef]
  14. Saejung, C.; Apaiwong, P. Enhancement of carotenoid production in the new carotenoid-producing photosynthetic bacterium Rhodopseudomonas faecalis PA2. Biotechnol. Bioprocess Eng. 2015, 20, 701–707. [Google Scholar] [CrossRef]
  15. Ravi, G.; Venkata Dasu, V.; Pakshirajan, K. Exploring the impact of sodium acetate on lipid and carotenoid production in Rhodotorula mucilaginosa. Prep. Biochem. Biotechnol. 2025, 55, 590–605. [Google Scholar] [CrossRef] [PubMed]
  16. Cappelletti, M.; Presentato, A.; Piacenza, E.; Firrincieli, A.; Turner, R.J.; Zannoni, D. Biotechnology of Rhodococcus for the production of valuable compounds. Appl. Microbiol. Biotechnol. 2020, 104, 8567–8594. [Google Scholar] [CrossRef]
  17. Jiang, W.; Sun, J.; Gao, H.; Tang, Y.; Wang, C.; Jiang, Y.; Zhang, W.; Xin, F.; Jiang, M. Carotenoids production and genome analysis of a novel carotenoid producing Rhodococcus aetherivorans N1. Enzym. Microb. Technol. 2023, 164, 110190. [Google Scholar] [CrossRef]
  18. Negrete, P.S.; Ghilardi, C.; Pineda, L.R.; Pérez, E.; Herrera, M.L.; Borroni, V. Biosurfactant production by Rhodococcus ALDO1 isolated from olive mill wastes. Biocatal. Agric. Biotechnol. 2024, 57, 103106. [Google Scholar] [CrossRef]
  19. Liang, Y.; Yu, H. Genetic toolkits for engineering Rhodococcus species with versatile applications. Biotechnol. Adv. 2021, 49, 107748. [Google Scholar] [CrossRef] [PubMed]
  20. Jiang, W.K.; Lu, M.Y.; Cui, M.D.; Wang, X.; Wang, H.; Yang, Z.G.; Zhu, S.-J.; Zhou, Y.D.; Hu, G.; Hong, Q. Terrimonas soli sp. nov., isolated from farmland soil. Int. J. Syst. Evol. Microbiol. 2018, 68, 819–823. [Google Scholar] [CrossRef]
  21. Kabadayı, H.K.; Demiray, E.; Ertuğrul Karatay, S.; Dönmez, G. Enhanced cu (II) bioremoval by newly isolated Kluyveromyces marxianus with sodium dodecyl sulphate. Bioremediation J. 2025, 29, 204–210. [Google Scholar] [CrossRef]
  22. Danış, K.; Bingöl, B.N.; Kars, G. Production of biological hydrogen and bacterial carotenoids with Rhodobacter sphaeroides OU 001 in a biorefinery concept. Eurasian J. Biol. Chem. Sci. 2022, 5, 56–61. [Google Scholar] [CrossRef]
  23. Frengova, G.I.; Simova, E.D.; Beshkova, D.M.; Simov, Z.I. Production and monomer composition of exopolysaccharides by yogurt starter cultures. Can. J. Microbiol. 2000, 46, 1123–1127. [Google Scholar] [CrossRef]
  24. Fayez, D.; Youssif, A.; Sabry, S.; Ghozlan, H.; Eltarahony, M. Carotegenic Virgibacillus halodenitrificans from Wadi El-Natrun Salt Lakes: Isolation, optimization, characterization and biological activities of carotenoids. Biology 2022, 11, 1407. [Google Scholar] [CrossRef]
  25. Rodriguez-Concepcion, M.; Avalos, J.; Bonet, M.L.; Boronat, A.; Gomez-Gomez, L.; Hornero-Mendez, D.; Limon, M.C.; Meléndez-Martínez, A.J.; Olmedilla-Alonso, B.; Palou, A.; et al. A global perspective on carotenoids: Metabolism, biotechnology, and benefits for nutrition and health. Prog. Lipid Res. 2018, 70, 62–93. [Google Scholar] [CrossRef]
  26. Kars, G.; Demirel Kars, M.; Obalı, İ.; Emsen, A.; Gündüz, U. Investigation of antioxidant and cytotoxic effects of biotechnologically produced carotenoids from Rhodobacter sphaeroides OU 001. Gümüşhane Univ. J. Sci. Technol. 2020, 10, 559–568. [Google Scholar] [CrossRef]
  27. Çobanoğlu, Ş.; Yazıcı, A. Isolation, characterization, and antibiofilm activity of pigments synthesized by Rhodococcus sp. SC1. Curr. Microbiol. 2022, 79, 15. [Google Scholar] [CrossRef]
  28. Bhosale, P.; Gadre, R. Production of β-carotene by a mutant of Rhodotorula glutinis. Appl. Microbiol. Biotechnol. 2001, 55, 423–427. [Google Scholar] [CrossRef]
  29. Zhou, Q.; Zhang, P.; Zhang, G. Biomass and carotenoid production in photosynthetic bacteria wastewater treatment: Effects of light intensity. Bioresour. Technol. 2014, 171, 330–335. [Google Scholar] [CrossRef] [PubMed]
  30. Marzieh, M.N.; Sadat, M.N.S.; Elaheh, A.; Hamed, A. Carotenoid production by Rhodotorula glutinis in a substrate containing date syrup. In Proceedings of the 6th National Biotechnology Congress, Tehran, Iran, 13–15 August 2009. [Google Scholar]
  31. Khalil, M.A.; Sonbol, F.I.; Al-Madboly, L.A.; Aboshady, T.A.; Alqurashi, A.S.; Ali, S.S. Exploring the therapeutic potentials of exopolysaccharides derived from lactic acid bacteria and Bifidobacteria: Antioxidant, antitumor, and periodontal regeneration. Front. Microbiol. 2022, 13, 803688. [Google Scholar] [CrossRef]
  32. Chen, S.; Cheng, R.; Xu, X.; Kong, C.; Wang, L.; Fu, R.; Li, J.; Wang, S.; Zhang, J. The structure and flocculation characteristics of a novel exopolysaccharide from a Paenibacillus isolate. Carbohydr. Polym. 2022, 291, 119561. [Google Scholar] [CrossRef]
  33. Urai, M.; Anzai, H.; Ogihara, J.; Iwabuchi, N.; Harayama, S.; Sunairi, M.; Nakajima, M. Structural analysis of an extracellular polysaccharide produced by Rhodococcus rhodochrous strain S-2. Carbohydr. Res. 2006, 341, 766–775. [Google Scholar] [CrossRef]
  34. Urai, M.; Aizawa, T.; Anzai, H.; Ogihara, J.; Iwabuchi, N.; Neilan, B.; Couperwhite, I.; Nakajima, M.; Sunairi, M. Structural analysis of an extracellular polysaccharide produced by a benzene tolerant bacterium, Rhodococcus sp. 33. Carbohydr. Res. 2006, 341, 616–623. [Google Scholar] [CrossRef]
  35. Perry, M.B.; MacLean, L.L.; Patrauchan, M.A.; Vinogradov, E. The structure of the exocellular polysaccharide produced by Rhodococcus sp. RHA1. Carbohydr. Res. 2007, 342, 2223–2229. [Google Scholar] [CrossRef]
  36. Urai, M.; Yoshizaki, H.; Anzai, H.; Ogihara, J.; Iwabuchi, N.; Harayama, S.; Sunairi, M.; Nakajima, M. Structural analysis of mucoidan, an acidic extracellular polysaccharide produced by a pristaneassimilating marine bacterium, Rhodococcus erythropolis PR4. Carbohydr. Res. 2007, 342, 927–932. [Google Scholar] [CrossRef]
  37. Li, F.; Hu, X.; Li, J.; Sun, X.; Luo, C.; Zhang, X.; Li, H.; Lu, J.; Li, Y.; Bao, M. Purification, structural characterization, antioxidant and emulsifying capabilities of exopolysaccharide produced by Rhodococcus qingshengii QDR4-2. J. Polym. Environ. 2023, 31, 64–80. [Google Scholar] [CrossRef]
  38. Gharibzahedi, S.M.T.; Razavi, S.H.; Mousavi, M. Kinetic analysis and mathematical modeling of cell growth and canthaxanthin biosynthesis by Dietzia natronolimnaea HS-1 on waste molasses hydrolysate. RSC Adv. 2013, 3, 23495–23502. [Google Scholar] [CrossRef]
  39. Voaides, C.; Dima, R.J.A.Z. Effect of carbon source on carotenoid production by Rhodotorula sp. Arch. Zootech. 2011, 14, 75. [Google Scholar]
  40. Ram, S.; Mitra, M.; Shah, F.; Tirkey, S.R.; Mishra, S. Bacteria as an alternate biofactory for carotenoid production: A review of its applications, opportunities and challenges. J. Funct. Foods 2020, 67, 103867. [Google Scholar] [CrossRef]
  41. Jiang, Y.; Lv, Y.; Wu, R.; Lu, J.; Dong, W.; Zhou, J.; Zhang, W.; Xin, F.; Jiang, M. Consolidated bioprocessing performance of a two-species microbial consortium for butanol production from lignocellulosic biomass. Biotechnol. Bioeng. 2020, 117, 2985–2995. [Google Scholar] [CrossRef]
  42. Jiang, W.; Gao, H.; Sun, J.; Yang, X.; Jiang, Y.; Zhang, W.; Jiang, M.; Xin, F. Current status, challenges and prospects for lignin valorization by using Rhodococcus sp. Biotechnol. Adv. 2022, 60, 108004. [Google Scholar] [CrossRef]
  43. Styczynski, M.; Rogowska, A.; Gieczewska, K.; Garstka, M.; Szakiel, A.; Dziewit, L. Genome-based insights into the production of carotenoids by Antarctic bacteria, Planococcus sp. ANT_H30 and Rhodococcus sp. ANT_H53B. Molecules 2020, 25, 4357. [Google Scholar] [CrossRef] [PubMed]
  44. Ramesh, C.; Prasastha, V.R.; Venkatachalam, M.; Dufossé, L. Natural substrates and culture conditions to produce pigments from potential microbes in submerged fermentation. Fermentation 2022, 8, 460. [Google Scholar] [CrossRef]
  45. Wibowo, S.; Prakoso, B.D.; Najihah, S.; Fajar, Z.H.; Widyarti, S.; Sabarudin, A.; Soeatmadji, D.W.; Sumitro, S.B. Synthesis and characterization of astaxanthin-metal ions (Cu2+ and Zn2+) complex. Rasayan J. Chem. 2021, 14, 877–886. [Google Scholar] [CrossRef]
  46. Naziri, D.; Hamidi, M.; Hassanzadeh, S.; Tarhriz, V.; Zanjani, B.M.; Nazemyieh, H.; Hejazi, M.A.; Hejazi, M.S. Analysis of carotenoid production by Halorubrum sp. TBZ126; an extremely halophilic archeon from Urmia Lake. Adv. Pharm. Bull. 2013, 4, 61. [Google Scholar] [CrossRef]
  47. Cvetković, D.; Marković, D. Stability of carotenoids toward UV-irradiation in hexane solution. J. Serbian Chem. Soc. 2008, 73, 15–27. [Google Scholar] [CrossRef]
  48. Henry, L.K.; Puspitasari-Nienaber, N.L.; Jarén-Galán, M.; van Breemen, R.B.; Catignani, G.L.; Schwartz, S.J. Effects of ozone and oxygen on the degradation of carotenoids in an aqueous model system. J. Agric. Food Chem. 2000, 48, 5008–5013. [Google Scholar] [CrossRef]
  49. Lóránd, T.; Deli, J.; Molnár, P.; Tóth, G. FT-IR study of some carotenoids. Helv. Chim. Acta 2002, 85, 1691–1697. [Google Scholar] [CrossRef]
  50. Meléndez-Martínez, A.J.; Stinco, C.M.; Mapelli-Brahm, P. Skin carotenoids in public health and nutricosmetics: The emerging roles and applications of the UV radiation-absorbing colourless carotenoids phytoene and phytofluene. Nutrients 2019, 11, 1093. [Google Scholar] [CrossRef]
  51. Sandmann, G. Carotenoid biosynthesis and biotechnological application. Arch. Biochem. Biophys. 2001, 385, 4–12. [Google Scholar] [CrossRef]
Figure 1. Maximum Likelihood phylogenetic tree depicting the taxonomic affiliation of the strain isolated from Akkaya Dam, Niğde (accession number OQ249664). The tree was constructed using 16S rDNA gene sequences, with bootstrap values at nodes representing their occurrence in 1000 replicates. The 16S rDNA gene of Escherichia coli was included as an outgroup.
Fermentation 11 00599 g001
Figure 2. The effect of different carbon sources on bacterial dry weight and carotenoid production by R. corynebacterioides TAO1. Error bars indicate the standard deviations and lower case letters (black for Dry Weight; red for Carotenoid yield) show the significant difference among the test groups at p < 0.05.
Fermentation 11 00599 g002
Figure 3. Effect of molasses concentration on bacterial dry weight and carotenoid production R. corynebacterioides TAO1. Error bars indicate the standard deviations and lower case letters (black for Dry Weight; red for Carotenoid Yield) show the significant difference among the test groups at p < 0.05.
Fermentation 11 00599 g003
Figure 4. The UV-visible spectrum of the mixed pigments from the bacterium extracted in acetone.
Fermentation 11 00599 g004
Figure 5. FT-IR spectrum of the total carotenoids isolates from R. corynebacterioides TAO1.
Fermentation 11 00599 g005
Table 1. The quantitative analysis of bacterial dry weight, carotenoid production, and exopolysaccharide (EPS) accumulation in response to different carbon sources.
Carbon SourceDry Weight (g)Carotenoid Yield (mg/g)EPS (mg/L)
Mannitol0.116 ± 0.006 b1.335 ± 0.058 a10.354 ± 1.16 c
Glucose0.158 ± 0.01 a1.205 ± 0.149 a18.774 ± 1.857 b
Acetate0.062 ± 0.003 c0.81 ± 0.172 b10.664 ± 0.198 c
Molasses0.111 ± 0.022 b1.216 ± 0.348 a18.407 ± 0.962 b
Sucrose0.105 ± 0.004 b1.196 ± 0.074 a28.0 ± 0.167 a
All data shown in the table are expressed as mean ± standard deviation of three independent measurements. Lower case letters in each column indicate significant difference among groups at p < 0.05.
Table 2. The influence of different molasses concentrations on the growth, carotenoid biosynthesis, and EPS production of R. corynebacterioides TAO1.
MediumDry Weight (g)Carotenoid Yield (mg/g)EPS (mg/L)
BM0.037 ± 0.001 e1.572 ± 0.108 a17.449 ± 0.835 e
500.253 ± 0.003 d1.084 ± 0.073 b19.496 ± 0.056 e
1000.494 ± 0.01 c0.952 ± 0.044 c23.105 ± 1.192 d
1500.547 ± 0.035 b1.004 ± 0.033 bc28.643 ± 1.486 c
2000.656 ± 0.049 a0.934 ± 0.074 cd41.346 ± 2.526 b
2500.493 ± 0.052 c0.84 ± 0.007 d71.583 ± 6.265 a
All data shown in the table are expressed as mean ± standard deviation of three independent measurements. Lower case letters in each column indicate significant difference among groups at p < 0.05.
Disclaimer/Publisher’s Note: The statements, opinions and data contained in all publications are solely those of the individual author(s) and contributor(s) and not of MDPI and/or the editor(s). MDPI and/or the editor(s) disclaim responsibility for any injury to people or property resulting from any ideas, methods, instructions or products referred to in the content.