Article

Inhibitor Tolerance Capacity of Pichia kudriavzevii NBRC1279 and NBRC1664

by
Hironaga Akita
1 and
Akinori Matsushika
2,*
1
Department of Liberal Arts and Basic Science, College of Industrial Technology, Nihon University, 1-2-1 Izumi-Cho, Narashino 275-8575, Chiba, Japan
2
Department of Biotechnology and Chemistry, Faculty of Engineering, Kindai University, Higashi-Hiroshima 739-2116, Hiroshima, Japan
*
Author to whom correspondence should be addressed.
Fermentation 2024, 10(7), 331; https://doi.org/10.3390/fermentation10070331
Submission received: 31 May 2024 / Revised: 19 June 2024 / Accepted: 20 June 2024 / Published: 25 June 2024

Abstract

:
The thermotolerant yeast Pichia kudriavzevii (previously known as Issatchenkia orientalis), can produce ethanol from a variety of carbon sources and grows at around 45 °C. Thus, this yeast is considered a useful biocatalyst for producing ethanol from lignocellulose through simultaneous saccharification and fermentation (SSF). SSF has several advantages, such as a simplified manufacturing process, ease of operation and reduced energy input. Using P. kudriavzevii NBRC1279 and NBRC1664, we previously succeeded in producing ethanol through SSF; however, the extent to which inhibitors by-produced from lignocellulose hydrolysis affect the growth and ethanol productivity of the two strains remains to be investigated. In this study, to better understand the inhibitor tolerance capacity of the two strains, spot assay, growth experiment, real-time quantitative PCR (RT-qPCR) analysis and multiple sequence alignment analysis were carried out. When P. kudriavzevii NBRC1279 and NBRC1664, as well as Saccharomyces cerevisiae BY4742 as a control, were cultured on SCD plates containing 17% ethanol, 42 mM furfural, 56 mM 5-hydroxymethylfurfural (HMF) or 10 mM vanillin, only P. kudriavzevii NBRC1664 was able to grow under all conditions. Moreover, the inhibitor tolerance capacity of P. kudriavzevii NBRC1664 was greater than those of other strains using SCD medium containing the same concentrations of various inhibitors. When an RT-qPCR analysis of seven gene sequences from aldehyde dehydrogenase and the aldehyde dehydrogenase family protein (ADHF) was performed using P. kudriavzevii NBRC1664 cultivated in the presence of 56 mM HMF, ADHF1 and ADHF2 were up-regulated in the early logarithmic growth phase. Moreover, a multiple sequence alignment of the amino acid sequences of ADHF1, ADHF2 and the known ADH suggested that ADHF1 and ADHF2 may catalyze the reversible NAD+-dependent oxidation of HMF. Our data may be useful for future studies on the metabolic engineering of more useful strains for ethanol production from lignocellulose.

1. Introduction

Fossil fuels are the most used energy sources in the world, and their consumption is increasing as a result of economic growth, which is associated with population growth [1]. On the other hand, fossil fuel reserves are limited, and future depletion is inevitable. This increased fossil fuel consumption is leading to an increase in greenhouse gas emissions, causing environmental problems such as global warming and air pollution. Moreover, there are concerns about declining biodiversity from the effects of these environmental problems. Thus, it will be necessary to develop new energy sources that are efficient, renewable and environmentally friendly alternatives to fossil fuels. Bioethanol produced from renewable resources is an attractive alternative to fossil fuels because it does not increase the amount of carbon dioxide in the atmosphere. The yeast Saccharomyces cerevisiae shows superior productivity for industrial bioethanol production compared to other microorganisms. For example, in the United States, ethanol is produced by S. cerevisiae using a hydrolysate prepared from corn through enzymatic hydrolysis [2]. Also, in Brazil, ethanol is directly produced from sucrose-, glucose-, and fructose-rich sugarcane products using S. cerevisiae [2]. The United States and Brazil are the world’s first and second largest ethanol producers, and the ethanol produced in both countries accounts for approximately 85% of the world’s fuel ethanol production [3]. On the other hand, with challenges such as food insecurity still present around the world, ethanol production from edible sources such as corn and sugarcane is increasingly being criticized for competing with food supplies. Thus, the utilization of inedible sources such as lignocellulose for ethanol production is being studied worldwide. For example, in the United States, more than 6.8 million liters of ethanol were produced using lignocellulose in 2022 [3]. In Brazil, the total production volume of ethanol produced from lignocellulose in 2022 was estimated at 55 million liters, which was 3.7-fold higher than the total production volume in 2021 [3].
When lignocellulose is utilized as a raw material, the following processes are necessary: (1) the pretreatment of particles from lignocellulose; (2) the enzymatic hydrolysis of the pretreated samples to prepare the hydrolysate; and (3) the fermentation of ethanol using the hydrolysate. Using this process with genetically modified S. cerevisiae strains, bioethanol is produced from several kinds of lignocelluloses, such as spruce [4], sweet sorghum bagasse [5], wheat straw and corn stover [6]. Moreover, using a hydrolysate prepared from Japanese eucalyptus particles, pilot-scale ethanol production using a 70 L scale fermenter was reported [7]. However, compared to the use of edible biomasses as raw materials, the production process is more complicated, and the ethanol yield is low, resulting in higher production costs. Thus, this process is difficult for the industrial production of bioethanol, and many challenges remain, such as the need to reduce production costs. To construct a cost-effective method, we previously studied simultaneous saccharification and fermentation (SSF) for ethanol production using the thermostable yeast strains Pichia kudriavzevii NBRC1279 and NBRC1664 with particles from Japanese cedar or eucalyptus [8]. Several kinds of commercial saccharification enzymes are available on the market, and most of these enzymes exhibit maximum activity under acidic and mesothermic conditions. In other words, the utilization of P. kudriavzevii makes it possible to perform SSF because this yeast strain shows a maximum growth rate at around pH 4.0 and can grow up to approximately 45 °C.
The production process of SSF is simple because enzymatic hydrolysis and fermentation are simultaneously performed in the same vessel, resulting in operational ease and reduced energy input. Using particles prepared from Japanese cedar or eucalyptus as raw materials, the ethanol concentration reached only 21 to 24 g/L, indicating that the production yield needs to be improved for industrial use [8]. The effect of inhibitors on SSF is thought to be one of the reasons for the decreased production yield. In the pretreatment step, lignocellulose particles prepared from lignocellulose are hydrothermally treated to break down the tissue into cellulose, hemicellulose and lignin. Meanwhile, aldehydes, weak acids and phenolic compounds are also generated as inhibitors, which interfere with the subsequent fermentation. Among those inhibitors, two furaldehydes, furfural and 5-hydroxymethylfurfural (HMF), exhibit particularly strong inhibition, disrupt the cell wall and cell membrane, reduce enzyme activity, damage DNA and inhibit protein and RNA synthesis [9]. Moreover, large amounts of phenolic compounds, such as vanillin, also have similar inhibitory effects on yeast growth [10]. Therefore, in the pretreatment process, it is necessary to decompose the crystal structure of cellulose and hemicellulose to allow a saccharifying enzyme such as cellulase and hemicellulase to come into contact with the decomposition product and determine the optimal conditions to suppress the formation of inhibitors. Furthermore, to enhance the production yield of ethanol, it is important to expand the inhibitor tolerance capacity of P. kudriavzevii.
In this study, to better understand the inhibitor tolerance capacity of P. kudriavzevii, inhibitor tolerance tests were carried out using S. cerevisiae BY4742 as a control. Subsequently, real-time quantitative PCR (RT-qPCR) analysis was performed using P. kudriavzevii NBRC1664, which showed the highest inhibitor tolerance capacity, cultured in SCD medium containing 56 mM HMF. As a result, the key genes responsible for HMF tolerance in the yeast strain were identified. The results of the present study provide useful knowledge for better understanding the inhibitor tolerance capacity of P. kudriavzevii, which is expected to be applicable for the future metabolic engineering of more useful strains for ethanol production through SSF.

2. Materials and Methods

2.1. Yeast Strains and Media

The two strains of P. kudriavzevii (NBRC1279 and NBRC1664) were purchased from the NITE Biological Resource Center (NBRC, Tokyo, Japan). S. cerevisiae BY4742 was obtained from Open Biosystems (Huntsville, AL, USA) and used as a control strain in this study. Those yeast strains were grown in yeast peptone dextrose (YPD) broth or on agar plates (10 g/L yeast extract, 20 g/L peptone, 20 g/L glucose) unless otherwise noted. For the spot assay and aerobic growth experiment, an SCD plate (20 g/L glucose, 6.7 g/L yeast nitrogen base and 18 g/L agar) and SCD medium (medium from the SCD plate without 18 g/L agar) were used, respectively.

2.2. Spot Assay

P. kudriavzevii NBRC1279 and NBRC1664 as well as S. cerevisiae BY4742 were cultivated in the SCD medium until the cells reached the early stationary growth phase of growth. Subsequently, those cultures were diluted with fresh SCD medium to an absorbance at 600 nm (A600) of 0.02, and then 2 μL of each suspension of 3-fold serial dilutions was spotted onto SCD plates containing different inhibitors (17% ethanol, 42 mM furfural, 56 mM HMF or 10 mM vanillin). The plates were photographed after 2 to 6 days of incubation at 30 °C.

2.3. Aerobic Growth Experiment

Using SCD medium (pH 5.8), P. kudriavzevii NBRC1279 and NBRC1664 as well as S. cerevisiae BY4742 were pre-cultivated aerobically at 30 °C for 16 h. Each culture was washed with sterile water and then inoculated into the fresh SCD medium containing the same concentrations as the spot assay of inhibitors (ethanol, furfural, HMF or vanillin) in 96-well plates at an initial A600 of 0.02. All 96-well microplates were cultivated with mild agitation (150 rpm) at 30 °C, and the absorbance (A600) was measured using a HiTS microplate reader (Scinics, Tokyo, Japan) as described previously [11]. Cultivation was repeated three times.

2.4. RT-qPCR Analysis

P. kudriavzevii NBRC1664 was cultivated separately in SCD medium containing the same concentrations of various inhibitors at 30 °C. After the cells were washed with sterile water, total RNA was extracted using Biomasher (Nippi, Tokyo, Japan) and NucleoSpin RNA (Takara Bio, Higashiomi, Japan) according to the manufacturer’s instructions. Subsequently, the collected total RNAs were converted to cDNAs using a ReverTra Ace qPCR RT Master Mix (TOYOBO, Osaka, Japan). The RT-qPCR analysis was then performed using a THUNDERBIRD Next SYBR qPCR Mix (TOYOBO) with a Liberty16 (Berthold Japan, Tokyo, Japan).
The gene sequences of aldehyde dehydrogenase (ADH) and the aldehyde dehydrogenase family protein (ADHF) are available in the GenBank/EMBL/DDBJ databases. The specific primers were designed using the primer-BLAST web server [12], and their sequences are shown in Table 1. RT-qPCR analysis was carried out according to the manufacturer’s instructions. The relative transcription ratio was normalized to the act1 (actin) gene.

2.5. Comparative Analysis of Primary Structures

The amino acid sequence was compared with the human ADH 1A3 (hADH1A3) available in the GenBank/EMBL/DDBJ databases by using the BLAST program. The sequences were aligned using ClustalW [13] and ESpript [14].

3. Results and Discussion

3.1. Effect of Inhibitors on Growth

When we started conducting studies on bioethanol production from lignocellulose, the usefulness of P. kudriavzevii as a biocatalyst had been investigated using various strains such as 2-KLP1 [15], D1C [16] and SI [17]. Thus, P. kudriavzevii NBRC1279 and NBRC1664, which were available from NBRC, were used in our study. As mentioned above, P. kudriavzevii is capable of using as a biocatalyst in bioethanol production through SSF because of its superior heat and acid resistance properties. While in S. cerevisiae, a model microorganism, the metabolic pathways and stress response mechanisms have been elucidated in detail, such studies on P. kudriavzevii are lacking. In our previous study, the molecular mechanism of acid stress tolerance in P. kudriavzevii NBRC1279 and NBRC1664 was analyzed by transcriptome analysis, and it was revealed that unique enzyme genes not found in S. cerevisiae are conserved in the genomes of both strains, and both strains have a different resistance mechanism from that of S. cerevisiae [11]. In particular, P. kudriavzevii NBRC1664 exhibits superior acid tolerance capacity compared to P. kudriavzevii NBRC1279 by increasing the expression of the NAD+-dependent glycerol-3-phosphate dehydrogenase gene, which catalyzes the production of glycerol-3-phosphate, a precursor of the osmotic agent glycerol [11]. Based on these results, similar to acid tolerance capacity, we considered that P. kudriavzevii NBRC1279 and NBRC1664 may have superior inhibitor tolerance capacity compared to S. cerevisiae. In this study, to demonstrate the utility of P. kudriavzevii NBRC1279 and NBRC1664, the inhibitor tolerance capacity of both strains was analyzed. Furfural, HMF and vanillin are typical inhibitors produced from the hydrothermal treatment of lignocellulose, which prevent yeast growth and subsequent fermentation. Thus, in this study, those inhibitors were used as the model inhibitors.
To investigate the inhibitor tolerance capacity of P. kudriavzevii NBRC1279 and NBRC1664 as well as S. cerevisiae BY4742 (a control strain), a spot assay using SCD plates containing multiple inhibitors such as ethanol, furfural, HMF and vanillin was performed (Figure 1). In fact, spot assays were performed using various concentrations of inhibitors, and the lowest concentration that caused a difference in growth between P. kudriavzevii NBRC1279 and NBRC1664 is shown in Figure 1. S. cerevisiae BY4742 failed to grow on all the plates. In contrast, P. kudriavzevii NBRC1279 and NBRC1664 grew in the presence of 17% ethanol, 42 mM furfural and 10 mM vanillin, and the growth capacity of P. kudriavzevii NBRC1664 was greater than that of P. kudriavzevii NBRC1279. Moreover, only P. kudriavzevii NBRC1664 formed colonies in the presence of 56 mM HMF.
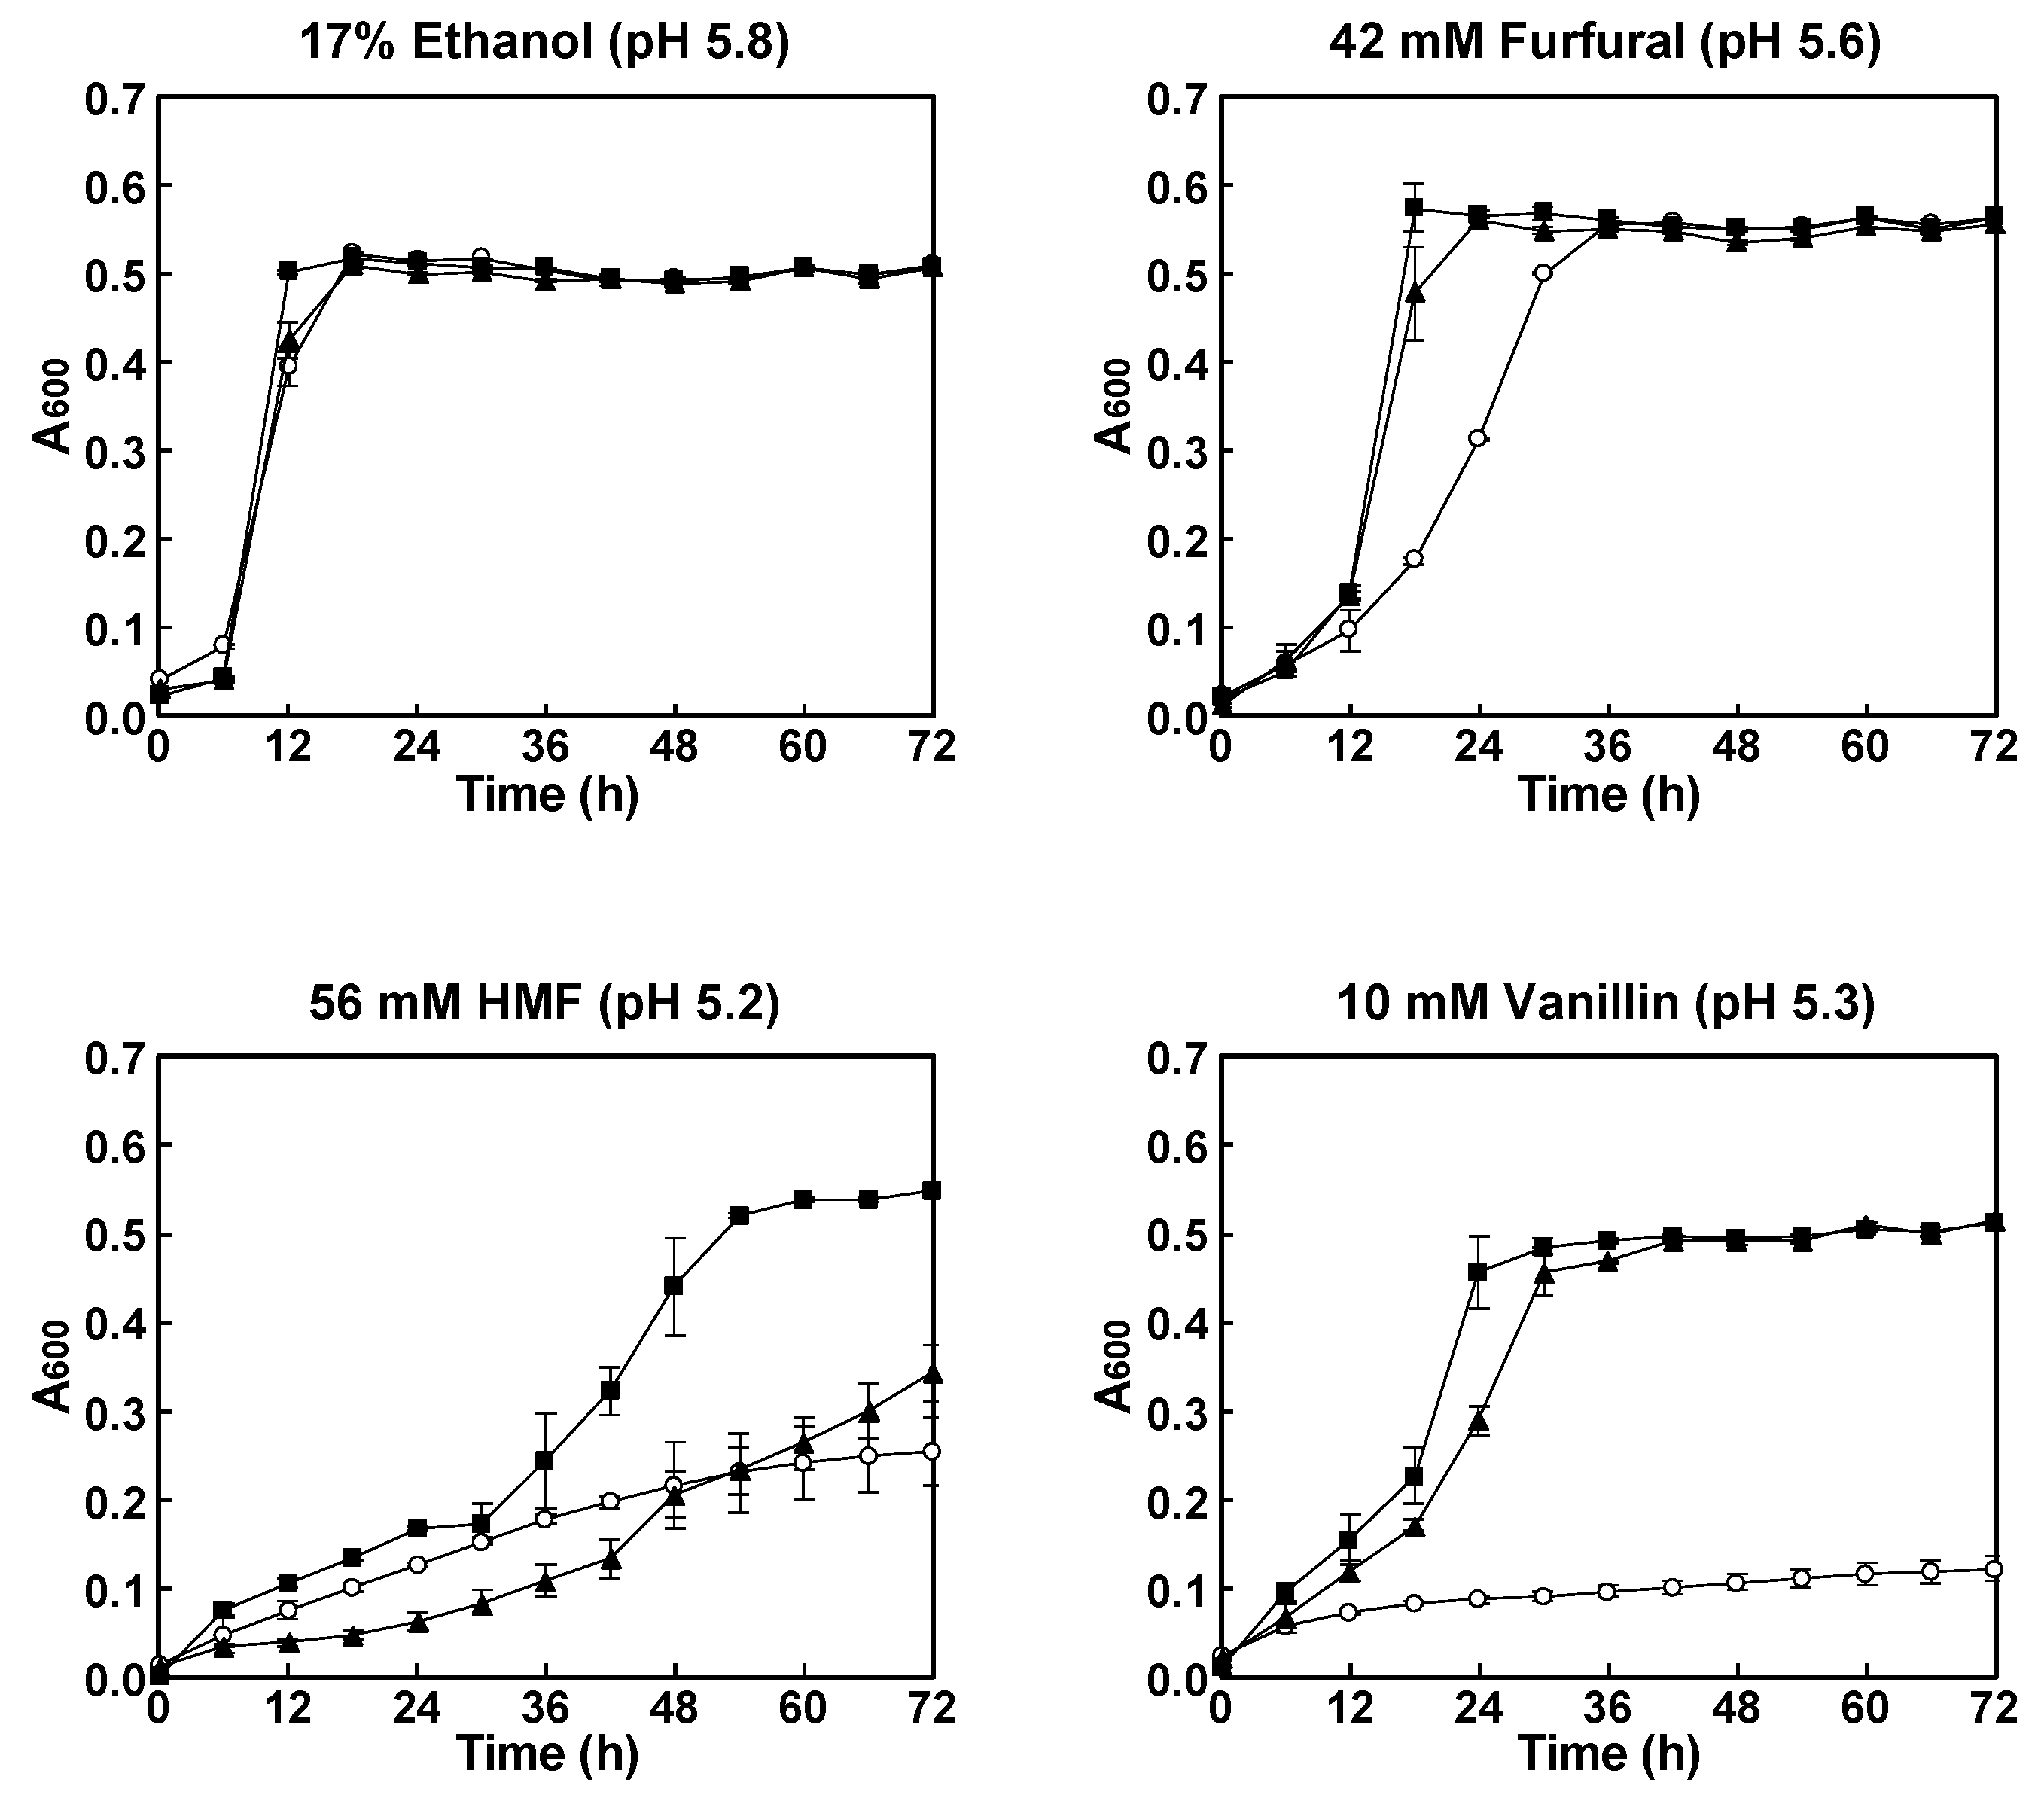
To further investigate the inhibitor tolerance capacity of P. kudriavzevii NBRC1279 and NBRC1664 as well as S. cerevisiae BY4742, these yeast strains were cultured aerobically in SCD medium containing various inhibitors at the same concentrations as the SCD plates (Figure 2). Interestingly, differing from the results of the spot assay, the growth of P. kudriavzevii NBRC1279 and NBRC1664 as well as S. cerevisiae BY4742 was not inhibited in the presence of 17% ethanol, which suggested that the reason for the low production yield of ethanol when lignocellulose is used as a raw material is not growth inhibition by ethanol. Although the time to reach the stationary phase was different, P. kudriavzevii NBRC1279 and NBRC1664 as well as S. cerevisiae BY4742 showed similar growth curve profiles when cultured in SCD medium containing 42 mM furfural. When cultured in SCD medium containing 10 mM vanillin, P. kudriavzevii NBRC1279 and NBRC1664 showed similar growth curve profiles, but S. cerevisiae BY4742 showed only slight growth. In contrast, when cultured in SCD medium containing 56 mM HMF, P. kudriavzevii NBRC1664 showed no growth inhibition, while P. kudriavzevii NBRC1279 and S. cerevisiae BY4742 showed weak growth. When the growth rates under each stress condition were calculated, the growth rates of P. kudriavzevii NBRC1279 and NBRC1664 were higher than that of S. cerevisiae BY4742, and P. kudriavzevii NBRC1664 showed the highest value under all conditions (Table 2). Moreover, the growth rates of P. kudriavzevii NBRC1279 and NBRC1664 differed under stress with 56 mM HMF, and the growth rate of P. kudriavzevii NBRC1664 was more than 1.3-fold higher than that of P. kudriavzevii NBRC1279 (Table 2). Overall, P. kudriavzevii NBRC1664 grew better than P. kudriavzevii NBRC1279 and S. cerevisiae BY4742 on these media with inhibitors.
Based on the observed growth phenotypes (Figure 1), growth curves (Figure 2) and growth rates (Table 2), P. kudriavzevii NBRC1279 and NBRC1664 were shown to have superior inhibitor tolerance capacity compared to S. cerevisiae BY4742. Moreover, it appears that inhibitor tolerance capacity of P. kudriavzevii NBRC1664 was greater than that of P. kudriavzevii NBRC1279, since P. kudriavzevii NBRC1664 showed remarkable growth in the presence of HMF and the time to reach the stationary phase was short. A higher yield of ethanol is expected using P. kudriavzevii NBRC1664 than P. kudriavzevii NBRC1279 when hydrothermally treated lignocellulose is used as the raw material, which is consistent with the results of our previous study, in which SSF was performed with particles from Japanese cedar or eucalyptus as raw materials [8].

3.2. RT-qPCR Analysis of ADHs under HMF Stress

Several kinds of yeast strains that show HMF tolerance capacity have been discovered, with extensive research having been conducted on S. cerevisiae. In S. cerevisiae cells under HMF stress, complex interactions, regulatory networks and co-regulation by various genes lead to the activation of enzymes that catalyze the degradation of HMF and repair the damage caused by HMF [18]. In the in situ detoxification of HMF, an NADPH-dependent reductase such as GRE2 (methylglyoxal reductase), which exhibits broad substrate specificity for aldehydes, functions as one of the key enzymes [18]. Through the action of GRE2, HMF is converted into the less toxic compound furan-2,5-dimethanol, and growth inhibition is thereby suppressed. On the other hand, P. kudriavzevii NBRC1279 and NBRC1664 show superior inhibitor tolerance capacity compared to S. cerevisiae BY4742 (Figure 1 and Figure 2), and NADPH-dependent aldehyde reductase genes have yet to be annotated in the draft genomes of P. kudriavzevii NBRC1279 and NBRC1664. These results indicate that P. kudriavzevii NBRC1279 and NBRC1664 may have different inhibitor tolerance capacities than S. cerevisiae BY4742. In Pichia pastoris, which is a yeast related to P. kudriavzevii, ADH is considered one of the key enzymes for the furaldehyde detoxification capacity [19]. In the draft genome sequence of P. kudriavzevii NBRC1664, seven gene sequences for ADH and ADHF are conserved (Table 1). Thus, in this study, to investigate the inhibitor tolerance capacity of P. kudriavzevii NBRC1664, an RT-qPCR analysis was performed using the yeast strain cultured in SCD medium containing 56 mM HMF.
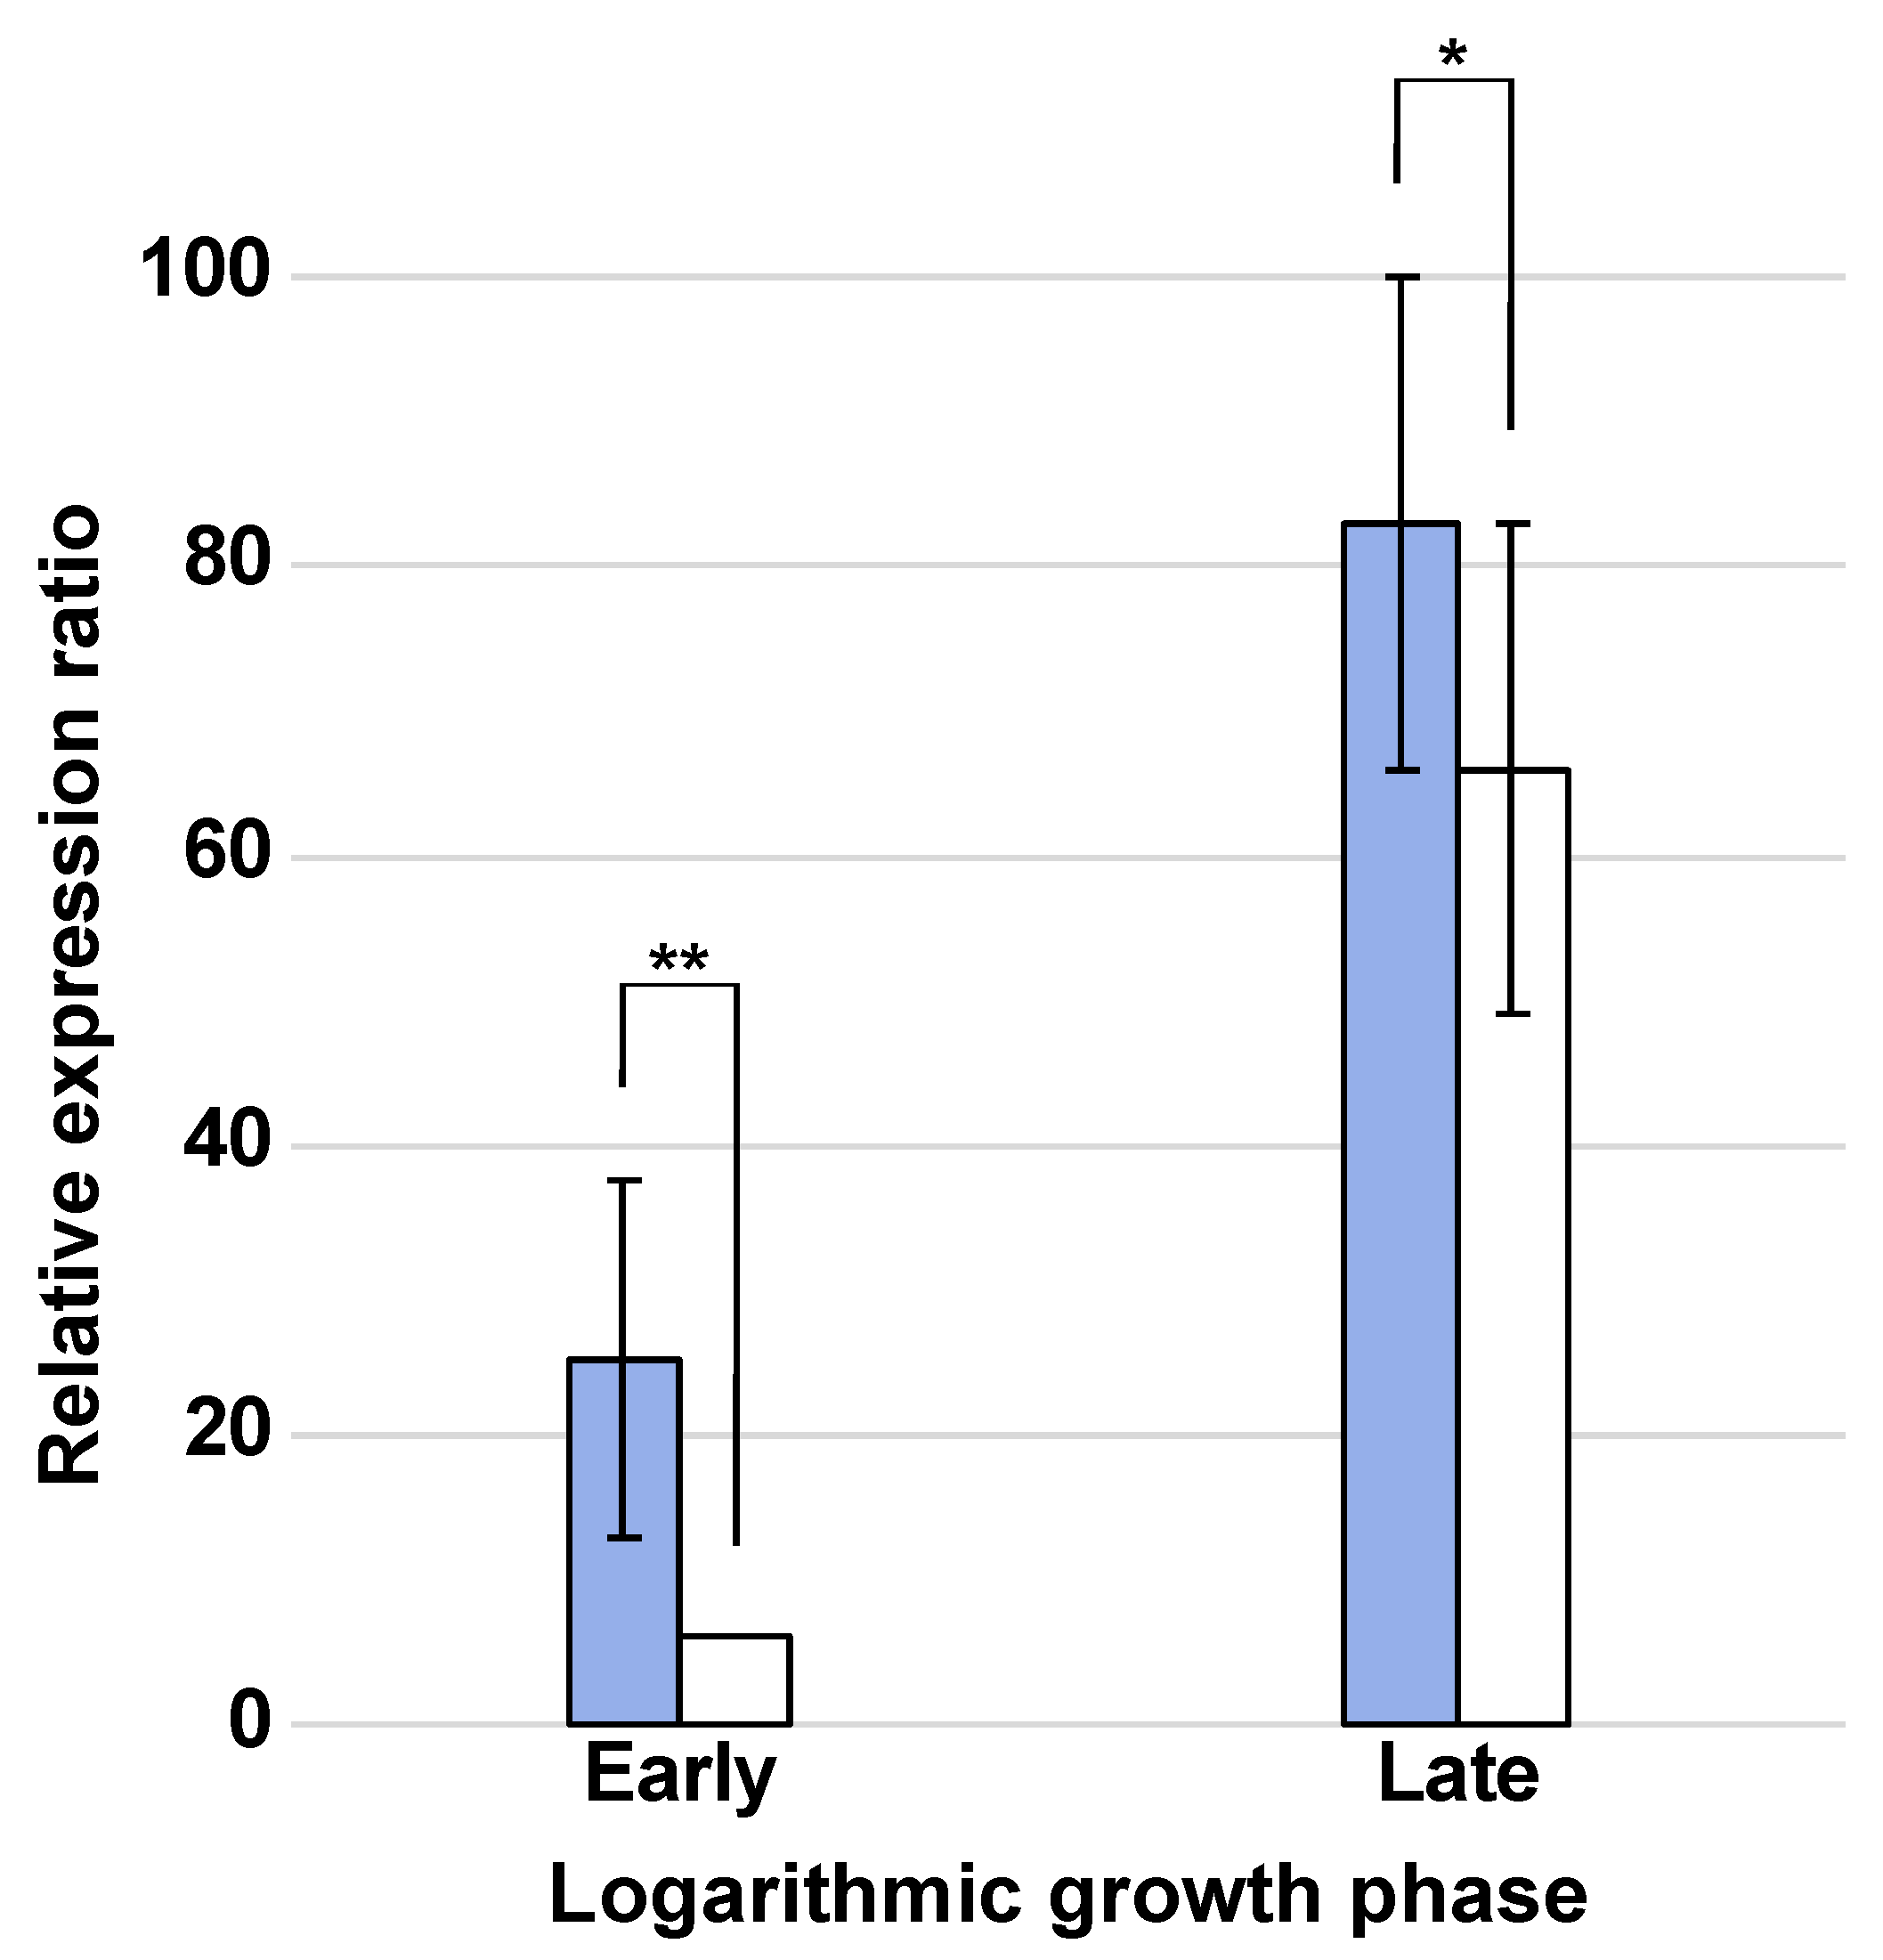
To date, when P. kudriavzevii is used as the target, the tolerance mechanisms for acids such as hydrochloric acid [11], acetic acid [20] and lactic acid [21] have been investigated using transcriptome analysis; however, the tolerance mechanisms to inhibitors such as HMF and furfural have not been elucidated. P. kudriavzevii NBRC1664 exhibits superior inhibitor tolerance capacity compared to P. kudriavzevii KJ27-7, which can grow in the presence of 15% ethanol, 5 mM furfural or 25 mM HMF [22]. Based on the findings in these previous studies, P. kudriavzevii NBRC1664 may have an unknown metabolic pathway for inhibitor degradation. Thus, it is expected that the inhibitor tolerance mechanism of P. kudriavzevii will be elucidated, starting with understanding the role of ADHs and ADHFs in this study. The transcription levels of the seven kinds of ADHs and ADHFs were investigated with cells cultured with various inhibitors (the A600 values increased to about 0.2). As a result, the transcription level of ADHs did not increase, but the transcription levels of ADHF1 and ADHF2 increased only when cultured with 56 mM HMF. To clarify the details of HMF tolerance capacity, an RT-qPCR analysis was performed with cells obtained at the early (30 h) and late (50 h) logarithmic growth phases. When P. kudriavzevii NBRC1664 was cultured in SCD medium containing 56 mM HMF, the transcription levels of ADHF1 and ADHF2 increased at both logarithmic growth phases (Figure 3). While the reason why the transcription of ADHs was not up-regulated is unclear, ADHs may act in response to other stresses. S. cerevisiae has multiple resistance mechanisms, with different proteins functioning depending on the type of stress [23]. Moreover, we previously confirmed that P. kudriavzevii NBRC1664 also has multiple pathways for resistance to several stresses [11]. Thus, ADHs may act during other stress responses.
In the early logarithmic growth phase, the relative expression ratios of ADHF1 and ADHF2 were approximately 25 and 6.0, respectively. In the late logarithmic growth phase, the transcription of ADHF1 and ADHF2 was promoted, and their relative expression ratios increased to 3.3- and 11.0-fold higher, respectively. Under HMF stress, the transcription levels of ADHF1 and ADHF2 were up-regulated, with the ADHF2 transcript levels being higher than those of ADHF1. These results suggest that P. kudriavzevii NBRC1664 may acquire HMF tolerance capacity through the interbacterial expression of ADHF1 and ADHF2. In contrast, in the draft genome of P. kudriavzevii NBRC1279, the ADHF1 gene is conserved, but the ADHF2 gene is not. The lower HMF tolerance capacity of P. kudriavzevii NBRC1279 compared to that of P. kudriavzevii NBRC1664 may be partly due to the lack of ADHF2.
Elucidating the tolerance capacity and pathways of P. kudriavzevii NBRC1664 against inhibitors will make it possible to devise strategies for the metabolic engineering of more useful strains for ethanol production from lignocellulose as a raw material. For example, if the expression level of ADHF1 or related metabolic enzymes in the cells can be increased by modifying the promoter activity, the ethanol yield from lignocellulose can be improved [24]. The optimization of metabolic pathways related to ethanol production and inhibitor degradation based on metabolic flux analysis using stable isotope-labeled substrates can improve ethanol yield [25,26]. On the other hand, several kinds of ethanol-producing strains are developed by modifying or imparting ethanol production ability, but most of them are affected by inhibitors in the hydrolysate prepared from lignocellulose, resulting in lower ethanol yield [27]. To avoid a reduction in ethanol yield, it is necessary to introduce enzymes with inhibitor-degrading activity. In fact, it has been reported that the overexpression of aldehyde-degrading enzymes in bacterial cells improves growth in the hydrolysate [28]. Thus, if the inhibitor-degrading activity of ADHF1 is higher than those of known enzymes, it could be a candidate gene for imparting inhibitor tolerance capacity to ethanol-producing strains.

3.3. Elucidation of the HMF Tolerance Capacity of P. kudriavzevii NBRC1664

The structures of several ADHs from prokaryotes, eukaryotes and archaea have been determined, and the details of the substrate and coenzyme recognition sites of human ADH 1A3 (hADH1A3) have been clarified. Thus, to enable an elucidation of HMF resistance capacity, the amino acid sequence alignment of hADH1A3, ADHF1 and ADHF2 was conducted (Figure 4).
hADH1A3 recognizes NAD+ as a coenzyme through the interactions of Thr178, Trp180, Lys204, Glu207, Ser245, Ser258 and Glu411 [29]. These residues are conserved in ADHF1, except that Thr178 in hADH1A3 is replaced by Ile166 in ADHF1 (Figure 4). In the hADH1A3/NAD+ binary complex, the carboxy group of Thr178, but not the side chain, interacts with the adenine ribose of NAD+, which indicates that Ile166 in ADHF1 may have a similar function to Thr178 in hADH1A3. Thus, similar to hADH1A3, ADHF1 may be an NAD+-dependent enzyme. hADH1A3 catalyzes the oxidation of these aldehydes to carboxylic acids and shows a broad range of substrate specificity for aldehydes such as all-trans-retinal and acetaldehyde [30]. In the hADH1A3/NAD+/retinoic acid ternary complex, retinoic acid is recognized by the following residues: Ile132, Gly136, Arg139, Thr140, Asn181, Met186, Trp189 Cys314, Thr315, Asn469, Leu471 and Ala473 [30]. Asn181, Met186 and Cys314 play a particularly important role in the dehydrogenation of aldehydes, and those amino acid residues are conserved as Asn169, Met174 and Cys302 in ADHF1. In hADH1A3, Gly136, Thr315 and Leu471 make a difference to the substrate specificity, as differences in the side chain size of these amino acid residues affect the interaction between the aldehydes and the substrate-binding site of the enzyme [31]. In other words, the substrate specificity of hADH1A3 depends on the structural features of the substrate access tunnel formed by Gly136, Thr315 and Leu471 located near the catalytic Cys314 [30]. Gly136 is located near the tunnel entrance, but its small side chain does not prevent the binding of the cyclic aldehyde to the substrate binding site. Compared to their related enzymes, Thr315 and Leu471 also have relatively small side chains, forming a large, wide-open tunnel [31]. Thus, hADH1A3 can recognize aldehydes with cyclic structures such as all-trans-retinal because of its large, wide-open tunnel. In ADHF1, the aforementioned residues are conserved as Ser125, Thr303 and Glu461. These findings suggest that ADHF1 has activity against HMF, since this enzyme may have a large and wide-open tunnel formed by Gly136, Thr315 and Leu471, similar to hADH1A3.
Similar to ADHF1, ADHF2 has conserved amino acid residues that act in coenzyme recognition similar to hADH1A3 (Figure 4), suggesting that this enzyme is also an NAD+-dependent enzyme. However, amino acid residues that have a role in substrate recognition in hADH1A3 are conserved as Gly143, Glu147, Asp150, Val151, Asn195, Met200, Trp203, Cys328, Thr329, Gly483, Ser485 and Ile487. In other words, ADHF2 also shows activity towards aldehydes, but its substrate specificity may be different from that of hADH1A3 and ADHF1 because the side chain of Glu147, which is located near the tunnel entrance, may prevent the binding of the cyclic aldehyde to the substrate binding site. Thus, compared to ADHF1, ADHF2 may have lower activity against HMF.
The fungal HMF degradation pathway has been proposed in detail in Amorphotheca resinae ZN1 based on transcriptional analysis [32]. A. resinae ZN1 can grow with furfural or HMF as the sole carbon source. When HMF is incorporated into the A. resinae ZN1 cell, HMF is quickly reduced to HMF alcohol by an alcohol dehydrogenase, and the HMF alcohol is subsequently re-oxidized again to the aldehyde form (HMF) but at a much lower, harmless concentration. HMF is sequentially oxidized to furoic acid by an aldehyde dehydrogenase, two kinds of oxidase and decarboxylase, and then furoyl-CoA is produced from a combination of furoic acid and coenzyme A through acyl-CoA synthetase. Finally, through the catalytic action of dehydrogenase, lactonase and thioesterase, furoyl-CoA is sequentially hydroxylated to 2-oxoglutaric acid, which is then metabolized via the tricarboxylic acid cycle. P. kudriavzevii NBRC1664 may have a similar HMF degradation pathway to A. resinae ZN1, as ADHF1 acts on the oxidation of HMF, and the resulting HMF acid may be detoxified by other enzymes. However, the other enzymes involved in the HMF degradation pathway of P. kudriavzevii NBRC1664 have not been identified yet, and we expect that transcriptome analysis will be necessary. We were able to analyze the acid tolerance mechanisms of P. kudriavzevii NBRC1279 and NBRC1664 [11], and transcriptome analysis may identify the expression of specific gene sets in response to HMF stress. These results will be described elsewhere in the future.

4. Conclusions

In this study, using the inhibitors produced after the hydrolysis of lignocellulose, the inhibitor tolerance capacities of P. kudriavzevii NBRC1279 and NBRC1664 as well as S. cerevisiae BY4742 were examined through spot assay and growth assessment. Of the three strains, only P. kudriavzevii NBRC1664 formed colonies under all conditions. In contrast to the results of the spot assay, the three strains could grow in the SCD medium containing each inhibitor, and P. kudriavzevii NBRC1664 showed the fastest growth rate under all conditions. Based on the observed growth phenotypes, growth curves and growth rates, the inhibitor tolerance capacity of P. kudriavzevii NBRC1664 was greater than those of P. kudriavzevii NBRC1279 and S. cerevisiae BY4742. To elucidate the HMF tolerance capacity of P. kudriavzevii NBRC1664, RT-qPCR analysis was carried out using cells cultivated under stress with 56 mM HMF, and the results revealed that the expression levels of ADHF1 and ADHF2 increased among the ADHs conserved in this strain. The amino acid sequence alignment suggested that both enzymes may catalyze the reversible NAD+-dependent oxidation of HMF.

Author Contributions

Conceptualization, H.A. and A.M.; methodology, H.A. and A.M.; validation, H.A.; formal analysis, H.A. and A.M.; investigation, H.A. and A.M.; resources, A.M.; data curation, H.A.; writing—original draft preparation, H.A.; writing—review and editing, H.A. and A.M.; visualization, H.A.; supervision, H.A. and A.M. All authors have read and agreed to the published version of the manuscript.

Funding

This study was supported by a Grant-in-Aid for Scientific Research (C) (to A.M.) (KAKENHI Grant Number JP22K04848) from the Japan Society for the Promotion of Science (JSPS).

Institutional Review Board Statement

Not applicable.

Informed Consent Statement

Not applicable.

Data Availability Statement

Draft genome sequences of P. kudriavzevii NBRC1664 were deposited in the DDBJ/EMBL/GenBank databases under the accession numbers BHFP01000001–BHFP01000076.

Acknowledgments

We are grateful to all members of the Department of Liberal Arts and Basic Science at our institute (College of Industrial Technology, Nihon University) for their technical assistance and valuable discussions. We also thank Zheng Xiahong, Tomoe Komoriya and Ayumu Watanabe for their technical support.

Conflicts of Interest

The authors declare no conflicts of interest.

References

  1. Liu, Y.; Cruz-Morales, P.; Zargar, A.; Belcher, M.S.; Pang, B.; Englund, E.; Dan, Q.; Yin, K.; Keasling, J.D. Biofuels for a sustainable future. Cell 2021, 184, 1636–1647. [Google Scholar] [CrossRef] [PubMed]
  2. Rego-Costa, A.; Huang, I.-T.; Desai, M.M.; Gombert, A.K. Yeast population dynamics in Brazilian bioethanol production. G3 2023, 13, jkad104. [Google Scholar] [CrossRef] [PubMed]
  3. Broda, M.; Yelle, D.J.; Serwańska, K. Bioethanol production from lignocellulosic biomass—Challenges and solutions. Molecules 2022, 27, 8717. [Google Scholar] [CrossRef]
  4. Demeke, M.M.; Echemendia, D.; Belo, E.; Foulquié-Moreno, M.R.; Thevelein, J.M. Enhancing xylose-fermentation capacity of engineered Saccharomyces cerevisiae by multistep evolutionary engineering in inhibitor-rich lignocellulose hydrolysate. FEMS Yeast Res. 2024, 24, foae013. [Google Scholar] [CrossRef] [PubMed]
  5. Wang, H.; Cao, L.; Li, Q.; Wijayawardene, N.N.; Zhao, J.; Cheng, M.; Li, Q.R.; Li, X.; Promputtha, I.; Kang, Y.Q. Overexpressing GRE3 in Saccharomyces cerevisiae enables high ethanol production from different lignocellulose hydrolysates. Front. Microbiol. 2022, 13, 1085114. [Google Scholar] [CrossRef] [PubMed]
  6. van Dijk, M.; Mierke, F.; Nygård, Y.; Olsson, L. Nutrient-supplemented propagation of Saccharomyces cerevisiae improves its lignocellulose fermentation ability. AMB Express 2020, 10, 157. [Google Scholar] [CrossRef]
  7. Fujii, T.; Murakami, K.; Endo, T.; Fujimoto, S.; Minowa, T.; Matsushika, A.; Yano, S.; Sawayama, S. Bench-scale bioethanol production from eucalyptus by high solid saccharification and glucose/xylose fermentation method. Bioprocess Biosyst. Eng. 2014, 37, 749–754. [Google Scholar] [CrossRef] [PubMed]
  8. Akita, H.; Goshima, T.; Suzuki, T.; Itoiri, Y.; Kimura, Z.-I.; Matsushika, A. Application of Pichia kudriavzevii NBRC1279 and NBRC1664 to simultaneous saccharification and fermentation for bioethanol production. Fermentation 2021, 7, 83. [Google Scholar] [CrossRef]
  9. Liu, Z.L.; Blaschek, H.P. Biomass conversion inhibitors and in situ detoxification. Biomass Biofuels Strateg. Glob. Ind. 2010, 233–259. [Google Scholar] [CrossRef]
  10. Iwaki, A.; Ohnuki, S.; Suga, Y.; Izawa, S.; Ohya, Y. Vanillin inhibits translation and induces messenger ribonucleoprotein (mRNP) granule formation in saccharomyces cerevisiae: Application and validation of high-content, image-based profiling. PLoS ONE 2013, 8, e61748. [Google Scholar] [CrossRef]
  11. Akita, H.; Matsushika, A. Transcription analysis of the acid tolerance mechanism of Pichia kudriavzevii NBRC1279 and NBRC1664. Fermentation 2023, 9, 559. [Google Scholar] [CrossRef]
  12. Untergasser, A.; Cutcutache, I.; Koressaar, T.; Ye, J.; Faircloth, B.C.; Remm, M.; Rozen, S.G. Primer3—New capabilities and interface. Nucleic Acids Res. 2012, 40, e115. [Google Scholar] [CrossRef]
  13. Thompson, J.D.; Higgins, D.G.; Gibson, T.J. CLUSTAL W: Improving the sensitivity of progressive multiple sequence alignment through sequence weighting, position-specific gap penalties and weight matrix choice. Nucleic Acids Res. 1994, 22, 4673–4680. [Google Scholar] [CrossRef]
  14. Gouet, P.; Courcelle, E.; Stuart, D.I.; Métoz, F. ESPript: Analysis of multiple sequence alignments in PostScript. Bioinformatics 1999, 15, 305–308. [Google Scholar] [CrossRef]
  15. Elahi, A.; Rehman, A. Bioconversion of hemicellulosic materials into ethanol by yeast, Pichia kudriavzevii 2-KLP1, isolated from industrial waste. Rev. Argent. Microbiol. 2018, 50, 417–425. [Google Scholar] [CrossRef]
  16. Dandi, N.D.; Dandi, B.N.; Chaudhari, A.B. Bioprospecting of thermo- and osmo-tolerant fungi from mango pulp-peel compost for bioethanol production. Antonie Van Leeuwenhoek 2013, 103, 723–736. [Google Scholar] [CrossRef]
  17. Yuan, S.F.; Guo, G.L.; Hwang, W.S. Ethanol production from dilute-acid steam exploded lignocellulosic feedstocks using an isolated multistress-tolerant Pichia kudriavzevii strain. Microb. Biotechnol. 2017, 10, 1581–1590. [Google Scholar] [CrossRef]
  18. Ma, M.; Liu, Z.L. Comparative transcriptome profiling analyses during the lag phase uncover YAP1, PDR1, PDR3, RPN4, and HSF1 as key regulatory genes in genomic adaptation to the lignocellulose derived inhibitor HMF for Saccharomyces cerevisiae. BMC Genom. 2010, 11, 660. [Google Scholar] [CrossRef]
  19. Paes, B.G.; Steindorff, A.S.; Formighieri, E.F.; Pereira, I.S.; Almeida, J.R.M. Physiological characterization and transcriptome analysis of Pichia pastoris reveals its response to lignocellulose-derived inhibitors. AMB Express 2021, 11, 2. [Google Scholar] [CrossRef]
  20. Li, Y.; Wu, Z.; Li, R.; Miao, Y.; Weng, P.; Wang, L. Integrated transcriptomic and proteomic analysis of the acetic acid stress in Issatchenkia orientalis. J. Food Biochem. 2020, 44, e13203. [Google Scholar] [CrossRef]
  21. Du, H.; Fu, Y.; Deng, N.; Xu, Y. Transcriptional profiling reveals adaptive response and tolerance to lactic acid stress in Pichia kudriavzevii. Foods 2022, 11, 2725. [Google Scholar] [CrossRef]
  22. Zwirzitz, A.; Alteio, L.; Sulzenbacher, D.; Atanasoff, M.; Selg, M. Ethanol production from wheat straw hydrolysate by Issatchenkia orientalis isolated from waste cooking oil. J. Fungi 2021, 7, 121. [Google Scholar] [CrossRef]
  23. Chen, R.E.; Thorner, J. Function and regulation in MAPK signaling pathways: Lessons learned from the yeast Saccharomyces cerevisiae. Biochim. Biophys. Acta 2007, 1773, 1311–1340. [Google Scholar] [CrossRef]
  24. Khamwachirapithak, P.; Guillaume-Schoepfer, D.; Chansongkrow, P.; Teichmann, S.A.; Wigge, P.A.; Charoensawan, V. Characterizing different modes of interplay between Rap1 and H3 using inducible H3-depletion yeast. J. Mol. Biol. 2023, 435, 168355. [Google Scholar] [CrossRef]
  25. Guo, W.; Chen, Y.; Wei, N.; Feng, X. Investigate the metabolic reprogramming of Saccharomyces cerevisiae for enhanced resistance to mixed fermentation inhibitors via 13C metabolic flux analysis. PLoS ONE 2016, 11, e0161448. [Google Scholar] [CrossRef]
  26. Wasylenko, T.M.; Stephanopoulos, G. Metabolomic and 13C-metabolic flux analysis of a xylose-consuming Saccharomyces cerevisiae strain expressing xylose isomerase. Biotechnol. Bioeng. 2015, 112, 470–483. [Google Scholar] [CrossRef]
  27. Joshi, A.; Vermam, K.K.; Rajput, V.D.; Minkina, T.; Arora, J. Recent advances in metabolic engineering of microorganisms for advancing lignocellulose-derived biofuels. Bioengineered 2022, 13, 8135–8163. [Google Scholar] [CrossRef]
  28. Akita, H.; Watanabe, M.; Suzuki, T.; Nakashima, N.; Hoshino, T. Characterization of the Kluyveromyces marxianus strain DMB1 YGL157w gene product as a broad specificity NADPH-dependent aldehyde reductase. AMB Express 2015, 5, 17. [Google Scholar] [CrossRef]
  29. Castellví, A.; Pequerul, R.; Barracco, V.; Juanhuix, J.; Parés, X.; Farrés, J. Structural and biochemical evidence that ATP inhibits the cancer biomarker human aldehyde dehydrogenase 1A3. Commun. Biol. 2022, 5, 354. [Google Scholar] [CrossRef]
  30. Moretti, A.; Li, J.; Donini, S.; Sobol, R.W.; Rizzi, M.; Garavaglia, S. Crystal structure of human aldehyde dehydrogenase 1A3 complexed with NAD+ and retinoic acid. Sci. Rep. 2016, 6, 35710. [Google Scholar] [CrossRef]
  31. Sobreira, T.J.P.; Marlétaz, F.; Simões-Costa, M.; Schechtman, D.; Pereira, A.C.; Brunet, F.; Sweeney, S.; Pani, A.; Aronowicz, J.; Lowe, C.J.; et al. Structural shifts of aldehyde dehydrogenase enzymes were instrumental for the early evolution of retinoid-dependent axial patterning in metazoans. Proc. Natl. Acad. Sci. USA 2011, 108, 226–231. [Google Scholar] [CrossRef]
  32. Wang, X.; Gao, Q.; Bao, J. Transcriptional analysis of Amorphotheca resinae ZN1 on biological degradation of furfural and 5-hydroxymethylfurfural derived from lignocellulose pretreatment. Biotechnol. Biofuels 2015, 8, 136. [Google Scholar] [CrossRef]
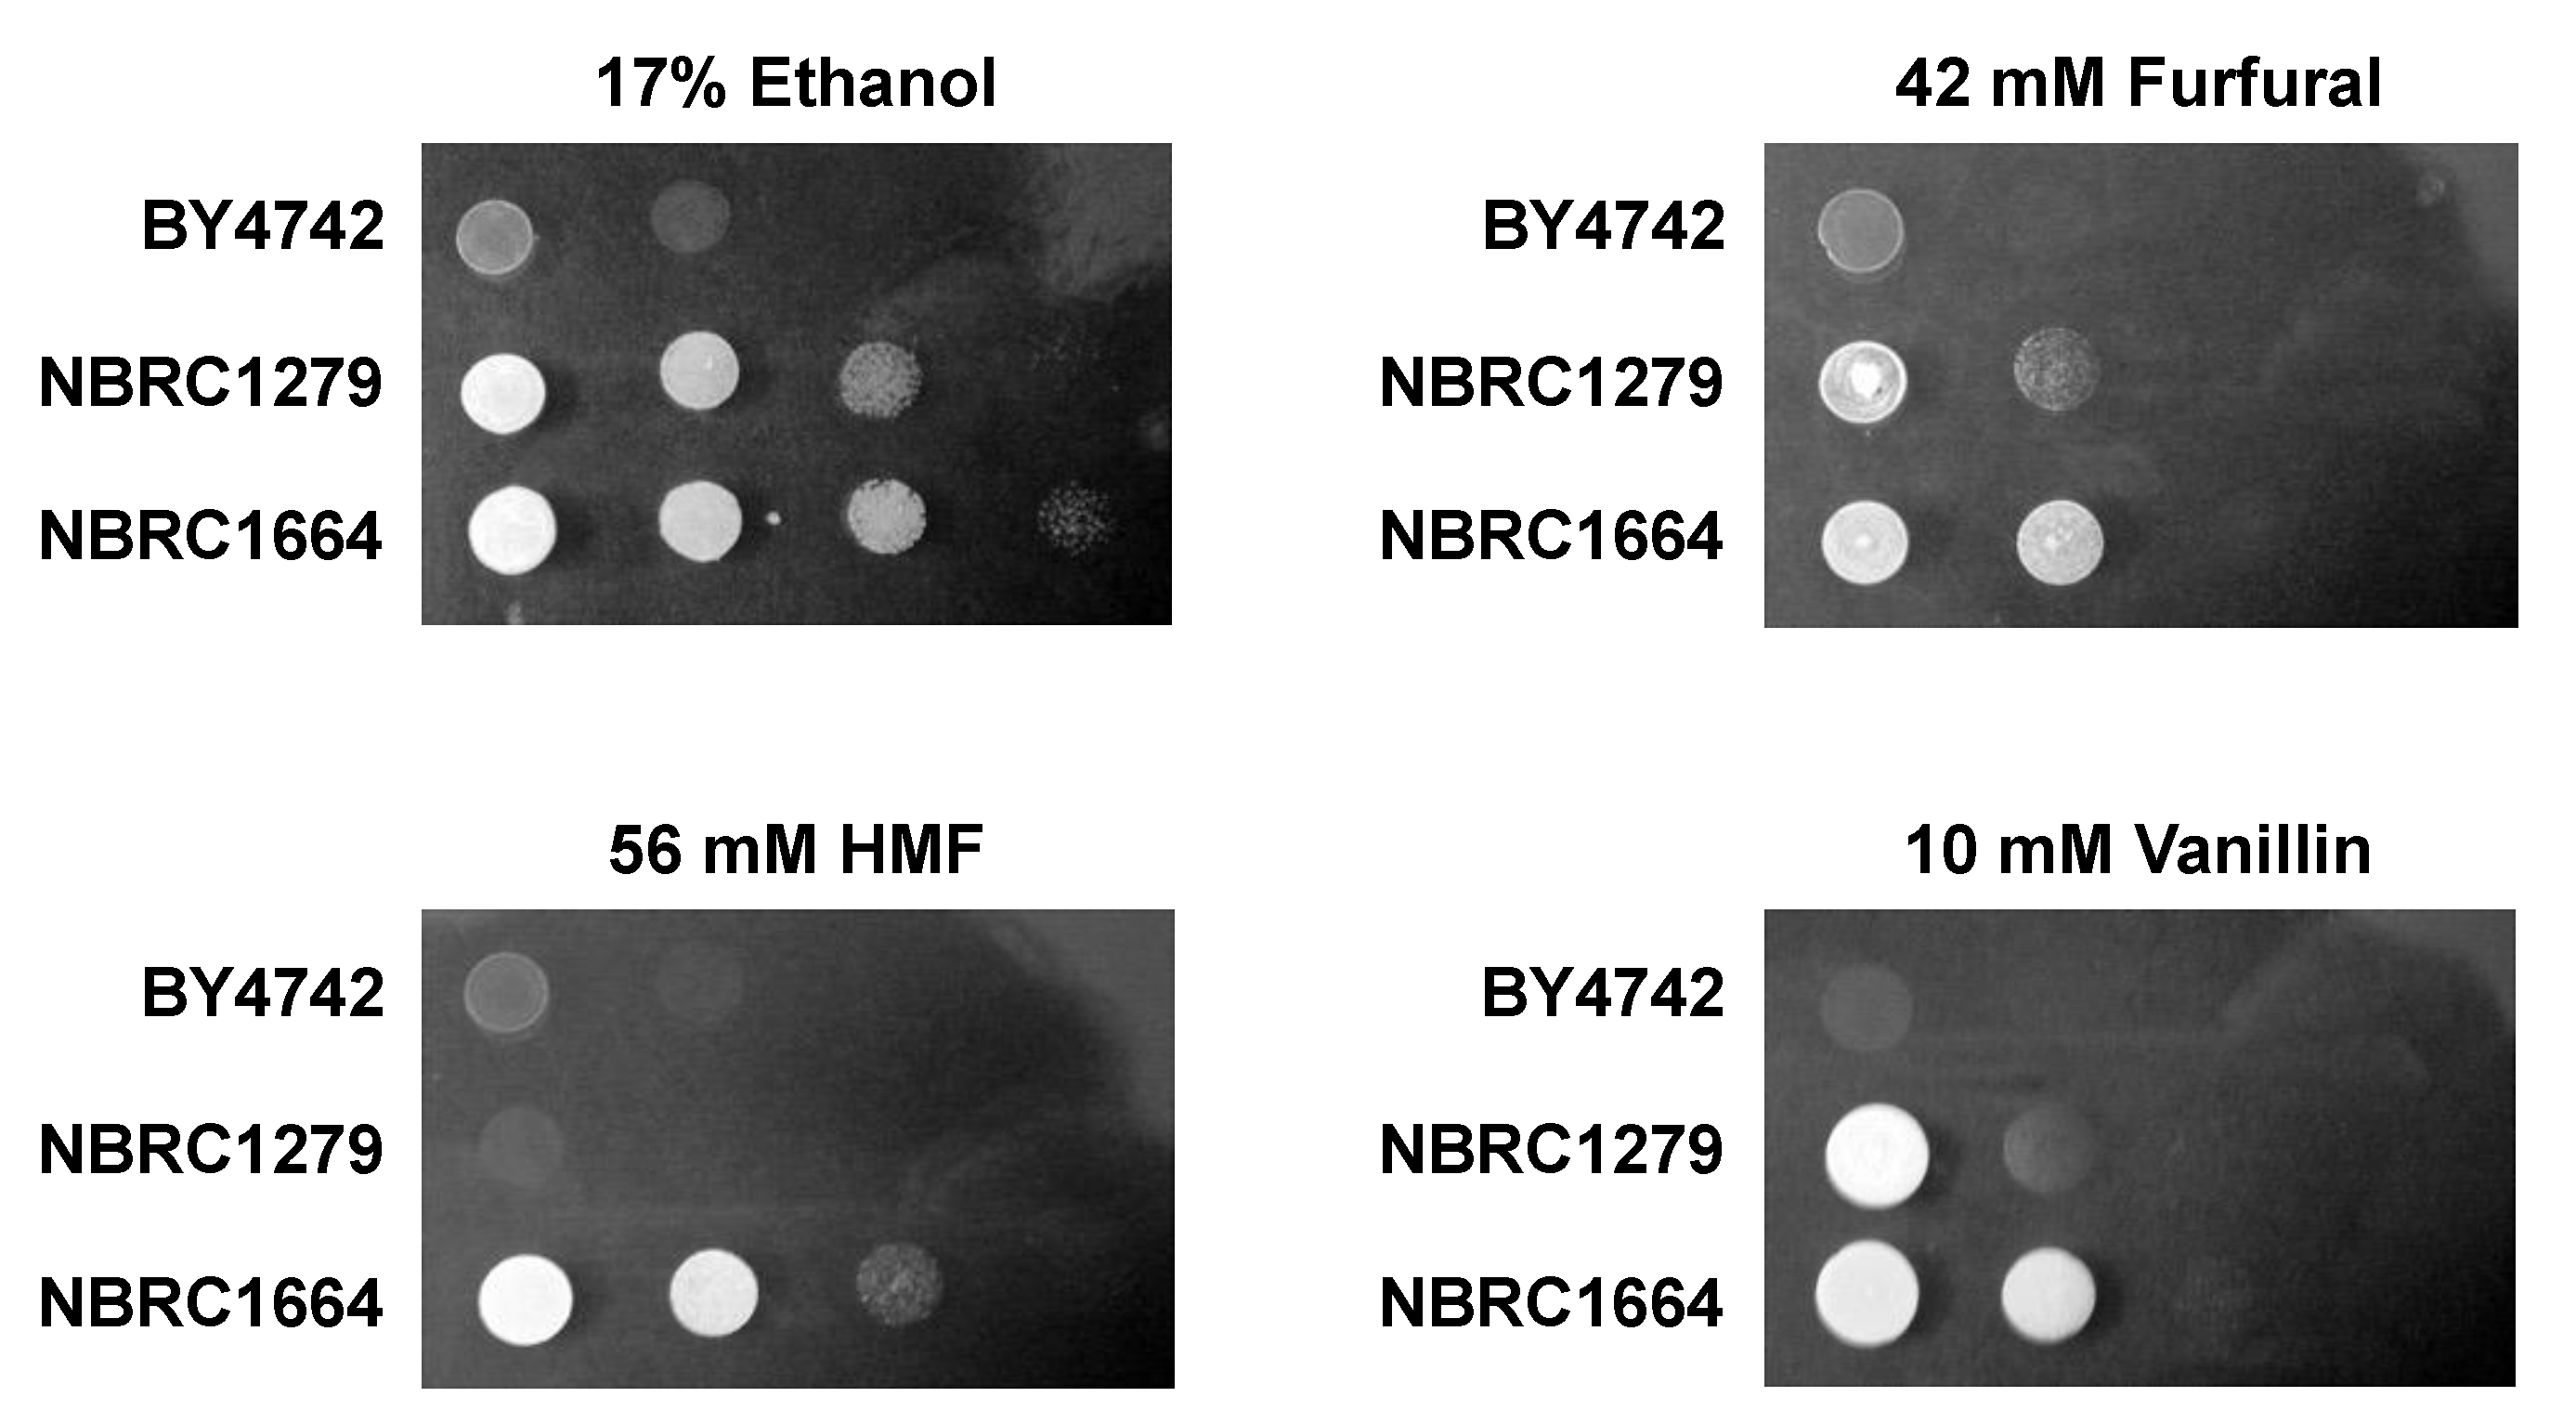
Figure 1. Growth phenotypes of the three yeast strains in the presence of different inhibitors. Aliquots (2 μL) of the suspension of 3-fold serial dilutions were spotted onto SCD plates containing 17% ethanol or various inhibitors (42 mM furfural, 56 mM HMF or 10 mM vanillin). The various plates were then incubated at 30 °C for 3, 4, 4 or 3 days, respectively.
Fermentation 10 00331 g001
Figure 2. Growth curves of the three yeast strains cultured in the presence of various inhibitors. The aerobic growth of P. kudriavzevii NBRC1279 (closed triangles) and NBRC1664 (closed squares) as well as S. cerevisiae BY4742 (open circles) in SCD medium containing 42 mM furfural, 56 mM HMF and 10 mM vanillin was measured over 72 h by assaying the absorbance at 600 nm. Error bars indicate the standard error (n = 3). Values are the means of three independent experiments.
Fermentation 10 00331 g002
Figure 3. Relative expression ratios of ADHF1 and ADHF2 under stress with 56 mM HMF. The relative expression ratios of ADHF1 and ADHF2 are indicated by blue and white bars, respectively. Transcription levels are shown relative to that of act1 as an internal control (* p-value < 0.15; ** p-value < 0.05). Error bars indicate the standard error (n = 3).
Fermentation 10 00331 g003
Figure 4. Multiple sequence alignment of hADH1A3, ADHF1 and ADHF2. The secondary structural elements of hADH1A3 are shown at the top. Residues involved in the coenzyme-binding and substrate-binding sites in hADH1A3 are marked with black triangles and black stars, respectively.
Fermentation 10 00331 g004
Table 1. Proteins and primers used in the RT-qPCR analysis.
Primer Sequence (5′–3′)
LocusProteinForwardReverse
3340ActinATCCTTCAGAGTGCCACACCACCGCTTTCTCTGTTGACGA
21,230Aldehyde dehydrogenase (ADH1)TTGCCCAACTTTTCTCGTGCCAAGTTCCAAAACCACCGGC
39,770Aldehyde dehydrogenase (ADH2)TGATCCAAGAATCCGCAGCACCAACGTTAACACCAGTGGC
42,380Aldehyde dehydrogenase (ADH3)AAGGTGCACAAACCACTCCATCAAGCCTTTCGGAAACCCA
44,250Aldehyde dehydrogenase family protein (ADHF1)TGTCGGCTGCATCATTCCATGAAAGCGCTGAGCCAACATC
51,420Aldehyde dehydrogenase family protein (ADHF2)ATATCAGTATTGAGCAAGCTTGTAGACATGACAGATCGCCTCACC
60,390Aldehyde dehydrogenase (ADH4)GTTTGTTTTCAGTCCTTGTATCCTTGTCCTTGTGTGCCTCCATC
Table 2. Growth rates (h−1) of the three yeast strains at the logarithmic growth phase when cultured in the presence of various inhibitors.
Yeast17% Ethanol42 mM Furfural56 mM HMF10 mM Vanillin
S. cerevisiae BY47420.2670.01730.09200.0229
P. kudriavzevii NBRC12790.3960.04030.1310.0783
P. kudriavzevii NBRC16640.4110.04640.1690.0849
Disclaimer/Publisher’s Note: The statements, opinions and data contained in all publications are solely those of the individual author(s) and contributor(s) and not of MDPI and/or the editor(s). MDPI and/or the editor(s) disclaim responsibility for any injury to people or property resulting from any ideas, methods, instructions or products referred to in the content.