Article

Influence of Galvanized Steel on Kombucha Fermentation: Weight Loss Measurements, Scanning Electron Microscopy Analysis, Corrosion Activity, and Phytochemical Study

1
Laboratoire de Recherche, Biodiversité, Molécule et Application, Institut Supérieur de Biologie Appliquée de Médenine, Université de Gabès, Gabes 6072, Tunisia
2
Laboratoire de Génie Chimique, Université de Toulouse, CNRS, INPT, UPS, F-31062 Toulouse, France
3
Unité de Recherche: Electrochimie, Matériaux et Environnement (UR17ES45), Faculté des Sciences de Gabès, Université de Gabès, Gabes 6072, Tunisia
4
Laboratoire: Energie, Eau, Environnement et Procédés (LR18ES35), Ecole Nationale d’Ingénieurs de Gabès, Université de Gabès, Gabes 6072, Tunisia
*
Authors to whom correspondence should be addressed.
Fermentation 2024, 10(3), 159; https://doi.org/10.3390/fermentation10030159
Submission received: 19 January 2024 / Revised: 4 March 2024 / Accepted: 6 March 2024 / Published: 11 March 2024

Abstract

:
This study aimed to investigate the influence of galvanized steel coupons on black tea kombucha fermentation. As a secondary objective, the corrosion activity of the fermented medium at different stages of fermentation was investigated. The results revealed significant interactions among microorganisms, the metal, and the fermented medium. On one hand, mass loss measurement, scanning electron microscopy (SEM) analysis, and released zinc and iron ion analysis showed the deterioration of galvanized steel coupons. On the other hand, HPLC-RI analysis showed that the presence of steel coupons improved the kinetics of fermentation. The chemical composition and bioactivity of kombucha were also influenced by the presence of galvanized steel. The results showed the detection of eleven phenolic compounds by HPLC-DAD, including trihydroxyethylrutin, methyl 3,5-dihydroxybenzoate, and ethyl 4-hydroxy-3-cinamate, which were found only in kombucha in the presence of galvanized steel (K+GS). In addition, a total of 53 volatile compounds were detected by GC-MS before and after derivatization, including eleven constituents identified for the first time in K+GS. Concerning antioxidant activity, a higher percentage of inhibition against the DPPH radical was attributed to the ethyl acetate extract found in K+GS (IC50 = 8.6 µg/mL), which could suggest the formation of inhibitors. However, according to the electrochemical findings, the corrosion current density increased threefold during the fermentation process compared to acidified black tea, indicating that corrosion activity was promoted in the kombucha medium and suggesting several competing phenomena between corrosion and inhibition.

1. Introduction

Corrosion is a pervasive problem that has an impact on various sectors, including oil and gas production, refineries, the nuclear industry, food factories, and industrial water systems [1]. It leads to the deterioration of many structures, especially metallic materials [2]. Corrosion of metals involves several electrochemical reactions that take place at the surface of the metal that reacts with the surrounding medium [3,4]. Most metals exist naturally in the ionic state in the form of various oxides, hydroxides, and sulfides [4]. When a metal is oxidized, the metal ions migrate from the anodic regions of the metal surface into the electrolyte solution [3,5]. These released electrons are used in cathodic reactions, where they actively participate in the reduction in oxidized substances in the cathodic region on the metal surface. The corrosion process can be intensified by various factors linked to the metal’s structure or to its surroundings, potentially resulting in either galvanic corrosion or microbiologically influenced corrosion (MIC).
MIC involves interactions between microorganisms, metals, and the environment [6,7,8]. These microorganisms initiate, facilitate, or accelerate corrosion reactions by modifying the electrochemical conditions at the metal–solution interface [1]. They tend to adhere to a metal surface in an aqueous or moist environment. They join together to form communities and biofilms. These microorganisms promote corrosion by producing corrosive metabolites (sulfur dioxide, carbon dioxide, or organic acids), dissolving protective films, forming unprotected surface layers, and/or adsorbing electrons directly from the metal [9,10]. Various protection or repair methods that act directly on the metal (organic or metallic coatings, cathodic protection, and corrosion inhibitors) are currently used to combat corrosion [2]. Corrosion inhibitors are compounds added in low concentrations to an aggressive solution and used to prevent or delay the corrosion of metals [11,12]. These inhibitors act via various mechanisms that are often difficult to interpret (e.g., protective oxide layer, adsorbed top layer, precipitation phenomena), leading to cathodic, anodic, or mixed effects [11]. The use of synthetic compounds as inhibitors shows good anticorrosive activity but is generally not environmentally cost-effective. In the field of corrosion research, the ambitious paradigm of circular economy has recently led to the use of plant extracts as green inhibitors against metal corrosion. Several studies have shown that this type of inhibition leads to high efficiencies [13,14]. Therefore, the aim of the present work was to first investigate the influence of introducing galvanized steel (GS) coupons during black tea kombucha fermentation on kinetics and biological activities. In particular, the objective of this study is to assess the formation of corrosion inhibitors during fermentation and to see if this production can be influenced by the addition of GS. To achieve these objectives, fermentation was carried out in two different media: kombucha without (K −GS) and with (K+GS) galvanized steel coupons. The study first aimed to investigate the kinetic process of kombucha fermentation using HPLC-IR analysis and to identify the chemical composition, including the quantification of total phenolic contents, as well as the volatile compounds using HPLC-DAD and GC-MS, and see the influence of GS. Additionally, electrochemical analyses such as open circuit potential (OCP) and linear polarization resistance (LPR) were used to monitor the corrosiveness of the media at different times of fermentation. These methods were complemented by mass loss tests and morphological analysis of the metal structure through SEM observation to inspect the metal evolution.

2. Materials and Methods

2.1. Metal

In this work, galvanized steel (GS) coupons were cut from a plain galvanized steel sheet (0.05 × 20 × 100 cm) purchased from Alfer® Aluminium GmbH company (founded in Wutöschingen-Horheim, in the German state of Baden-Württemberg).
First, the coupons used for immersion experiments in fermented kombucha medium measured 4 × 1 cm. The metal surface was rinsed with acetone and distilled water before each experiment.
To study the corrosiveness of the medium, galvanized steel coupons of 4 × 0.3 cm were used as working electrodes, coated with a varnish that left an active surface of 0.6 cm2 and dried for 24 h.

2.2. Fermentation Process

The infusion of black tea was performed according to a previously described method [15]. A liter of tap water was heated, and sucrose was added at a concentration of 70 g/L at 40 °C. Once the temperature reached 80 °C, ten grams of black tea leaves were added and infused for 15 min. The resulting product was cooled to 25 °C. The tea was then poured into a 2 L glass vessel (ratios: s/v = 0.132 cm−1 and s/h = 9.02 cm), and 10 mL of apple cider vinegar and 20 mL of the previously fermented tea were added. The mixture was inoculated with 20 g/L of a symbiotic culture of bacteria and yeast (SCOBY) obtained from an old preparation of kombucha tea grown in the Symbiotec laboratory (LGC UMR5503, INP Toulouse, France). The container was incubated at 25 °C for 14 days. Two containers were prepared: one with galvanized steel coupons (4 cm × 1 cm) suspended in the medium during fermentation, called K+GS, and another one without galvanized steel coupons, called K−GS. All fermentations were performed in duplicate.

2.3. Quantification of Sugars, Ethanol and Acetic Acid

The quantification of sugar, ethanol, and acetic acid allowed us to follow the kinetics of fermentation. For this purpose, samples were taken every 3 days from the fermented medium, which were analyzed at HPLC-IR. For this purpose, one milliliter of the sample was centrifuged at 10,000 rpm for 5 min using an Eppendorf centrifuge (microcentrifuge Gusto 12 × 1.5/2 mL, Fisherbrand, Strasbourg, France). The supernatant was diluted 10-fold with highly pure demineralized water and filtered with a microfilter (0.2 µm) [16]. The resulting filtrate was subjected to quantitative analysis of sucrose, glucose, fructose, lactic acid, acetic acid, and ethanol using a Thermo Scientific Vanquish HPLC instrument integrated with the Thermo Scientific Chromeleon Chromatography Data System (CDS). Samples (25 µL) were injected into a system equipped with a refractive index detector and an HPX 87H AMINEX column. The mobile phase was run with a 10 mmol/L sulfuric acid solution (pH = 2.2) at a flow rate of 0.6 mL/min. The concentration of each compound was quantified using standard curves and expressed in g/L. All compounds were tested using the same column and run conditions.

2.4. pH Determination

The pH values of the samples were measured at different time points of kombucha fermentation (at 3, 7, 10, and 14 days) using an electronic pH meter (Fisherbrand Accumet AE150 Benchtop pH meter, Thermo Fisher Scientific, Illkirch Cedex, France).

2.5. Zinc and Iron Analysis

Dissolved zinc and iron analyses were performed by inductively coupled atomic plasma emission spectrometry (ICP-AES). They were performed on liquid samples. For each sample, a known mass (m in g) was placed in a pre-weighed mineralization tube (T in g), and 3 mL of nitric acid (65%) was added. The tubes were placed in the mineralizer, covered with a watch glass, and heated to 95 °C for 1 h. After cooling, the volume of liquid in each tube was adjusted to about 25 mL and weighed to determine the final mass of liquid (M in g). The analytical methods used were Fe-Zn (0–100 μg/kg) and Fe-Zn (0–40 mg/kg). The measurement wavelengths of Zn and Fe were 213.856 nm and 259.940 nm, respectively.

2.6. Mass Loss Measurements

For the experimental trial, galvanized steel coupons were immersed in kombucha fermentation medium. Others were placed in sterile black tea as an abiotic control system. After 14 days, the coupons were removed from the biotic and abiotic mediums, cleaned, and weighed after drying. The weight loss was calculated according to the following formula [8]:
W = W 1 W 2
where W1 and W2 are the weights of the specimen pieces before and after immersion (each piece was ultrasonically rinsed in acetone to remove corrosion products).
Weight loss methods can be used to calculate the corrosion rate (CR) according to the following equation shown below [17]:
C R   mg / cm 2   y = 365   ·   W At
The weight loss (W) is expressed in mg, A is the area of the coupon (cm2), and t is the incubation time (y).

2.7. Scanning Electron Microscopy

Scanning electron microscopy (SEM) was used to study the surface morphology and microstructure of the steel coupons, as well as the corrosion characteristics before and after immersion in the fermented medium. A mini-SEM TM3000 (HITACHI, Paris, France) was used. It was equipped with an energy dispersive X-ray spectral detector EDS (SwiftED3000 HITACHI, France) which could be used to determine the chemical composition of the metal surface. To investigate the extent of corrosion attack on the surfaces of the galvanized steel coupon samples, a special treatment was performed. After immersion, each coupon was ultrasonically rinsed in acetone to remove the biofilm and corrosion products [18].

2.8. Electrochemical Techniques

Electrochemical measurements were used to study the corrosiveness of the medium during kombucha fermentation in the first part and to determine the inhibitory effect of the tea beverage in the second part. The potentiometric techniques, such as open circuit potential (OCP), also known as corrosion potential, and potentiodynamic measurements (Tafel slopes), were performed using an EC-Lab potentiostat. Experiments were performed using a three-electrode cell system with a Ag/AgCl reference electrode, a platinum electrode (Pt) as an auxiliary electrode, and galvanized steel as a working electrode. The electrolytes studied are test samples from the two kombucha solutions (K−GS) and (K+GS) taken at 0, 3, 7, 10, and 14 days of incubation. Polarization curves were plotted at a sampling rate of 10 mVs−1 from −1 V versus corrosion potential (OCP) to 1V versus corrosion potential (OCP). Electrochemical parameters (Ecorr, βa, βc, and Jcorr) were estimated by extrapolating the Tafel curves. Each electrochemical test was performed in duplicate to check the reproducibility of the data.

2.9. Liquid–Liquid Extraction

Tea infusion and fermented kombucha tea (after 14 days of fermentation) with and without immerged coupons (respectively K+GS and K−GS) were extracted sequentially with organic solvents of increasing polarity (ethyl acetate and butanol) using a liquid–liquid extraction method at room temperature [19]. All extractions were performed twice, using 300 mL of sample and 300 mL of solvent. The obtained extracts were evaporated using a rotary evaporator under vacuum at 35 °C to obtain dry extracts.

2.10. Determination of Total Phenol Content

The total phenol content (TPC) of the extracts was quantified using the Folin–Ciocalteu method described by Klawpiyapamornkun et al. [20], with some modifications. A total of 100 μL of Folin–Ciocalteu reagent (0.2 N) was mixed with 20 μL of each diluted sample (2 mg/mL). The resulting mixture was incubated at room temperature for 5 min, after which 80 μL of sodium carbonate solution (75 g/L) was added. A second incubation was performed at 25 °C for 15 min, followed by absorbance measurements at 765 nm. A standard calibration curve was prepared with different gallic acid concentrations (0 to 115 mg/L). Results were expressed as milligrams of gallic acid equivalents per gram of dry weight (mg GAE/g DW).

2.11. High-Performance Liquid Chromatography Analysis

The phenolic and aromatic compounds of the different dry extracts were identified using a Thermo Scientific Accela HPLC with a PAD detector. The separation was performed on a Phenomenex Luna Omega 3µm Polar C18 column with a size of 150 × 2.1 mm. The eluent, consisting of two phases A (acidified water, pH = 2.65) and B (acidified water/acetonitrile (ACN), 20:80 V/V), was introduced at a flow rate of 0.5 mL/min. For analysis, the extracts were dissolved in ACN at a concentration of 5 mg/mL and then filtered using a microfilter (0.2 µm). The identification of the individual compounds was carried out qualitatively by comparing their retention time with already-known standards.

2.12. Gas Chromatography–Mass Spectrometry Analysis

The volatile compounds of the different dry extracts were determined by gas chromatography–mass spectrometry (GC-MS) as described by Villarreal-Soto et al. [19]. The column used was an Rtx-502.2 capillary column (30 m × 0.25 mm, 1.4 µm film thickness) made of fused silica (diphenyl/dimethylpolysiloxane). Hydrogen with a constant flow of 1 mL/min served as carrier gas. The temperature of the detector and the injector was 220 °C. The chromatographic conditions were as follows: 60 °C for 1 min, then increased to 150 °C with a gradient of 10 °C/min, then held for 1 min. A second gradient was then applied at 12 °C/min to 260 °C to reach the isothermal condition at 260 °C for 10 min. The injector operated in a splitless injection mode. Identification of the compounds was performed before and after derivatization using Xcalibur software version 3.0.63 and the NIST MS library. Before derivatization, the extracts were dissolved in their respective solvents at a concentration of 5 mg/mL, except for the aqueous extract, which was dissolved in methanol. As for derivatization, the EtOAc extract was dissolved in EtOAc, the BuOH extract was dissolved in tetrahydrofuran, and the aqueous extract was dissolved in ACN at a concentration of 5 mg/mL. Then, 60 µL of N, O-bis (trimethylsilyl) trifluoroacetamide (BSTFA) was added in a 2 mL vial containing 340 µL of each extract.

2.13. Free Radical Scavenging Activity

The free radical scavenging activity was measured by the DPPH method as described by Villarreal-Soto et al. [19], with some modifications. In a 96-well microplate (Micro Well, Thermo Fisher Scientific, Illkirch, France), 20 µL of the diluted kombucha extracts (0.5 mg/mL) were added to 180 µL of 0.2 mM methanolic DPPH solution. The mixture was then incubated at 25 °C for 25 min. Absorbance was measured at 524 nm using a microplate reader (Thermo Scientific Multiskan GO Micropate Spectrophotometer, Vantaa, Finland). Ascorbic acid was used as a standard. The inhibition percentage of each sample was calculated using the following formula:
%   i n h i b i t i o n = ( A b l a n k A s a m p l e ) · 100   A b l a n k
where Ablank and Asample are the measured absorbance values without and with kombucha extract, respectively.
The results are expressed as the value of the half-maximal inhibitory concentration (IC50) calculated using the percentage inhibition.

2.14. Statistical Analysis

Data were expressed as means with standard deviations of triplicate measurements. Statistical significance was determined at a confidence level of p < 0.05 using the ANOVA test with Statistical Package for the Social Sciences (SPSS) version 22 (IBM, 2013, San Francisco, CA, USA). Principal component analysis (PCA) was conducted using OriginPro (version 2023b, learning edition).

3. Results and Discussion

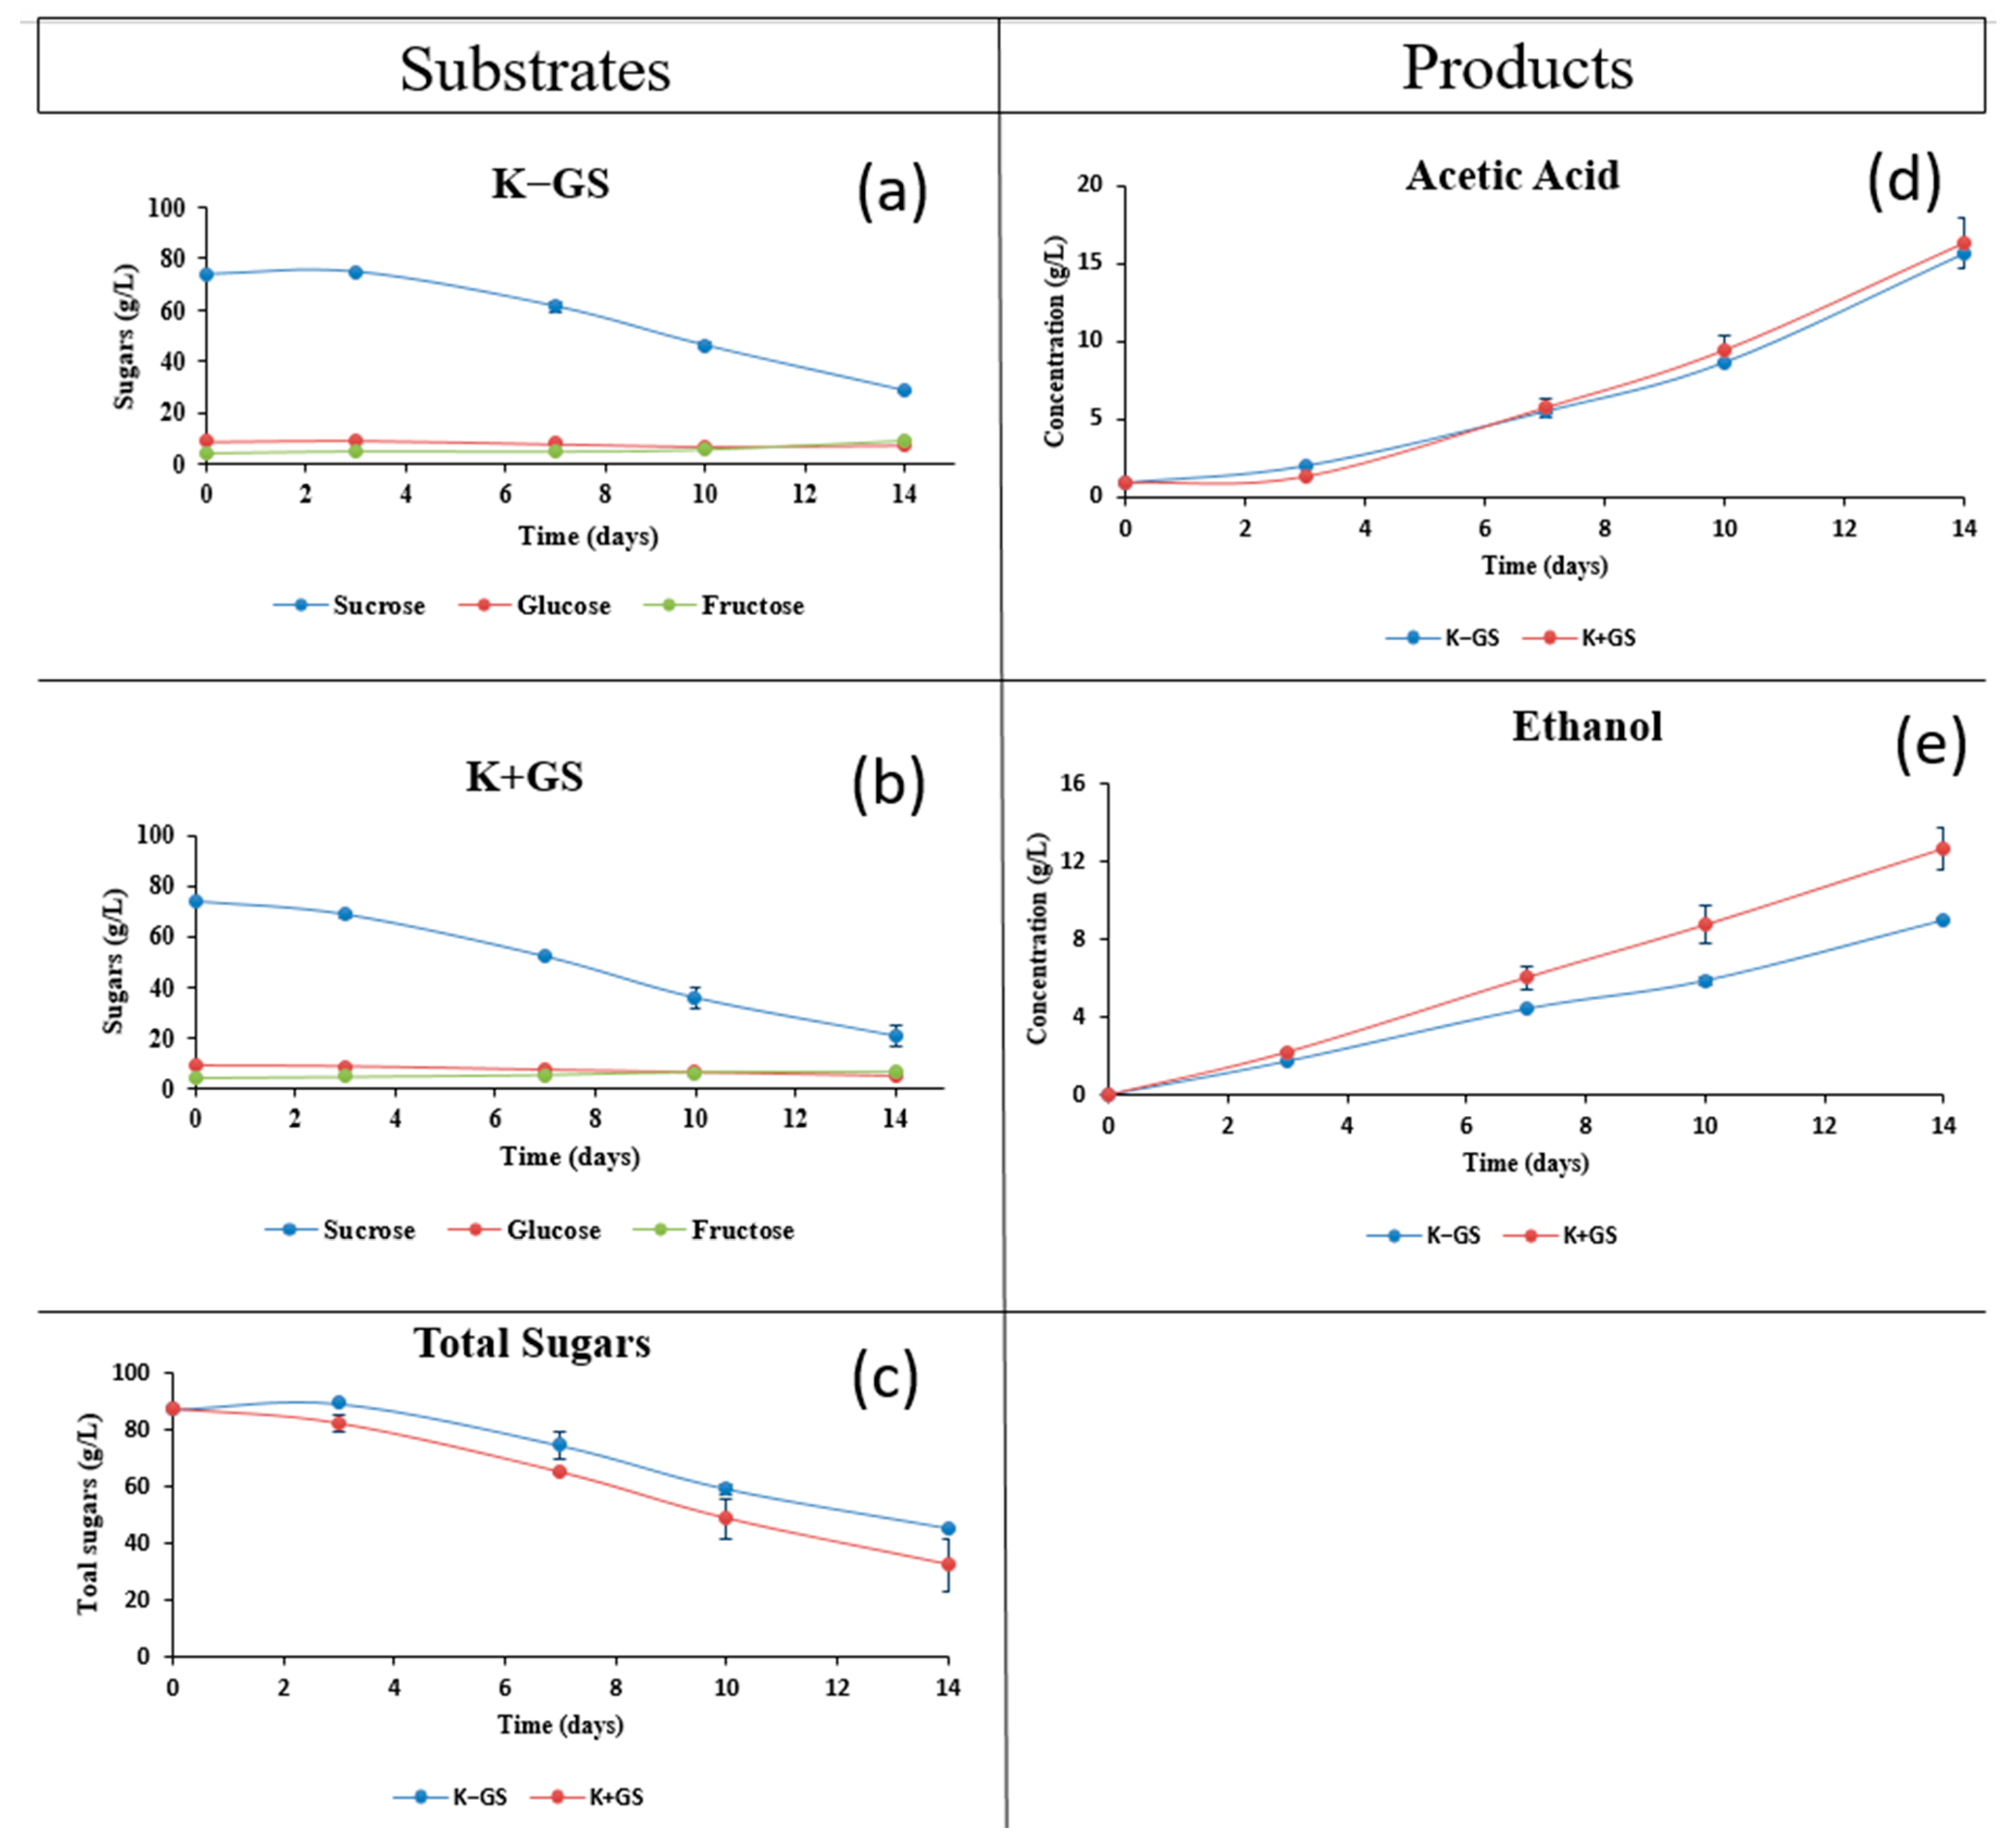
3.1. Impact of Galvanized Steel on the Kombucha Fermentation

Traditional fermentation of black tea kombucha was performed with galvanized steel coupons suspended therein, which is noted as a conventional practice. Kinetic studies, quantification of dissolved zinc and iron, and pH monitoring were performed to investigate the effects of the metal on various kombucha fermentation parameters. The kinetics of fermentation were assessed by HPLC-IR analysis. The results obtained (Figure 1) showed that the immersion of the galvanized steel coupons during fermentation had a significant effect on both sugar consumption and metabolite production. From the beginning of the process, sucrose (Figure 1a,b) was hydrolyzed into glucose and fructose by the yeasts [19,21], and its content gradually decreased in both vessels, but more sucrose was consumed in the presence of GS, resulting in a lower residual mass (20.7 g/L in K+GS compared to 28.7 g/L in K−GS) in the medium at the end of fermentation. Glucose and fructose were assimilated by the microorganisms for ethanol and organic acid production [22], which explains their low concentration. In addition, total sugars (Figure 1c) in the K−GS and K+GS vessels decreased to final values of 45.6 and 32.6 g/L, respectively. A similar sugar profile was observed by Villarreal-Soto et al. [15]. The initial quantity of sugar detected was a little higher due to the partial evaporation of water during preparation and the sugar intake in the 20 g/L of SCOBY. On the other hand, the production of ethanol (Figure 1e) was more important when GS was present (reaching 9 and 12.7 g/L in K−GS and K+GS, respectively). After 14 days of fermentation, the wet mass of the newly formed SCOBY differed between the two vessels, reaching 64.5 and 90.1 g in K−GS and K+GS, respectively. At this stage, we can already state that kombucha fermentation was enhanced by the presence of galvanized steel coupons, resulting in higher sucrose consumption, ethanol production, and microbial cellulose biofilm formation.
The amounts of dissolved iron and zinc were determined using the ICP-AES method. The results (Table 1) showed a significant difference between all samples. Indeed, kombucha tea beverages with and without galvanized steel had the highest content of selected minerals compared to acidified black tea (atea). Similar previous findings [23,24] confirm that kombucha can be a source of zinc and iron under the action of Acetobacter aceti bacteria. However, the highest zinc and iron concentrations (72.5 and 9 ppm, respectively) were measured in K+GS. These results are due to the enrichment of the solution in zinc and iron ions following the corrosion of the galvanized steel coupons. It is important to highlight a significant correlation between the content of these minerals and the improvement of fermentation kinetics. Scientific studies [25] have confirmed that microorganisms, especially Acetobacter tropicalis and Lactobacillus fermentum, use iron for their own metabolism as an additional nutrient. In yeast cells, iron promoted the growth of S. cerevisiae, leading to an increase in biomass concentration and alcohol production [26].
The pH values are shown in Table 2. The initial value of the black tea infusion was 6.3 and decreased to 3.8 (Atea) during the inoculation process. There is no significant difference between the two cultural media (K−GS and K+GS). A slight decrease in pH was observed during the fermentation process. The same pH profile was previously observed in other different studies [19,27,28], which can be explained by the production of organic acids, mainly acetic acid, gluconic acid, and glucuronic acid [20,29].

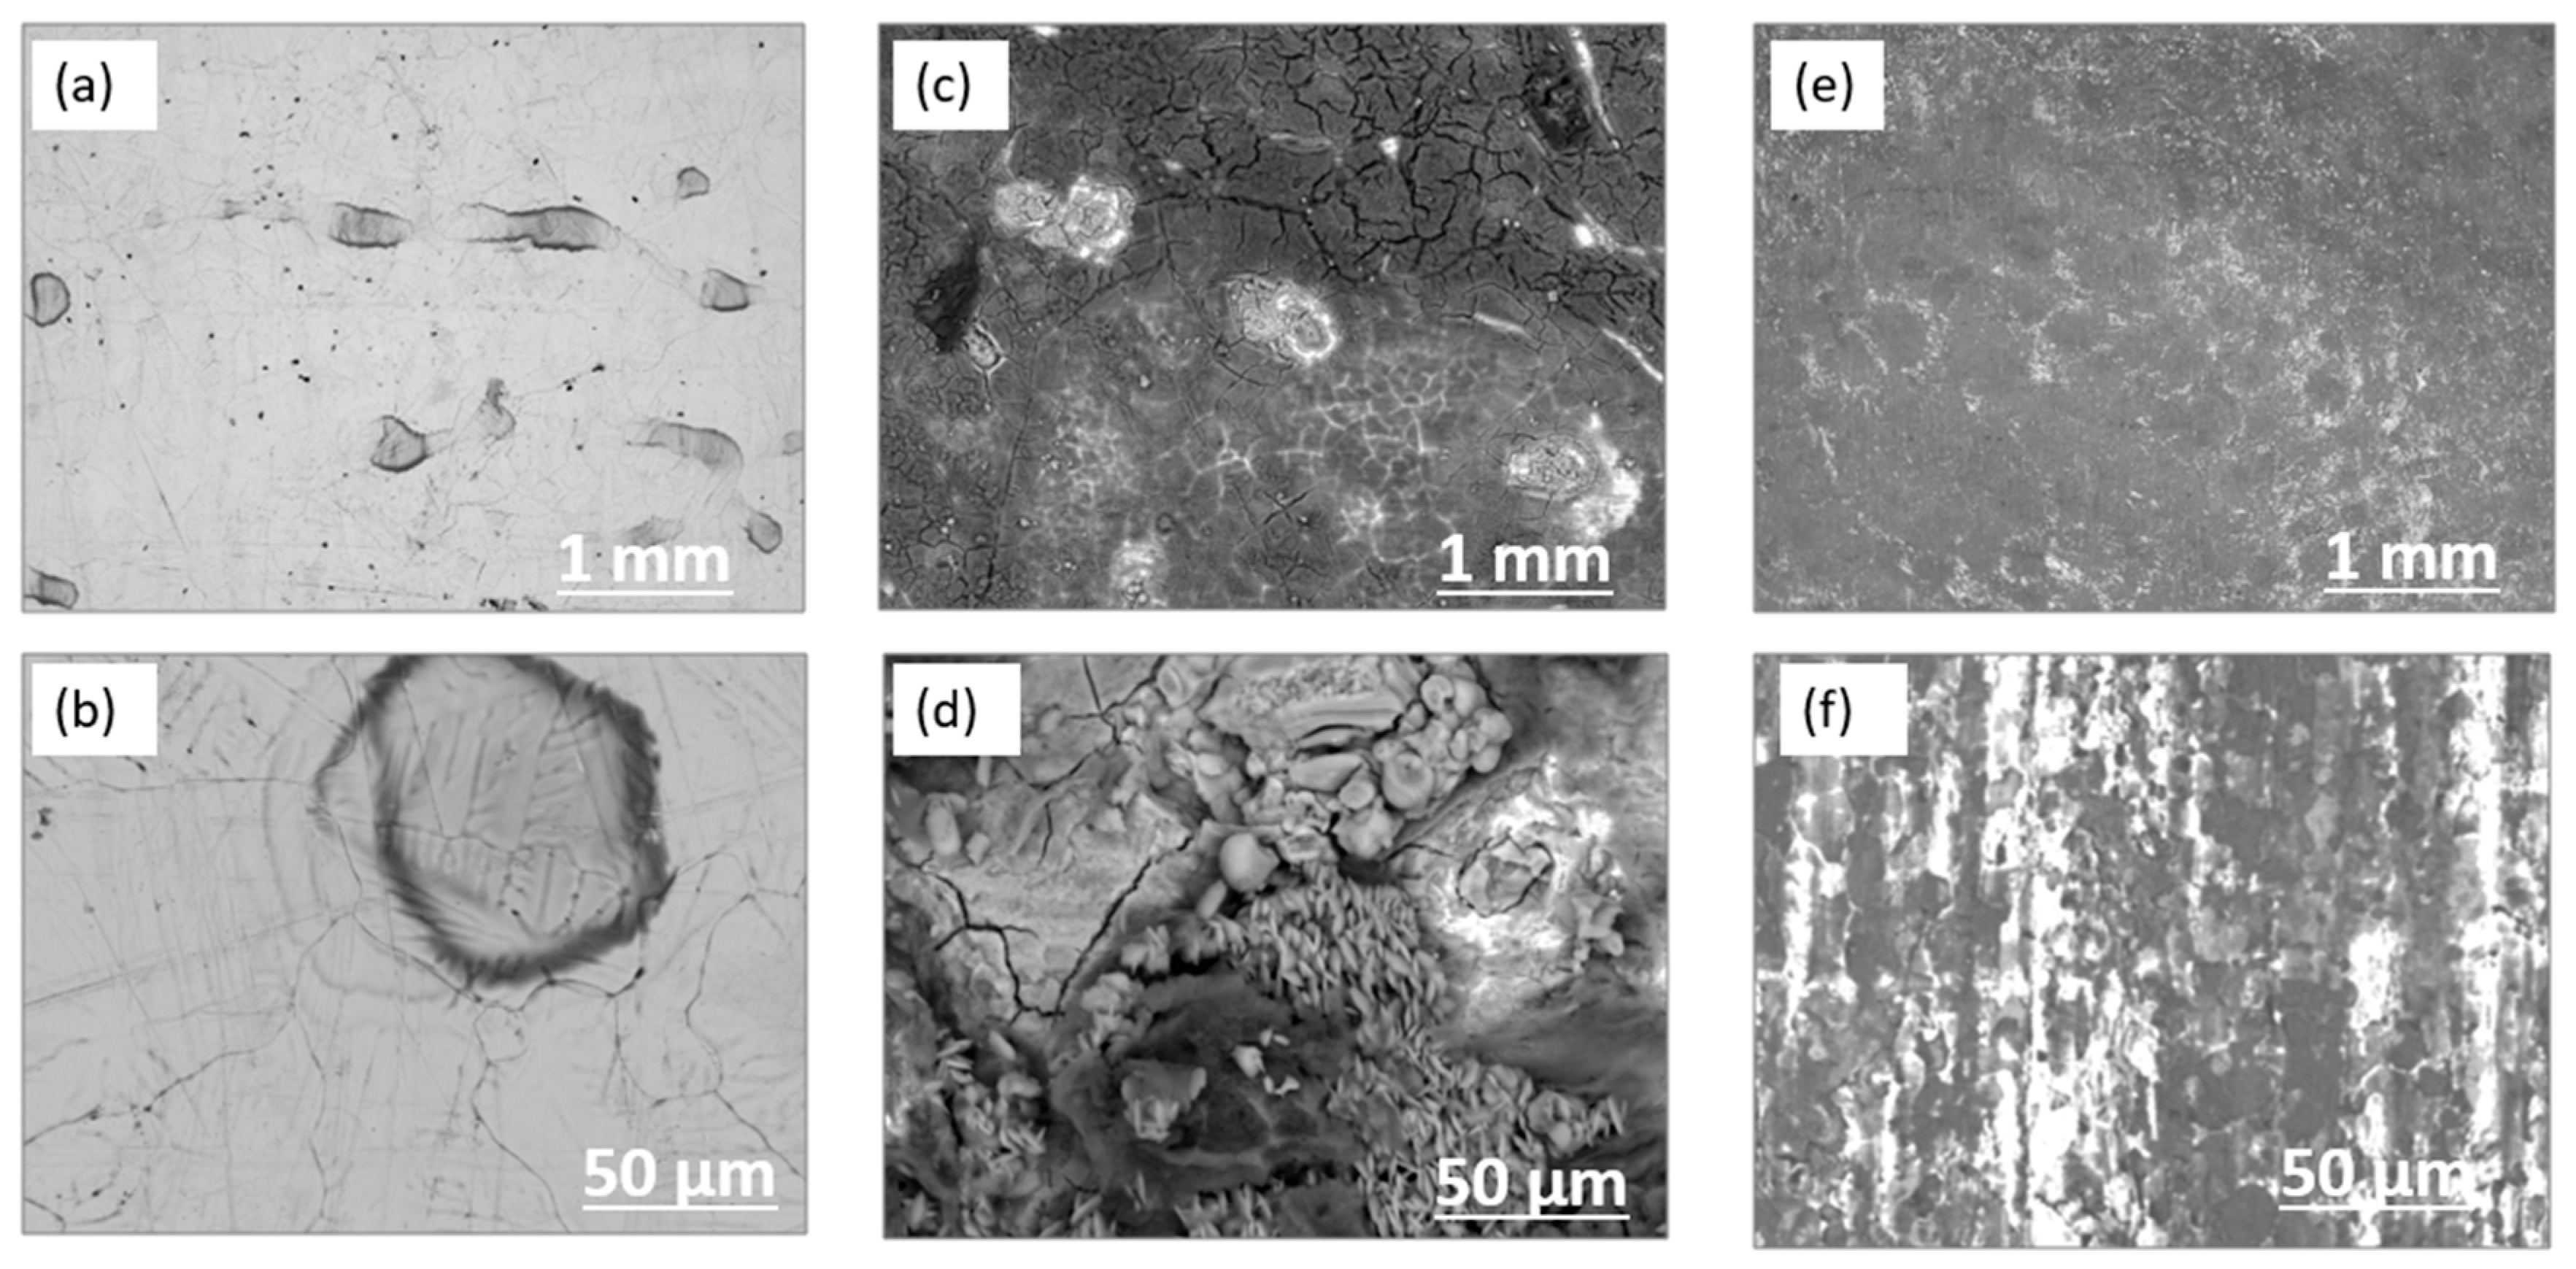
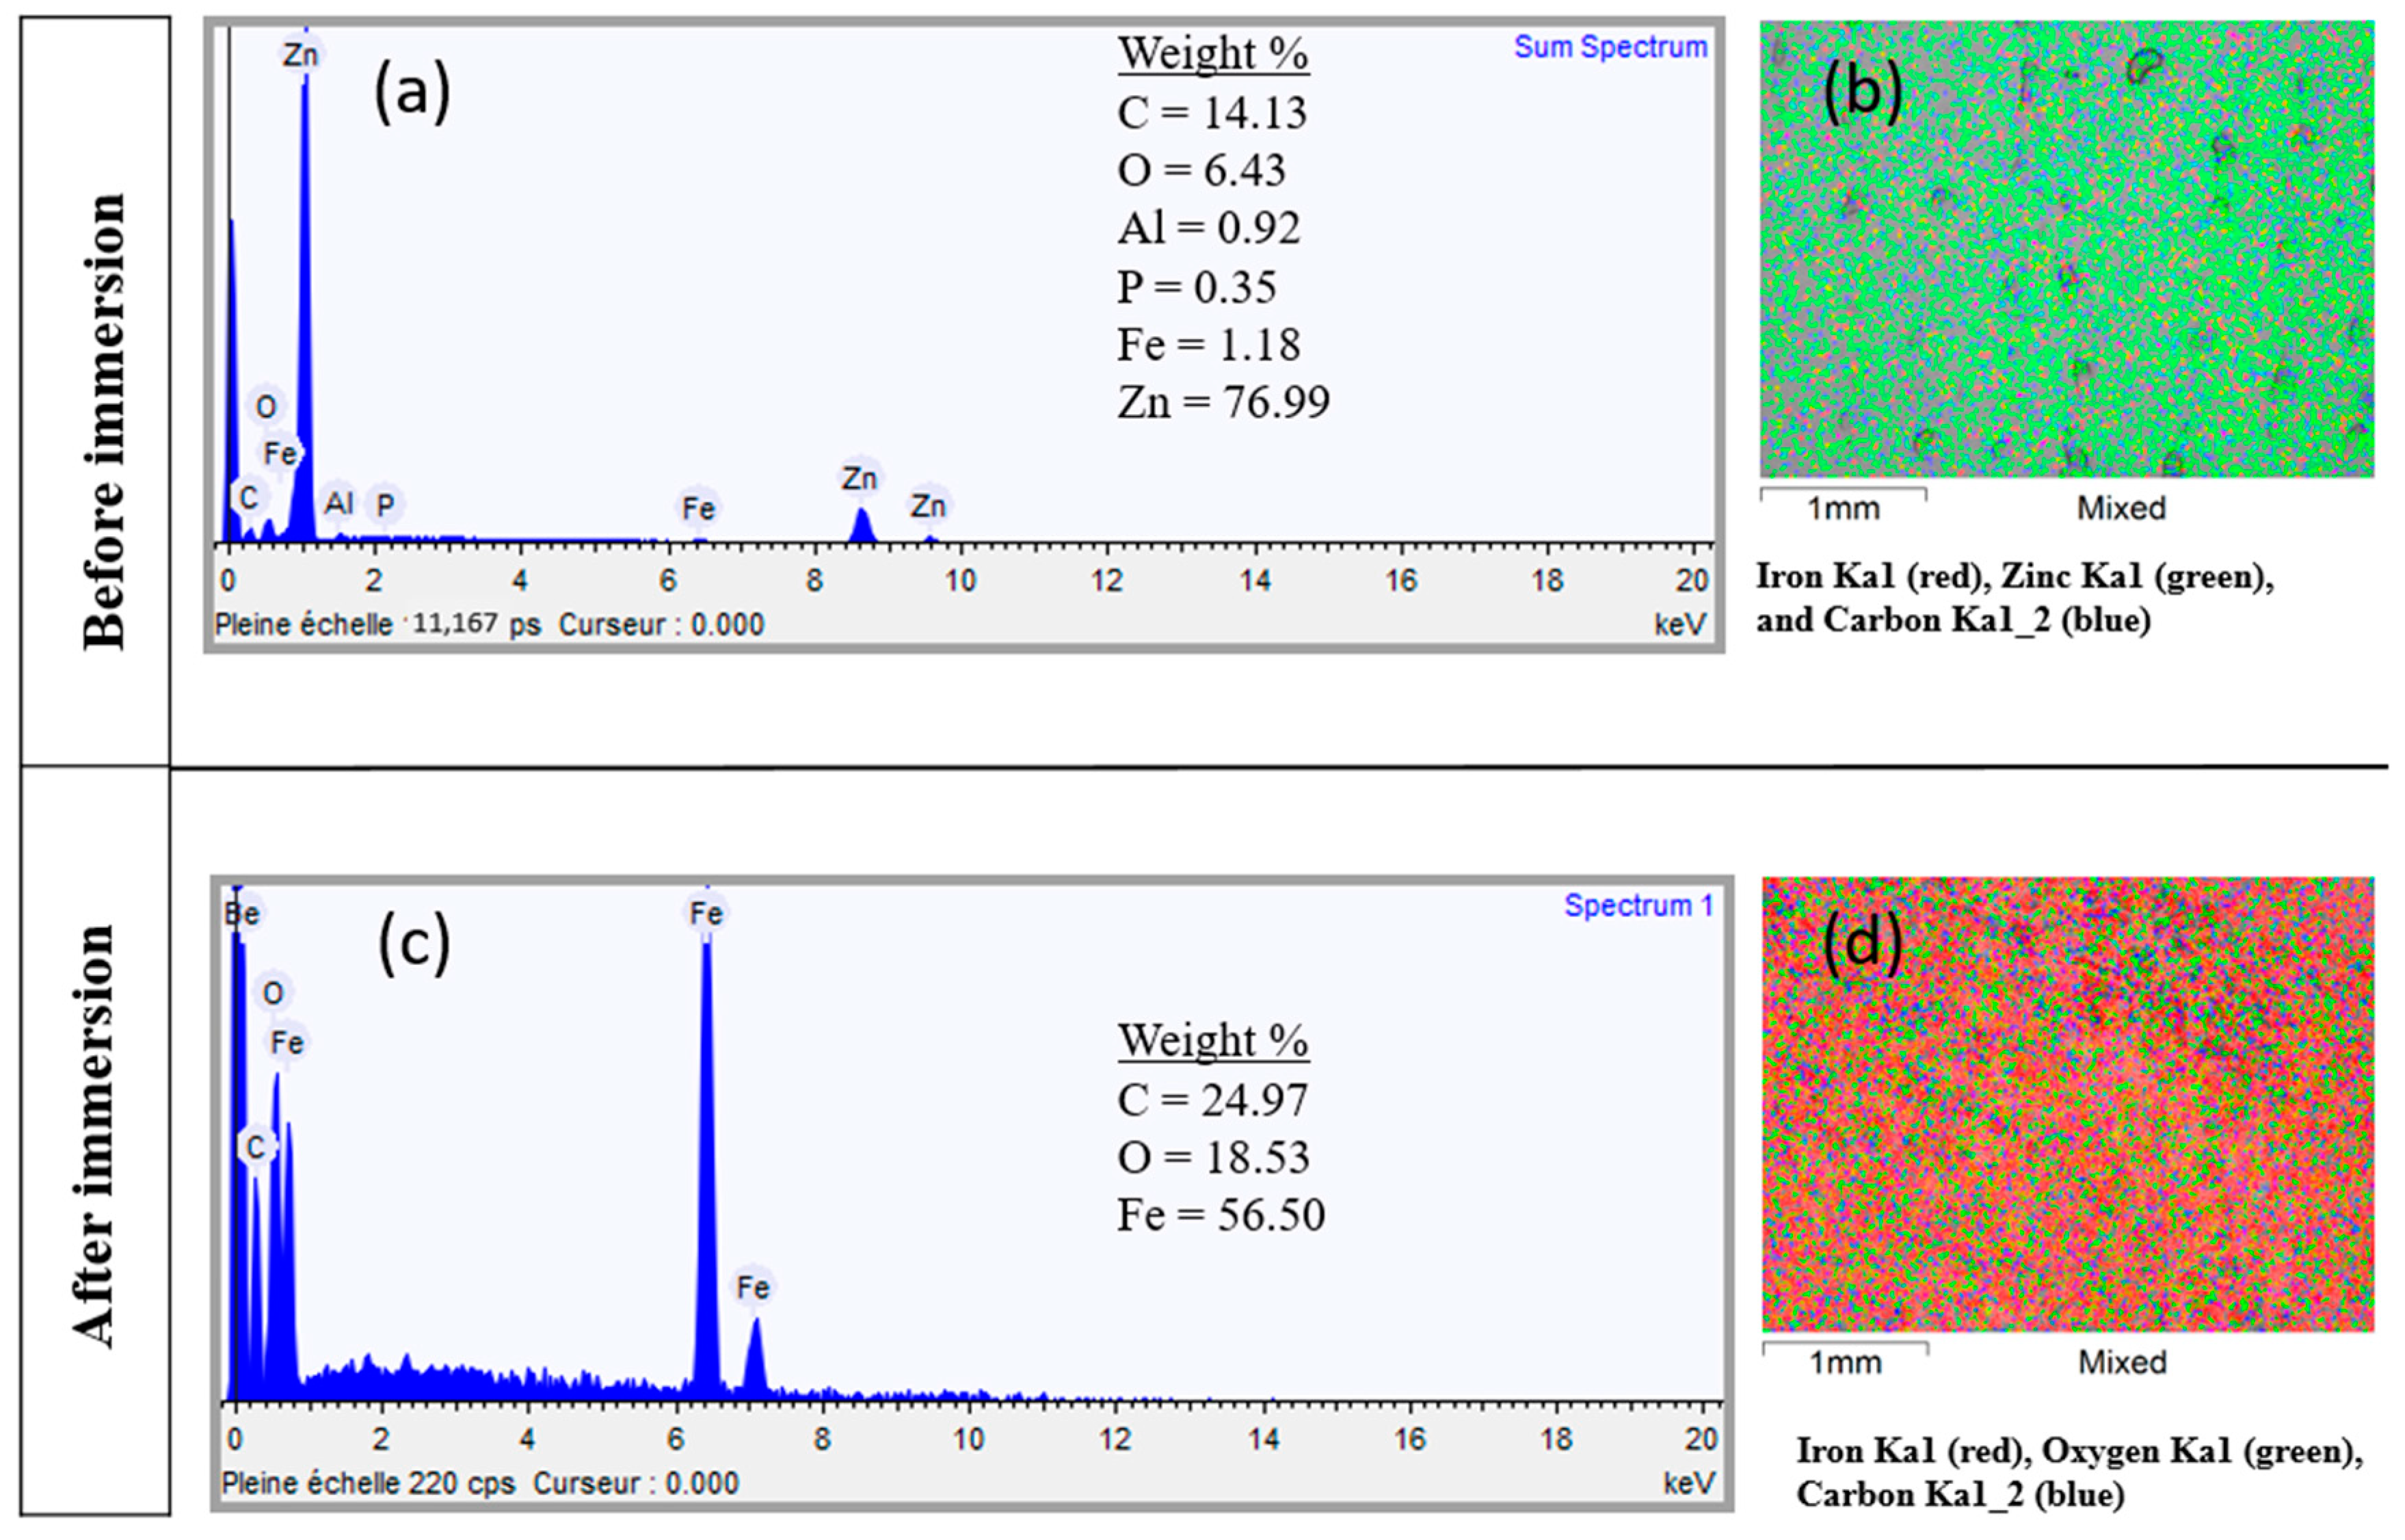
3.2. Metal Evolution and Mass Loss Measurement

Galvanized steel coupons were completely immersed in the medium throughout the kombucha fermentation. The surface color of each coupon changed from a shiny blue-gray to a drab light gray, yellow-gray, and orange-brown (Figure 2). The orange-brown coloration revealed damaged areas where iron rust, such as Fe(OH)3, had settled [30]. Steel corrosion occurred at the beginning of the fermentation process, although the metal coupons were covered with a zinc layer. This process can be accentuated by various factors. Mainly, cutting the galvanized steel plate on the sides can result in a configuration that resembles a “sandwich” (zinc/steel/zinc) and may generate galvanic corrosion. Besides, kombucha fermentation medium can also promote biological corrosion.
SEM was conducted to investigate the corrosion characteristics and surface morpho-logy of the galvanized steel coupons before and after the immersion test. Figure 3a,b shows a smooth surface for the control coupon (before immersion). After the 14-day incubation, significant pits and deposits with cracks can be seen on the surface of the galvanized steel (Figure 3c,d). This indicates the formation of corrosion products covering the entire surface of the metal. However, the corrosion product film was very heterogeneous, which promoted the diffusion of chemical substances and caused faster corrosion. To observe the extent of corrosion attack, the samples were cleaned to remove the biofilm and corrosion products. Figure 3e,f shows SEM images after surface cleaning. The result shows a wavy surface due to surface roughness, without deep pits, confirming the occurrence of a mainly uniform corrosion process.
The corresponding EDS analysis (Figure 4a,b) showed that the surface of the galvanized steel coupons exposed to SCOBY culture was mainly composed of Fe, C, and O, with no more the presence of Zn. This result indicates that the protective zinc layer has completely disappeared and iron oxides have formed. The element mapping, shown in Figure 4c,d, confirms these results and the homogeneous repartition of Zn on the GS surface before immersion and of Fe on the GS surface after immersion. For the weight loss measurements, the biofilm and corrosion products were removed from the metal surface. The cleaned coupons were weighed, and the gravimetric method was applied to calculate the corrosion rate of galvanized steel coupons removed from the incubation medium. The results showed an average corrosion rate of 130 ± 6 mg/cm2 y, which is higher compared to the abiotic test (with 67 and 92 mg/cm2 y in duplicate). These results were consistent with the EDS analyses (Figure S1 in the Supplementary Materials), which showed the persistence of the zinc coating on the metal surface from the abiotic test. Overall, the galvanized steel was less corroded than in the presence of microorganisms.

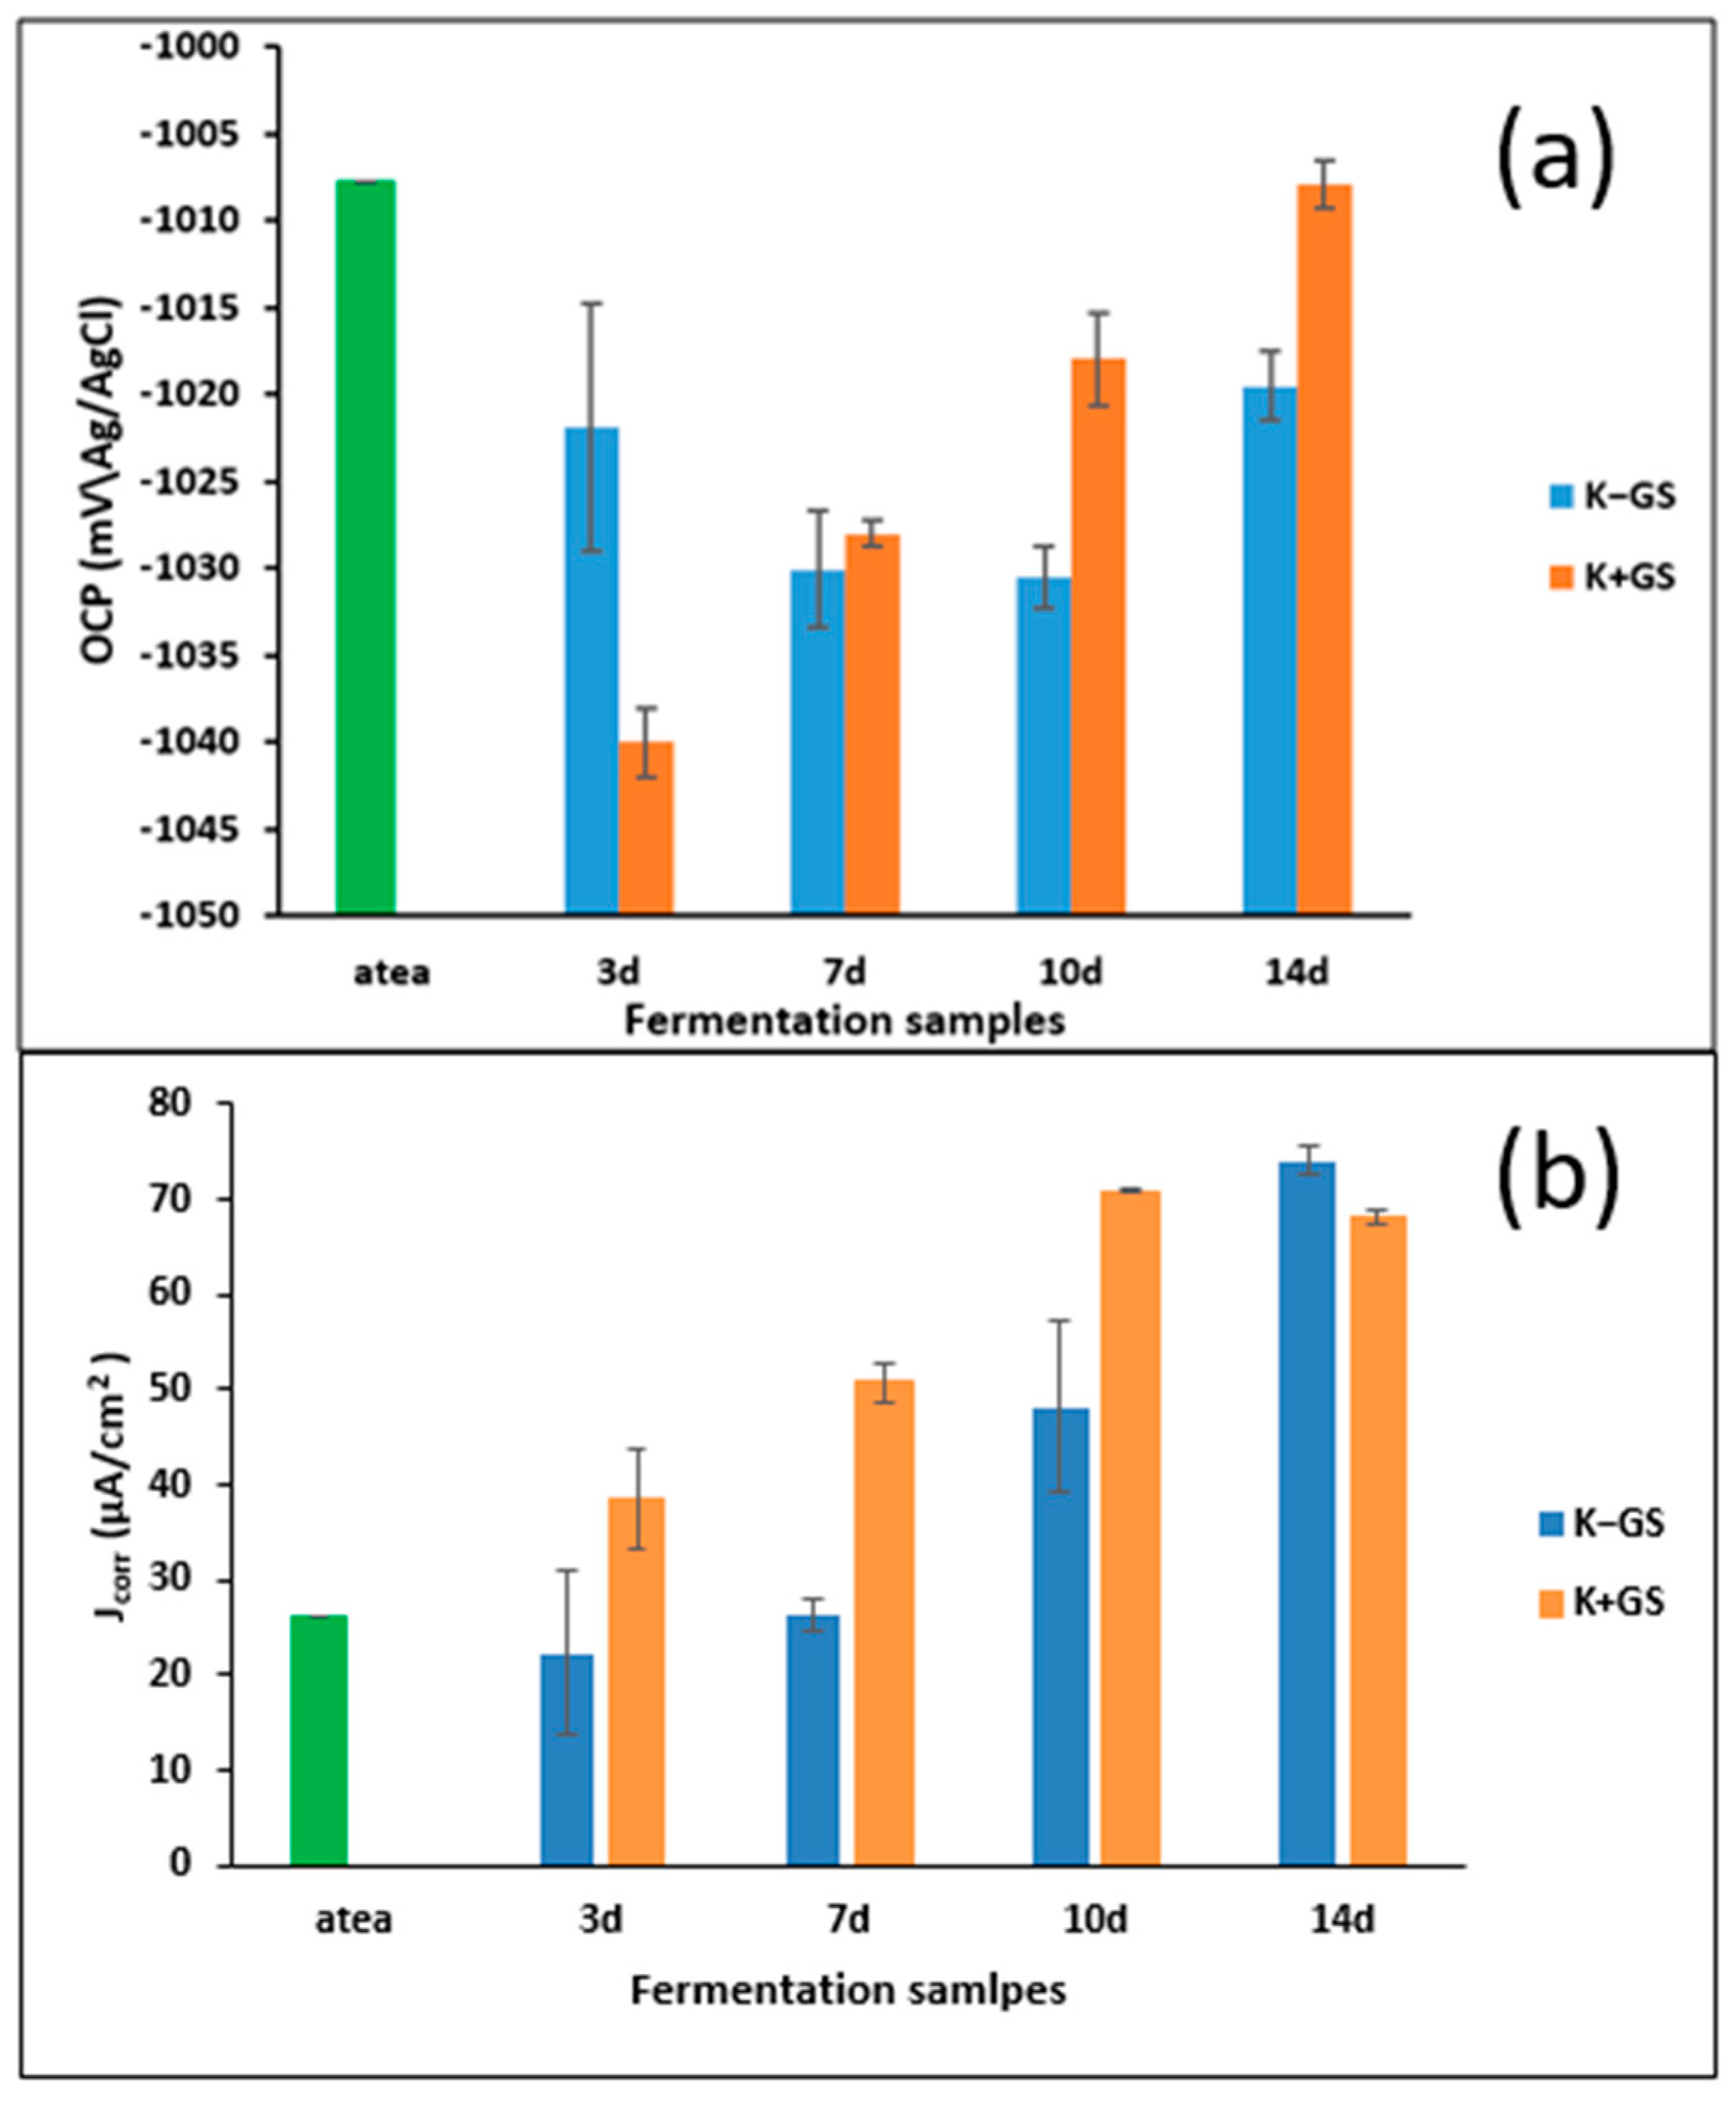
3.3. Assessing Environmental Corrosiveness during Kombucha Fermentation

Electrochemical measurements were employed to investigate the corrosive properties of the medium during kombucha fermentation and to assess the potential corrosion inhibitory effect of the tea beverage. All analyses were conducted using the aqueous electrolyte medium from the two kombucha at different stages of fermentation, namely (K−GS) and (K+GS) at 3, 7, 10, and 14 days of incubation; the acidified black tea (atea) was used to represent the initial stage. Figure S2 in the Supplementary Materials illustrates the open circuit potential (OCP) as a function of time for galvanized steel electrodes in all the media. The results reveal that the OCP curves in the different solutions at different times were characterized by a uniform decrease in potential until stability was reached (after 20 min). Significant differences were observed in the evolution of this stable free potential between the K−GS and K+GS media (Figure 5a). Globally, the OCP values found in the acidified black tea were the highest ones compared to other media; in K−GS, the OCP values decreased and reached a minimum (more negative) for the 7d and 10d fermentation times, and then increased. Immersion of the galvanized steel in kombucha tea beverage (K+GS) resulted in solutions that presented the lowest OCP values after 3 days, then shifted toward less negative values until the end of incubation, reaching the values of the initial acidified tea. As the OCP characterizes the interactions of the metal with the electrolytic medium, these observations can be linked to the evolution of the fermentation kinetic parameters (described in Part III.1) that showed an enhancement of the fermentation in the presence of GS. Moreover, it is interesting to note that pH is certainly not the only parameter governing the corrosion potential (a lower pH should have resulted in a higher OCP, not verified at the beginning of the fermentation, 3 d for K+GS and until 10 d for K−GS), but the other species present in the solution have a real impact.
To go further in the analysis of the corrosiveness of media, the OCP measurements were complemented by potentiodynamic polarization measurements; the obtained curves are presented in Figure S3 (Supplementary Materials). The software-fitted parameters retrieved from the Tafel plots are presented in Table S1 in Supplementary Materials and Figure 5b. For acidified black tea, the Ecorr value was initially −1057 mV/SCE. After 3 days of fermentation, it shifted to more negative values and was determined as −1063 mV/SCE and −1080 mV/SCE in the K−GS and K+GS, respectively, which is consistent with the OCP initial evolution. Then, the Ecorr evolution was the same as that of OCP for the K+GS media (increase with the fermentation time), but not for the K−GS media (increase for Ecorr and decrease until 10d, followed by an increase for OCP). The corrosion current density data in Figure 5b demonstrate significant differences between the K-GS and K+GS media. For K−GS, almost identical values of Jcorr (about 26 µA/cm2) were found in the solutions extracted from the first week of fermentation despite the diminution of pH from 3.8 to 3.2, then the current density increased, reaching a final value of 74 µA/cm2 for a pH of 2.6. The immersion of galvanized steel coupons (K+GS) led to significant changes in current density, which continuously increased from 26 µA/cm2 at the beginning to 68 µA/cm2 at the end of the fermentation. Practically, Jcorr increased threefold during the fermentation process compared to acidified black tea. From these results, it can be concluded that the fermentation media, in the presence or absence of galvanized coupons, enhanced the corrosion, certainly due to the acidic metabolites formed. However, we cannot conclude on the formation or not of corrosion inhibitors; the behavior during the first week (unexpected evolution of OCP values that decrease for a lower pH and stability of Jorr) suggests that there are several competing phenomena (corrosion or inhibition).

3.4. Principal Component Analysis

Principal component analysis (PCA) was performed to explore the correlations among sugar consumption, metabolite production, and corrosion current density in unfermented (atea) and fermented black tea without (K−GS) and with (K+GS) galvanized steel coupons over a 14-day incubation period. The PCA loading plot (Figure S4a in Supplementary Materials) visually represents the relationships between sucrose, glucose, fructose, acetic acid, ethanol, pH, corrosion potential Ecorr, corrosion current density Jcorr, and the principal components extracted from the data. The first two principal components, PC1 and PC2, explained 88.84 percent of the total variance, accounting for 76.54% and 12.30% of variability, respectively. Based on the PCA biplot results (Figure 6) and Table S2 (Supplementary Materials), both positive and negative correlations were observed. Fructose, acetic acid, ethanol, and Jcorr were associated with positive PC1 values and made significant contributions to the variance explained by this axis, with loadings of 0.331, 0.397, 0.393, and 0.377, respectively. Sample K+GS_10d (after 10 days of fermentation in the presence of galvanized steel) exhibited higher ethanol and acetic acid content, indicating a strong positive correlation, as did K−GS_14d, which had a higher fructose content. In contrast, the sample after 3 days of fermentation, K−GS_3d, displayed negative PC1 components and showed higher pH, sucrose, and glucose contents. These findings highlighted significant correlations between the studied variables. Specifically, sugar consumption was positively correlated with metabolite production (acetic acid and ethanol), suggesting that higher sugar consumption leads to increased production of metabolites, which are also influenced by the presence of galvanized steel during the fermentation process. Based on the correlation matrix in Table 3, acetic acid exhibited a positive correlation with fructose, ethanol, and Jcorr (0.840, 0.974, and 0.866, respectively) and a negative correlation with sucrose (−0.972), indicating that sucrose was assimilated by the microorganisms for the production of ethanol and organic acid, leading to metal corrosion (more important Jcorr). In addition, pH showed a negative correlation with acetic acid (−0.922), which are inversely proportional to each other.

3.5. Chemical Composition and Bioactivity of Kombucha Extracts

3.5.1. Extraction Yields and Total Polyphenol Content

Unfermented and fermented tea (Kombucha) were extracted sequentially with organic solvents of increasing polarity (ethyl acetate and butanol) using a liquid–liquid extraction method. The extraction yield results are shown in Figure 7a. The obtained extraction yields ranged from 1.9 to 55.6 g/L. The aqueous phases showed higher yields for the three different samples, while the ethyl acetate extracts presented the lowest values. In general, the extraction yield depends on the polarity of the solvent, and the most important value is reported for the aqueous extract, which has the highest polarity compared to butanol and ethyl acetate. A maximum value of 55.6 g/L is attributed to the H2O-black tea extract, followed by the H2O-K−GS extract (42.3 g/L), and finally the H2O-K+GS extract (25.7 g/L). These results indicate that the remaining aqueous phases are rich in sugar compounds, and the different values obtained are in agreement with the previously observed result of the total sugar profile. These extraction yields are higher than those determined by Villarreal-Soto et al. [15].
The different polarities of the extract solvents may affect the chemical composition of the extract. The total phenolic content (TPC) ranged from 8.9 to 272.7 mg GAE/g DW for all samples (Figure 7b). There was a significant difference in TPC between the solvents used. The highest amount of TPC was extracted with ethyl acetate, followed by butanol. The results showed that kombucha tea (K−GS) had a significant relative TPC (227.7 mg GAE/g DW for EtOAc extract), which was 1.8 times higher than that of black tea (129.9 mg GAE/g DW for EtOAc extract). Similar results were previously found by La Torre et al. [31]: TPC in kombucha tea was 1.7 times higher than black tea. In addition, Chakravorty et al. [32] showed that TPC increased by 54% in fermented tea compared to black tea. On the other hand, the values attained in K+GS extracts are higher than those in K−GS extracts. This difference could be explained by the activities of yeasts and bacteria, which leads to the biotransformation of primary metabolites into polyphenols.

3.5.2. Identification of Phenolic Compounds

The HPLC-DAD analyses were used to identify the major phenolic compounds in the various tea extracts. Individual compounds were identified by comparing the retention time and λmax of each peak with those of known standards injected under the same conditions. A total of 11 compounds were identified and are listed in Table 4. Gallic acid, ellagic acid, and 4′,5′-dimethoxy-2′-hydroxy-4-methylchalcone were detected in both fermented (K−GS, K+GS) and unfermented black tea, as shown in the earlier studies [33,34]. Caffeic acid and gallocyanin were detected only in black tea.
A significant difference is observed in phenolic constituents between K−GS and K+GS. However, three compounds are suspected to be metabolites only produced in kombucha with galvanized steel (K+GS), such as trihydroxyethylrutin, methyl 3,5-dihydroxybenzoate, and ethyl 4-hydroxy-3-cinamate. It is important to highlight that these compounds were identified for the first time in kombucha black tea. On the other hand, the presence of galvanized steel inhibits the production of 3-amino-4-hydroxybenzoic acid and ethyl trans-2-hydroxycinnamate, which are detected only in K−GS.

3.5.3. Gas Chromatography–Mass Spectrometry Analysis before and after Derivatization

The volatile compounds detected in unfermented and fermented (K−GS, K+GS) black tea are summarized in Table 5 and Table 6. Analyses with GC-MS allowed the identification of 53 compounds before and after derivatization, including several polyphenols, organic acids, sugars, ketones, esters, and alcohols. About 26% of the compounds were found in all samples (ethyl 2-methylbutanoate, o-xylene, 3-methyl-4-heptanone, butyl isobutanoate, butyl butanoate, undecane, dihydroisophorone, 2,4-ditert-butylphenol, methyl hexadecanoate, caffeine, lactic acid, glycerol, gallic acid, and palmitic acid). The largest surface proportions of these compounds were abundant in K+GS. Notably, such compounds were produced 2-fold higher in K+GS compared to K−GS, including 3-methyl-4-heptanone, butyl isobutanoate, and butyl butanoate. Lactic acid and gallic acid also showed higher surface areas (64.67 × 10⁸ and 242.83 × 10⁸ in EtOAc extracts, respectively) in the presence of GS compared to classical fermentation (43.74 × 10⁸ and 189.32 × 10⁸, respectively). The remarkable difference between the two kombucha samples is consistent with the improvement in fermentation kinetics in the presence of galvanized steel. A total of 15 compounds were identified only in K+GS (including 2-furanmethanol, methoxyacetonitrile, 2,2-dimethylbutanoic acid, hexanal, 2-ethyl-, 2,3-butanediol,diacetate, 5-methylfurfuryl alcohol, octadecanoic acid,3-hydroxy-, methyl ester, 1,3-diacetin, 3-Hydroxy-2,3-dihydromaltol, leucinic acid, dihydroxyacetone, 1-monoacetin, gluconic acid lactone, 2,3,4,5,6-pentahydroxyhexanal, and catechin). All of these compounds were identified for the first time (Figure 8), except for 2-furanmethanol, dihydroxyacetone, and catechin. According to the literature, 2-furanmethanol was previously detected in black tea [35]. In addition, dihydroxyacetone was identified in fermented black tea as a metabolite of acetic acid bacteria using sugar alcohols such as glycerol [36,37]. Other studies reported the presence of catechin as a constituent of black tea [21] and kombucha products [36]. The most abundant volatile compounds were detected in the ethyl acetate extracts, which had the highest total phenolic contents.

3.5.4. Antioxidant Activity

Antioxidant activity is a predictive index for evaluating the performance of plant extracts as corrosion inhibitors. It was determined using the DPPH assay. The results are expressed as the percentage of inhibitory activity (Figure 9) and as the value of the half-maximal inhibitory concentration IC50 (Table 7). There is a significant difference between unfermented and fermented black tea, and the highest percentage inhibitory activity is attributed to the nonpolar extracts. For the K+GS, a higher percentage of inhibition against the DPPH radical was attributed to the ethyl acetate extract (IC50 = 8.6 µg/mL), followed by the butanol extract (IC50 = 14.3 µg/mL). The half-maximal inhibitory concentrations achieved are lower than those in K−GS (IC50 = 10.1 and 21.7 µg/mL, in ethyl acetate and butanol extracts, respectively). Iron and zinc are probably involved in free radical formation. Zinc may have significant antioxidant activity by preventing lipid peroxidation and improving reactive oxygen species [38,39]. In addition, iron can also affect the antioxidant activity of polyphenols. Ferrous iron can lead to the formation of highly reactive oxygen species in the presence of hydrogen peroxide [40]. The most important antioxidant activity in K+GS could be due to the product of phenolic compounds, such as trihydroxyethylrutin and methyl 3,5-dihydroxybenzoate. According to Wenisch and Biffignandi [41], trihydroxyethylrutin reduced the oxidative products with its scavenging activities. Also, a previous study by Panawan Suttiarpor et al. [42] proved the highest antioxidant capacity of methyl 3,5-dihydroxybenzoate.

4. Conclusions

The present study investigates the impact of introducing galvanized steel coupons in fermentation medium, in this case, kombucha fermentation. It shows highly interactive effects between microorganisms, metal, and the fermented medium, involving several electrochemical reactions. The kinetic analysis of the fermentation process has shown that the immersion of the galvanized steel coupons in the study medium (K+GS) had a significant accelerating effect on sugar consumption, metabolite production, and SCOBY formation. This improvement is accompanied by an increase in antioxidant capacity, as shown by the higher percentage of inhibition over the DPPH radical attributed to the ethyl acetate extract from K+GS (IC50 = 8.6 µg/mL). This could be a way to improve kombucha fermentation and final characteristics. The work did not clearly show that corrosion inhibitors can be formed during the Kombucha fermentation and in a better way when galvanized steel is present. However, the electrochemical study at different stages of the fermentation has revealed that the corrosive activities of the medium evolved in different ways, both in the presence and the absence of steel during fermentation. This observation could be due to potential inhibition effects counterbalanced by the production of other metabolites, especially the organic acids, which can accelerate zinc dissolution by decrea-sing pH. Future work will focus on an in-depth investigation of corrosion inhibitors in ethyl acetate extracts by manipulating different electrolytic environments with different amounts of extract.

Supplementary Materials

The following supporting information can be downloaded at: https://www.mdpi.com/article/10.3390/fermentation10030159/s1, Figure S1: SEM images of galvanized steel coupons (a)–(b) after 14-days of immersion test in abiotic medium and (c)–(d) after removing corrosion products. EDS analysis (e) after removing corrosion products; Figure S2: Open circuit potential (OCP) vs. time curves of galvanized steel coupon immersed in various solutions (K−GS) Kombucha without and (K+GS) with galvanized steel coupon at 3, 7, 10 and 14 days of fermentation. The acidified black tea (atea) was used to represent the initial stage; Figure S3: Potentiodynamic polarization curves of galvanized steel coupon immersed in various solutions (K−GS) Kombucha without and (K+GS) with galvanized steel coupon at 0, 3, 7, 10, and 14 days incubation. The acidified black tea (atea) was used to represent the initial stage; Figure S4: Principal components analysis “loading plot (a)”, and “scores plot (b)” of the acidified black tea (atea) and kombucha fermented samples without (K−GS) and with Galvanized steel coupons about the physicochemical (Jcorr: corrosion current density, Ecorr: corrosion potential) parameters based on the fermentation time (3d, 7d, 10d, and 14d); Table S1: Electrochemical parameters determined from potentiodynamic polarization data of galvanized steel curves in various solutions (K−GS) Kombucha without and (K+GS) with galvanized steel coupon at 3, 7, 10 and 14 days incubation. The acidified black tea (atea) was used to represent the initial stage; Table S2: Extracted eigenvectors: correlations between variables and factors (Jcorr: corrosion current density, Ecorr: corrosion potential).

Author Contributions

Conceptualization, N.M., P.T., J.B., R.B., M.R. and N.E.; methodology, N.M., P.T., J.B., R.B., M.R. and N.E.; writing—original draft preparation, N.M., P.T., J.B., R.B., M.R. and N.E.; writing—review and editing, N.M., P.T., J.B., R.B., M.R. and N.E.; Fermentation part, N.M. and P.T.; Electrochemical part, N.M., R.B. and N.E.; analytical part, N.M., J.B. and M.R. All authors have read and agreed to the published version of the manuscript.

Funding

This research received no external funding.

Institutional Review Board Statement

Not applicable.

Informed Consent Statement

Not applicable.

Data Availability Statement

The data presented in this study are available within the article and the Supplementary Materials.

Acknowledgments

We thank Erasmus+ and the Ministry of Higher Education and Scientific Research of Tunisia for supporting the missions of Najet Mouguech.

Conflicts of Interest

The authors declare no conflicts of interest.

References

  1. Salgar-Chaparro, S.J.; Darwin, A.; Kaksonen, A.H.; Machuca, L.L. Carbon Steel Corrosion by Bacteria from Failed Seal Rings at an Offshore Facility. Sci. Rep. 2020, 10, 12287. [Google Scholar] [CrossRef]
  2. Etteyeb, N.; Nóvoa, X.R. Inhibition Effect of Some Trees Cultivated in Arid Regions against the Corrosion of Steel Reinforcement in Alkaline Chloride Solution. Corros. Sci. 2016, 112, 471–482. [Google Scholar] [CrossRef]
  3. Kaziullayeva, A.; Olaifa, K.; Marsili, E. Fermented Whey as Natural Descaling Agent: Electrochemical and Microscopical Analysis. Arab. J. Chem. 2021, 14, 103065. [Google Scholar] [CrossRef]
  4. Ram, C.; Zaman, B.; Dhir, A. Study on Corrosion Investigations in Industrial Effluents: A Review. Corros. Rev. 2019, 37, 115–130. [Google Scholar] [CrossRef]
  5. Popoola, L.; Grema, A.; Latinwo, G.; Gutti, B.; Balogun, A. Corrosion Problems during Oil and Gas Production and Its Mitigation. Int. J. Ind. Chem. 2013, 4, 35. [Google Scholar] [CrossRef]
  6. Little, B.J.; Blackwood, D.J.; Hinks, J.; Lauro, F.M.; Marsili, E.; Okamoto, A.; Rice, S.A.; Wade, S.A.; Flemming, H.C. Microbially Influenced Corrosion—Any Progress? Corros. Sci. 2020, 170, 108641. [Google Scholar] [CrossRef]
  7. Stipanicev, M.; Turcu, F.; Esnault, L.; Rosas, O.; Basseguy, R.; Sztyler, M.; Beech, I.B. Corrosion of Carbon Steel by Bacteria from North Sea Offshore Seawater Injection Systems: Laboratory Investigation. Bioelectrochemistry 2014, 97, 76–88. [Google Scholar] [CrossRef]
  8. Kokilaramani, S.; Al-Ansari, M.M.; Rajasekar, A.; Al-Khattaf, F.S.; Hussain, A.M.R.; Govarthanan, M. Microbial Influenced Corrosion of Processing Industry by Re-Circulating Waste Water and Its Control Measures—A Review. Chemosphere 2021, 265, 129075. [Google Scholar] [CrossRef]
  9. Liengen, T.; Basseguy, R.; Damien, Feron; Beech, I. Electroactive Biofilms. In Understanding Biocorrosion: Fundamentals and Applications; Elsevier: Amsterdam, The Netherlands, 2014; pp. 107–143. ISBN 9781782421207. [Google Scholar]
  10. Skovhus, T.L.; Lee, J.S.; Little, B.J. Predominant MIC Mechanisms in the Oil and Gas Industry. In Microbiologically Influenced Corrosion in the Upstream Oil and Gas Industry; CRC Press: Boca Raton, FL, USA, 2017; pp. 75–85. ISBN 1315157810. [Google Scholar]
  11. Magni, M.; Postiglione, E.; Marzorati, S.; Verotta, L.; Trasatti, S.P. Green Corrosion Inhibitors from Agri-Food Wastes: The Case of Punica Granatum Extract and Its Constituent Ellagic Acid. A Validation Study. Processes 2020, 8, 272. [Google Scholar] [CrossRef]
  12. Miralrio, A.; Vázquez, A.E. Plant Extracts as Green Corrosion Inhibitors for Different Metal Surfaces and Corrosive Media: A Review. Processes 2020, 8, 942. [Google Scholar] [CrossRef]
  13. Wei, H.; Heidarshenas, B.; Zhou, L.; Hussain, G.; Li, Q.; Ostrikov, K. Green Inhibitors for Steel Corrosion in Acidic Environment: State of Art. Mater. Today Sustain. 2020, 10, 100044. [Google Scholar] [CrossRef]
  14. Alao, A.O.; Popoola, A.P.; Dada, M.O.; Sanni, O. Utilization of Green Inhibitors as a Sustainable Corrosion Control Method for Steel in Petrochemical Industries: A Review. Front. Energy Res. 2023, 10, 1063315. [Google Scholar] [CrossRef]
  15. Villarreal-Soto, S.A.; Bouajila, J.; Pace, M.; Leech, J.; Cotter, P.D.; Souchard, J.P.; Taillandier, P.; Beaufort, S. Metabolome-Microbiome Signatures in the Fermented Beverage, Kombucha. Int. J. Food Microbiol. 2020, 333, 108778. [Google Scholar] [CrossRef] [PubMed]
  16. Rahmani, R.; Beaufort, S.; Villarreal-Soto, S.A.; Taillandier, P.; Bouajila, J.; Debouba, M. Kombucha Fermentation of African Mustard (Brassica Tournefortii) Leaves: Chemical Composition and Bioactivity. Food Biosci. 2019, 30, 100414. [Google Scholar] [CrossRef]
  17. Javed, M.A.; Stoddart, P.R.; Wade, S.A. Corrosion of Carbon Steel by Sulphate Reducing Bacteria: Initial Attachment and the Role of Ferrous Ions. Corros. Sci. 2015, 93, 48–57. [Google Scholar] [CrossRef]
  18. Ogawa, A.; Takakura, K.; Hirai, N.; Kanematsu, H.; Kuroda, D.; Kougo, T.; Sano, K.; Terada, S. Biofilm Formation Plays a Crucial Rule in the Initial Step of Carbon Steel Corrosion in Air and Water Environments. Materials 2020, 13, 923. [Google Scholar] [CrossRef] [PubMed]
  19. Villarreal-Soto, S.A.; Beaufort, S.; Bouajila, J.; Souchard, J.; Renard, T.; Rollan, S.; Taillandier, P. Impact of Fermentation Conditions on the Production of Bioactive Compounds with Anticancer, Anti-Inflammatory and Antioxidant Properties in Kombucha Tea Extracts. Process Biochem. 2019, 83, 44–54. [Google Scholar] [CrossRef]
  20. Klawpiyapamornkun, T.; Uttarotai, T.; Wangkarn, S.; Sirisa-ard, P.; Kiatkarun, S.; Tragoolpua, Y.; Bovonsombut, S. Enhancing the Chemical Composition of Kombucha Fermentation by Adding Indian Gooseberry as a Substrate. Fermentation 2023, 9, 291. [Google Scholar] [CrossRef]
  21. Coelho, R.M.D.; de Almeida, A.L.; do Amaral, R.Q.G.; da Mota, R.N.; de Sousa, P.H.M. Kombucha: Review. Int. J. Gastron. Food Sci. 2020, 22, 100272. [Google Scholar] [CrossRef]
  22. Sutthiphatkul, T.; Mangmool, S.; Rungjindamai, N.; Ochaikul, D. Characteristics and Antioxidant Activities of Kombucha from Black Tea and Roselle by a Mixed Starter Culture. Curr. Appl. Sci. Technol. 2023, 23, 1–15. [Google Scholar] [CrossRef]
  23. Ivanišová, E.; Meňhartová, K.; Terentjeva, M.; Harangozo, Ľ.; Kántor, A.; Kačániová, M. The Evaluation of Chemical, Antioxidant, Antimicrobial and Sensory Properties of Kombucha Tea Beverage. J. Food Sci. Technol. 2020, 57, 1840–1846. [Google Scholar] [CrossRef]
  24. Jakubczyk, K.; Kupnicka, P.; Melkis, K.; Mielczarek, O.; Walczyńska, J.; Chlubek, D.; Janda-Milczarek, K. Effects of Fermentation Time and Type of Tea on the Content of Micronutrients in Kombucha Fermented Tea. Nutrients 2022, 14, 4828. [Google Scholar] [CrossRef]
  25. Nugraha, H.T.; Rinanti, A.; Wijayanti, A.; Aphirta, S. Bioremediation of Iron and Manganese Heavy Metal Polluted Soil by Mixed Culture of Acetobacter tropicalis and Lactobacillus fermentum. IOP Conf. Ser. Earth Environ. Sci. 2023, 1203, 012006. [Google Scholar] [CrossRef]
  26. Stehlik-Tomas, V.; Grba, S.; Stanzer, D.; Vahčić, N.; Zetić, V.G. Uptake of Iron by Yeast Cells and Its Impact on Biomass Production. Acta Aliment. 2003, 32, 279–287. [Google Scholar] [CrossRef]
  27. Velićanski, A.; Cvetković, D.; Markov, S. Characteristics of Kombucha Fermentation on Medicinal Herbs from Lamiaceae Family. Rom. Biotechnol. Lett. 2013, 18, 8034–8042. [Google Scholar]
  28. Kallel, L.; Desseaux, V.; Hamdi, M.; Stocker, P.; Ajandouz, E.H. Insights into the Fermentation Biochemistry of Kombucha Teas and Potential Impacts of Kombucha Drinking on Starch Digestion. Food Res. Int. 2012, 49, 226–232. [Google Scholar] [CrossRef]
  29. de Noronha, M.C.; Cardoso, R.R.; dos Santos D’Almeida, C.T.; Vieira do Carmo, M.A.; Azevedo, L.; Maltarollo, V.G.; Júnior, J.I.R.; Eller, M.R.; Cameron, L.C.; Ferreira, M.S.L.; et al. Black Tea Kombucha: Physicochemical, Microbiological and Comprehensive Phenolic Profile Changes during Fermentation, and Antimalarial Activity. Food Chem. 2022, 384, 132515. [Google Scholar] [CrossRef] [PubMed]
  30. Bolton, N.; Critchley, M.; Fabien, R.; Cromar, N.; Fallowfield, H. Microbially Influenced Corrosion of Galvanized Steel Pipes in Aerobic Water Systems. J. Appl. Microbiol. 2010, 109, 239–247. [Google Scholar] [CrossRef] [PubMed]
  31. La Torre, C.; Fazio, A.; Caputo, P.; Plastina, P.; Caroleo, M.C.; Cannataro, R.; Cione, E. Effects of Long—Term Storage on Radical Scavenging Properties and Phenolic Content of Kombucha from Black Tea. Molecules 2021, 26, 5474. [Google Scholar] [CrossRef] [PubMed]
  32. Chakravorty, S.; Bhattacharya, S.; Chatzinotas, A.; Chakraborty, W.; Bhattacharya, D.; Gachhui, R. Kombucha Tea Fermentation: Microbial and Biochemical Dynamics. Int. J. Food Microbiol. 2016, 220, 63–72. [Google Scholar] [CrossRef] [PubMed]
  33. Ivanišová, E.; Meňhartová, K.; Terentjeva, M.; Godočíková, L.; Árvay, J.; Kačániová, M. Kombucha Tea Beverage: Microbiological Characteristic, Antioxidant Activity, and Phytochemical Composition. Acta Aliment. 2019, 48, 324–331. [Google Scholar] [CrossRef]
  34. Zhou, D.D.; Saimaiti, A.; Luo, M.; Huang, S.Y.; Xiong, R.G.; Shang, A.; Gan, R.Y.; Li, H. Bin Fermentation with Tea Residues Enhances Antioxidant Activities and Polyphenol Contents in Kombucha Beverages. Antioxidants 2022, 11, 155. [Google Scholar] [CrossRef]
  35. Malongane, F.; McGaw, L.J.; Debusho, L.K.; Mudau, F.N. Sensory Characteristics and Volatile Compounds of Herbal Teas and Mixtures of Bush Tea with Other Selected Herbal Teas of South Africa. Foods 2020, 9, 496. [Google Scholar] [CrossRef]
  36. Kitwetcharoen, H.; Phung, L.T.; Klanrit, P.; Thanonkeo, S.; Tippayawat, P.; Yamada, M.; Thanonkeo, P. Kombucha Healthy Drink—Recent Advances in Production, Chemical Composition and Health Benefits. Fermentation 2023, 9, 48. [Google Scholar] [CrossRef]
  37. Wang, B.; Rutherfurd-Markwick, K.; Zhang, X.X.; Mutukumira, A.N. Kombucha: Production and Microbiological Research †. Foods 2022, 11, 3456. [Google Scholar] [CrossRef]
  38. Oyetayo, V.O.; Ogidi, C.O.; Bayode, S.O.; Enikanselu, F.F. Evaluation of Biological Efficiency, Nutrient Contents and Antioxidant Activity of Pleurotus Pulmonarius Enriched with Zinc and Iron. Indian Phytopathol. 2021, 74, 901–910. [Google Scholar] [CrossRef]
  39. Poniedziałek, B.; Mleczek, M.; Niedzielski, P.; Siwulski, M.; Gąsecka, M.; Kozak, L.; Komosa, A.; Rzymski, P. Bio-Enriched Pleurotus Mushrooms for Deficiency Control and Improved Antioxidative Protection of Human Platelets? Eur. Food Res. Technol. 2017, 243, 2187–2198. [Google Scholar] [CrossRef]
  40. Chu, S.C.; Chen, C. Effects of Origins and Fermentation Time on the Antioxidant Activities of Kombucha. Food Chem. 2006, 98, 502–507. [Google Scholar] [CrossRef]
  41. Wenisch, C.; Biffignandi, P.M. Effect of Bioflavonoids (Trihydroxyethylrutin and Disodium Flavodate) in Vitro on Neutrophil Reactive Oxygen Production and Phagocytic Ability Assessed by Flow Cytometry. Curr. Med. Res. Opin. 2001, 17, 123–127. [Google Scholar] [CrossRef] [PubMed]
  42. Suttiarporn, P.; Sookwong, P.; Mahatheeranont, S. Fractionation and Identification of Antioxidant Compounds from Bran of Thai Black Rice Cv. Riceberry. Int. J. Chem. Eng. Appl. 2016, 7, 109–114. [Google Scholar] [CrossRef]
Figure 1. Kinetics of hydrolysis and sugar consumption (ac), acetic acid (d) production, and ethanol (e) production during 14 days of kombucha fermentation without galvanized steel (K−GS) and with galvanized steel coupon (K+GS). All data represent average values from duplicate analyses.
Fermentation 10 00159 g001
Figure 2. Evolution of galvanized steel coupons immersed in the kombucha medium during 14 days of incubation (d: time in days).
Fermentation 10 00159 g002
Figure 3. SEM images of galvanized steel coupons (a,b) before and, (c,d) after 14-day incubation and (e,f) after removing corrosion products.
Fermentation 10 00159 g003
Figure 4. EDS analysis of corrosion products formed on galvanized steel coupons immersed in kombucha medium for 14 days: Spectra (a) before and (c) after the immersion test. Element mapping images (b) before and (d) after the immersion test.
Fermentation 10 00159 g004
Figure 5. Stable open circuit potential (OCP) (a) at one hour and corrosion current density (Jcorr) data (b) derived from the potentiodynamic polarization curves in various solutions of Kombucha (K−GS) without and (K+GS) with galvanized steel coupon at 3, 7, 10, and 14 days of fermentation. Acidified black tea (atea) was used to represent the initial stage.
Fermentation 10 00159 g005
Figure 6. Principal components analysis “Biplot” of the acidified black tea (atea) and kombucha fermented samples without (K−GS) and with (K+GS) galvanized steel coupons about the physicochemical (Jcorr: corrosion current density, Ecorr: corrosion potential) parameters based on the fermentation time (3d, 7d, 10d, and 14d).
Fermentation 10 00159 g006
Figure 7. Extraction yields (a) of different solvents (EtOAc: ethyl acetate, BuOH: butanol) and residual aqueous phases (H2O) from the black tea and kombucha medium (without K−GS and with K+GS galvanized steel), along with total phenolic content (TPC) of dry extracts (b); extracts were tested at 50 mg/L. Means values ± SD (n = 3); Different letters indicate significant differences (p ≤ 0.05).
Fermentation 10 00159 g007
Figure 8. Compounds firstly identified in kombucha black tea (K+GS) in the presence of galvanized steel coupons by GC-MS.
Fermentation 10 00159 g008
Figure 9. Antioxidant activity of black tea and kombucha extracts (EtOAc: ethyl acetate; BuOH: butanol; H2O: aqueous phase, VIT C: ascorbic acid). Means values ± SD (n = 3); Different letters indicate significant differences (p ≤ 0.05).
Fermentation 10 00159 g009
Table 1. Amounts of dissolved zinc (Zn) and iron (Fe) found in acidified black tea (atea) and in kombucha fermented medium without (K−GS) and with (K+GS) galvanized steel coupons. Means values ± SD (n = 3); different letters indicate significant differences (p ≤ 0.05).
SamplesZn (ppm)Fe (ppm)
Atea1.20 × 10−1 ± 1.68 × 10⁻³ b2.13 × 10−2 ± 2.92 × 10⁻³ b
K−GS1.35 × 10−1 ± 3.92 × 10⁻² b3.31 × 10−2 ± 1.40 × 10⁻³ b
K+GS7.25 × 101 ± 1.80 a8.93 ± 9.85 × 10⁻² a
Table 2. pH values in both acidified black tea (atea) and kombucha medium without (K−GS) and with (K+GS) galvanized steel coupons during the fermentation process (d: time in days).
pHAtea3d7d10d14d
K−GS3.83.33.22.82.6
K+GS3.83.53.32.92.7
Table 3. Correlation matrix.
pHSucroseGlucoseFructoseAcetic AcidEthanolEcorrJcorr
pH10.8910.746−0.817−0.922−0.877−0.059−0.791
Sucrose0.89110.912−0.772−0.972−0.978−0.251−0.937
Glucose0.7460.9121−0.446−0.833−0.936−0.228−0.801
Fructose−0.817−0.772−0.44610.8400.6910.1550.794
Acetic Acid−0.922−0.972−0.8330.84010.9470.2760.866
Ethanol−0.877−0.978−0.9360.6910.94710.2310.887
Ecorr−0.059−0.251−0.2280.1550.2760.23110.201
Jcorr−0.791−0.937−0.8010.7940.8660.8870.2011
Jcorr: corrosion current density, Ecorr: corrosion potential.
Table 4. Identification of phenolic compounds in fermented and unfermented black tea extracts by HPLC-DAD (K−GS: Kombucha without galvanized steel, K+GS: Kombucha with galvanized steel, EtOAc: ethyl acetate, BuOH: butanol, H2O: aqueous extract).
Area (mAU × min)
Black teaK−GSK+GS
TR (min)CompoundEtOAcBuOHH2OEtOAcBuOHH2OEtOAcBuOHH2O
10.932,4
Dihydroxycinnamic acid
---501.48--507.98--
20.96Ellagic acid392.15187.321.81-123.81--173.082.59
32.05Trihydroxyethylrutin------305.7538.19-
42.21Gallic acid-47.61-268.0031.051.00--0.70
52.34Gallocyanin160.79--------
62.52Methyl 3,5-dihydroxybenzoate------70.05--
72.973-Amino-4-hydroxybenzoic acid---74.90-----
83.15Caffeic Acid38.33--------
917.05Ethyl trans-2-hydroxycinnamate---1.37-----
1017.76Ethyl 4-hydroxy-3-cinamate------111.59--
1122.604′,5′-dimethoxy-2′-hydroxy-4-methylchalcone--0.06--0.08--0.08
Table 5. GC-MS compounds identification in fermented and unfermented black tea extracts before derivatization (K−GS: Kombucha without galvanized steel, K+GS: Kombucha with galvanized steel, EtOAc: ethyl acetate, BuOH: butanol, H2O: aqueous extract).
Area (×108)
Black teaK−GSK+GS
TR (min)CompoundEtOAcBuOHH2OEtOAcBuOHH2OEtOAcBuOHH2O
17.28ethyl 2-methylbutanoate1.06--1.91--2.47--
27.79o-Xylene0.45--0.74--0.86--
382-Furanmethanol--------1.78
48.52Cyanodimethylamine-4.61--4.59----
58.58Methoxyacetonitrile-------9.52-
69.17trans-2,5-dimethyl-3,4-epoxyhexane----8.76----
79.19Propanamide-8.71-------
89.314-Heptanone-3.81--4.17----
99.53Isobutyl isobutanoate-5.31--5.04----
109.783-methyl-4-heptanone-7.87--8.27--17.5-
119.88Butyl isobutanoate-61.30--37.20--69.03-
129.982,2-dimethylbutanoic acid-------34.5-
1310.1Hexanal, 2-ethyl--------8.58-
1410.38Butyl butanoate -70.39--56.28--84.33-
1510.63Undecane--0.39--1.28--0.92
1610.85Dihydroisophoron1.76--2.87--3.53--
1711.122,3-Butanediol, diacetate------2.16--
1811.715-Methylfurfuryl alcohol------0.60--
1912.22Octadecanoic acid, 3-hydroxy-, methyl ester------2.68--
2012.46Phenylethyl Alcohol---3.49--4.68--
2113.193-Hydroxy-2,3-dihydromaltol--------1.25
2216.061,3-Diacetin------1.54--
2317.72Methyl 10-methylundecanoate-----0.83---
24182,4-Ditert-butylphenol1.06--2.65--1.12--
2519.89Methyl isomyristate--0.19--0.88---
2619.962,2′-Methylenebis(6-tert-butyl-p-cresol)1.01-----14.50-0.88
2721.79methyl hexadecanoate --3.74--95.4--0.28
2823.12Caffeine266.3859.294.04135.247.71-219.2023.410.35
2923.77Oleic acid, methyl ester-----4.73---
3023.87Methyl 16-methylheptadecanoate--2.01------
Table 6. GC-MS compounds identification in fermented and unfermented black tea extracts after derivatization (K−GS: Kombucha without galvanized steel, K+GS: Kombucha with galvanized steel, EtOAc: ethyl acetate, BuOH: butanol, H2O: aqueous extract).
Area (×108)
Black TeaK−GSK+GS
TR (min)CompoundEtOAcBuOHH2OEtOAcBuOHH2OEtOAcBuOHH2O
19.522,3-Butanediol---66.49--76.82--
210.34Lactic Acid18.8014.46-43.746.56-64.6776.61-
310.842-Ethylhexanol-50.82-------
410.92-hydroperoxyoxolane----10.73----
511.59Hydracrylic acid---20.08-----
611.752-Oxyisovaleric acid---24.60--24.36--
713.02Leucinic acid------35.86--
813.16Dihydroxyacetone-------89.39-
913.32Glycerol23.62--152.4240.06-76.14123.78-
1014.581-Monoacetin -- --63.84--
1114.76Butanedioic acid---54.6328.62-63.8469.07-
1218.24Tyrosol---6.64-----
1318.57Atrolactinic acid---4.62--10.91--
1418.91Pentonic acid 1,4-lactone----28.90----
1520.11D-(-)-Tagatofuranose19.089.93-------
1621.39Gluconic acid lactone-------72.10-
1721.482,2′-Methylenebis(6-tert-butyl-p-cresol)-110.04-------
1821.55Lactic acid, 3-(p-hydroxyphenyl)--2.06----13.81--
1921.632,3,4,5,6-pentahydroxyhexanal-------82.70-
2021.94Gallic acid72.6497.06-189.32--242.8361.38-
2122.65Palmitic Acid47.632.76-44.79--36.60--
2224.939-Octadecenoic acid65.90--133.87-----
2327.94Catechin------1.33--
Table 7. Mean values of half-maximal inhibitory concentration IC50 of antioxidant activity of active extracts of kombucha and black tea. Means values ± SD (n = 3); Different letters indicate significant differences (p ≤ 0.05).
ExtractIC50 (µg/mL)
Black teaK-GSK+GS
EtOAc14.5 ± 0.5 b10.1 ± 0.4 a8.6 ± 0.5 a
BuOH>5021.7 ± 1.1 c14.3 ± 1.4 b
H2O>50>50>50
IC50 values were calculated for inhibition percentages higher than 50% at 5 μg/mL ± standard deviations (n = 3).
Disclaimer/Publisher’s Note: The statements, opinions and data contained in all publications are solely those of the individual author(s) and contributor(s) and not of MDPI and/or the editor(s). MDPI and/or the editor(s) disclaim responsibility for any injury to people or property resulting from any ideas, methods, instructions or products referred to in the content.

