Article

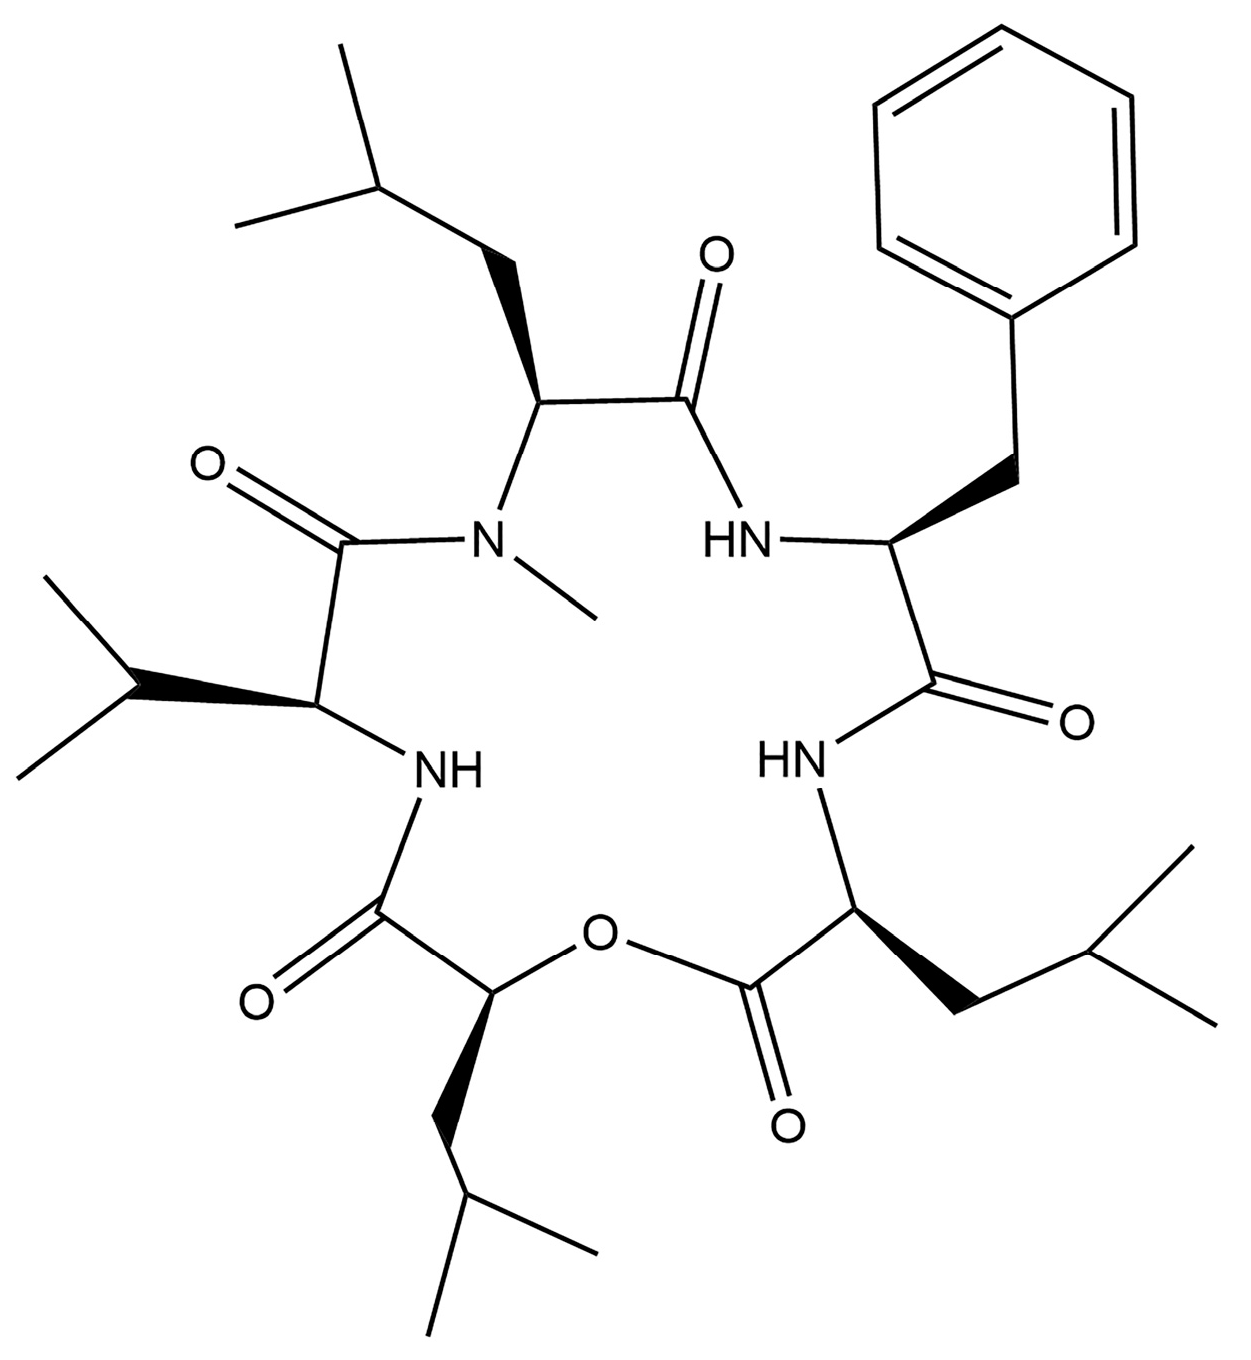
Optimization of Stationary Liquid Fermentation Conditions for N-Methylsansalvamide Production by the Endophytic Strain Fusarium sp. R1

School of Pharmaceutical Sciences, Zhejiang University of Technology, Hangzhou 310014, China
*
Author to whom correspondence should be addressed.
Fermentation 2024, 10(3), 140; https://doi.org/10.3390/fermentation10030140
Submission received: 14 February 2024 / Revised: 28 February 2024 / Accepted: 28 February 2024 / Published: 1 March 2024
(This article belongs to the Section Microbial Metabolism, Physiology & Genetics)

Abstract

:
To improve the yield of the therapeutic agent N-methylsansalvamide (SA), optimization of stationary liquid fermentation conditions was conducted on an endophytic strain, Fusarium sp. R1, at flask level. Using a One-Factor-At-a-Time approach, the fermentation conditions for SA production were determined as follows: fermentation time of 13 d, 24 °C, initial pH of 6.5, seed age of 24 h, inoculum size of 5.0% (v/v), loading volume of 50% (v/v), and 20.0 g/L salinity. Sucrose, tryptone, and yeast extract were found to be the best sources of carbon and nitrogen. Using response surface methodology, the optimal medium compositions consisted of 22.5 g/L sucrose, 16.5 g/L tryptone, and 0.024 g/L yeast extract. Verification tests suggested that the SA yield under these optimal conditions reached up to 536.77 ± 2.67 mg/L, which was increased by almost ten times the initial yield (54.05 ± 3.45 mg/L). The findings indicate that a high SA production yield can be achieved by stationary culture of strain R1 under proper fermentation conditions using a low-cost medium. This study paves the way toward industrial-scale SA production by strain R1 for new drug development.

1. Introduction

Plant endophytic fungi are a rich source of secondary metabolites with novel structure and biodiversity [1] as well as potential roles in the development of new drugs and agents of biological control [2]. Fusarium, a type of endophytic fungus, can produce a wide variety of secondary metabolites [3] (alkaloids, peptides, amides, terpenoids, quinones, and pyranones) [4].
Cyclopeptides have several advantages as drug candidates, including high binding affinity and selectivity for protein ligands, high lipophilicity, and membrane permeability [5]. Sansalvamide A was the first cytotoxic cyclic pentapeptide to be discovered in Fusarium #CNL 292, which is associated with the marine plant Halodule wrightii. It consists of four hydrophobic amino acids [phenylalanine (L-Phe), two leucines (L-Leu), one valine (L-Val)], and one hydroxy acid [leucic acid (O-Leu)] [6]. N-methylsansalvamide (SA), one cyclic pentadepsipeptide originally produced by the strain Fusarium sp. CNL-619, consists of four hydrophobic amino acids [L-Phe, L-Leu, N-methylleucine, and L-Val] and one hydroxy acid (O-Leu) (Figure 1) [7]. Park et al. found that SA has an excellent inhibitory effect on colon tumors; its IC50 concentration was observed at 24.05 ± 1.07 μM [8], suggesting it has therapeutic potential in treating cancers.
To increase metabolite production during microbial fermentation, the production medium and fermentation conditions must be optimized. The best fermentation conditions (i.e., pH, temperature, agitation speed, etc.) and medium components (i.e., carbon and nitrogen sources, etc.) are optimized for the design of the production medium.
One-Factor-At-a-Time (OFAT) design has been the most favored choice for designing fermentation conditions [9]. Response surface methodology (RSM) is an effective mathematical and statistical technique for planning experiments, analyzing variables’ effects, creating models, and finding the best combinations of variables for producing adaptive and desired responses [10]. Due to the low production of SA, improving SA yield in stationary liquid fermentation conditions is necessary. To improve SA production using the endophytic fungus strain R1, optimization of fermentation conditions was conducted in this work using OFAT design and RSM, which were respectively used to screen medium compositions and fermentation conditions.

2. Materials and Methods

2.1. Strain and Cultivation

Strain R1 was isolated from the coastal plant Rumex madaio Makino, collected from Putuo Island (Zhoushan, China), and identified as Fusarium sp. based on its 18S rRNA sequence (GenBank accession No. MF376147) and ITS sequence (GenBank accession No. ON545070) [11]. This strain R1 was deposited at the China General Microbiological Culture Collection Center under accession number CGMCC No. 17763.
Seed cultivation: Strain R1 was incubated on potato dextrose agar (PDA) plates at 30 °C for 4 days. One agar-grown mycelial plug was transferred to culture broth in a 1 L Erlenmeyer flask containing 500 mL of potato dextrose broth (PDB) medium, followed by shaking at 180 rpm at 30 °C for 72 h.

2.2. Fermentation Process

The primary fermentation medium consisted of glucose–peptone–yeast extract (GPY) medium, 10.0 g/L glucose, 5.0 g/L tryptone, 2.0 g/L yeast extract, and 2.0 g/L sea salt. An aliquot of 20 mL of seed culture was inoculated into a 1 L Erlenmeyer flask containing 400 mL of GPY medium and cultivated for 13 days under stationary conditions at 25 °C.

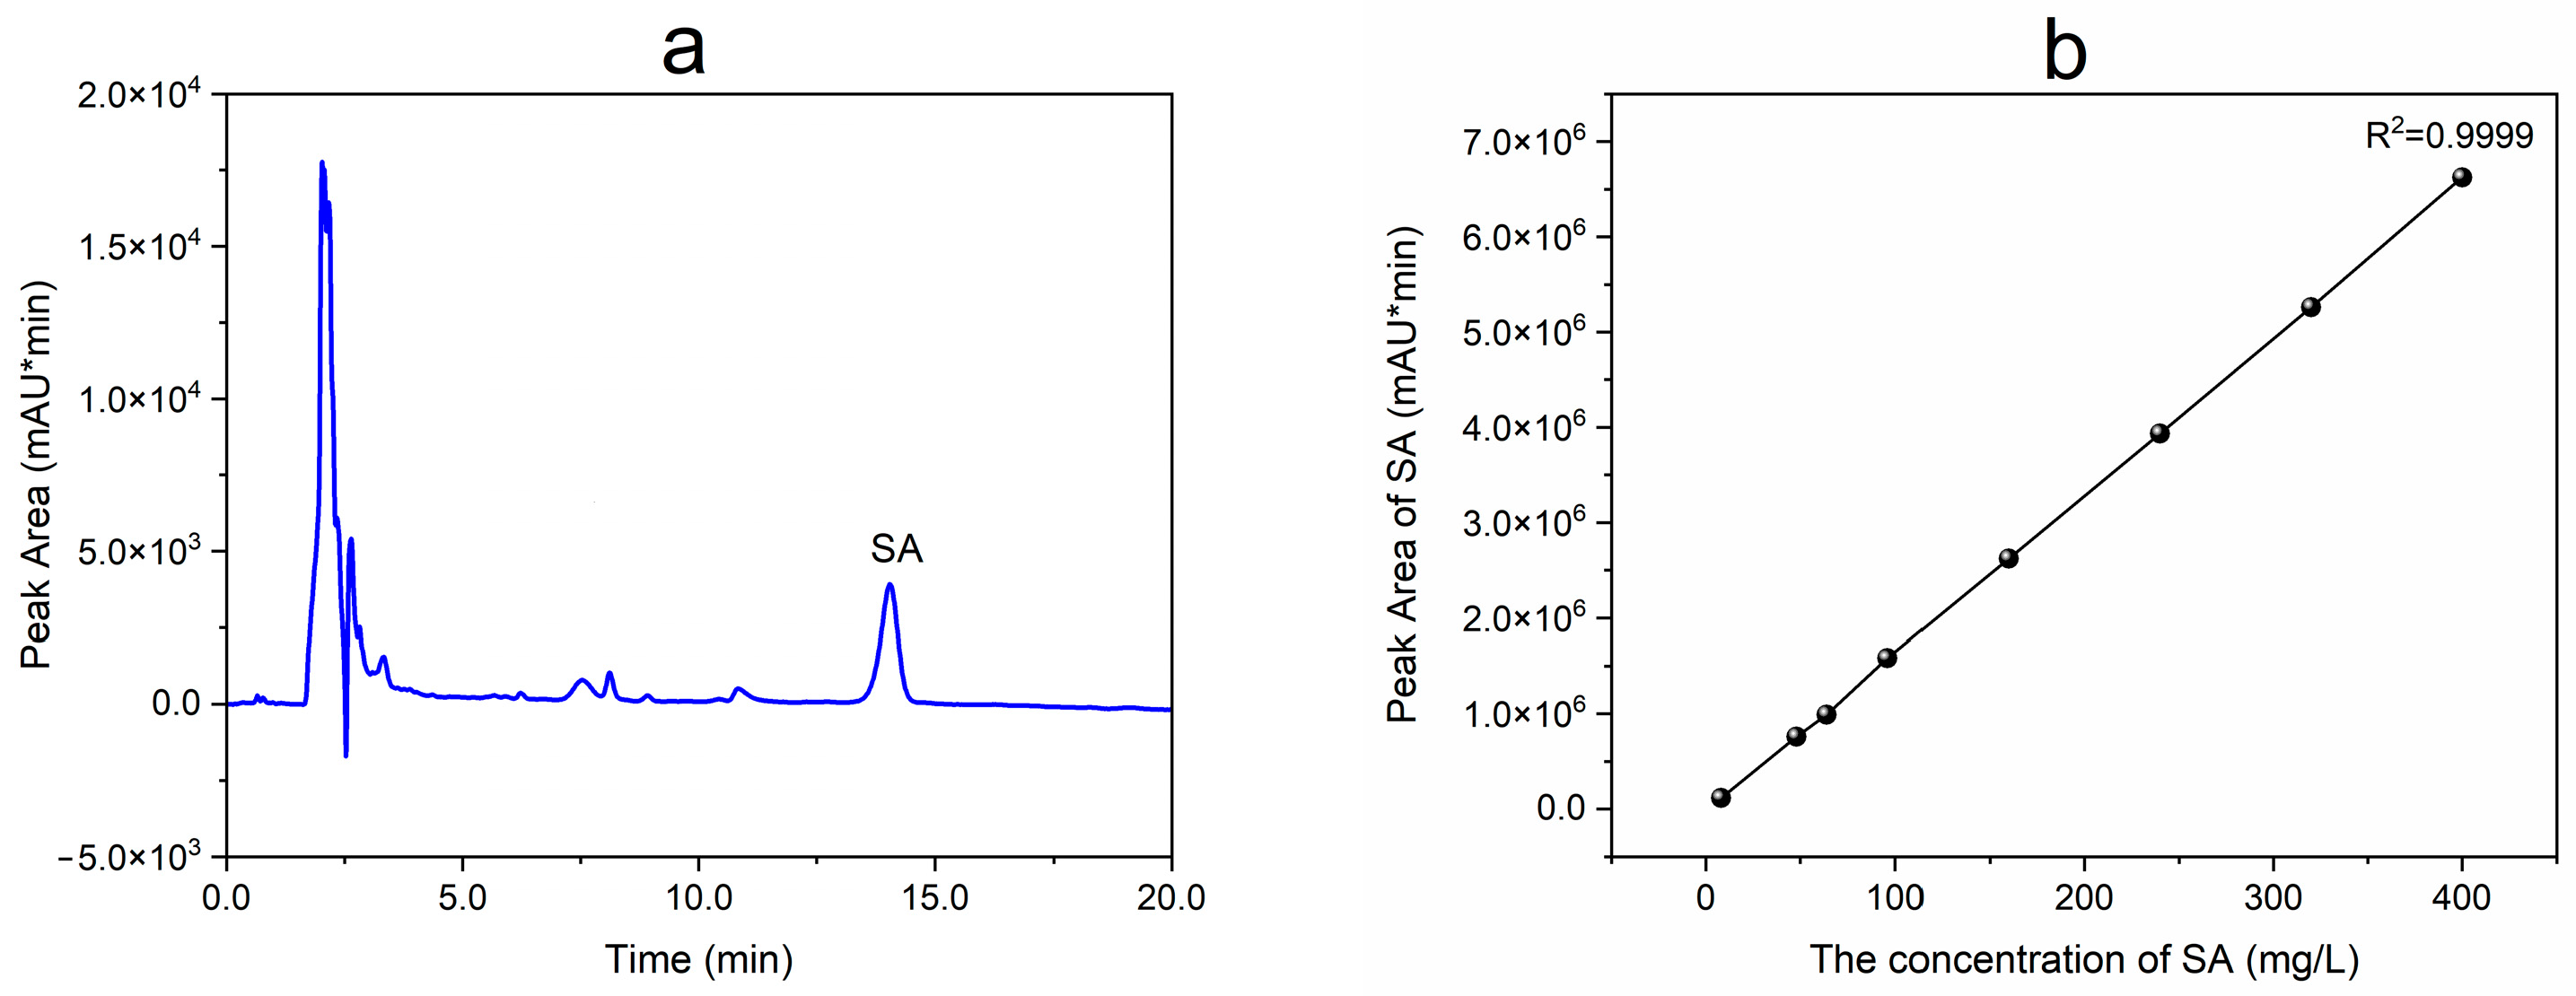
2.3. Analytical Method for SA

At the end of fermentation, all mycelia in the shake flask were collected and separated from the broth using gauze, followed by ultrasonic-assisted extraction with ethanol (20:1, mL:g) for 30 min at room temperature. After filtration with filter paper, all filtrate was evaporated in a vacuum at 40 °C to afford a crude extract and subsequently dissolved in 15 mL of chromatographic methanol. This process was followed by filtration with an organic membrane filter (0.22 μm) and preservation at 4 °C before HPLC analysis. SA analysis was conducted on an HPLC apparatus (LC-20AT, Shimadzu, Kyoto, Japan) equipped with a Phenomenex C18 column (5 μm, 4.6 mm × 250 mm) and a UV detector at 210 nm in isocratic mode with a flow rate of 1.0 mL/min (Figure 2a). The mobile phase consisted of water and acetonitrile containing 0.1% formic acid in a ratio of 30:70 (v/v). The standard curve equation for SA quantification (Figure 2b) was obtained as follows:
y = 16604 x − 36020, R2 = 0.9999

2.4. Effects of Fermentation Conditions on SA Yield

The effects of fermentation conditions, including fermentation time, temperature, initial pH, seed age, inoculum size, loading volume, and sea salt concentration, on SA yield were carefully observed using the OFAT approach. The general medium compositions for all OFAT experiments consisted of 10.0 g/L glucose, 5.0 g/L tryptone, 2.0 g/L yeast extract, and 2.0 g/L sea salt. The general fermentation conditions for SA production were as follows: fermentation time of 13 d, temperature of 25 °C, initial pH of 7.5, seed age of 72 h, inoculum amount of 5.0% (v/v), and a loading volume of 40% (v/v). All factors were individually evaluated at various levels: (i) fermentation time (4, 8, 11, 12, 13, 14, 15, 16, 17 d), (ii) fermentation temperature (20, 24, 28, 30, 34, and 37 °C), (iii) initial pH (4.0, 4.5, 5.0, 5.5, 6.0, 6.5, and 7.0), (iv) seed age (24, 48, 72, 96, and 120 h), (v) inoculum size (v/v) (2.0, 4.0, 5.0, 8.0, and 10.0%), (vi) loading volume (v/v) (10, 20, 30, 40, 50, and 60%), (vii) sea salt concentration (0, 2.0, 8.0, 15.0, 20.0, 25.0, and 30.0 g/L). All experiments were performed in triplicate.

2.5. Effects of Carbon and Nitrogen Sources on SA Yield

The effects of various carbon and nitrogen sources on SA yield were also evaluated using OFAT experiments. The carbon source glucose in the fermentation medium (10.0 g/L glucose, 5.0 g/L tryptone, 2.0 g/L yeast extract, and 2.0 g/L sea salt) was substituted by other carbon sources, including refined sugar, maltose, glycerol, lactose, and sucrose at 10.0 g/L. Two nitrogen sources (tryptone and yeast extract) were also replaced by other nutritional elements, including beef extract, yeast extract, water-soluble soybean meal, soy peptone, tryptone, casein peptone, and soybean flour at 7.0 g/L.

2.6. Determination of Central Values for Response Surface Design

Since the central values of medium compositions for optimization were obtained unsuccessfully in the above single-factor experiments, both the Plackett–Burman design (PBD) and the steepest ascent method (SAM) were employed. A set of 12 experiments was conducted to evaluate the effects of three variables (sucrose, tryptone, and yeast extract), each having both high and low levels (Table 1). The difference between the average response at the two levels was used to evaluate the impact of each variable.
The step size for each variable in SAM was appropriately designed according to the results obtained from the above PBD experiments (Table 2). For response surface experiments, each central value of factors (sucrose, tryptone, and yeast extract) was further fixed following their effects on SA yield.

2.7. Response Surface Methodology for Optimization of Medium Compositions

In order to optimize the medium compositions for SA production, a sequence of 17 tests was conducted using the Box–Behnken design (BBD). All data were the mean of three parallel experiments (Table 3).

2.8. Experimental Data Processing

The software Design Expert (Version 13.0.0, Stat-Ease Inc., Minneapolis, MN, USA) was used to conduct PBD and BBD experiments as well as data analysis.

2.9. Verification Experiments

To verify the validity of the optimal fermentation conditions and medium compositions for SA production, three groups of parallel experiments were conducted. All data were averaged and presented as mean ± standard deviation (SD).

3. Results

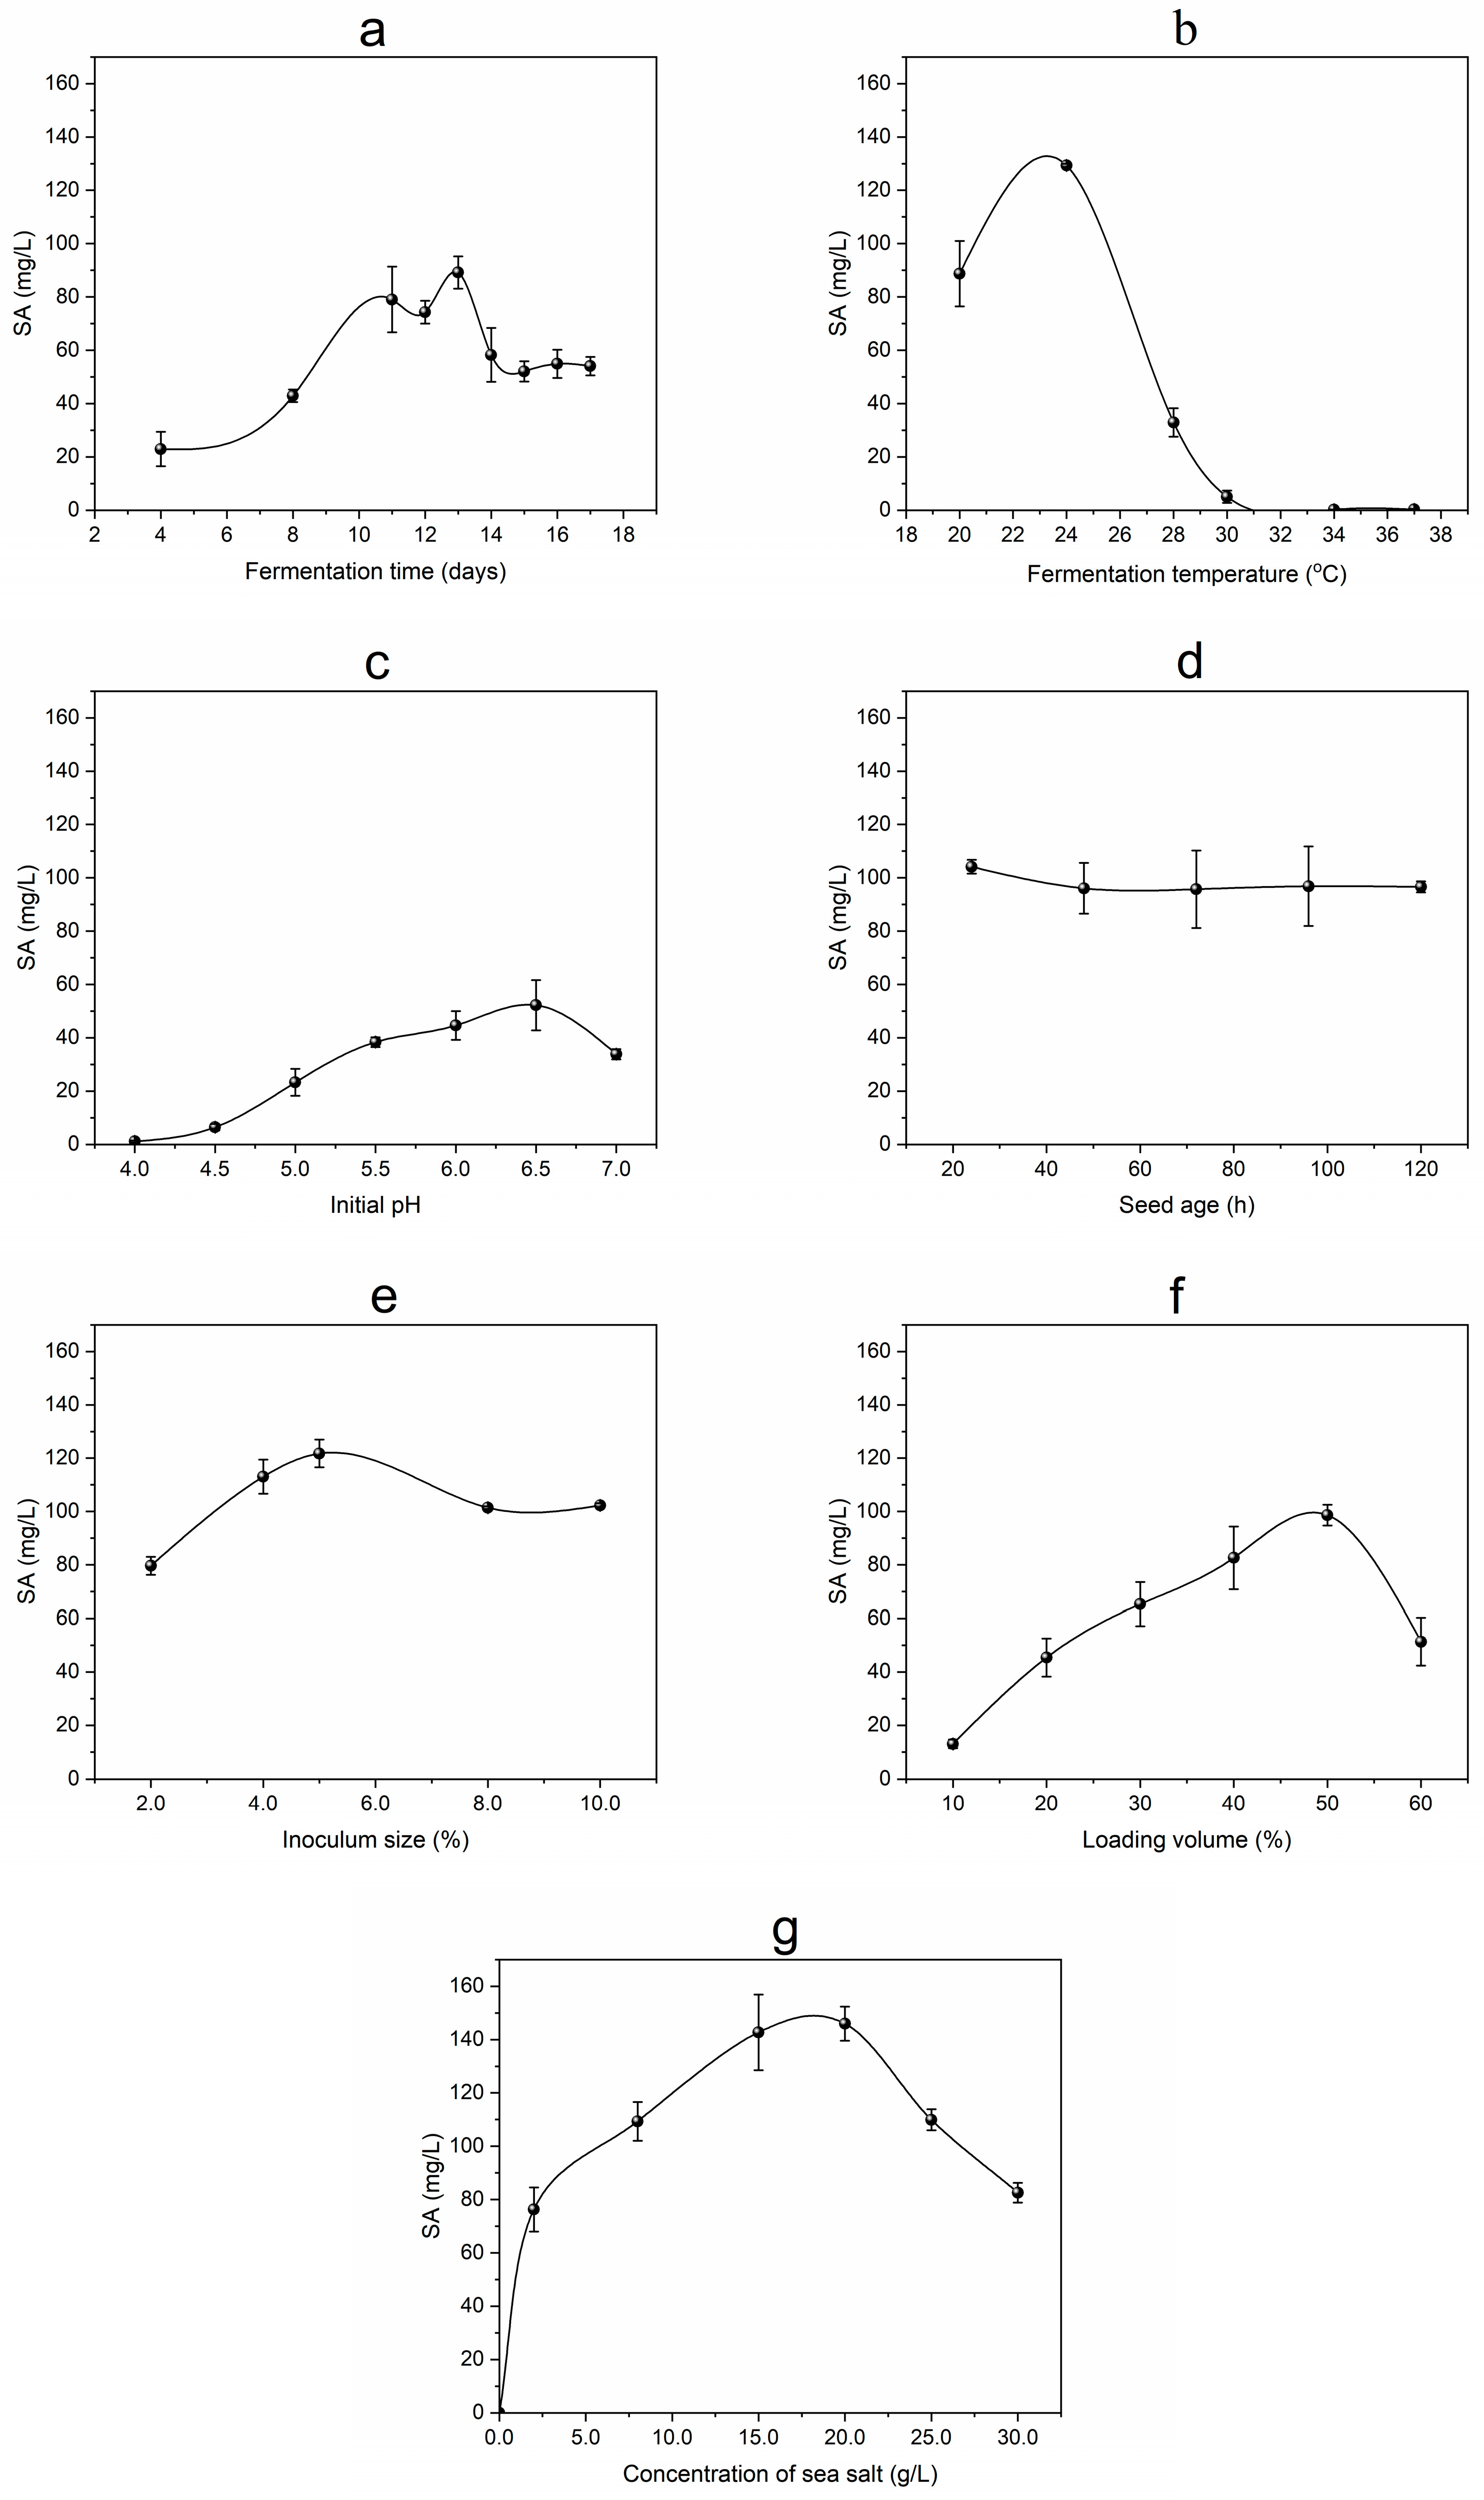
3.1. Effects of Fermentation Conditions on SA Yield

3.1.1. Effect of Fermentation Time on SA Production

Microbial biomass is essential for the biosynthesis and accumulation of secondary metabolites (SMs). SM production is affected by the amount of nutritional materials, which gradually decrease in the flask during fermentation. Microorganisms usually undergo senescence and autolysis by releasing digestive enzymes that break down their SMs [12]. As shown in Figure 3a, fermentation time strongly affects SA yield, increasing in a time-dependent manner within the range of 4–11 days and then slightly decreasing, followed by obvious enhancement. The highest SA yield reached 89.17 ± 6.06 mg/L on day 13. Strain R1 mycelial growth occurred during the first 4 days of incubation, which can partly explain the low SA production at this stage. Subsequently, mycelium growth entered a stagnant period and began to accumulate secondary metabolism SA. After day 13, SA appeared degraded due to digestive enzymes intracellularly produced by strain R1. Therefore, a fermentation time of 13 days was chosen as the optimal duration for the experiment.

3.1.2. Effect of Temperature on SA Production

Temperature is an important factor affecting various enzymatic reaction rates in the biosynthesis pathway of microbial SMs [13,14]. Maintaining a proper temperature throughout the fermentation process is crucial to the efficient production of the target metabolite. As presented in Figure 3b, the SA yield varied at different fermentation temperatures, reaching its highest level (129.32 ± 0.60 mg/L) at 24 °C and subsequently decreasing at higher temperatures. SA was produced at a higher rate at lower ambient temperatures when more dissolved oxygen was present in the culture medium. However, excessively low temperatures may reduce enzyme activity, leading to decreased SA content. Therefore, 24 °C was chosen as the optimal fermentation temperature in this experiment.

3.1.3. Effect of Initial pH on SA Production

The pH of fermentation broth may affect intramolecular forces, the enzyme shapes involved in SM biosynthesis, and the electrical charge of cell membranes [15]. As shown in Figure 3c, SA yield gradually improved with the increasing initial pH, which ranged from 4.0 to 6.5, and reached its maximum (52.22 ± 9.45 mg/L) at pH 6.5. This result suggests that highly acidic conditions (pH ≤ 4) are not suitable for SA production, and strain R1 is highly efficient in SA production under faintly acidic conditions. Therefore, a pH value of 6.5 was chosen as the optimal pH for this investigation.

3.1.4. Effect of Seed Age on SA Production

Microbial seeds in the logarithmic growth phase have strong reproductive capabilities and grow more rapidly [16]. Therefore, in this experiment, we selected microbial seeds at the logarithmic growth stage for higher SA production. As shown in Figure 3d, SA yield increased to its highest level (104.16 ± 2.16 mg/L) at a seed age of 24 h and gradually decreased over time owing to mycelial aging. Therefore, the best seed age was 24 h.

3.1.5. Effect of Inoculum Size on SA Production

Inoculum size in a fixture container may affect the growth rate of strains [17]. A smaller inoculum can prolong the lag phase, while a larger inoculum causes niches to overlap excessively, inhibiting SA production. As shown in Figure 3e, the results suggest that SA yield gradually increases with increased inoculation amounts and reaches its maximum (121.77 ± 5.20 mg/L) at 5.0% (v/v) inoculum size, followed by a slow decline at higher inoculation amounts. Therefore, the optimal inoculum size is 5.0% (v/v).

3.1.6. Effect of Loading Volume on SA Production

Microbial growth and metabolism are influenced by their loading volume in a fixed container. An appropriate amount of loading volume can ensure strains’ oxygen and nutrient demands during fermentation [18]. The amount of dissolved oxygen in the fermentation medium affects SA production. Different liquid volumes can also lead to variations in the mycelial surface area of strain R1. Therefore, selecting the appropriate liquid volume is crucial for increasing strain R1 yield. As shown in Figure 3f, SA yield gradually increased in a loading volume-dependent manner and reached its highest level (98.64 ± 3.90 mg/L) when the liquid loading amount was 50% (v/v) and the surface area of strain R1 was 100.46 cm2. These results suggest that mycelium size, dissolved oxygen content, and nutrient supply are all appropriate for the SA fermentation process of strain R1 at 50% (v/v) liquid volume.

3.1.7. Effect of Sea Salt Concentration on SA Production

Strain R1 is halophilic since it grows well at various sea salt concentrations. As shown in Figure 3g, adding sea salt to the culture base, which cannot produce SA without sea salt, is essential. One reason for this may be because strain R1 is separated from coastal sea plants and adapts to growing environments containing sea salt. Therefore, adding sea salt to the medium facilitates the metabolism of enzymes in strain R1 and promotes SA production. With increased sea salt concentration in the fermentation medium, SA yield was slightly enhanced and reached its maximum (145.93 ± 6.40 mg/L) at 20.0 g/L, followed by a decrease at higher sea salt concentrations. The best sea salt concentration was 20.0 g/L.

3.2. Effect of Carbon and Nitrogen Sources on SA Production

We studied carbon and nitrogen sources’ influence on production through traditional optimization. Microorganisms require carbon sources to obtain energy and enhance SM biosynthesis [19]. As shown in Figure 4A, after glucose was replaced in the original medium with refined sugar, maltose, glycerin, sucrose, and lactose, SA production decreased in the order of sucrose, glycerin, maltose, sugar, glucose, and lactose. Sucrose as a carbon source resulted in the highest SA production, reaching 162.30 ± 16.79 mg/L, whereas SA production resulting from lactose was the lowest among the carbon sources tested in this research. Various carbon sources displayed different effects on SA production. The maximum SA yield (162.30 ± 16.79 mg/L) was achieved when sucrose was used as a carbon source, suggesting its favorability as a carbon source for SA biosynthesis.
A high-quality nitrogen source is crucial for efficient fermentation [20]. As shown in Figure 4B, the same content of beef extract, yeast extract, water-soluble soybean meal, soy peptone, soybean flour, tryptone, casein peptone, tryptone, and yeast extract replaced the nitrogen in the original medium. SA production in decreasing order was with tryptone and yeast extract, casein peptone, tryptone, beef extract, water-soluble soybean meal, soy peptone, yeast extract, and soybean flour. Nitrogen sources’ impact on SA production was apparent. Therefore, using animal nitrogen instead of plant nitrogen is preferable. Casein peptone or a combination of tryptone and yeast extract as nitrogen sources was more favorable for SA production, with yields of 112.31 ± 14.42 mg/L and 114.65 ± 3.45 mg/L, respectively. Regarding fermentation costs, tryptone and yeast extract were selected as the best nitrogen sources. Additionally, tryptone and yeast extract were the most accessible energy sources.

3.3. Central Values Analysis

The Plackett–Burman design (PBD) is a valuable methodology for examining the impact of medium composition. The total number of experiments conducted by PBD is n + 1, where n is the number of variables. In this research, PBD was employed to assess the positive and negative effects of sucrose, yeast extract, and tryptone on SA yield. Table 4 presents the design matrix for twelve runs, incorporating three variables, along with the corresponding responses to SA yield. The data were analyzed using regression analysis, with SA yield (Y) as the response variable. The resulting regression equation is as follows:
Y = 20.5 + 0.479 A − 4.66 B + 5.88 C
where, Y, A, B, and C represent the predicted SA yield, sucrose, yeast extract, and tryptone, respectively.
The PBD results indicated that tryptone and sucrose had a significant positive impact on SA yield, whereas yeast extract had a negative effect (Table 5). Specifically, higher concentrations of tryptone and sucrose and lower yeast extract in the fermentation medium enhanced SA production.
To optimize the response values of each main factor for subsequent response surface analysis, the steepest ascent test was conducted to approach the maximum response value region. According to the PBD results and equation for the step length of the steepest ascent method, each step for sucrose, tryptone, and yeast extract concentrations was set to 2.5, 4.0, and 0.7 g/L in the SAM experiments, respectively. The findings indicated a trend of increasing and then decreasing SA production, indicating the reliability of the test design, as shown in Table 6. As sucrose and tryptone increased, the yeast extract gradually decreased. SA production increased along the path, reaching a peak of 385.33 ± 14.72 mg/L before decreasing. These findings suggest that the optimal values were close to those in test 3 (20.0 g/L sucrose, 0.6 g/L yeast extract, and 14 g/L tryptone). Therefore, this point was chosen to set up basal concentrations for BBD.

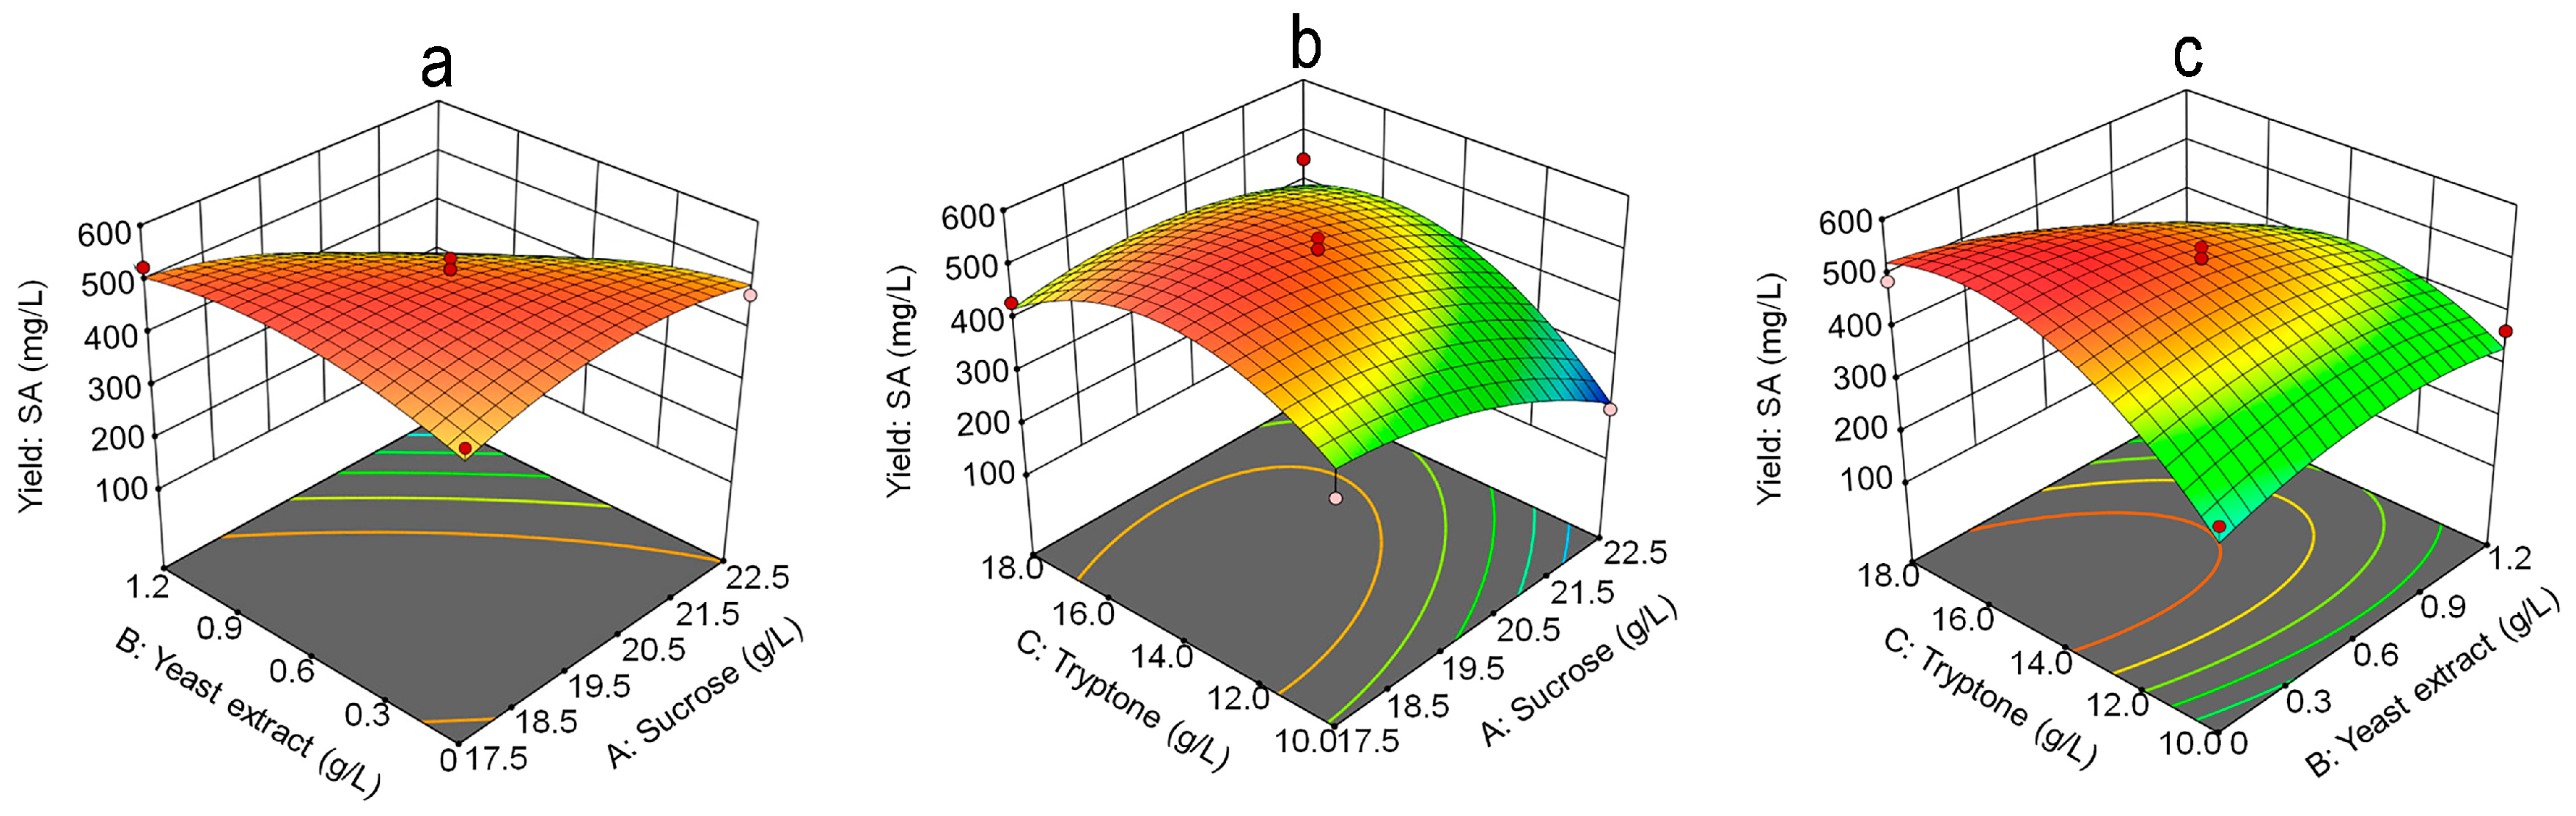
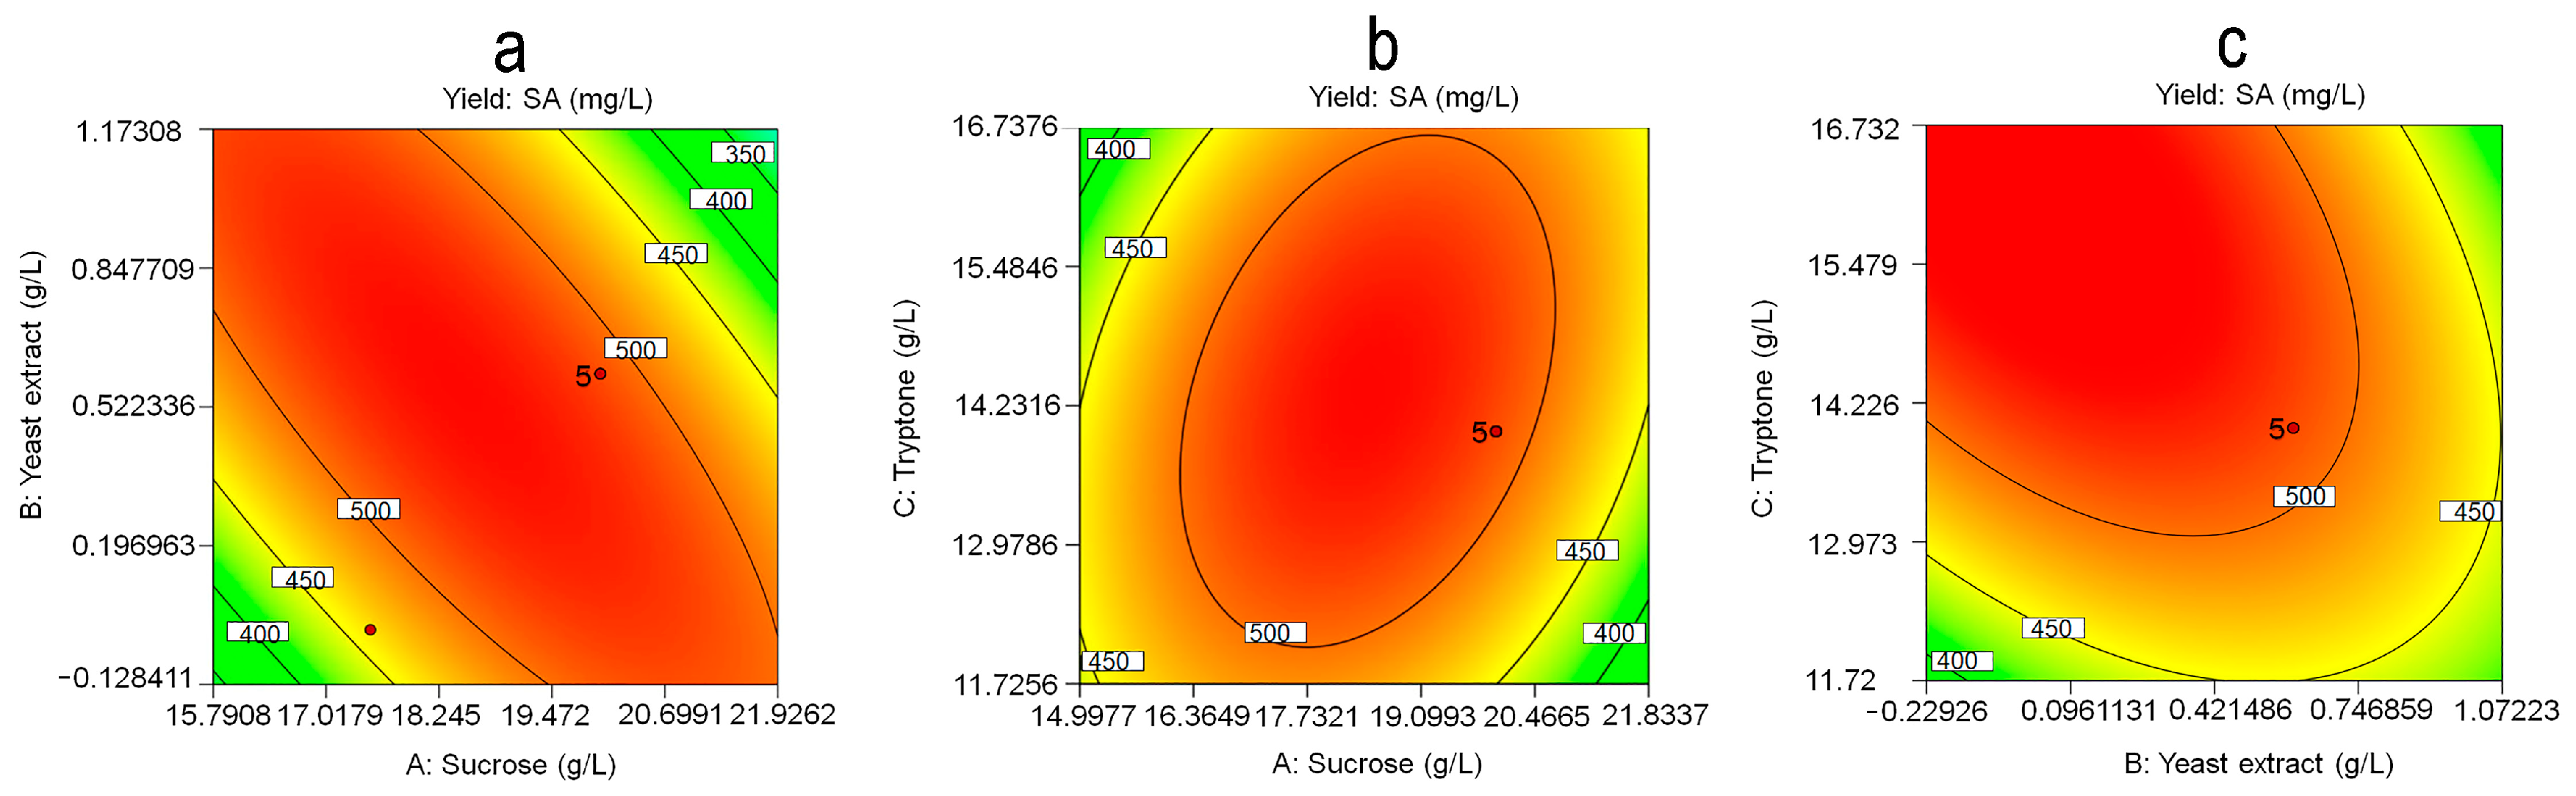
3.4. Response Surface Methodology Analysis

To further increase SA production, a total of 17 statistical experiments for BBD were conducted to investigate the individual and interactive effects of three medium components (sucrose, yeast extract, and tryptone) and determine their optimal concentrations on SA yield (Table 7).
The following equation can be used in regression analysis to determine these factors’ impact on the response value when SA yield is used as the response value:
Y = 511.89 − 58.21 A − 46.98 B + 46.91 C − 68.80 A B + 44.58 A C − 43.93 A2 − 41.35 B2 − 107.49 C2
where, Y, A, B, and C, represent the predicted SA yield, sucrose, yeast extract, and tryptone, respectively. The variance analysis of the secondary polynomial model presented in Table 8 includes a statistical evaluation of the model equation’s significance using the F test for the analysis of variance (ANOVA).
A p-value less than 0.05 indicated that the model term was significant. The coefficient of determination suggested that the model explains 92.81% of the variation in SA yield observed in the experiment. The calibrated coefficient of determination (R2adj) was 0.8356. Therefore, this regression equation can be used to predict SA yield. The primary terms A, B, and C, as well as the interaction terms AB and the secondary term C2, were found to be significant, indicating that the factors had non-linear effects on SA yield.
To investigate the effect of each variable’s optimum level and its interaction on SA yield, three-dimensional (3D) response surfaces (Figure 5) and contour plots (Figure 6) were plotted for any two independent variables. These plots exhibit a clear convex form with a downward trend, highlighting ideal levels for maximizing SA yield. The model predicted a maximum SA yield of 537.64 mg/L when the sucrose, tryptone, and yeast extract concentrations were set to 22.5, 16.5, and 0.024 g/L, respectively.

3.5. Verification Experiment

The model equation’s suitability for predicting the best response values was verified under optimal conditions. RSM predictions were validated by an experiment using the best-predicted SA production. The actual SA yield was 536.77 ± 2.67 mg/L, which agreed with the calculated values (537.64 mg/L), demonstrating that the model developed in this study adequately reflected the predicted optimization of SA production.

4. Discussion

SA has therapeutic potential and may lead to novel drug developments for cancer. Based on information from the literature, SA production requires Marine Broth 2216 medium as a substrate, which was cultivated under stationary conditions at 25 °C for 21 days [7]. Sequencing technologies and bioinformatics tools also enable quick and systematic identification of known and cryptic biosynthetic gene clusters (BGCs) and provide tools to improve production yield [21]. Contrasting genetic techniques utilized for SA production, the process parameters described in this article were initially optimized by traditional methods characterized by brevity and enhanced efficiency. The selection of ideal cultural conditions for statistical optimization was based on the OFAT design and optimization of fermentation medium components by RSM. Similar to our study, Lee focused on variables’ effects on SA analog production, neoN-methylsansalvamide, and optimum culture conditions on cereal substrates using RSM [22]. There are currently no reports on optimizing SA conditions for producing Fusarium spp. These experimental research results will hopefully serve as useful feedback for improving SA yields.
Fermentation conditions were optimized for SA production using an OFAT approach. PBD is a widely accepted approach used in SM production. SAM typically performs additional optimization for PBD-screened variables to assess interaction effects and determine ideal conditions. In this study, sucrose and tryptone were identified as positive factors and yeast extract was identified as a negative factor for SA production by PBD. SAM further optimized these three factors. We found that SA production greatly increased when sucrose content increased from 15.0 to 20.0 g/L, tryptone content increased from 6.0 to 14.0 g/L, and yeast extract content decreased from 2.0 to 0.6 g/L. Thus, choosing optimal carbon and nitrogen content is important for microbial metabolism. RSM has often been used as a subsequent process for optimizing medium component content. In this study, the SA yield reached 536.77 ± 2.67 mg/L (a tenfold increase) in the medium optimized with RSM. Non-statistical and statistical tools used in the optimization process play a crucial role in determining medium compositions and optimal values of factors with high accuracy. Additionally, researchers can create different strategic models for low-cost production using the response surface methodology program, which can predict results for various medium formulations.

5. Conclusions

In conclusion, we successfully utilized the RSM and OFAT approaches to optimize stationary liquid fermentation conditions and medium components for SA production by strain R1 at the flask level. The optimal conditions were determined as follows: a fermentation time of 13 d, a temperature of 24 °C, an initial pH of 6.5, a seed age of 24 h, an inoculum size of 5.0% (v/v), a loading volume of 50% (v/v), sucrose concentration of 22.5 g/L, tryptone concentration of 16.5 g/L, yeast extract concentration of 0.024 g/L, and a sea salt concentration of 20.0 g/L. Under these optimal conditions, the SA yield reached up to 536.77 ± 2.67 mg/L, which was approximately 10 times higher than the original conditions. These results indicate that rationally optimizing fermentation conditions and medium can effectively improve SA yield and pave the way for large-scale SA production in new drug development using strain R1.

Author Contributions

Conceptualization, project administration, and funding acquisition, H.Z.; methodology, Y.S. and Y.B.; software, Z.C.; formal analysis, N.P.; investigation, Y.S., Y.B. and Z.C.; resources, N.P.; data curation, Y.S.; writing—original draft preparation, Y.S.; writing—review and editing, Y.S. and H.Z. All authors have read and agreed to the published version of the manuscript.

Funding

This research was funded by The National Key Research and Development Program of China, grant number [2022YFC2804203].

Institutional Review Board Statement

Not applicable.

Informed Consent Statement

Not applicable.

Data Availability Statement

Data are contained within the article.

Conflicts of Interest

The authors declare no conflict of interest.

References

  1. Gangadevi, V.; Muthumary, J. Taxol, an anticancer drug produced by an endophytic fungus Bartalinia robillardoides Tassi, isolated from a medicinal plant, Aegle marmelos Correa ex Roxb. World J. Microbiol. Biotechnol. 2007, 24, 717–724. [Google Scholar] [CrossRef]
  2. Gangadevi, V.; Muthumary, J. A novel endophytic Taxol-producing fungus Chaetomella raphigera isolated from a medicinal plant, Terminalia arjuna. Appl. Biochem. Biotechnol. 2009, 158, 675–684. [Google Scholar] [CrossRef]
  3. Toghueo, R.M.K. Bioprospecting endophytic fungi from Fusarium genus as sources of bioactive metabolites. Mycology 2020, 11, 1–21. [Google Scholar] [CrossRef]
  4. Li, M.; Yu, R.; Bai, X.; Wang, H.; Zhang, H. Fusarium: A treasure trove of bioactive secondary metabolites. Nat. Prod. Rep. 2020, 37, 1568–1588. [Google Scholar] [CrossRef] [PubMed]
  5. Liu, S.; Gu, W.; Lo, D.; Ding, X.Z.; Ujiki, M.; Adrian, T.E.; Soff, G.A.; Silverman, R.B. N-methylsansalvamide a peptide analogues. Potent new antitumor agents. J. Med. Chem. 2005, 48, 3630–3638. [Google Scholar] [CrossRef]
  6. Belofsky, G.N.; Jensen, P.R.; Fenical, W. Sansalvamide: A new cytotoxic cyclic depsipeptide produced by a marine fungus of the genus Fusarium. Tetrahedron Lett. 1999, 40, 2913–2916. [Google Scholar] [CrossRef]
  7. Cueto, M.; Jensen, P.R.; Fenical, W. N-methylsansalvamide, a cytotoxic cyclic depsipeptide from a marine fungus of the genus Fusarium. Phytochemistry 2000, 55, 223–226. [Google Scholar] [CrossRef]
  8. Park, J.; Moon, S.K.; Lee, C. N-methylsansalvamide elicits antitumor effects in colon cancer cells in vitro and in vivo by regulating proliferation, apoptosis, and metastatic capacity. Front. Pharmacol. 2023, 14, 1146966. [Google Scholar] [CrossRef] [PubMed]
  9. Kheiralla, Z.H.; El-Gendy, N.S.; Ahmed, H.A.; Shaltout, T.H.; Hussein, M.M.D. One-factor-at-a-time (OFAT) optimization of hemicellulases production from Fusarium moniliformein submerged fermentation. Energ. Source Part A 2018, 40, 1877–1885. [Google Scholar] [CrossRef]
  10. Guo, F.Z.; Zheng, H.R.; Cheng, Y.W.; Song, S.; Zheng, Z.X.; Jia, S. Medium optimization for epsilon-poly-L-lysine production by Streptomyces diastatochromogenes using response surface methodology. Lett. Appl. Microbiol. 2018, 66, 124–131. [Google Scholar] [CrossRef]
  11. Liu, Y.Y.; Xu, M.J.; Tang, Y.Q.; Shao, Y.L.; Wang, H.; Zhang, H.W. Genome features and antiSMASH analysis of an endophytic strain Fusarium sp. R1. Metabolites 2022, 12, 521. [Google Scholar] [CrossRef] [PubMed]
  12. Xie, L.; Xie, J.; Chen, X.; Tao, X.; Xie, J.; Shi, X.; Huang, Z. Comparative transcriptome analysis of Monascus purpureus at different fermentation times revealed candidate genes involved in exopolysaccharide biosynthesis. Food Res. Int. 2022, 160, 111700. [Google Scholar] [CrossRef]
  13. Daniel, R.M.; Danson, M.J. Temperature and the catalytic activity of enzymes: A fresh understanding. FEBS Lett. 2013, 587, 2738–2743. [Google Scholar] [CrossRef] [PubMed]
  14. Xu, X.; Chu, X.; Du, B.; Huang, C.; Xie, C.; Zhang, Z.; Jiang, L. Functional characterization of a novel violacein biosynthesis operon from Janthinobacterium sp. B9-8. Appl. Microbiol. Biotechnol. 2022, 106, 2903–2916. [Google Scholar] [CrossRef] [PubMed]
  15. Zhang, X.; Li, X.; Zhao, X.; Li, Y. Factors affecting the efficiency of a bioelectrochemical system: A review. RSC Adv. 2019, 9, 19748–19761. [Google Scholar] [CrossRef] [PubMed]
  16. Long, R.; Yang, W.; Huang, G. Optimization of fermentation conditions for the production of epothilone B. Chem. Biol. Drug Des. 2020, 96, 768–772. [Google Scholar] [CrossRef] [PubMed]
  17. Kumar, V.; Ahluwalia, V.; Saran, S.; Kumar, J.; Patel, A.K.; Singhania, R.R. Recent developments on solid-state fermentation for production of microbial secondary metabolites: Challenges and solutions. Bioresour. Technol. 2021, 323, 124566. [Google Scholar] [CrossRef] [PubMed]
  18. Hammarlund, E.U.; Flashman, E.; Mohlin, S.; Licausi, F. Oxygen-sensing mechanisms across eukaryotic kingdoms and their roles in complex multicellularity. Science 2020, 370, eaba3512. [Google Scholar] [CrossRef]
  19. Singh, V.; Haque, S.; Niwas, R.; Srivastava, A.; Pasupuleti, M.; Tripathi, C.K. Strategies for fermentation medium optimization: An in-depth review. Front. Microbiol. 2016, 7, 2087. [Google Scholar] [CrossRef]
  20. He, H.; Li, Y.; Zhang, L.; Ding, Z.; Shi, G. Understanding and application of Bacillus nitrogen regulation: A synthetic biology perspective. J. Adv. Res. 2023, 49, 1–14. [Google Scholar] [CrossRef]
  21. Kang, H.S.; Kim, E.S. Recent advances in heterologous expression of natural product biosynthetic gene clusters in Streptomyces hosts. Curr. Opin. Biotechnol. 2021, 69, 118–127. [Google Scholar] [CrossRef] [PubMed]
  22. Lee, H.S.; Phat, C.; Nam, W.S.; Lee, C. Optimization of culture conditions of Fusarium solani for the production of neoN-methylsansalvamide. Biosci. Biotechnol. Biochem. 2014, 78, 1421–1427. [Google Scholar] [CrossRef] [PubMed]
Figure 1. Chemical structure of N-methylsansalvamide (SA).
Fermentation 10 00140 g001
Figure 2. HPLC profile of crude extract of strain R1 (a) and standard curve for SA (b). *, multiplication sign.
Fermentation 10 00140 g002
Figure 3. Effects of fermentation conditions on SA production using the OFAT approach. (a) Fermentation time; (b) temperature; (c) initial pH; (d) seed age; (e) inoculum size; (f) loading volume; (g) sea salt concentration.
Fermentation 10 00140 g003
Figure 4. Effects of carbon and nitrogen sources on SA yield. (A) Carbon sources: A-a refined sugar, A-b glucose, A-c maltose, A-d glycerin, A-e sucrose, and A-f lactose. (B) Nitrogen sources, B-a beef extract, B-b yeast extract, B-c water-soluble soybean meal, B-d soy peptone, B-e soy bean flour, B-f tryptone, B-g casein peptone, B-h tryptone, and yeast extract.
Fermentation 10 00140 g004
Figure 5. 3D response surface for SA production by strain R1. (a) Interaction between yeast extract and sucrose; (b) interaction between sucrose and tryptone; (c) interaction between tryptone and yeast extract. The highest values of SA production are indicated by the red notes in the center of the 3D response, and the other red notes is the experimental design points. The color of the circle means the production of SA, i.e., the closer the color is close to red, the higher production is.
Fermentation 10 00140 g005
Figure 6. Corresponding contour lines for SA production by strain R1. (a) Interaction between yeast extract and sucrose; (b) interaction between sucrose and tryptone; (c) interaction between tryptone and yeast extract. The highest values of SA production are indicated by the red notes close to the “5”. The color of the circle means the production of SA, i.e., the closer the color is close to red, the higher production is.
Fermentation 10 00140 g006
Table 1. Factors and levels of the Plackett–Burman design.
FactorCodeLevels (g/L)
−11
SucroseA10.020.0
Yeast ExtractB1.03.0
TryptoneC2.010.0
Table 2. Experimental design of the steepest ascent method.
RunSucrose (g/L)Yeast Extract (g/L)Tryptone (g/L)
115.02.06.0
217.51.310.0
320.00.614.0
422.50.018.0
525.00.022.0
Table 3. Levels and codes of variables used for the Box–Behnken design.
FactorCodeLevels (g/L)
−101
SucroseA17.520.022.5
Yeast ExtractB0.00.61.2
TryptoneC10.014.018.0
Table 4. Plackett–Burman design factor and level table (n = 9).
RunSucrose (g/L)Yeast Extract (g/L)Tryptone (g/L)SA Yield (mg/L)
11−11252.16 ± 47.92
2−111166.16 ± 36.95
3−11−1117.98 ± 7.26
411−178.42 ± 3.37
51−1−151.87 ± 15.95
6−1−11193.20 ± 40.28
7−111166.16 ± 36.95
8−1−1−162.70 ± 4.22
9−1−1−162.72 ± 4.30
1011−178.46 ± 2.78
11111127.88 ± 12.66
121−11252.09 ± 20.33
Table 5. Regression analysis of the Plackett–Burman design.
Codet TestpSignificance
Sucrose0.510.6253
Yeast Extract−0.990.3522
Tryptone4.990.0011
Table 6. The results of the steepest ascent experiment.
RunSucrose (g/L)Yeast Extract (g/L)Tryptone (g/L)SA Yield (mg/L)
115.02.06.0124.46 ± 29.43
217.51.310.0235.21 ± 10.30
320.00.614.0385.33 ± 14.72
422.50.018.0380.16 ± 10.02
525.00.022.0174.23 ± 36.71
Table 7. The Box–Behnken design and the corresponding results.
RunSucrose (g/L)Yeast Extract (g/L)Tryptone (g/L)SA Yield (mg/L)
11−10466.08 ± 40.67
2101445.36 ± 0.75
3−101432.88 ± 48.14
4000515.68 ± 21.21
5000471.36 ± 14.85
60−1−1328.08 ± 21.44
7000517.52 ± 18.83
8−1−10484.64 ± 11.47
901−1367.68 ± 27.35
10−10−1364.72 ± 24.64
110−11488.40 ± 5.72
12−110524.72 ± 7.55
13000537.36 ± 18.32
14011268.00 ± 19.87
1510−1198.88 ± 2.78
16110230.96 ± 21.64
17000517.52 ± 28.04
Table 8. Regression coefficient of Box-Behnken design.
SourceSum of SquaresdfMean SquareF-Valuep-Value
Model1.757 × 105919,519.7510.030.0030significant
A27,107.23127,107.2313.930.0073
B17,656.96117,656.969.080.0196
C17,604.38117,604.389.050.0197
AB18,933.76118,933.769.730.0168
AC7949.5117949.514.090.0829
BC16,900.00116,900.008.690.0215
A28127.1418127.144.180.0802
B27200.6517200.653.700.0958
C248,652.46148,652.4625.010.0016
Residual13,617.5471945.36
Lack of fit11,248.3833749.466.330.0533not significant
Pure Error2369.164592.29
Cor Total1.893 × 10816
Disclaimer/Publisher’s Note: The statements, opinions and data contained in all publications are solely those of the individual author(s) and contributor(s) and not of MDPI and/or the editor(s). MDPI and/or the editor(s) disclaim responsibility for any injury to people or property resulting from any ideas, methods, instructions or products referred to in the content.

