Abstract
The specific branches of industry utilize needle coke, a carbon form with a highly anisotropic structure. Searching for novel raw materials for its production is now rigorously studied. In the present work, we use low-sulfur gasoil for this purpose, namely its high-boiling fractions. We study their chemical and physicochemical parameters with the set of physicochemical and spectral methods. The data of FT-IR and UV-Vis spectroscopies with a phenomenological method (that allows assessing average electronic structure parameters) indicate that the gas oil of the West Siberian origin contains polycyclic aromatic hydrocarbons (PAHs) with 3–5 condensed benzene rings. The maximum amount of PAHs with molecular masses of 400–600 a.u. is contained in the fractions with boiling points higher than 450 °C. According to the data of polarized-light optical microscopy, the higher boiling point of the gasoil fraction the higher anisotropy of the produced coke. This occurs as a result of an increase in the amount of PAHs capable of condensation with the formation of a mesophase. Thus, low-sulfur gas oils from thermally processed West Siberian oil are promising raw materials for the production of needle coke in delayed coking processes.
1. Introduction
Structural features and especially anisotropy play important roles in the chemistry of carbon (nano)materials and their applications, including fullerenes and their derivatives [1,2,3,4,5], nanotubes [6], carbon nanoclusters [7,8,9,10], carbon-rich PAHs [11], coke [12,13], other crystalline forms of carbon [1,2], etc. Targeted syntheses of the carbon forms with tunable structure allows, in turn, tuning physical and chemical properties relevant to the applications.
As is known, carbon is a typical source for electrode materials required in electrometallurgy [14]. High-quality graphite electrodes are usually produced by roasting and graphitizing coke [14]. Here, the high-quality implies the high-crystallinity of the used graphite, and needle coke is typically used in this field [15]. The better the structure of needle coke, the higher the thermal stability and electrical properties of graphite electrodes made from it [16]. Needle coke is an anisotropic carbon form with a high carbon–hydrogen ratio, low content of sulfur, heteroatoms and metal impurities, high density, electrical conductivity, enhanced texture, and low thermal expansion coefficient [15]. Coke produced in a delayed coking setup from petroleum feedstock is crucially interesting [17]. As found, the hydrotreated fractions of catalytic cracking (low-sulfur petroleum gas oils from thermal cracking and decantoils) are promising as raw materials, as such low-sulfur hydrocarbon fractions contain larger amounts of condensed polycyclic aromatic hydrocarbons (PAHs) with 3–7 aromatic rings [18,19]. Such PAHs are able to form pitches and liquid crystal spheres of the mesophase upon the thermal condensation at the temperatures above 400–500 °C [20,21] (this was first discovered by Brooks and Taylor [22]). It was shown [23] that the sizes of PAHs appropriate for the formation of mesophase spheres are 6–15 Å and the molecular weight reaches 150–800 a.u. It should be noted that the formation of highly ordered liquid crystal structures at high temperatures >300 °C is thermodynamically favorable. Furthermore, it is a general feature of self-organization of various carbon (nano)forms [9,10,11].
Due to the above, in the present work, we have studied the structural and chemical characteristics of the fractions of low-sulfur gasoil having a destructive origin and their effect on the structure of the produced needle coke.
Notably, the properties of the gasoil depend on the original row material, viz. oil, and we use the products obtained from the Western Siberia oil in this work. Thus, the corresponding objects of the research are low-sulfur gasoil and narrow fractions obtained from it and having the boiling points of 200–500 °C. The physicochemical properties of the starting gasoil, determined with standard techniques (see below), and the group composition (the liquid chromatography data) are shown in Table 1 and Table 2.

Table 1.
Physicochemical parameters of original low-sulfur gasoil.

Table 2.
Group hydrocarbon content of original gasoil.
2. Experimental Part
The fractional composition of the samples of high-viscosity oils was performed using ASTM D2892-18 Standard Test Method for Distillation Crude Petroleum (15-Theoretical Plate Column). The narrow fractions (<350 °C, 350–400 °C, 400–450 °C, and >450 °C) were produced with the Automaxx ASTM D5236-2018 Standard Test Method for Distillation of Heavy Hydrocarbon Mixtures (Vacuum Potstill Method). We additionally used apparatus I-Fisher DIST D-2892/5236 CC (Waldbüttelbrunn, Germany) in the temperature range 200–400 °C, which allows separating oil fractions with the difference in boiling points of 20 °C.
We perform coking in a laboratory setup with an ampoule-type quartz isothermal microreactor with a capacity of 70 mL (Figure 1). The conditions of the process are 480 °C for 2 h and atmospheric pressure.
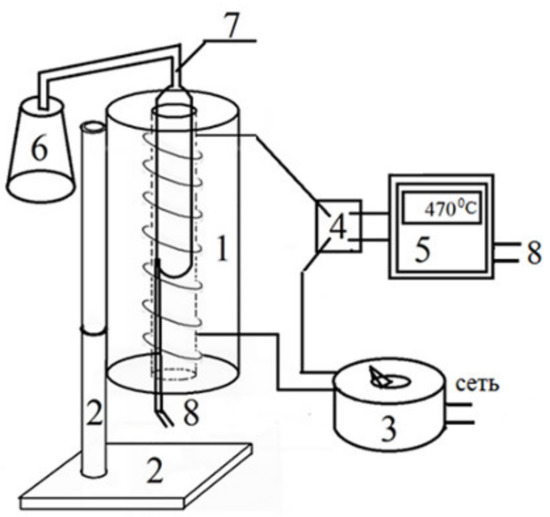
Figure 1.
The laboratory setup for coking heavy oil residues: reactor and coking oven (1); furnace mounting bracket (2); step-down voltage transformer (3); relay switch (4); temperature control controller (5); receiving container for distillate (6); container for loading raw materials (7); and thermocouple (8).
3. Results and Discussion
The yields and properties of the narrow fractions of the original gasoil are collected in Table 3.

Table 3.
Physicochemical properties of the narrow fractions of the original gasoil.
We have studied the original gasoil with the set of absorption spectroscopy techniques, UV-vis and FTIR, using spectrometer Shimadzu IRAffinity-1S. Gas oil and its fractions with the boiling points <450 °C were deposited as a thin film on the KBr plates. In the case of the fraction >450 °C, its toluene solution was applied to the transparent plate, which was then dried at 100 °C. The IR spectrum of the gasoil is shown in Figure 2. The IR features of the gasoil fractions are presented in Figure 3. The associated numerical data are collected in Table 4 and Table 5.
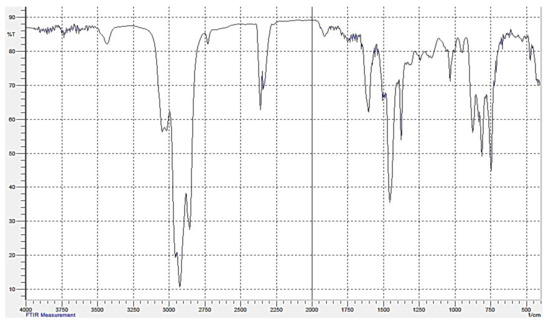
Figure 2.
IR spectrum of the original gasoil.
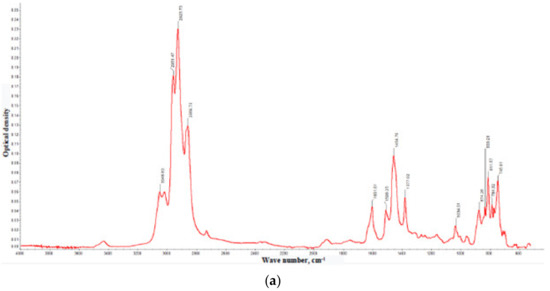
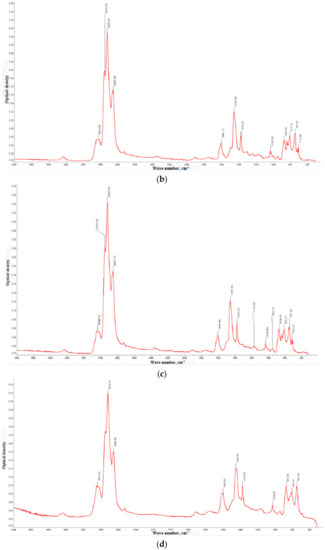
Figure 3.
IR spectra of the gasoil fractions with boiling points: <350 °C (a), 350–400 °C (b), 400–450 °C (c), and >450 °C (d). The comparison of the optical densities at the characteristic IR bands are collected in Table 5.

Table 4.
Chemical deciphering the IR spectrum of the gasoil.

Table 5.
IR spectral features of the gasoil fractions.
The informative IR measurements relate to the fingerprints ranges: 3600–3200, 1900–1500, 1400–1300, and 1160–800 cm−1. The attributions of the bands are shown in Table 4. In general, the IR spectra of the gasoil contain the bands attributed to the vibrations characteristic of C–H bonds where carbon atoms are parts of the mono- and polycyclic aromatic cores [24]. Notably, the band at 1600 cm−1 is characteristic of the ‘pulsating’ vibrations of the carbon skeleton of condensed benzene rings. Its intensity increases with the boiling point of the fraction. This fact suggests that the highly boiling fractions contains larger amounts of PAHs. Thus, the IR data indicate aromatic compounds as the main component of the gasoil. This agrees well with the results of the liquid-chromatography estimates of aromatic fraction equal to ~70% (Table 2).
Optical electronic absorption spectra of the gasoil and its fractions were studied by phenomenological methods without isolating individual bands from a wide spectrum signal [25,26]. In line with these techniques, we focused on the broadband signals, which could be informative for assessing the average parameters relating to the electronic structure of the molecules. The UV-vis spectra in the absorption range 280–580 nm were registered with spectrophotometer SF 2000-1, which allows measurements in the UV and visible regions (Figure 4).
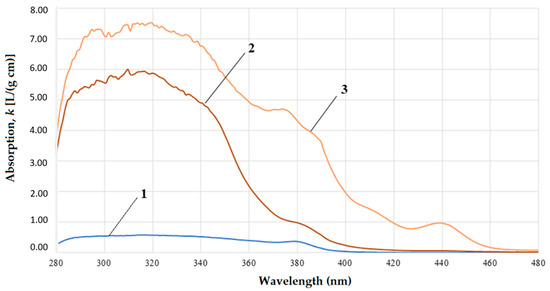
Figure 4.
UV-vis spectra of the gasoil fractions: lower 350 °C (1); fraction 350–400 °C (2); and fraction 400–450 °C (3).
The following regularity was found for all spectra of the original gasoil and its narrow fractions (Figure 4 and Figure 5). There is a pronounced bathochromic shift of the spectra with increasing boiling point of the samples is observed. In addition, with an increase in the boiling point, a hyperchromic effect is observed. It consists in the intensity increase in the entire absorption range.
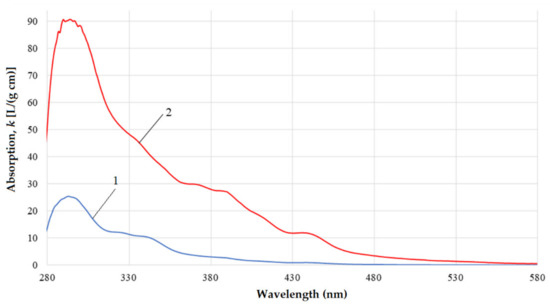
Figure 5.
(Line 1) UV-vis spectra of the original gasoil versus (Line 2) its fraction with boiling point higher than 450 °C.
It is known [24] that the optical absorption of the three-ring peri- and catha-condensed aromatic molecules is usually observed in the range before 380–400 nm. The absorption of the four- and five-ring polycyclic aromatic hydrocarbons (PAHs) of the peri-type relates to the region >400 nm [24]. This allows attribution of the band at 500–580 nm we observe in the spectrum of the high-boiling gasoil fraction (>450 °C) to the light absorption and scattering of small amounts of resinous substances containing 5 or more condensed benzene rings. Table 6 summarizes characteristic pictures of the studied gasoil and its fractions.

Table 6.
Parameters of the broad lines of the absorption spectra of the gasoil and its narrow fraction studied in the work *.
Bathochromic shift is usually observed in the relevant aromatic hydrocarbon systems when alkyl substituents or substituents with double/triple bonds or a lone electron pair is boned with the benzene ring [27]. This is observed in our case. When the boiling point increases, the band shifts to longer wavelengths up to 500–580 nm. In the residue with the boiling point >450 °C, a bathochromic shift occurs up to 580 nm. Such a shift in the spectra of high-boiling fractions can be explained by the appearance of K-bands relating to the π → π* chromophores of conjugated organic systems of polycyclic aromatic compounds and asphalt-resinous substances [27,28,29].
Additionally, we found that weak hyperchromism is typical for medium-boiling fractions (350–400 °C). It can be numerically described with the integral dipole oscillator strength (DOS), which is the area under the signal in the its absorption range. Integral DOS was assessed by numerical integration of the spectrum in the range of 280–420 nm and calculated using the following formula:
where is integral DOS calculated with the use of the absorption coefficients, and are the upper and lower bounds of the spectral range, and is the number of the peaks. Note that and λ1 are expressed in g nm L−1 cm−1 and nm, respectively.
The average molecular mass () of PAHs with the number of the rings greater than three was estimated with the empirical relation [20]:
where is integral DOS in the range of 380–420 nm. According to Equation (2), the average molecular mass of the original gasoil equals 368 a.u. The values of the fractions are shown in Table 7.

Table 7.
Effective ionization potentials (IP) and electron affinities (EA) of the studied gasoil fractions.
The average ionization potentials (IP) and electron affinities (EA) of the molecules were deduced from the electronic absorption spectra in the range of 380–420 nm. Here, we also used the known empirical dependences [19], linking these parameters with the logarithmic integral molar absorptivity :
where is the energy (in eV) of the frontier orbital corresponding to IP or EA; and are empirical coefficients (eV/nm) dependent on the type of the orbital. These values remains constant for the molecules of the same series (Table 6). The values (in nm) are calculated as:
where is the molar absorbance at the wavelength , 10−1 m2 mol−1; and are wavelengths (in nm) defining the bounds of the spectra in UV and/or visible regions.
We numerically calculated the integral function of Equation (4) as the square under the absorption curve as:
where and denote the margins of the spectrum whereas k is the number of the studied points on the spectral curve.
The IP and EA values are estimated via the empirical equations below known from [22,23]:
where is the integral logarithmic molecular absorbance corresponding to the range of 280–480 nm. Table 6 summarizes the results of the estimates of IP and EA deduced from as described above. In general, such empirical techniques allows fast estimating average electronic properties of the gasoil fractions.
The obtained frontier orbital estimates suggest that the components of the low-boiling fraction (<350 °C) have average IP equal to 8.84–9.04 eV. This is typical range for aromatic hydrocarbons with 1–2 benzene rings. Similar structural indications (up to 2 benzene rings in the molecules) are in the case of fraction 350–400 °C that contains the components with the average IP = 8.37–8.47 eV. The number of benzene rings increase for the next fraction, 400–450 °C: average IP values (8.10–8.30 eV) correspond to up to 3 benzene rings per molecule. Expectedly, in the case of the high-boiling fraction, average IP goes down (7.60–7.76 eV), which corresponds to the PAHs with up to 4 benzene rings. Thus, high-boiling fractions contain maximal content of PAHs necessary for the coking process with enhanced yield and properties of coke. Notably, only high-boiling fractions of the gasoil are worthy to use in the coke process due to high contents of aromatic precursors.
We have applied our laboratory setup to the original gasoil and its fractions to convert it to coke. The process of coking was performed at 480 °C in 2 h. The results are shown in Table 8.

Table 8.
The yield of coke measured on the laboratory setup.
To study the structural features of the formed coke, we have applied the polarizing microscopy using polarizing microscope Axio Observer Carl Zeiss Microscopy. Using this technique, we have found that the obtained coke samples have anisotropic microstructure. Additionally, the amount of mesophase increases with the boiling point of the fractions. The corresponding microscopy images of cokes are shown in Figure 5.
Visually analyzing the photographs (Figure 6), we found the following regularity: the higher boiling point of the gasoil fraction the higher anisotropy of the produced coke. This result is due to the fact that mesogenic PAHs capable of condensation reactions required for coke structure formation increase with the boiling points of the fractions.

Figure 6.
The photographs of the coke mesophases obtained in the polarized light, scale 100 μm: (a) coke produced from the low-sulfur gasoil (b) coke produced from the gasoil fraction boiling at 400–450 °C and (c) coke produced from the gasoil high-boiling fraction (>450 °C).
4. Conclusions
We have studied the samples of low-sulfur gasoil from Western Siberian oil and its narrow fractions with the set of relevant physicochemical techniques. Based on them, we have identified the content of the naphthene and benzene aromatic hydrocarbons as well as their alkylated derivatives. PAHs have molecular masses 250–400 a.u. These aromatic structures contain 3–5 condensed benzene rings and their number increases for the fraction boiling at >450 °C. We see this fact is responsible for enhancing carbonization process and we have demonstrated that the anisotropy of coke increases with the boiling point of the fraction as the fraction contains higher amounts of PAHs capable for condensation reactions.
We propose that the results of the study will be useful for developing technological approaches to production of needle coke having highly anisotropic structure.
Author Contributions
Conceptualization, M.Y.D., A.F.A. and D.S.S.; methodology, M.Y.D. and A.F.A.; software, D.Z.B., A.A.T. and V.P.Z.; validation, M.M.D. and D.F.O.; formal analysis, M.Y.D. and D.Z.B.; investigation, M.Y.D. and D.Z.B.; writing—original draft preparation, M.Y.D. and D.Z.B.; writing—review and editing, A.F.A. and D.S.S.; visualization, M.Y.D. and A.A.T.; supervision, A.F.A. All authors have read and agreed to the published version of the manuscript.
Funding
This research received no external funding.
Data Availability Statement
Not applicable.
Conflicts of Interest
The authors declare no conflict of interest.
References
- Diana, N.; Yamada, Y.; Gohda, S.; Ono, H.; Kubo, S.; Sato, S. Carbon materials with high pentagon density. J. Mater. Sci. 2020, 56, 2912–2943. [Google Scholar] [CrossRef]
- Feng, B.; Zhuang, X. Carbon-Enriched meso-Entropy Materials: From Theory to Cases. Acta Chim. Sin. 2020, 78, 833. [Google Scholar] [CrossRef]
- Ariga, K.; Shrestha, L.K. Fullerene Nanoarchitectonics with Shape-Shifting. Materials 2020, 13, 2280. [Google Scholar] [CrossRef] [PubMed]
- Shrestha, R.L.; Shrestha, T.; Tamrakar, B.M.; Shrestha, R.G.; Maji, S.; Ariga, K.; Shrestha, L.K. Nanoporous Carbon Materials Derived from Washnut Seed with Enhanced Supercapacitance. Materials 2020, 13, 2371. [Google Scholar] [CrossRef]
- Sabirov, D.S.; Terentyev, A.O.; Bulgakov, R.G. Counting the Isomers and Estimation of Anisotropy of Polarizability of the Selected C60 and C70 Bisadducts Promising for Organic Solar Cells. J. Phys. Chem. A 2015, 119, 10697–10705. [Google Scholar] [CrossRef]
- Wang, Q.-E.; Niu, H.; Wang, Y.; Li, C. Carbon nanotubes modified nanocomposites based on liquid crystalline elastomers. Mol. Cryst. Liq. Cryst. 2021, 1–39. [Google Scholar] [CrossRef]
- Sabirov, D.S.; Terentyev, A.O.; Bulgakov, R.G. Polarizability of fullerene [2+2]-dimers: A DFT study. Phys. Chem. Chem. Phys. 2014, 16, 14594–14600. [Google Scholar] [CrossRef]
- Pankratyev, E.Y.; Tukhbatullina, A.A.; Sabirov, D.S. Dipole polarizability, structure, and stability of [2+2]-linked fullerene nanostructures (C60)n (n ≤ 7). Phys. E Low Dimens. Syst. Nanostructures 2017, 86, 237–242. [Google Scholar] [CrossRef]
- Hong, I.-H.; Gao, C.-J. Large area self-ordered parallel C60 molecular nanowire arrays on Si(110) surfaces. Carbon 2016, 107, 925–932. [Google Scholar] [CrossRef]
- Huber, S.; Gatchell, M.; Zettergren, H.; Mauracher, A. A precedent of van-der-Waals interactions outmatching Coulomb explosion. Carbon 2016, 109, 843–850. [Google Scholar] [CrossRef] [Green Version]
- Cataldo, F.; García-Hernández, D.A.; Manchado, A. Asphaltenes as model compounds of the UIBs/AIBs detected in various astrophysical objects. Part 2. Natural bitumens asphaltenes carbonization. Full Nanotub. Carbon Nanostructures 2021, 1–13. [Google Scholar] [CrossRef]
- Hu, C.; Chu, H.; Zhu, Y.; Xu, Y.; Cheng, J.; Gao, L.; Lai, S.; Zhao, X. Differences and correlations between microstructure and macroscopic properties of mesophase cokes derived from the components of high temperature coal tar pitch. Fuel 2021, 310, 122330. [Google Scholar] [CrossRef]
- Zang, Z.; Lou, B.; Zhao, N.; Yu, E.; Wang, Z.; Du, H.; Chen, Z.; Liu, D. Co-carbonization behavior of the blended heavy oil and low temperature coal tar for the preparation of needle coke. Fuel 2021, 302, 121139. [Google Scholar] [CrossRef]
- Babich, A.; Senk, D. Coke in the iron and steel industry. In New Trends in Coal Conversion; Elsevier BV: Amsterdam, The Netherlands, 2019; pp. 367–404. [Google Scholar]
- Halim, H.P.; Im, J.S.; Lee, C.W. Preparation of needle coke from petroleum by-products. Carbon Lett. 2013, 14, 152–161. [Google Scholar] [CrossRef] [Green Version]
- Platon, A.; Dumbrava, A.; Iutes-Petrescu, N.; Simionescu, L. Improved technology for manufacture of carbon electrodes. J. Chem. Sci. 2000, 112, 19–26. [Google Scholar] [CrossRef] [Green Version]
- Rodríguez-Reinoso, F.; Santana, P.; Palazon, E.; Diez, M.-A.; Marsh, H. Delayed coking: Industrial and laboratory aspects. Carbon 1998, 36, 105–116. [Google Scholar] [CrossRef]
- Li, M.; Liu, D.; Du, H.; Li, Q.; Hou, X.; Ye, J. Preparation of mesophase pitch by aromatics-rich distillate of naphthenic vacuum gas oil. Appl. Petrochem. Res. 2015, 5, 339–346. [Google Scholar] [CrossRef] [Green Version]
- Gabdulkhakov, R.R.; Rudko, V.A.; Pyagay, I.N. Methods for modifying needle coke raw materials by introducing additives of various origin (review). Fuel 2021, 310, 122265. [Google Scholar] [CrossRef]
- Yuan, G.; Cui, Z. Preparation, characterization, and applications of carbonaceous mesophase: A review. In Liquid Crystals and Display Technology; IntechOpen: London, UK, 2020. [Google Scholar]
- Wang, C.Y. Theory and Application of Carbonaceous Mesophase; Science Press: Beijing, China, 2015; ISBN 978-7-03-045750-9. [Google Scholar]
- Brooks, J.D.; Taylor, G.H. Formation of Graphitizing Carbons from the Liquid Phase. Nature 1965, 206, 697–699. [Google Scholar] [CrossRef]
- White, J.L.; Price, R.J. The Formation of Mesophase Microstructures during the Pyrolysis of Selected Coker Feedstocks. Carbon 1974, 12, 321–333. [Google Scholar] [CrossRef]
- Gauglitz, G.; Moore, D.S. (Eds.) Handbook of Spectroscopy; Wiley: Weinheim, Germany, 2014. [Google Scholar]
- Dolomatov, M.Y.; Mukaeva, G.R. Electronic Spectroscopy Method for Determining the Ionization Potentials and Electron Affinities of the Molecules of Aromatic Compounds. J. Appl. Scpectrosc. 1992, 56, 570–574. (In Russian) [Google Scholar] [CrossRef]
- Dolomatov, M.Y.; Mukaeva, G.R.; Shulyakovskaya, D.O. Electron Phenomenological Spectroscopy and its Application in Investigating Complex Substances in Chemistry, Nanotechnology and Medicine. J. Mater. Sci. Eng. B 2013, 3, 183–199. [Google Scholar]
- Thomas, O.; Brogat, M. Organic constituents. In UV-Visible Spectrophotometry of Water and Wastewater; Thomas, O., Burgess, C., Eds.; Elsevier: Amsterdam, The Netherlands, 2017; pp. 73–138. [Google Scholar]
- De Proft, F.; Geerlings, P. Conceptual and Computational DFT in the Study of Aromaticity. Chem. Rev. 2001, 101, 1451–1464. [Google Scholar] [CrossRef] [PubMed]
- Sabirov, D. A correlation between the mean polarizability of the “kinked” polycyclic aromatic hydrocarbons and the number of H…H bond critical points predicted by Atoms-in-Molecules theory. Comput. Theor. Chem. 2014, 1030, 81–86. [Google Scholar] [CrossRef]
Publisher’s Note: MDPI stays neutral with regard to jurisdictional claims in published maps and institutional affiliations. |
© 2022 by the authors. Licensee MDPI, Basel, Switzerland. This article is an open access article distributed under the terms and conditions of the Creative Commons Attribution (CC BY) license (https://creativecommons.org/licenses/by/4.0/).