
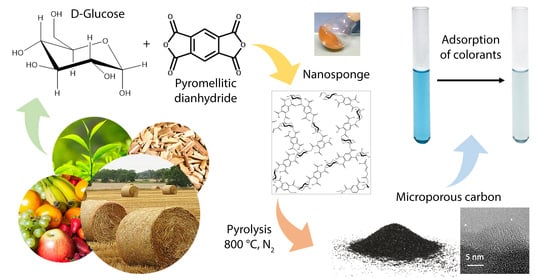
Preparation and Carbonization of Glucose and Pyromellitic Dianhydride Crosslinked Polymers

 ,
,  ,
,
Abstract
:
1. Introduction
2. Materials and Methods
2.1. Synthesis of Nanosponges
2.2. Nanosponges-Derived Carbon Materials
2.3. Characterization Methods
3. Results and Discussion
4. Conclusions
Supplementary Materials
Author Contributions
Funding
Institutional Review Board Statement
Data Availability Statement
Acknowledgments
Conflicts of Interest
References
- Yahya, M.A.; Al-Qodah, Z.; Ngah, C.W.Z. Agricultural bio-waste materials as potential sustainable precursors used for activated carbon production: A review. Renew. Sustain. Energy Rev. 2015, 46, 218–235. [Google Scholar] [CrossRef]
- Lee, J.; Kim, J.; Hyeon, T. Recent Progress in the Synthesis of Porous Carbon Materials. Adv. Mater. 2006, 18, 2073–2094. [Google Scholar] [CrossRef]
- Inagaki, M.; Tascón, J.M.D. Chapter 2 Pore formation and control in carbon materials. In Activated Carbon Surfaces in Environmental Remediation; Bandosz, T.J., Ed.; Elsevier: Amsterdam, The Netherlands, 2006; Volume 7, pp. 49–105. [Google Scholar] [CrossRef]
- McNaught, A.D.; Wilkinson, A. Compendium of Chemical Terminology; International Union of Pure and Applied Chemistry (IUPAC): Durham, NC, USA, 2019; Volume 1669. [Google Scholar] [CrossRef]
- Menéndez-Díaz, J.A.; Martin-Gullon, I.M. Chapter 1 Types of carbon adsorbents and their production. In Activated Carbon Surfaces in Environmental Remediation; Bandosz, T.J., Ed.; Elsevier: Amsterdam, The Netherlands, 2006; Volume 7, pp. 1–47. [Google Scholar] [CrossRef]
- Ahmad, M.; Rajapaksha, A.U.; Lim, J.E.; Zhang, M.; Bolan, N.; Mohan, D.; Vithanage, M.; Lee, S.S.; Ok, Y.S. Biochar as a sorbent for contaminant management in soil and water: A review. Chemosphere 2014, 99, 19–33. [Google Scholar] [CrossRef]
- Zhang, X.-Q.; Li, W.-C.; Lu, A.-H. Designed porous carbon materials for efficient CO2 adsorption and separation. New Carbon Mater. 2015, 30, 481–501. [Google Scholar] [CrossRef]
- Gatti, G.; Errahali, M.; Tei, L.; Mangano, E.; Brandani, S.; Cossi, M.; Marchese, L. A Porous Carbon with Excellent Gas Storage Properties from Waste Polystyrene. Nanomater 2019, 9, 726. [Google Scholar] [CrossRef] [Green Version]
- Jung, S.-H.; Kim, J.-S. Production of biochars by intermediate pyrolysis and activated carbons from oak by three activation methods using CO2. J. Anal. Appl. Pyrolysis 2014, 107, 116–122. [Google Scholar] [CrossRef]
- Carrier, M.; Hardie, A.G.; Uras, Ü.; Gorgens, J.; Knoetze, J. Production of char from vacuum pyrolysis of South-African sugar cane bagasse and its characterization as activated carbon and biochar. J. Anal. Appl. Pyrolysis 2012, 96, 24–32. [Google Scholar] [CrossRef]
- Mouritz, A.P.; Gibson, A.G. Thermal Decomposition of Composites in Fire. Fire Prop. Polymer Compos. Mater. 2007, 143, 19–58. [Google Scholar] [CrossRef]
- McEnaney, B.; Mays, T.J. Porosity in Carbons and Graphites. In Introduction to Carbon Science; Marsh, H., Ed.; Butterworths: London, UK, 1989; pp. 153–196. [Google Scholar] [CrossRef]
- Yaashikaa, P.R.; Kumar, P.S.; Varjani, S.; Saravanan, A. A critical review on the biochar production techniques, characterization, stability and applications for circular bioeconomy. Biotechnol. Rep. 2020, 28, e00570. [Google Scholar] [CrossRef] [PubMed]
- Ghodake, G.S.; Shinde, S.K.; Kadam, A.A.; Saratale, R.G.; Saratale, G.D.; Kumar, M.; Palem, R.R.; Al-Shwaiman, H.A.; Elgorban, A.M.; Syed, A.; et al. Review on biomass feedstocks, pyrolysis mechanism and physicochemical properties of biochar: State-of-the-art framework to speed up vision of circular bioeconomy. J. Clean. Prod. 2021, 297, 126645. [Google Scholar] [CrossRef]
- Parker, H.L.; Hunt, A.J.; Budarin, V.L.; Shuttleworth, P.S.; Miller, K.L.; Clark, J.H. The importance of being porous: Polysaccharide-derived mesoporous materials for use in dye adsorption. RSC Adv. 2012, 2, 8992–8997. [Google Scholar] [CrossRef]
- Miyajima, N.; Ishikawa, N.; Sakane, H.; Tanaike, O.; Hatori, H.; Akatsu, T.; Yasuda, E. Effect of iodine treatment on morphological control in carbonization of polysaccharides. Thermochim. Acta 2010, 498, 33–38. [Google Scholar] [CrossRef]
- Caldera, F.; Tannous, M.; Cavalli, R.; Zanetti, M.; Trotta, F. Evolution of Cyclodextrin Nanosponges. Int. J. Pharm. 2017, 531, 470–479. [Google Scholar] [CrossRef] [PubMed]
- Zanetti, M.; Anceschi, A.; Magnacca, G.; Spezzati, G.; Caldera, F.; Rosi, G.P.; Trotta, F. Micro porous carbon spheres from cyclodextrin nanosponges. Microporous Mesoporous Mater. 2016, 235, 178–184. [Google Scholar] [CrossRef]
- Caldera, F.; Pedrazzo, A.R.; Anceschi, A.; Zanetti, M.; Trotta, F.; Chimica, D.D.I.; Torino, U.D.I.; Ciclodestrine, N.D.I. Nanospugne di ciclodestrine. Chim. l’Industria. 2017, 6, 10–16. [Google Scholar]
- Cavalli, R.; Trotta, F.; Tumiatti, W. Cyclodextrin-based Nanosponges for Drug Delivery. J. Incl. Phenom. Macrocycl. Chem. 2006, 56, 209–213. [Google Scholar] [CrossRef]
- Li, D.; Ma, M. Nanosponges for water purification. Clean Technol. Environ. Policy 2000, 2, 0112–0116. [Google Scholar] [CrossRef]
- Mhlanga, S.D.; Mamba, B.B.; Krause, R.W.; Malefetse, T.J. Removal of organic contaminants from water using nanosponge cyclodextrin polyurethanes. J. Chem. Technol. Biotechnol. 2007, 82, 382–388. [Google Scholar] [CrossRef]
- Trotta, F.; Cavalli, R. Characterization and Applications of New Hyper-Cross-Linked Cyclodextrins. Compos. Interfaces 2009, 16, 39–48. [Google Scholar] [CrossRef]
- Anceschi, A.; Binello, A.; Caldera, F.; Trotta, F.; Zanetti, M. Preparation of Microspheres and Monolithic Microporous Carbons from the Pyrolysis of Oligosaccharides Polymer. Molecules 2020, 25, 3034. [Google Scholar] [CrossRef]
- Anceschi, A.; Magnacca, G.; Trotta, F.; Zanetti, M. Preparation and characterization of microporous carbon spheres from high amylose pea maltodextrin. RSC Adv. 2017, 7, 36117–36123. [Google Scholar] [CrossRef] [Green Version]
- Kuang, Y.; Zhang, X.; Zhou, S. Adsorption of Methylene Blue in Water onto Activated Carbon by Surfactant Modification. Water 2020, 12, 587. [Google Scholar] [CrossRef] [Green Version]
- Trotta, F.; Caldera, F.; Cavalli, R.; Mele, A.; Punta, C.; Melone, L.; Castiglione, F.; Rossi, B.; Ferro, M.; Crupi, V.; et al. Synthesis and characterization of a hyper-branched water-soluble β-cyclodextrin polymer. Beilstein J. Org. Chem. 2014, 10, 2586–2593. [Google Scholar] [CrossRef] [PubMed] [Green Version]
- Castiglione, F.; Crupi, V.; Majolino, D.; Mele, A.; Rossi, B.; Trotta, F.; Venuti, V. Effect of Cross-Linking Properties on the Vibrational Dynamics of Cyclodextrins-Based Polymers: An Experimental–Numerical Study. J. Phys. Chem. B 2012, 116, 7952–7958. [Google Scholar] [CrossRef]
- Sanchez, L.A.; Wedgewood, A.R. Fourier Transform IR Spectroscopy Study of the Degradation of Pyromellitic Acid Diester. Appl. Spectrosc. 1987, 41, 479–482. [Google Scholar] [CrossRef]
- Wiercigroch, E.; Szafraniec, E.; Czamara, K.; Pacia, M.Z.; Majzner, K.; Kochan, K.; Kaczor, A.; Baranska, M.; Malek, K.; Wiercigroch, E.; et al. Raman and infrared spectroscopy of carbohydrates: A review. Spectrochim. Acta Part A Mol. Biomol. Spectrosc. 2017, 185, 317–335. [Google Scholar] [CrossRef]
- Cesano, F.; Rahman, M.M.; Bertarione, S.; Vitillo, J.G.; Scarano, D.; Zecchina, A. Preparation and adsorption properties of activated porous carbons obtained using volatile zinc templating phases. Carbon 2012, 50, 2047–2051. [Google Scholar] [CrossRef]
- Cesano, F.; Cravanzola, S.; Brunella, V.; Scarano, D. Porous carbon spheres from poly(4-ethylstyrene-co-divinylbenzene):role of ZnCl2 and KOH agents in affecting porosity, surface area and mechanical properties. Microporous Mesoporous Mater. 2019, 288, 109605. [Google Scholar] [CrossRef]
- Chun, S.-E.; Picard, Y.N.; Whitacre, J.F. Relating Precursor Pyrolysis Conditions and Aqueous Electrolyte Capacitive Energy Storage Properties for Activated Carbons Derived from Anhydrous Glucose-d. J. Electrochem. Soc. 2011, 158, A83–A92. [Google Scholar] [CrossRef]
- Kubota, K.; Shimadzu, S.; Yabuuchi, N.; Tominaka, S.; Shiraishi, S.; Abreu-Sepulveda, M.; Manivannan, A.; Gotoh, K.; Fukunishi, M.; Dahbi, M.; et al. Structural Analysis of Sucrose-Derived Hard Carbon and Correlation with the Electrochemical Properties for Lithium, Sodium, and Potassium Insertion. Chem. Mater. 2020, 32, 2961–2977. [Google Scholar] [CrossRef]
- Myronyuk, I.F.; Mandzyuk, V.I.; Sachko, V.M.; Gun’Ko, V.M. Structural Features of Carbons Produced Using Glucose, Lactose, and Saccharose. Nanoscale Res. Lett. 2016, 11, 1–9. [Google Scholar] [CrossRef] [PubMed] [Green Version]
- Jurkiewicz, K.; Pawlyta, M.; Burian, A. Structure of Carbon Materials Explored by Local Transmission Electron Microscopy and Global Powder Diffraction Probes. C 2018, 4, 68. [Google Scholar] [CrossRef] [Green Version]
- Harris, P.J.F. Fullerene-like models for microporous carbon. J. Mater. Sci. 2012, 48, 565–577. [Google Scholar] [CrossRef]
- Sharma, S.; Kumar, C.S.; Korvink, J.G.; Kübel, C. Evolution of Glassy Carbon Microstructure: In Situ Transmission Electron Microscopy of the Pyrolysis Process. Sci. Rep. 2018, 8, 1–12. [Google Scholar] [CrossRef] [Green Version]
- Harris, P.J.; Tsang, S.C.; Claridge, J.B.; Green, M.L. High-resolution electron microscopy studies of a microporous carbon produced by arc-evaporation. J. Chem. Soc. Faraday Trans. 1994, 90, 2799–2802. [Google Scholar] [CrossRef]
- Ferrari, A.C.; Robertson, J. Interpretation of Raman spectra of disordered and amorphous carbon. Phys. Rev. B 2000, 61, 14095–14107. [Google Scholar] [CrossRef] [Green Version]
- Malard, L.M.; Pimenta, M.A.; Dresselhaus, G.; Dresselhaus, M.S. Raman spectroscopy in graphene. Phys. Rep. 2009, 473, 51–87. [Google Scholar] [CrossRef]
- Pimenta, M.A.; Dresselhaus, G.; Dresselhaus, M.S.; Cancado, L.G.; Jorio, A.; Saito, R. Studying disorder in graphite-based systems by Raman spectroscopy. Phys. Chem. Chem. Phys. 2007, 9, 1276–1290. [Google Scholar] [CrossRef]
- Bokobza, L.; Bruneel, J.-L.; Couzi, M. Raman Spectra of Carbon-Based Materials (from Graphite to Carbon Black) and of Some Silicone Composites. C 2015, 1, 77–94. [Google Scholar] [CrossRef] [Green Version]
- Vidano, R.P.; Fischbach, D.B.; Willis, L.J.; Loehr, T.M. Observation of Raman band shifting with excitation wavelength for carbons and graphites. Solid State Commun. 1981, 39, 341–344. [Google Scholar] [CrossRef]
- Jurkiewicz, K.; Pawlyta, M.; Zygadło, D.; Chrobak, D.; Duber, S.; Wrzalik, R.; Ratuszna, A.; Burian, A. Evolution of glassy carbon under heat treatment: Correlation structure–mechanical properties. J. Mater. Sci. 2017, 53, 3509–3523. [Google Scholar] [CrossRef] [Green Version]
- Cesano, F.; Bertarione, S.; Damin, A.; Agostini, G.; Usseglio, S.; Vitillo, J.G.; Lamberti, C.; Spoto, G.; Scarano, D.; Zecchina, A. Oriented TiO2 Nanostructured Pillar Arrays: Synthesis and Characterization. Adv. Mater. 2008, 20, 3342–3348. [Google Scholar] [CrossRef]
- Cesano, F.; Cravanzola, S.; Brunella, V.; Damin, A.; Scarano, D. From Polymer to Magnetic Porous Carbon Spheres: Combined Microscopy, Spectroscopy, and Porosity Studies. Front. Mater. 2019, 6, 84. [Google Scholar] [CrossRef]
- Diaf, H.; Pereira, A.; Melinon, P.; Blanchard, N.; Bourquard, F.; Garrelie, F.; Donnet, C.; Vondráčk, M. Revisiting thin film of glassy carbon. Phys. Rev. Mater. 2020, 4, 066002. [Google Scholar] [CrossRef]
- Cesano, F.; Uddin, M.J.; Damin, A.; Scarano, D. Multifunctional Conductive Paths Obtained by Laser Processing of Non-Conductive Carbon Nanotube/Polypropylene Composites. Nanomater. 2021, 11, 604. [Google Scholar] [CrossRef]
- Tomczyk, A.; Sokołowska, Z.; Boguta, P. Biochar physicochemical properties: Pyrolysis temperature and feedstock kind effects. Rev. Environ. Sci. Bio/Technol. 2020, 19, 191–215. [Google Scholar] [CrossRef] [Green Version]
- Makrigianni, V.; Giannakas, A.; Deligiannakis, Y.; Konstantinou, I. Adsorption of phenol and methylene blue from aqueous solutions by pyrolytic tire char: Equilibrium and kinetic studies. J. Environ. Chem. Eng. 2015, 3, 574–582. [Google Scholar] [CrossRef]


| Sample | PMDA (g) | GLU (g) | PMDA/GLU Molar Ratio |
|---|---|---|---|
| NS1.5 | 3.677 | 2.042 | 1.5:1 |
| NS2 | 4.856 | 2.132 | 2:1 |
| NS2.5 | 5.939 | 1.909 | 2.5:1 |
| NS3 | 7.088 | 1.981 | 3:1 |
| Sample | N (%) | C (%) | H (%) |
|---|---|---|---|
| NS1.5 | 1.18 ± 0.02 | 49.10 ± 0.40 | 4.60 ± 0.30 |
| NS2 | 1.14 ± 0.01 | 46.70 ± 0.30 | 4.30 ± 0.20 |
| NS2.5 | 1.24 ± 0.01 | 47.08 ± 0.05 | 4.26 ± 0.11 |
| NS3 | 1.04 ± 0.01 | 46.50 ± 0.09 | 3.91 ± 0.09 |
| Sample | Residue (%) |
|---|---|
| NS1.5 | 28 |
| NS2 | 25 |
| NS2.5 | 28 |
| NS3 | 22 |
| PMDA | 0 |
| GLU | 9 |
| Sample | N | C | H |
|---|---|---|---|
| Char1.5 | 1.40 ± 0.20 | 85.00 ± 2.00 | 0.78 ± 0.07 |
| Precursor Molar Ratio | SLangmuir a (m2/g) | SBET a (m2/g) | Smicro b (m2/g) | Vmicro b (cm3/g) | Vtot c (cm3/g) |
|---|---|---|---|---|---|
| 1.5 | 778 | 517 | 515 | 0.2303 | 0.2504 |
| 2 | 633 | 492 | 491 | 0.2231 | 0.2312 |
| 2.5 | 778 | 502 | 500 | 0.2321 | 0.2346 |
| 3 | 778 | 502 | 500 | 0.2386 | 0.2415 |
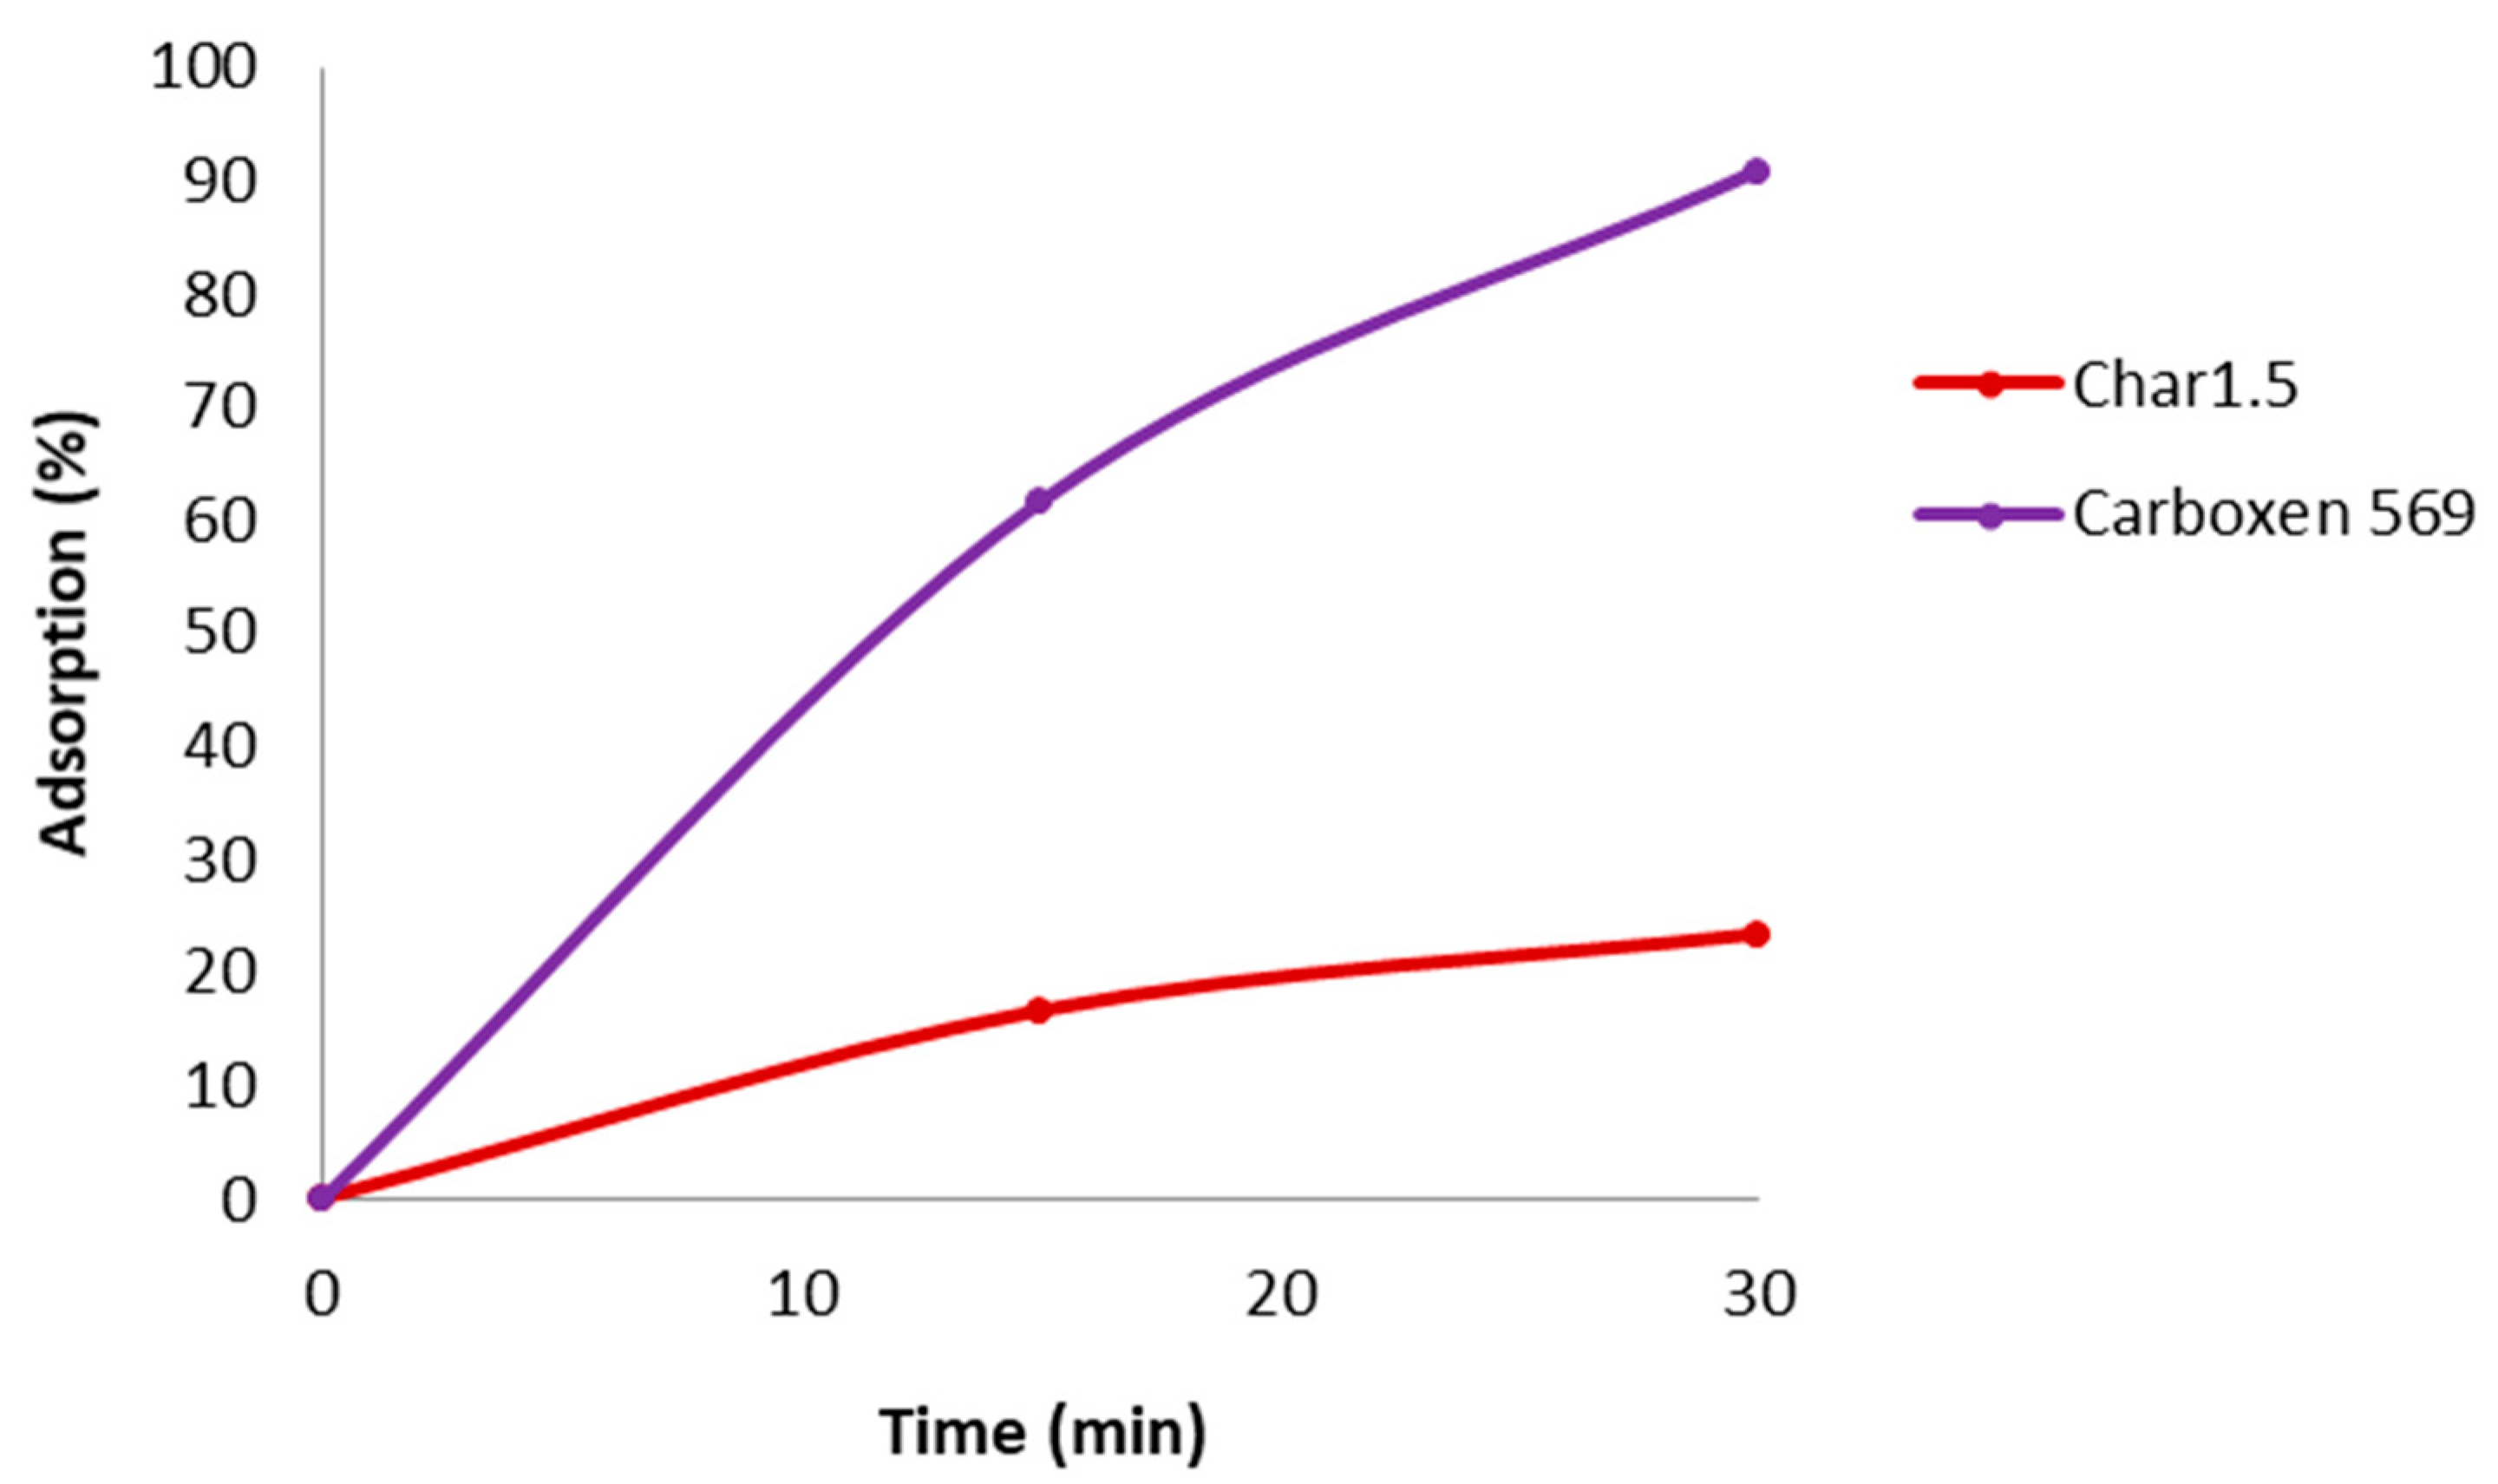
| Time (min) | Removal Percentage (%) | |
|---|---|---|
| Char1.5 | Carboxen 569 | |
| 15 | 16.6 | 61.6 |
| 30 | 23.4 | 90.8 |
Publisher’s Note: MDPI stays neutral with regard to jurisdictional claims in published maps and institutional affiliations. |
© 2021 by the authors. Licensee MDPI, Basel, Switzerland. This article is an open access article distributed under the terms and conditions of the Creative Commons Attribution (CC BY) license (https://creativecommons.org/licenses/by/4.0/).
Share and Cite
Caldera, F.; Moramarco, A.; Cesano, F.; Anceschi, A.; Damin, A.; Zanetti, M. Preparation and Carbonization of Glucose and Pyromellitic Dianhydride Crosslinked Polymers. C 2021, 7, 56. https://doi.org/10.3390/c7030056
Caldera F, Moramarco A, Cesano F, Anceschi A, Damin A, Zanetti M. Preparation and Carbonization of Glucose and Pyromellitic Dianhydride Crosslinked Polymers. C. 2021; 7(3):56. https://doi.org/10.3390/c7030056
Chicago/Turabian StyleCaldera, Fabrizio, Antonella Moramarco, Federico Cesano, Anastasia Anceschi, Alessandro Damin, and Marco Zanetti. 2021. "Preparation and Carbonization of Glucose and Pyromellitic Dianhydride Crosslinked Polymers" C 7, no. 3: 56. https://doi.org/10.3390/c7030056
APA StyleCaldera, F., Moramarco, A., Cesano, F., Anceschi, A., Damin, A., & Zanetti, M. (2021). Preparation and Carbonization of Glucose and Pyromellitic Dianhydride Crosslinked Polymers. C, 7(3), 56. https://doi.org/10.3390/c7030056