Article

Boehm Titration Revisited (Part I): Practical Aspects for Achieving a High Precision in Quantifying Oxygen-Containing Surface Groups on Carbon Materials

Institute for Technical Chemistry and Environmental Chemistry, Center for Energy and Environmental Chemistry Jena (CEEC Jena), Friedrich Schiller University, Philosophenweg 7a, 07743 Jena, Germany
*
Authors to whom correspondence should be addressed.
Submission received: 7 March 2018 / Revised: 28 March 2018 / Accepted: 30 March 2018 / Published: 6 April 2018
(This article belongs to the Special Issue Functional Nanoporous Carbon-Based Materials)

Abstract

:
Practical aspects of the Boehm titration method are evaluated for obtaining reliable results in the quantification of oxygen-containing surface groups in a short time. Analytical criteria such as accuracy, repeatability, precision, and robustness are applied. Oxidized multi-walled carbon nanotubes (MWCNTs) are used as the model substance. Different reaction bases (NaHCO3(aq), Na2CO3(aq), NaOH(aq)) are applied and treatment times are studied. We also show that smaller amounts of carbon material can be reliably analyzed by using an autotitrator combined with a pH electrode. We find that indirect titration with Na2CO3 results in the highest titration precision and accuracy despite the lower base strength compared with NaOH. Therefore, CO2 impurities do not have to be removed and only 7 min is necessary for one titration. The titration error with respect to the proposed method is 0.15% of the aliquot volume. The mixing method during the carbon treatment with bases (stirring, shaking, ultrasound treatment) has no influence on the result as long as one allows a few hours for the reaction to complete. Finally, we provide a standard operating procedure for obtaining results with high precision during Boehm titration.

Graphical Abstract

1. Introduction

The properties of carbon materials can be tailored over a very broad range thanks to their rich structural and compositional diversity. The surface chemistry is essential in many cases and a variety of properties can be adjusted by varying the type and number of functional groups. At the same time, accurate characterization of these functional groups is challenging.
Quantification of specific oxygen-containing surface groups (for brevity, only “surface groups” in the following) is usually done by spectroscopic and thermal analysis. Experimental data from these methods requires careful analysis including baseline correction and deconvolution, which can lead to misinterpretations and low reproducibility. A higher reliability would be obtained by measurement of absolute values. This can be realized with chemical analysis. One of the methods which quantifies surface groups on carbon materials is Boehm titration (BT) [1,2,3]. Despite this promise, it is quite surprising that this method is only seldomly used in research labs. Here, we discuss practical aspects of the BT method for achieving high precision in analysis and provide a standard operating protocol with step-by-step instructions.
The BT itself may be divided into two main parts. In the first part, carbon is treated with a reaction base. The more acidic oxygen groups on the carbon surface neutralize the base. In the second part, the nonconsumed amount of the base is quantified by a simple acid–base titration. The BT can therefore be considered a reverse titration of oxygen groups on carbon.
Bases with different pKa values are used for the carbon treatment to convert different combinations of oxygen groups. The bases used by H. P. Boehm were NaHCO3 (pKa = 6.4), Na2CO3 (pKa = 10.3), NaOH (pKa = 15.7), and NaOEt (pKa = 20.6) [2]. It is assumed that a base neutralizes all oxygen groups that are more acidic. Accordingly, NaHCO3 primarily deprotonates carboxyl groups and Na2CO3 also reacts with lactones. NaOH additionally deprotonates phenols. As a result, NaOH converts all surface groups that react acidic in aqueous solutions. A reaction of basic oxygen groups (carbonyl-containing groups such as quinones and pyrones) with high pKa values is only possible with NaOEt. Due to its strong basicity (NaOEt converts H2O to OH), dried ethanol must be used as the solvent in this case. Because of this, NaOEt is only seldom used in current research.
Goertzen and Oickle et al. [4,5] highlighted the difficulty in comparing results of the BT from different working groups because measurement protocols were not consistent. Based on an evaluation of different experimental aspects, they suggested a standardized procedure for the BT. This standardization is largely based on the acid–base titration that they performed with color indicators or a pH meter. They titrated manually and used highly concentrated reaction bases as described by H. P. Boehm (0.05 M) [3]. Since this can easily lead to large errors, the authors suggested the use of 1.5 g carbon in 50 mL reaction base for obtaining results with high precision. Considering commercially available carbon materials, such an amount is certainly not limiting. However, it is important to note that “novel” carbon materials at the research level are not always available in such quantity.
The aim of our investigations was to extend the previous attempts for a standardization and to provide practical guidance to achieve reliable results for small sample amounts by use of an autotitrator. All necessary work steps were examined and evaluated in relation to their influence on the titration results. To validate the method, we use analytic criteria, such as accuracy (closeness to the true value), repeatability or intra-assay precision (precision under the same operating conditions over a short interval of time), intermediated precision (precision under within-laboratory variations such as different days or different analysts) and robustness (capacity to remain unaffected by small, but deliberate variations in method parameters) (see ref. [6], ISO/IEC 17025).
This first part of the validation of the BT covers the accuracy and precision of the acid–base titration. To make this method available to scientists who want to compare several samples in a short time, long degassing and titration times are avoided. For achieving the greatest precision in the quantification of the bases through titration, the three most common bases NaHCO3(aq), Na2CO3(aq), and NaOH(aq) are investigated as analyte solution in the direct titration and as titrator bases in the indirect titration (acid excess is analyte solution).
Subsequently, various practical aspects in the treatment of carbon with the reaction base are examined regarding the robustness and the intermediated precision. Multi-walled carbon nanotubes (MWCNTs) were chosen as the carbon material because their tube structure and the formation of loose agglomerates with large open porosity enable the migration of the bases in the whole bulk material. In other carbon materials, pores could be blocked, hindering the reaction of all surface groups. However, for this first study, it is important that the model substance is homogeneously oxidized to find out if there are influences on the titrated values due to the required working steps.
The second part of the validation [7] deals with the accuracy of the surface group quantification compared with other analytical methods and the accessibility of the oxygen groups in different carbon materials.

2. Materials and Methods

2.1. Materials and Solutions

Stock solutions (0.1 N) were prepared from the solids (dried for Na2CO3) for the titrator and reaction bases. Na2CO3 and NaHCO3 were purchased from Alfa Aesar (Ward Hill, MA, USA). NaOH and the 0.1 N HCl stock solution (AVS Titronorm) were purchased from BDH Prolabo (Singapore). For the individual experiments, the solutions were diluted to the required concentrations. All solutions were prepared with double deionized H2O (GenPure UV (Waltham, MA, USA), 0.055 µS/cm).
The CNT raw material was Baytubes MIV-05-185 (Bayer AG (Leverkusen, Germany)). These multi-walled CNTs typically have 3 to 15 walls, an outer diameter of 13–16 nm, and a length of 1–10 µm. The purity of these CNTs is 95 wt%. Other components are mainly Co and Mn from the CVD syntheses.
Purification: To remove any metal components, 20 g Baytubes MIV-05-185 were heated up to 400 °C for 2 h in air. After cooling, the CNTs were treated with 400 mL 6 M HCl for 2 h under reflux. The resulting solid was washed multiple times with H2O and dried overnight at 120 °C.
Acid Treatment: Purified CNTs (5 g) were oxidized with concentrated HNO3 (purchased from BDH Prolabo) at 90 °C for 2 h. Afterwards, the CNTs were washed with H2O until the filtrate was pH neutral. The solid was dried overnight at 120 °C. The resulting chunks were crushed and finally ground through a 250 µm sieve to get a homogeneous material. The resulting oxidized CNTs are labelled as aCNTs afterwards.
Ozone Treatment: Purified CNTs (5 g) were placed in a vertical glass reactor. Ozone in an oxygen flow was added upstream with a concentration of 10 g O3/m³ (Anseros Ozomat GM-6000-Pro (Tübingen, Germany)). The oxygen flow was set to 45 L/h for 8 h. The reaction was monitored with the ozone analyzer Anseros COM AD 01 (Tübingen, Germany). The resulting oxidized CNTs are labelled as oCNTs.

2.2. Titration Experiments

Unless otherwise mentioned, the concentrations for the acid and bases were 0.01 N. The titration solution, the aliquots, and the titrations were prepared in a laboratory with temperature control (19.8–21.6 °C). Aliquots were covered to prevent contamination and were used within 1 h.
The titration was carried out using a G20 autotitrator and a DGI115-SC glass pH electrode from Mettler–Toledo (Columbus, OH, USA). Dynamic titration methods were used, which reached the equivalence point after approximately 5 min. The entire titration was terminated after about 7 min which provided an evaluable potentiometric titration curve (titrator settings for Na2CO3 as titrator solution: ΔE = 3 mV per addition, tmin = 1 s, tmax = 45 s). In the experiments without CNTs, eight 10 mL aliquots were taken from a stock solution via a volumetric pipette and weighed afterwards to ensure the base amount.

2.3. Experiments with CNTs

General procedure: For each CNT sample, three CNT–reaction base suspensions were produced. CNTs (100 mg) were weighed and transferred into a 100 mL polypropylene vessel with a screw cap. The reaction base (50 mL, 0.01 N) was added via volumetric pipette and the mass was additionally weighed. Three pristine base samples without CNTs served as references for each sample series. The sealed vessels were transferred to a shaking plate for three days (VKS-75 control from Edmund Bühler GmbH (Bodelshausen, Germany), 110 min−1). Afterwards, the CNTs were removed using a syringe filter (Whatman (St. Louis, MO, USA) FP30/0.45 CA—0.45 µm) and the bases were sealed until titration. For each base sample, four 10 mL aliquots were taken simultaneously and 20 mL of 0.01 N HCl was added to each aliquot. The titration was realized as described above. For all samples of a series, the same titrator solution Na2CO3 (0.005 M) was used, so that the titer remained constant within a series.
Testing of different CNT removal methods: aCNTs were removed from NaOH by four different methods using either (a) folded filters (Whatman 597½ Folded Filters, 4–7 μm), (b) syringe filters (Whatman FP30/0.45 CA—0.45 µm), (c) suction through a round filter (Rotilabo XP30.1, 2–3 µm, Carl Roth GmbH + Co. KG (Karlsruhe, Germany)), or (d) decantation of the supernatant reaction base. Each method was tested with six NaOH suspensions after 3 days of treatment time and six NaOH samples without CNTs as reference. For the suction through the round filter, 25 mL 0.04 N NaOH was used as the reaction base. Complete removal of the base was ensured by rinsing the aCNTs with water to reach a volume of 100 mL. More details can be found in the Supplementary Materials, Figure S1.
Testing of different reaction base concentrations: Solutions with different concentrations (0.05 N, 0.025 N, and 0.01 N) were prepared from a 0.1 N NaOH and a 0.1 N (0.05 M) Na2CO3 stock solution by means of volumetric flasks. Three times, 100 mg of aCNTs were added to 50 mL of each of these solutions. After 3 days, the bases were diluted to 0.01 N and the aCNTs were removed.
Testing of different treatment times: aCNT–reaction base suspensions are prepared as described above. Three of the sealed vessels per reaction base were shaken for 1, 2, 3, 4, or 5 days before the CNTs were removed. Three base reference samples were worked up from the samples with 1 day treatment time.
NaOH suspensions of ground oCNTs (8×) and as-received oCNTs (4×) were prepared. Half of the ground oCNT suspensions were treated in an ultrasonic bath for 15 min (USW4 from Gerätetechnik Brieselang GmbH (Nauen, Germany), 30 kHz). All samples were then transferred to the shaking plate. One suspension for each different treatment method was filtered after either 1 h, 4 h, 1 day, or 3 days total treatment time. Three base reference samples were worked up from the samples with the 1 h treatment time.

2.4. Quantification of Oxygen Groups

The following equations were used to calculate the oxygen groups. Vsample, reaction base represents the spent titrator volume for the titration of the carbon-treated reaction base and Vreference, reaction base denotes the spent titrator volume during the titration of the untreated reaction base, which has been subjected to all working steps, standing times, and other treatments. The factor 1/5 is due to the measurement of the 10 mL aliquots representing 1/5 of the reaction base.
n c a r b o x y l   g r o u p s   [ mmol g CNT ] = ( ( V sample , NaHCO 3 V ¯ reference , NaHCO 3 ) [ mL ] × t i t e r × c [ mol L ] ) titrator base w e i g h t CNT   [ g ] × 1 5
n l a c t o n e s   [ mmol g CNT ] = ( ( V sample , Na 2 CO 3 V ¯ reference , Na 2 CO 3 ) [ mL ] × t i t e r × c [ mol L ] titrator base w e i g h t CNT [ g ] × 1 5 n c a r b o x y l   g r o u p s
n p h e n o l s [ mmol g CNT ] = ( ( V sample , NaOH V ¯ reference , NaOH ) [ mL ] × t i t e r × c [ mol L ] titrator base w e i g h t CNT [ g ] × 1 5 ( n c a r b o x y l   g r o u p s + n l a c t o n e )
For a constant titer of the titration base, Equation (2) can be transformed as follows. Equation (3) can be similarly transformed.
n l a c t o n e s   = ( ( V sample , Na 2 CO 3 V ¯ reference , Na 2 CO 3 ) w e i g h t CNTs   [ g ] × 1 5 ( V sample , NaHCO 3 V ¯ reference , NaHCO 3 ) w e i g h t CNTs   [ g ] × 1 5 ) ( titer × c ) titrator base

3. Results and Discussion

The overall procedure of the Boehm titration with the different working steps is illustrated in Figure S2. All these steps were evaluated in terms of base concentration changes and systematical errors in the titration results.

3.1. Practical Aspects of the Acid–Base Titration

Different titration methods and parameters were tested to identify the most reliable way to obtain accurate and precise results for the base quantification.

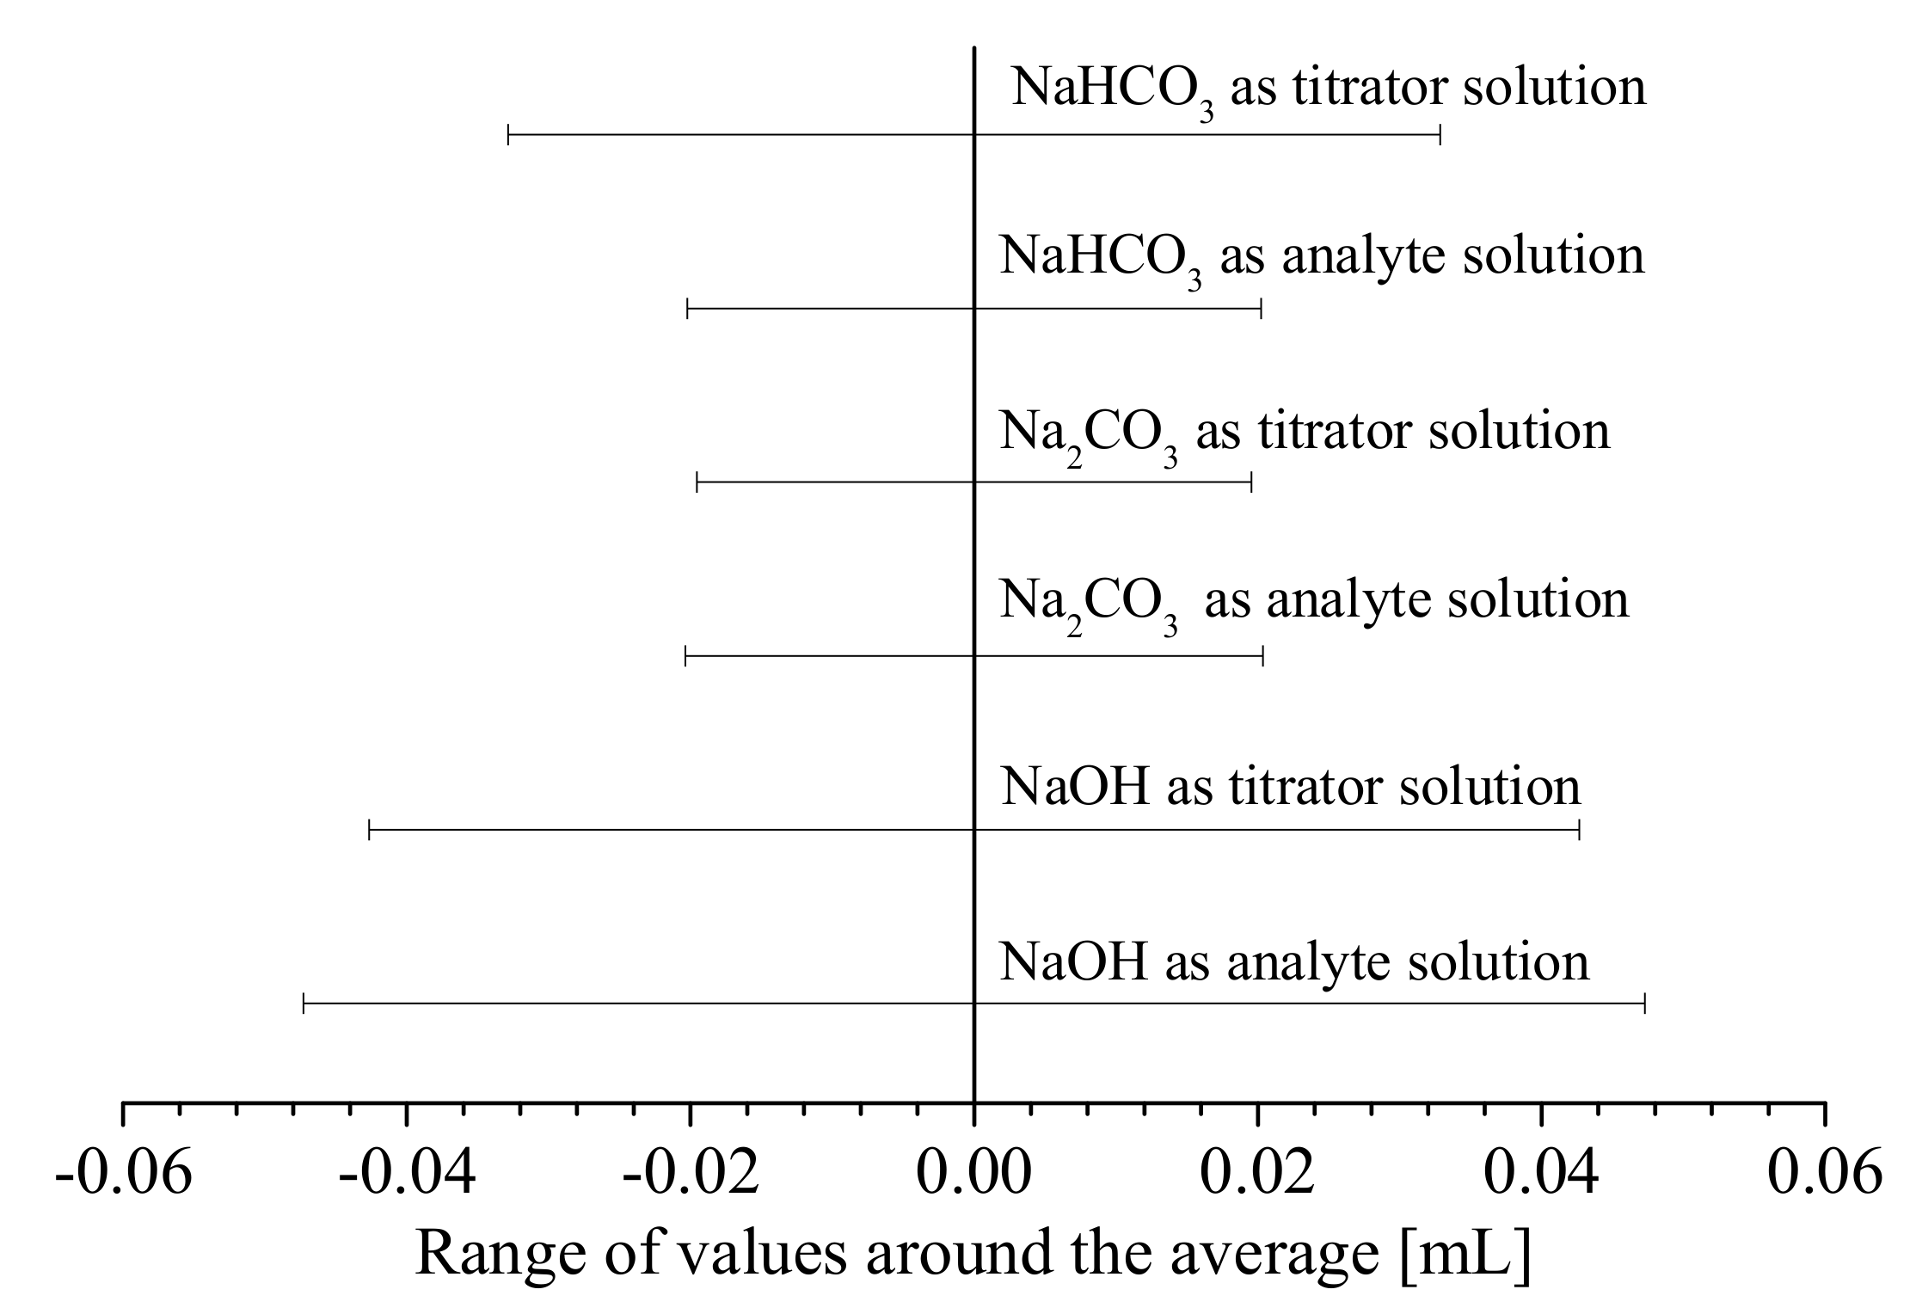
3.1.1. Precision of the Acid–Base Titration

In the BT, the bases are always the samples which have to be analyzed (reaction bases). As a result, acid is used as the titrator solution in direct titration. In the case of indirect titration, a known excess of acid is added to the reaction base and the acidic analyte solution is then titrated with a base (titrator base). For both methods, NaHCO3, Na2CO3, and NaOH are tested to identify the titration method with the highest precision.
For Na2CO3 and NaHCO3, the theoretical equivalence point is reached at pH = 5.1 since a medium-strong base is titrated with a strong acid (HCl). In contrast to that, the theoretical equivalence point for the strong base NaOH and strong acid HCl is at pH = 7.0. However, by dissolving CO2 from air, HCO3 and CO32− are formed as a side reaction by consumption of OH (called CO2 influence). The equivalence point relevant for the quantification thereby shifts from pH = 7.0 to pH = 5.1. Kim et al. demonstrated this empirically for different amounts of CO2 [8].
Figure 1a displays the titration curves obtained by the autotitrator for the direct titration. For NaOH, only the formation of HCO3 from CO32− at pH = 9 appears. An equivalence point of the H2CO3 formation at pH = 5.1 is not visible. Even by the generation of the first derivative (Figure 1b), there is no local minimum to indicate an evaluable equivalence point. Due to the existence of HCO3, the reaction to H2CO3 must take place at low pH values. A nonquantification of this species would lead to an under-determination of the original NaOH amount (without CO2 influence).
To avoid the CO2 influence, an indirect titration is often applied. Base ions from the CO2 influence form H2CO3 in the acid analyte solution which is decomposed almost completely to CO2 [9]. However, the equivalence point of H2CO3/HCO3 is still visible in the curve of NaOH (Figure 2a). Since the CO2 influence is very small, the first derivative shows only a small shoulder instead of a separated maximum (arrow in Figure 2b). Nevertheless, the shoulder indicates the correct equivalence point for the quantification. This makes a determination at low CO2 influence difficult.
Goertzen et al. [4] investigated various methods to remove the CO2 influence. Degassing for 2 h turned out to be the most suitable method. Nevertheless, even after long degassing, the CO2 influence was still present even in the indirect titration. Apparently, the titrator solution, unlike the analyte solution, was not degassed. Accordingly, the titrator base consisted of a mixture of OH and CO32−, which explains the finding of two equivalence points. Degassing the titrator solution during the titration is difficult. Water could be evaporated easily by the gas stream. Consequently, the concentration of the titration solution would slowly increase. Therefore, a complete removal of the CO2 influence without changing the concentration is not possible. To overcome the difficulties caused by CO2, it is therefore advisable to work with medium-strong bases which are not influenced by CO2.
For these solutions (Na2CO3 and NaHCO3), a markedly lower change in the pH value close to the equivalence point is received for the direct and indirect titration. Accordingly, the values of the first derivative are smaller by a factor of 20 and the peaks are clearly wider. This is the reason why titrations are preferably realized with strong acids and bases. However, the software of modern autotitrators plots the first derivates by a polynomial function which enables a precise determination of the equivalence points even at low changes of the pH value. This leads to a high precision of the titrations with Na2CO3 and NaHCO3 (Figure 3).
Since the standard deviation is strongly influenced by the number of measurements, the range of obtained values is given for the precision tests. The titration time was set to approximately 7 min for all six titration methods tested. The titration was carried out dynamically, so that less titrator solution was added per time unit at higher changes in pH values. The equivalence point was reached in all methods after approximately 5 min.

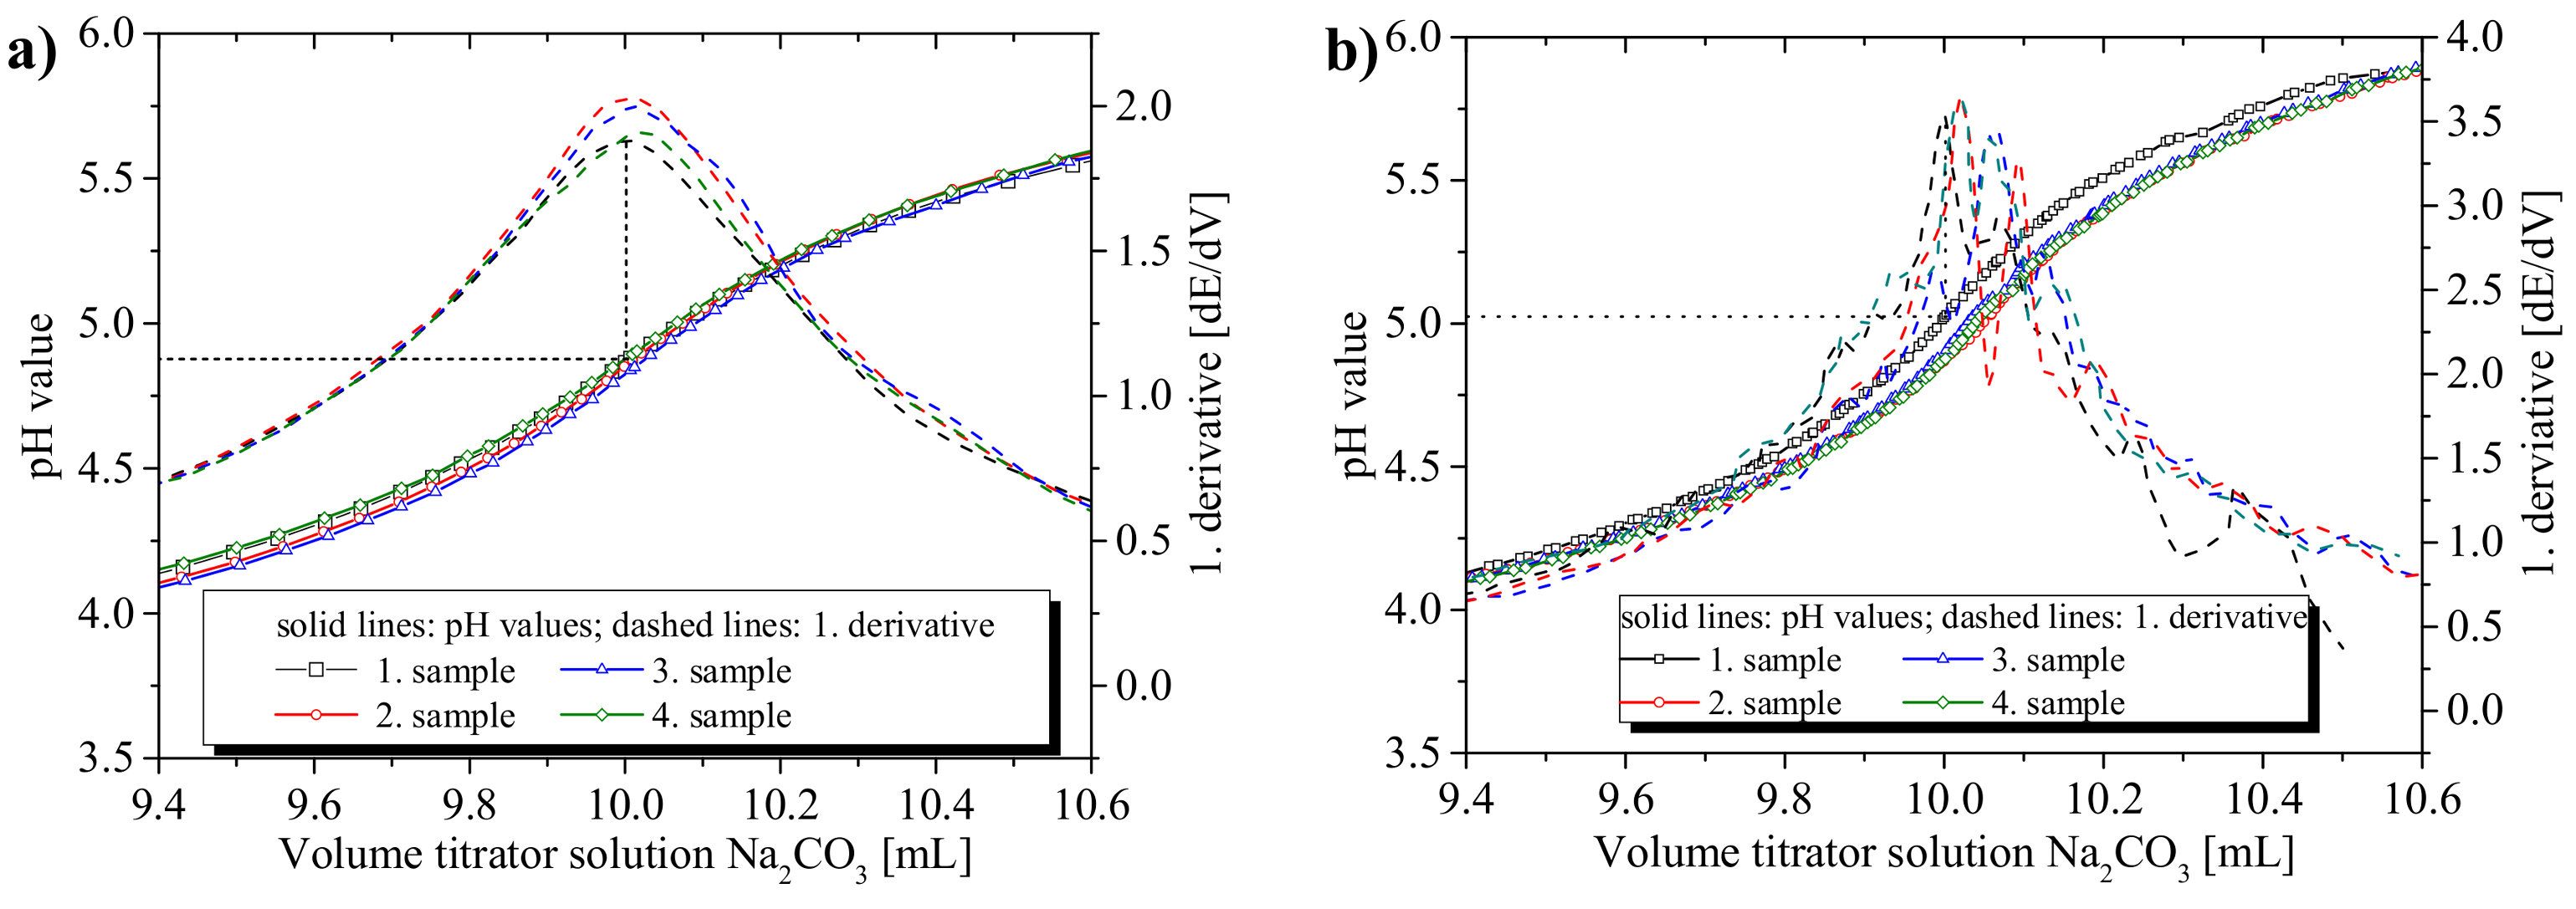
3.1.2. Influence of Titration Time on the Precision and the pH Values at the Equivalence Points

After adding the titrator solution, enough time must be given to reach equilibrium. If awaiting a constant potential for each addition, the required titration time would be very long. At shorter times, the equivalence point is obtained at lower pH values for acidic analyte solution and at higher pH values for basic analyte solutions. However, this does not influence the required volume of titrator solution to reach the equivalence point.
Figure 4 compares results for titration times of 7 min and 30 min using Na2CO3 as a titrator solution. Four aliquots were analyzed in each case. It seems surprising at first that a higher precision is achieved for shorter titration times (error Na2CO3, 7 min: 0.017 mL; error Na2CO3, 30 min: 0.029 mL). Clearly, allowing 30 min titration time leads to less-defined derivatives as well as a shift to higher titrator volumes.
The unexpected behavior for long titration times can be understood from the autotitrator setup. To prevent errors from droplet formation, modern autotitrators add the titrator solution directly to the analyte solution (Figure S3). Analyte and titration solution are therefore directly in contact and diffusion between both solutions leads to concentration equalization. This process is slow but can become an issue if too long titration times are chosen. Overall, the results clearly demonstrate that care has to be taken when choosing the titration time and defined protocols need to be followed to achieve a high precision.

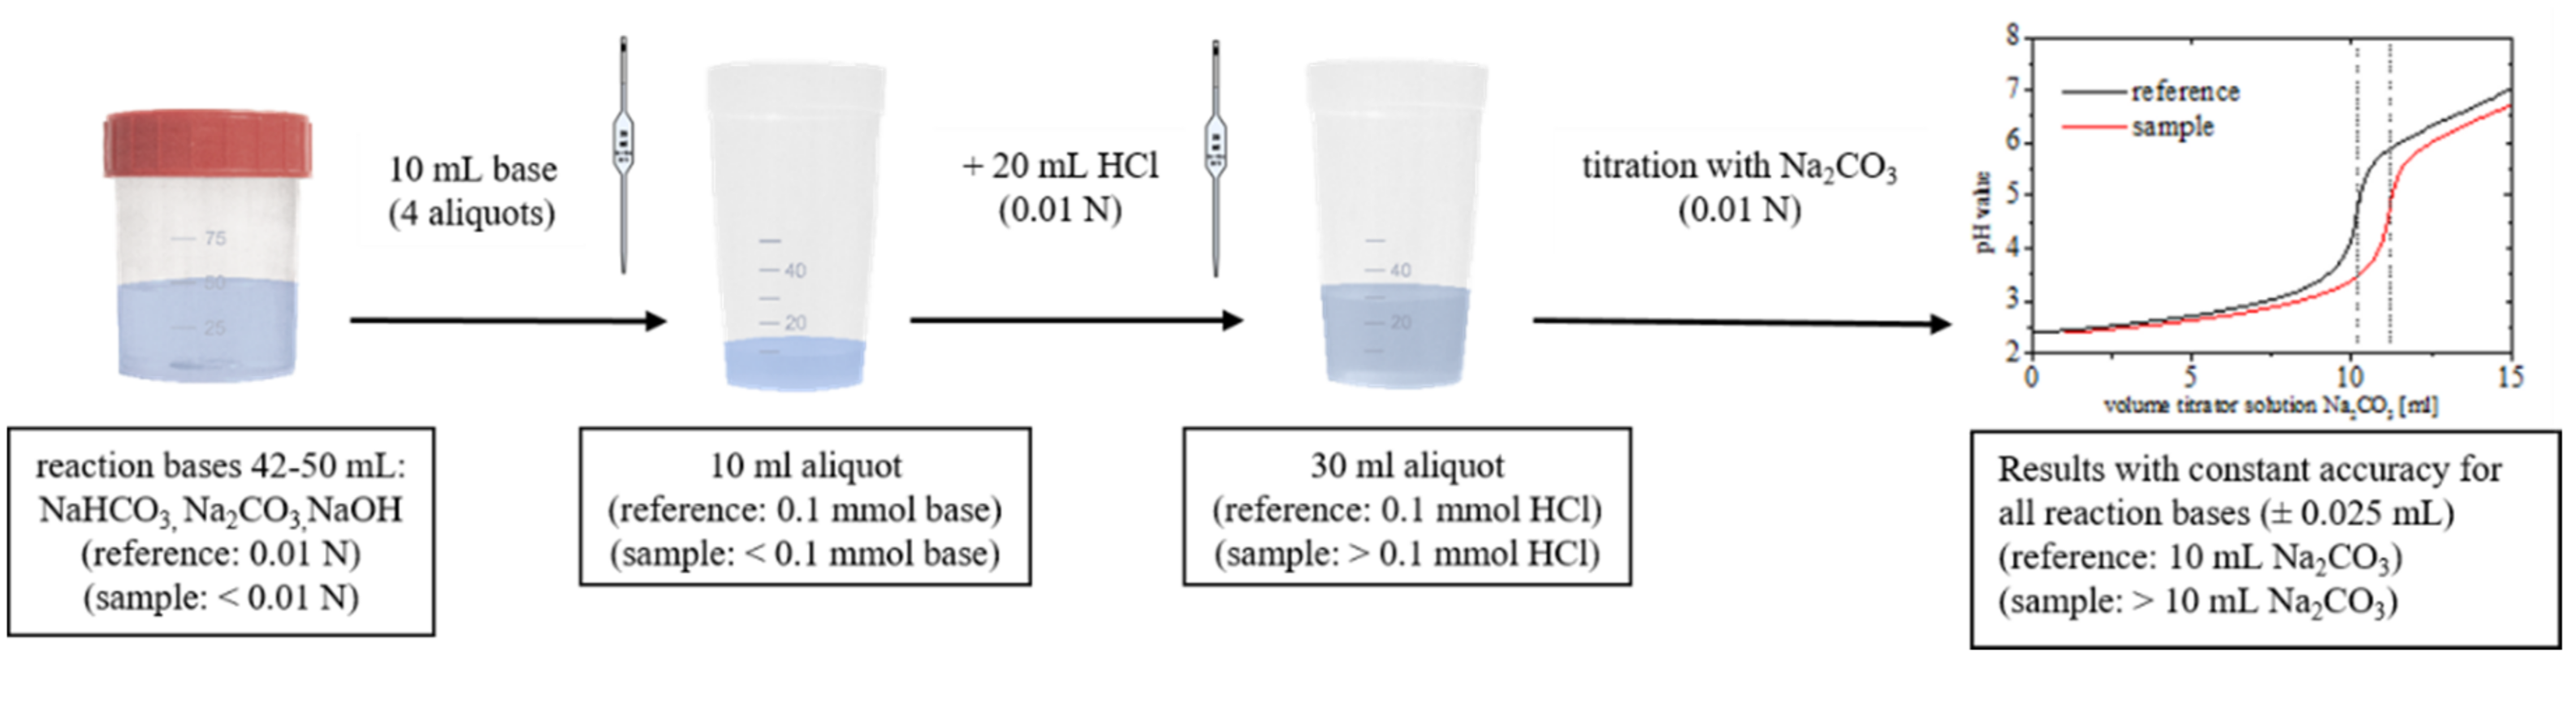
3.1.3. Recommendations for the Titration Method

Based on the results from the previous sections, we recommend an indirect titration with Na2CO3 as a titrator base using an autotitrator (Figure 5). The indirect titration has decisive advantages in comparison with the direct titration. By using Na2CO3, CO2 has no influence on the titration. Accordingly, there is no need for degassing or heating of the aliquots to remove dissolved CO2. The titration itself can be carried out using one measurement method and one titrator base for all three reaction bases. The error due to the titration procedure is thereby equal for all reaction bases. Unfortunately, no constant pH value can be established for the equivalence point. In practical experiments, stronger reaction bases caused a slightly higher pH value at the equivalence point (NaOH: pH = 4.86, Na2CO3: pH = 4.74, NaHCO3: pH = 4.63; titration curves are shown in Supplementary Materials Figure S4). This is due to the differently protonated base species in the analyte solution.

3.2. Aspects of the Base Treatment and Following Removal of the Carbon Material

In line with suggestions by Goertzen et al. [4], we conducted our experiments with 50 mL of reaction base. Four 10 mL aliquots per sample were obtained this way.
For each carbon sample series, we worked with pristine bases as reference samples (similar to [10]). These reference bases were exposed to all working steps, treatments, titration conditions, and standing times that we applied to the carbon-treated bases. Therefore, possible changes in the base concentrations due to the individual work steps are also existent in the references. This increases the robustness significantly due to the fact that the differences between carbon-treated base and reference are not further affected by systematic errors. A more detailed explanation is given in Section 3.3.

3.2.1. Removal of CNTs

The indirect titration requires removal of the carbon from the solution. Otherwise, the surface groups that reacted with the base would be protonated again by the HCl excess. In the literature, carbon is usually removed via cellulose or cellulose acetate filters, syringe filters, or decantation [4,8,11,12]. These methods are based on the removal of the CNTs without a quantitative transfer of the reaction base and without dilution (loss of reaction base up to 5 mL). Furthermore, suction of the base through a round filter was tested (similar to [13]). All methods were effective in (visibly) removing all CNTs; see Figure S1.
The experiments with CNT decantation and the use of syringe filters showed approximately the same differences between the reference and carbon-treated reaction bases (0.28 ± 0.02 mL). When using folded filters, a slightly lower value was obtained (0.26 ± 0.05 mL). This suggests that a small amount of base is consumed by the used cellulose filter papers. In comparison with the reference, a significantly smaller value was obtained by suctioning through a round filter (0.22 ± 0.04 mL). Presumably the base is not quantitatively removed from the solid despite the calculated rinsing with water.
For the CNTs used herein, the decantation and use of syringe filters provided the largest values with the smallest standard deviation. Accordingly, these methods should be used. The application of decanting may be difficult with other carbon materials. A centrifuge might be used for carbon materials with long settling times.
In comparison with filtering with a syringe filter, decanting has the advantage that the carbon can subsequently be reused. Since decanting has shown the same results as the syringe filters, it can be assumed that the base is homogeneously distributed and there is no higher concentration in the vicinity of the settled-down CNTs. This enables a combination of both methods in which as few as possible CNTs are drawn into the syringe and the syringe filter only removes the residual agglomerates. The remaining CNTs can then be reused.

3.2.2. Concentration of Reaction Base and Amount of Carbon

The concentration of the base plays a decisive role in the intermediate precision of titration. The lower the concentration of the base, the higher is the effect on the concentration by the same amount of carbon. As a result, more titrator solution is consumed during the titration and the results are less influenced by titration errors.
However, it is important that the reaction base neutralizes the maximum number of oxygen groups, independently of the concentration. To test this, we treated the CNTs with the reaction base in a typical concentration range of 0.01 N to 0.1 N (0.01 N: [8,12], 0.025 N: [14], 0.05 N: [5], 0.1 N: [15]). The results are shown in Figure 6.
No trend dependent on the concentration was found for either tested base. This shows that the reaction of the surface groups is unaffected by the base concentration. Accordingly, half-concentrated solutions of the divalent base Na2CO3 can be used. This is in contrast to the suggestion by H. P. Boehm [3].
For the amount of carbon, H. P. Boehm recommended that 10% of the base should be neutralized by carbon to provide sufficient accuracy [3]. In our measurements, 2 mg CNTs per milliliter of reaction base was used. This is within a typical range of 1–3 mg mL−1 for CNTs (1 mg mL−1: [8,12,16], 2 mg mL−1: [17], 3 mg mL−1: [13]). However, even with the use of NaOH, seldom was over 5% of the reaction base consumed. In the previous sections, we could show that the error of a single measurement with our titration method was within the range of 0.25% of the aliquot volume. By measuring the four aliquots, the standard deviation is usually reduced to 0.15% (0.015 mL). Accordingly, the limit of quantification would be at 0.15 mL. In other words, to obtain a reliable measurement with our suggested setup, the absolute amount of surface groups should be 7.5 µmol. The amount of carbon per titration must be adjusted accordingly.

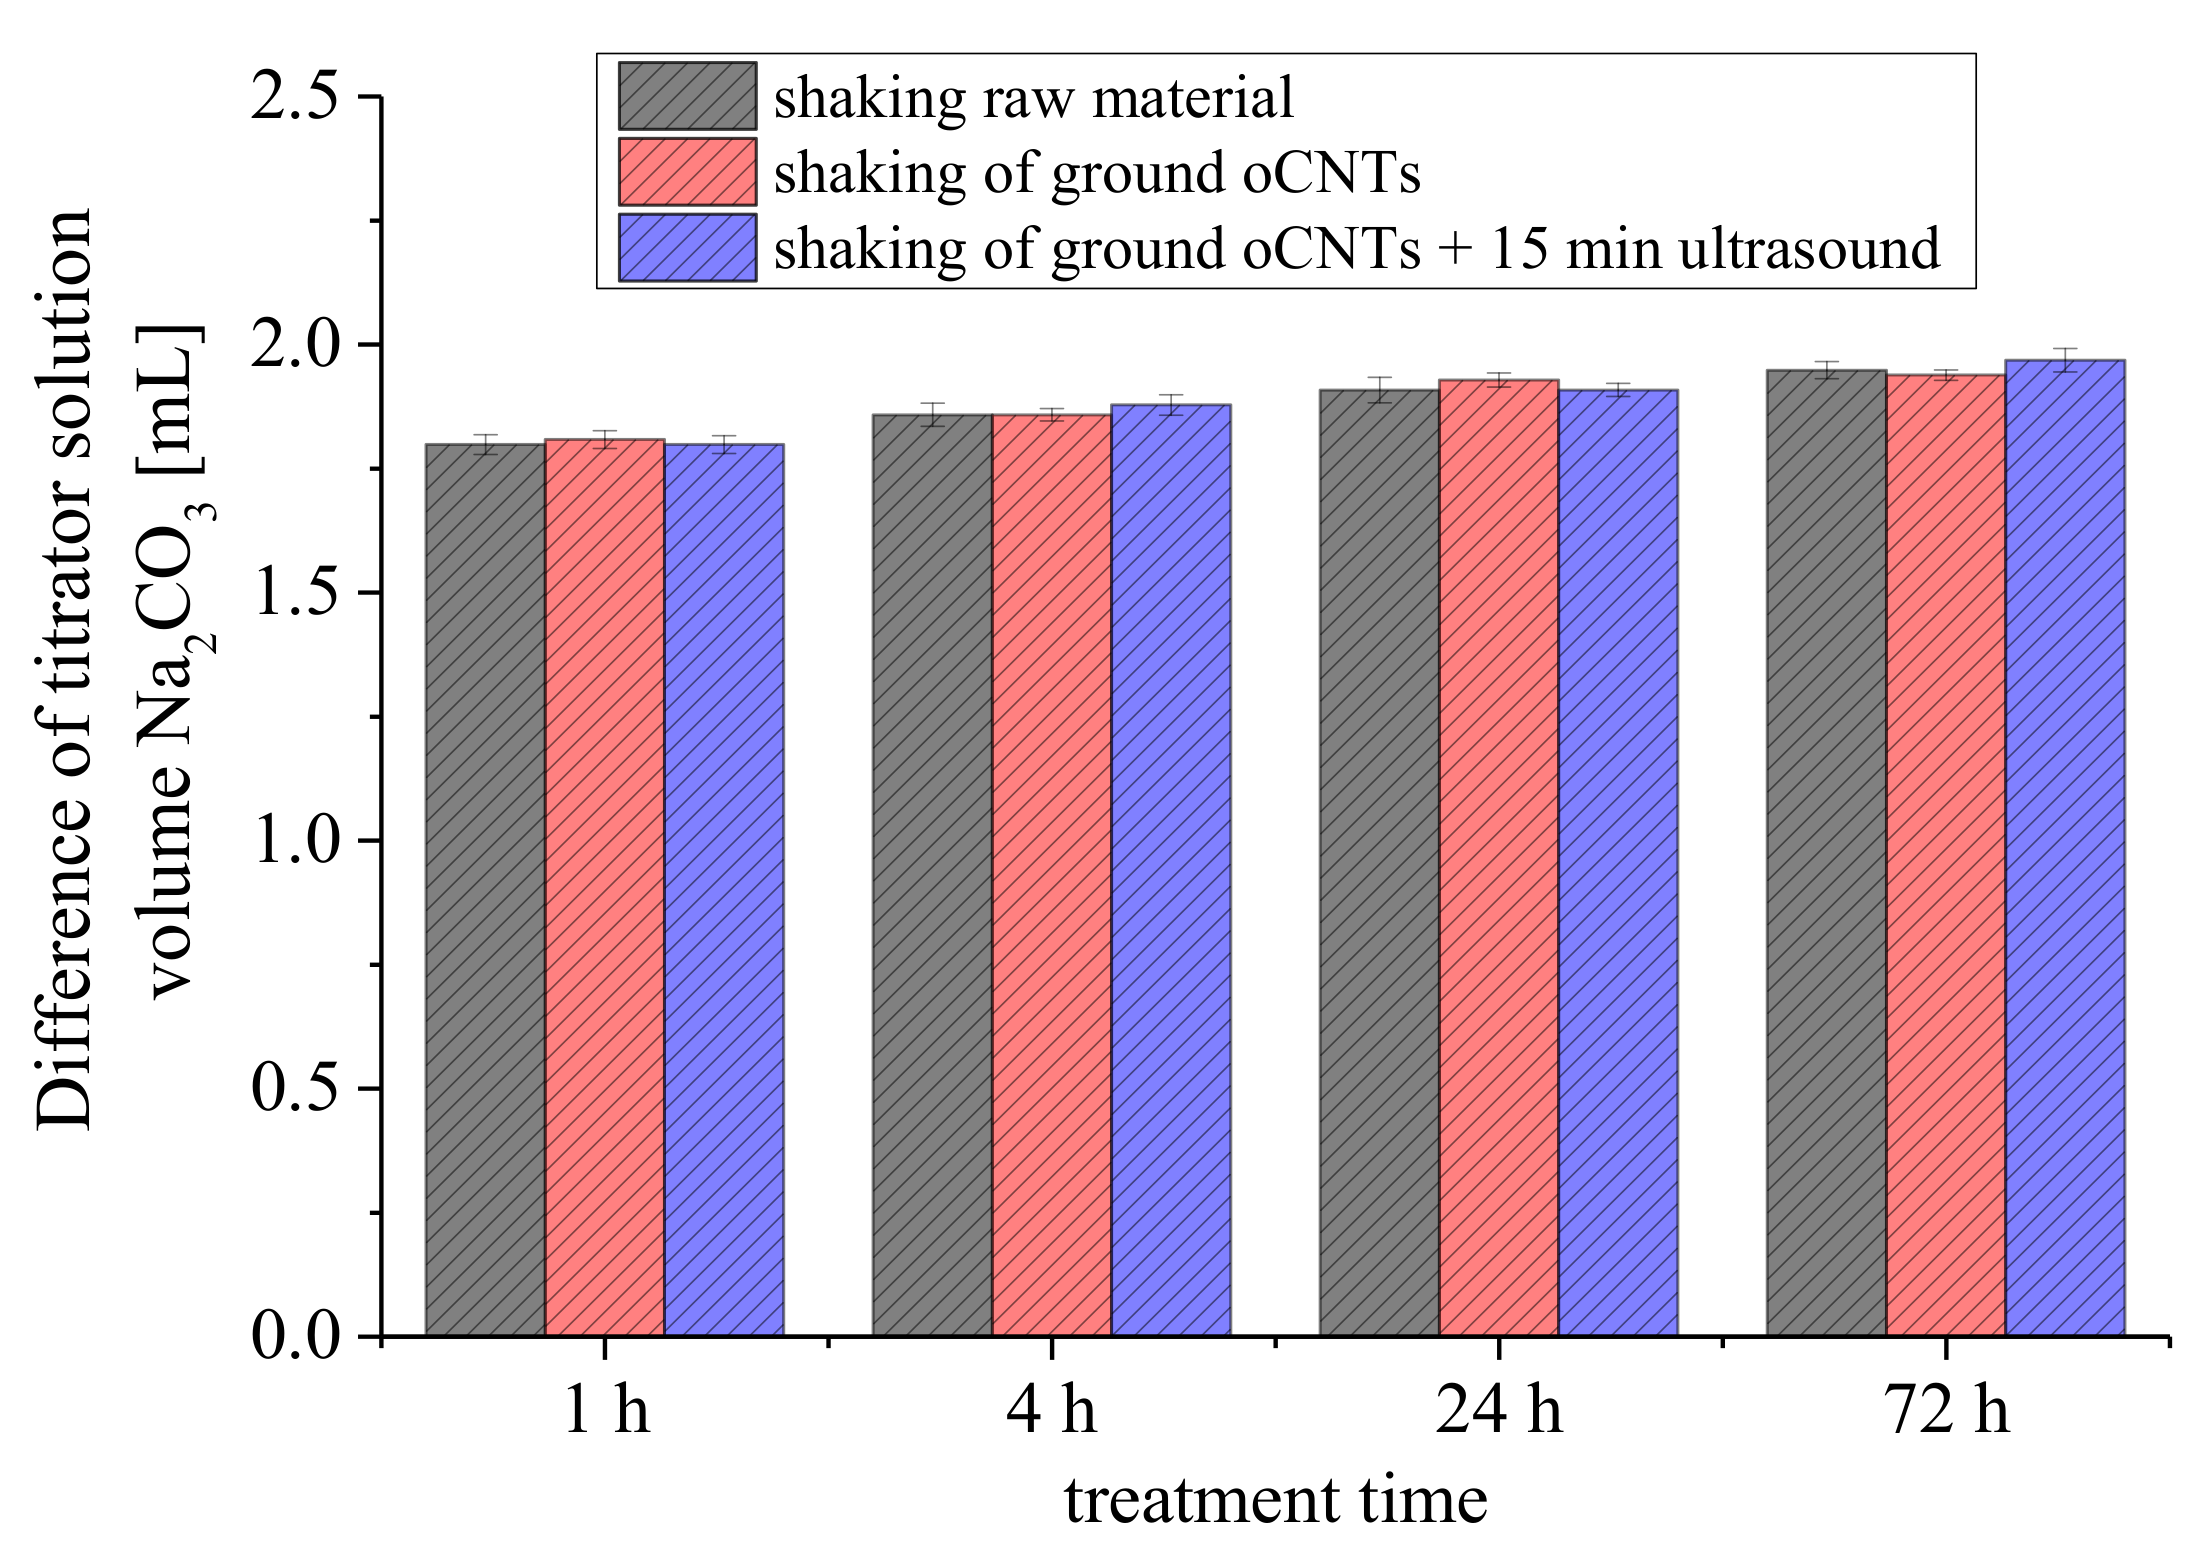
3.2.3. Treatment Time of the Reaction Base with Carbon

The time for treating the carbon sample with the reaction base considerably varies in the literature. For example, treatment times ranging from a few hours to several days (6 h: [15], 1 day: [14,17,18,19,20,21,22], 2 days: [8,23,24], 3 days: [16,25]) have been applied. To clarify how much time is required for completing the reaction, we conducted a systematic study for aCNTs with NaHCO3, Na2CO3, and NaOH as reaction bases. The treatment time was varied between 1 and 5 days. It turned out that for all three bases the consumption of the base was almost completed after the first day (Figure S6).
The required treatment time might be further shortened by intense mixing of the suspension. For example, shaking [24,26,27,28], stirring [14,17], and ultrasonication can be used [10,15,17,20]. The latter method has the advantage of efficiently destroying agglomerates. This reduces the diffusion paths to reach the surface groups inside the solid material. To investigate whether the reaction time can be shortened, we compared samples that were untreated, ground, and treated by ultrasonication (microscope images are shown in Figure S7). For the aCNTs (0.100 mmol/g carboxyl groups; 0.043 mmol/g lactones; 0.039 mmol/g phenols), however, we found no significant influence, i.e., the required treatment time was not affected (Figure S6a,d). Additionally, only small changes for the agglomerate structure and the suspension stability were observed. This is in contrast to our previous findings on other oxidized CNTs [29]. Therefore, we repeated the base treatments with CNTs oxidized by ozone, which shows a higher amount of surface groups (oCNTs: 0.293 mmol/g carboxyl groups, 0.078 mmol/g lactones, 0.117 mmol/g phenols). After the same ultrasound treatment, these CNTs did not completely settle down and formed a partially stable suspension due to their higher hydrophilicity. However, the titration results were not affected (Figure 7). Overall, the results indicate that the mixing and the destruction of agglomerates have no influence on the consumption of the reaction base. In other words, all surface groups are accessible independently of the agglomerate size. Furthermore, over 90% of the base consumption has already taken place after 1 h of treatment time.

3.3. Error Analyses and Quantification of Surface Groups

The calculation of the surface groups can be carried out using Equations (1)–(3) (Section 2.4). By using reference samples, many error sources can be excluded. For example, the titers of the reaction bases and the HCl solution are omitted. Both solutions were always identical for the reference and the carbon-treated bases. However, the titer of the titrator base influences the absolute values calculated. In our proposed method, we measured all reaction bases of a sample series with the same titrator base. For this purpose, we used a 5 L reservoir from which the solution was taken directly from the autotitrator for each titration. As a result, the titer of the titrator base is entered as a constant in all three calculations. This significantly increases the robustness of the BT.
Calculating the absolute values (e.g., for lactones), the equation can be converted as in Equation (4). The greatest error in the calculation is caused by the term (VsampleVreference)titrator base. The practically determined range for this term was ±0.025 mL in the indirect titration (10 mL reaction base + 20 mL HCl). Since several aliquots were measured, a smaller standard deviation was obtained (σ(n = 4) = 0.015 mL).
Summarizing the individual errors for Equation (4) similarly to Oickle et al. [5], a total error of approximately 1.5 mL gCNT−1 was obtained for the first bracket term (complete error calculation with addition and multiplication of random errors can be found in the Supplementary Materials). At a consumption of 10% of the reaction base Na2CO3 and 5% consumption for NaHCO3, a standard deviation of 6% for the lactone amount was calculated. This value decreases considerably for larger conversions of the reaction bases.
However, the equation does not contain a factor for the heterogeneity of the carbon material. This should be different for each oxidation method and starting material. Therefore, a multiple determination is advisable. In our CNT samples, only very slight differences were found between the samples of the triple determination (σbase consumption < 0.1% of the aliquot volume).

4. Conclusions

We developed a titration method that can be used to quantify the reaction base with a standard deviation of 0.15% of the aliquot volume. This high precision is due to the avoidance of a CO2 influence by using Na2CO3 as the titrator solution. At a titration time of 7 min and with the use of four aliquots per base, the detection and quantification of all acidic oxygen groups requires only 1.5 h per sample. If only the sample with the highest degree of oxidation should be determined within a sample series (relative determination), one could omit the measurement of reference samples and just compare the titrated volumes with NaOH as reaction base. With this procedure, more than 15 samples can be analyzed and compared during one measurement day.
When quantifying the specific oxygen groups, an error of approximately 6% is obtained in the calculation when the consumption of the stronger base is 10% and that of the weaker base is 5%. For larger differences in base consumptions, the standard deviation decreases. Accordingly, the precision can be assumed to be high compared with that of other analysis methods like temperature programmed desorption (TPD) or X-ray photoelectron spectroscopy (XPS) because the titration results need no further workup (e.g., deconvolution of complex measurement signals). This has the advantage that absolute values from the BT method can be easily compared with other published literature.
The CNTs as model carbon material showed an almost quantitative reaction of the surface groups with the reaction base after one hour only. Mixing method and breaking of the CNT agglomerate structure had no influence on the required reaction time. For reuse of the analyzed CNTs, the supernatant reaction base can be separated from the deposit. The use of a syringe filter has been identified as the most suitable method. An influence on the titration values was not found when only parts of the reaction base are analyzed.
To overcome the problem of the low robustness of the BT, we provide a detailed standard operation procedure including all individual steps in the Supplementary Materials.

Supplementary Materials

The following are available online at https://www.mdpi.com/2311-5629/4/2/21/s1, Figure S1: Illustration of the CNT removal methods: (a) decanting, (b) syringe filters, (c) folded filters and (d) suction through round filter, Figure S2: Required working steps for Boehm titration, Figure S3: Titration cup with analyte solution (left: addition tube, middle: stirrer, right: pH electrode), Figure S4: Titration curves with Na2CO3 titrator solution at the different reaction bases after addition of the HCl excess, Figure S5: Difference between reference reaction base and aCNTs treated reaction base after removing of the aCNTs with different methods (DE: decantation, SF: syringe filter, FF folded filter, RF: round filter) (0.01 N solutions, Na2CO3 as titrator base), Figure S6: Consumed volume of titrator solution Na2CO3 for reference and aCNT treated reaction base (a) NaOH, (b) Na2CO3 and (c) NaHCO3 as a function of treatment time (1–5 days) and (d) after ultrasound treatment for 15–60 min, Figure S7: Microscope images of oCNT-Agglomerates in 0.01 N NaOH: (a) Agglomerates obtained by synthesis, (b) ground agglomerates (through 250 µm sieve) and (c) ground agglomerates after ultrasound treatment, Table S1: Aliquot mass for eight HCl aliquots of the accuracy measurement at various titrator bases as well as the titrated consumption of titrator base (upper part: real measured consumption, lower part: consumption multiplied by factor 10 mg/aliquot mass), Error propagation, Standard Operating Procedure for Boehm titration.

Acknowledgments

We thank the Federal Ministry of Education and Research Germany (BMBF) for the foundation of this research (FKZ: 03WKCN02D) and the ProExzellenz program of the State of Thuringia.

Author Contributions

J.S. and P.S. conceived and designed the experiments; J.S. performed the experiments; J.S. and J.R.B. analyzed the data; J.S. and P.S. contributed reagents/materials/analysis tools; J.S. and P.A. wrote the paper.

Conflicts of Interest

The authors declare no conflict of interest.

References

  1. Boehm, H.P. Chemical identification of surface groups. Adv. Catal. 1966, 16, 179–274. [Google Scholar] [CrossRef]
  2. Boehm, H.P.; Diehl, E.; Heck, W.; Sappok, R. Surface oxides of carbon. Angew. Chem. Int. Ed. 1964, 3, 669–677. [Google Scholar] [CrossRef]
  3. Boehm, H.P. Some aspects of the surface chemistry of carbon blacks and other carbons. Carbon 1994, 32, 759–769. [Google Scholar] [CrossRef]
  4. Goertzen, S.L.; Thériault, K.D.; Oickle, A.M.; Tarasuk, A.C.; Andreas, H.A. Standardization of the boehm titration. Part I. CO2 expulsion and endpoint determination. Carbon 2010, 48, 1252–1261. [Google Scholar] [CrossRef]
  5. Oickle, A.M.; Goertzen, S.L.; Hopper, K.R.; Abdalla, Y.O.; Andreas, H.A. Standardization of the boehm titration: Part II. Method of agitation, effect of filtering and dilute titrant. Carbon 2010, 48, 3313–3322. [Google Scholar] [CrossRef]
  6. Validation of Analytical Procedures: Text and Methodology. Available online: http://www.ich.org/products/guidelines/quality/quality-single/article/validation-of-analytical-procedures-text-and-methodology.html (accessed on 22 February 2018).
  7. Schönherr, J.; Buchheim, J.; Scholz, P.; Adelhelm, P. Boehm titration revisited (part II): A comparison of boehm titration with other analytical techniques on the quantification of oxygen-containing surface groups for a variety of carbon materials. C 2018, 4. [Google Scholar] [CrossRef]
  8. Kim, Y.S.; Yang, S.J.; Lim, H.J.; Kim, T.; Park, C.R. A simple method for determining the neutralization point in boehm titration regardless of the CO2 effect. Carbon 2012, 50, 3315–3323. [Google Scholar] [CrossRef]
  9. Hollemann, A.F.; Wiberg, E.; Wiberg, N. Carbondioxide. In Hollemann-Wiberg, Lehrbuch der Anorganischen Chemie, 102th ed.; Wiberg, N., Ed.; WILEY-VCH Verlag GmbH: Berlin, Germany; New York, NY, USA, 2007; pp. 893–896. [Google Scholar]
  10. Plonska-Brzezinska, M.E.; Lapinski, A.; Wilczewska, A.Z.; Dubis, A.T.; Villalta-Cerdas, A.; Winkler, K.; Echegoyen, L. The synthesis and characterization of carbon nano-onions produced by solution ozonolysis. Carbon 2011, 49, 5079–5089. [Google Scholar] [CrossRef]
  11. Kim, Y.S.; Yang, S.J.; Lim, H.J.; Kim, T.; Lee, K.; Park, C.R. Effects of carbon dioxide and acidic carbon compounds on the analysis of boehm titration curves. Carbon 2012, 50, 1510–1516. [Google Scholar] [CrossRef]
  12. Kim, Y.S.; Park, C.R. One-pot titration methodology for the characterization of surface acidic groups on functionalized carbon nanotubes. Carbon 2016, 96, 729–741. [Google Scholar] [CrossRef]
  13. Hanelt, S.; Orts-Gil, G.; Friedrich, J.F.; Meyer-Plath, A. Differentiation and quantification of surface acidities on mwcnts by indirect potentiometric titration. Carbon 2011, 49, 2978–2988. [Google Scholar] [CrossRef]
  14. Feng, X.; Dementev, N.; Feng, W.; Vidic, R.; Borguet, E. Detection of low concentration oxygen containing functional groups on activated carbon fiber surfaces through fluorescent labeling. Carbon 2006, 44, 1203–1209. [Google Scholar] [CrossRef]
  15. González-Guerrero, A.B.; Mendoza, E.; Pellicer, E.; Alsina, F.; Fernández-Sánchez, C.; Lechuga, L.M. Discriminating the carboxylic groups from the total acidic sites in oxidized multi-wall carbon nanotubes by means of acid–base titration. Chem. Phys. Lett. 2008, 462, 256–259. [Google Scholar] [CrossRef]
  16. Scheibe, B.; Borowiak-Palen, E.; Kalenczuk, R.J. Oxidation and reduction of multiwalled carbon nanotubes—Preparation and characterization. Mater. Charact. 2010, 61, 185–191. [Google Scholar] [CrossRef]
  17. Kim, Y.-T.; Mitani, T. Competitive effect of carbon nanotubes oxidation on aqueous edlc performance: Balancing hydrophilicity and conductivity. J. Power Sources 2006, 158, 1517–1522. [Google Scholar] [CrossRef]
  18. Schmidlin, L.; Pichot, V.; Comet, M.; Josset, S.; Rabu, P.; Spitzer, D. Identification, quantification and modification of detonation nanodiamond functional groups. Diam. Relat. Mater. 2012, 22, 113–117. [Google Scholar] [CrossRef]
  19. Wang, Z.; Shirley, M.D.; Meikle, S.T.; Whitby, R.L.D.; Mikhalovsky, S.V. The surface acidity of acid oxidised multi-walled carbon nanotubes and the influence of in-situ generated fulvic acids on their stability in aqueous dispersions. Carbon 2009, 47, 73–79. [Google Scholar] [CrossRef]
  20. Lee, G.-J.; Pyun, S.-I.; Kim, C.-H. Kinetics of double-layer charging/discharging of the activated carbon fiber cloth electrode: Effects of pore length distribution and solution resistance. J. Solid State Electrochem. 2004, 8, 110–117. [Google Scholar] [CrossRef]
  21. Guedidi, H.; Reinert, L.; Lévêque, J.-M.; Soneda, Y.; Bellakhal, N.; Duclaux, L. The effects of the surface oxidation of activated carbon, the solution ph and the temperature on adsorption of ibuprofen. Carbon 2013, 54, 432–443. [Google Scholar] [CrossRef]
  22. Contescu, A.; Contescu, C.; Putyera, K.; Schwarz, J.A. Surface acidity of carbons characterized by their continuous pk distribution and boehm titration. Carbon 1997, 35, 83–94. [Google Scholar] [CrossRef]
  23. Bandosz, T.J.; Buczek, B.; Grzybek, T.; Jagiełło, J. The determination of surface changes in active carbons by potentiometric titration and water vapour adsorption. Fuel 1997, 76, 1409–1416. [Google Scholar] [CrossRef]
  24. Mestre, A.S.; Pires, J.; Nogueira, J.M.F.; Carvalho, A.P. Activated carbons for the adsorption of ibuprofen. Carbon 2007, 45, 1979–1988. [Google Scholar] [CrossRef]
  25. Strelko, V.; Malik, D.J. Characterization and metal sorptive properties of oxidized active carbon. J. Colloid Interface Sci. 2002, 250, 213–220. [Google Scholar] [CrossRef] [PubMed]
  26. Tennant, M.F.; Mazyck, D.W. The role of surface acidity and pore size distribution in the adsorption of 2-methylisoborneol via powdered activated carbon. Carbon 2007, 45, 858–864. [Google Scholar] [CrossRef]
  27. Kato, Y.; Machida, M.; Tatsumoto, H. Inhibition of nitrobenzene adsorption by water cluster formation at acidic oxygen functional groups on activated carbon. J. Colloid Interface Sci. 2008, 322, 394–398. [Google Scholar] [CrossRef] [PubMed]
  28. Seredych, M.; Hulicova-Jurcakova, D.; Lu, G.Q.; Bandosz, T.J. Surface functional groups of carbons and the effects of their chemical character, density and accessibility to ions on electrochemical performance. Carbon 2008, 46, 1475–1488. [Google Scholar] [CrossRef]
  29. Schönherr, J.; Buchheim, J.; Scholz, P.; Stelter, M. Oxidation of carbon nanotubes with ozone and hydroxyl radicals. Carbon 2017, 111, 631–640. [Google Scholar] [CrossRef]
Figure 1. (a) Potentiometric titration curves and (b) first derivative of the titration curves for direct titration with HCl as the titrator solution.
Carbon 04 00021 g001
Figure 2. (a) Potentiometric titration curves and (b) first derivative of the titration curves for titration of HCl as analyte solution and NaHCO3, Na2CO3, and NaOH as titrator solution (representing the indirect titration).
Carbon 04 00021 g002
Figure 3. Value range of titration results around the average of the respectively examined eight 10 mL aliquots (canalyte, titrator solution = 0.01 N, HCl as acid).
Carbon 04 00021 g003
Figure 4. Potentiometric titration curves of HCl with Na2CO3: (a) 7 min titration time and (b) 30 min titration time (dotted line: equivalence point).
Carbon 04 00021 g004
Figure 5. Schematic diagram of the recommended indirect titration method with Na2CO3 as titrator solution (sample: carbon-treated base after removal of the carbon).
Carbon 04 00021 g005
Figure 6. Difference between aCNT-treated reaction base and the reference base at different base concentrations.
Carbon 04 00021 g006
Figure 7. Difference between reference and oCNT-treated reaction base for different macrostructured oCNTs.
Carbon 04 00021 g007

