Article

High-Bandwidth and Sensitive Air Flow Sensing Based on Resonance Properties of CNT-on-Fiber Hairs

1
Air Force Research Laboratory, Materials and Manufacturing Directorate, Universal Technology Corporation, Wright-Patterson Air Force Base, Dayton, OH 45433, USA
2
Air Force Research Laboratory, Munitions Directorate, Eglin Air Force Base, Valparaiso, FL 32542, USA
3
Air Force Research Laboratory, Materials and Manufacturing Directorate, Wright-Patterson Air Force Base, Dayton, OH 45433, USA
*
Author to whom correspondence should be addressed.
Submission received: 21 December 2016 / Revised: 21 February 2017 / Accepted: 27 February 2017 / Published: 8 March 2017
(This article belongs to the Special Issue Carbon-Based Sensors)

Abstract

:
Artificial hair flow sensors were fabricated using piezoresistive, radially grown carbon nanotube arrays on glass fibers and investigated for their dynamic aerodynamic response as measured within an instrumented plane-wave tube. The sensors were experimentally observed to provide both a large bandwidth of operation below first resonance and a strong resonance response at selected frequencies above first resonance. The frequency of first resonance was easily tunable by adjusting the length of the exposed hair and could be made to vary from a few hundred hertz to over 13 kHz. Higher frequency bands were accessible for a given hair length using higher-order resonance modes, up to five of which were observed. All of the responses were understood and modeled using a vibrating Euler-Bernoulli beam analysis.

Graphical Abstract

1. Introduction

In addition to a hair sensor’s flow sensitivity and response range, the frequency or range of frequencies for which the sensor is useful is of high importance. Sensitivity has been previously discussed and includes both the ability to measure a small amplitude of air perturbation and the magnitude of response per change in air velocity past this threshold [1,2,3,4]. The frequency bandwidth of useful operation has been discussed to a smaller extent. It typically includes the in-phase response recorded from quasi-static deflection (DC) to the first natural resonance of the system. For auditory or sonar applications of hair sensors and more exotic frequency-tuned air flow response schemes, the change in air flow at a specific frequency can be isolated by operating an individual hair sensor at its resonance frequency or with a collection of resonance-tailored sensors effectively serving as a bandpass detector [5,6,7]. In this case, a strong resonant response would be desired at the frequency of interest. Artificial hair sensors which have a strong and frequency-tunable resonance response as well as high sensitivity before the first resonance could function both as a proportional flow sensor below resonance and as a bandpass detector at the selected resonance frequencies.
A number of artificial hair sensor schemes have been previously developed with different hair dimensions, transduction element types, and performance metrics, with the resonance properties only reported for a few. Krijnen et al. suggested the product of the threshold and frequency response bandwidth as a figure of merit for hair sensors [3]. Their 1-mm-long SU8 polymer hairs were mounted on a suspended capacitive membrane which rotated at the base under air flow to give a resonance frequency of 500 Hz. The devices were fabricated using microelectromechanical systems (MEMS) processes, and they have been measured in an air flow tube [8]. Chen et al. also use MEMS processes to fabricate a silicon cantilever arm for 600-μm-long SU8 hairs that resonate at 3.1 kHz [9]. Tamaddoni et al. demonstrated cantilever bending and a 293 Hz primary resonance in a sensor with a hydrogel-supported lipid bilayer transducer and a 12-mm-long glass fiber [10], and Sarlo et al. recently investigated arrays of similar sensors and the mapping of velocity [11]. Yilmazoglu et al. recently used arrays of carbon nanotubes (CNTs) as both the piezoresistive transduction element and the hair pillars and reported that the sensors maintained functionality even after deflection at 2 kHz [12].
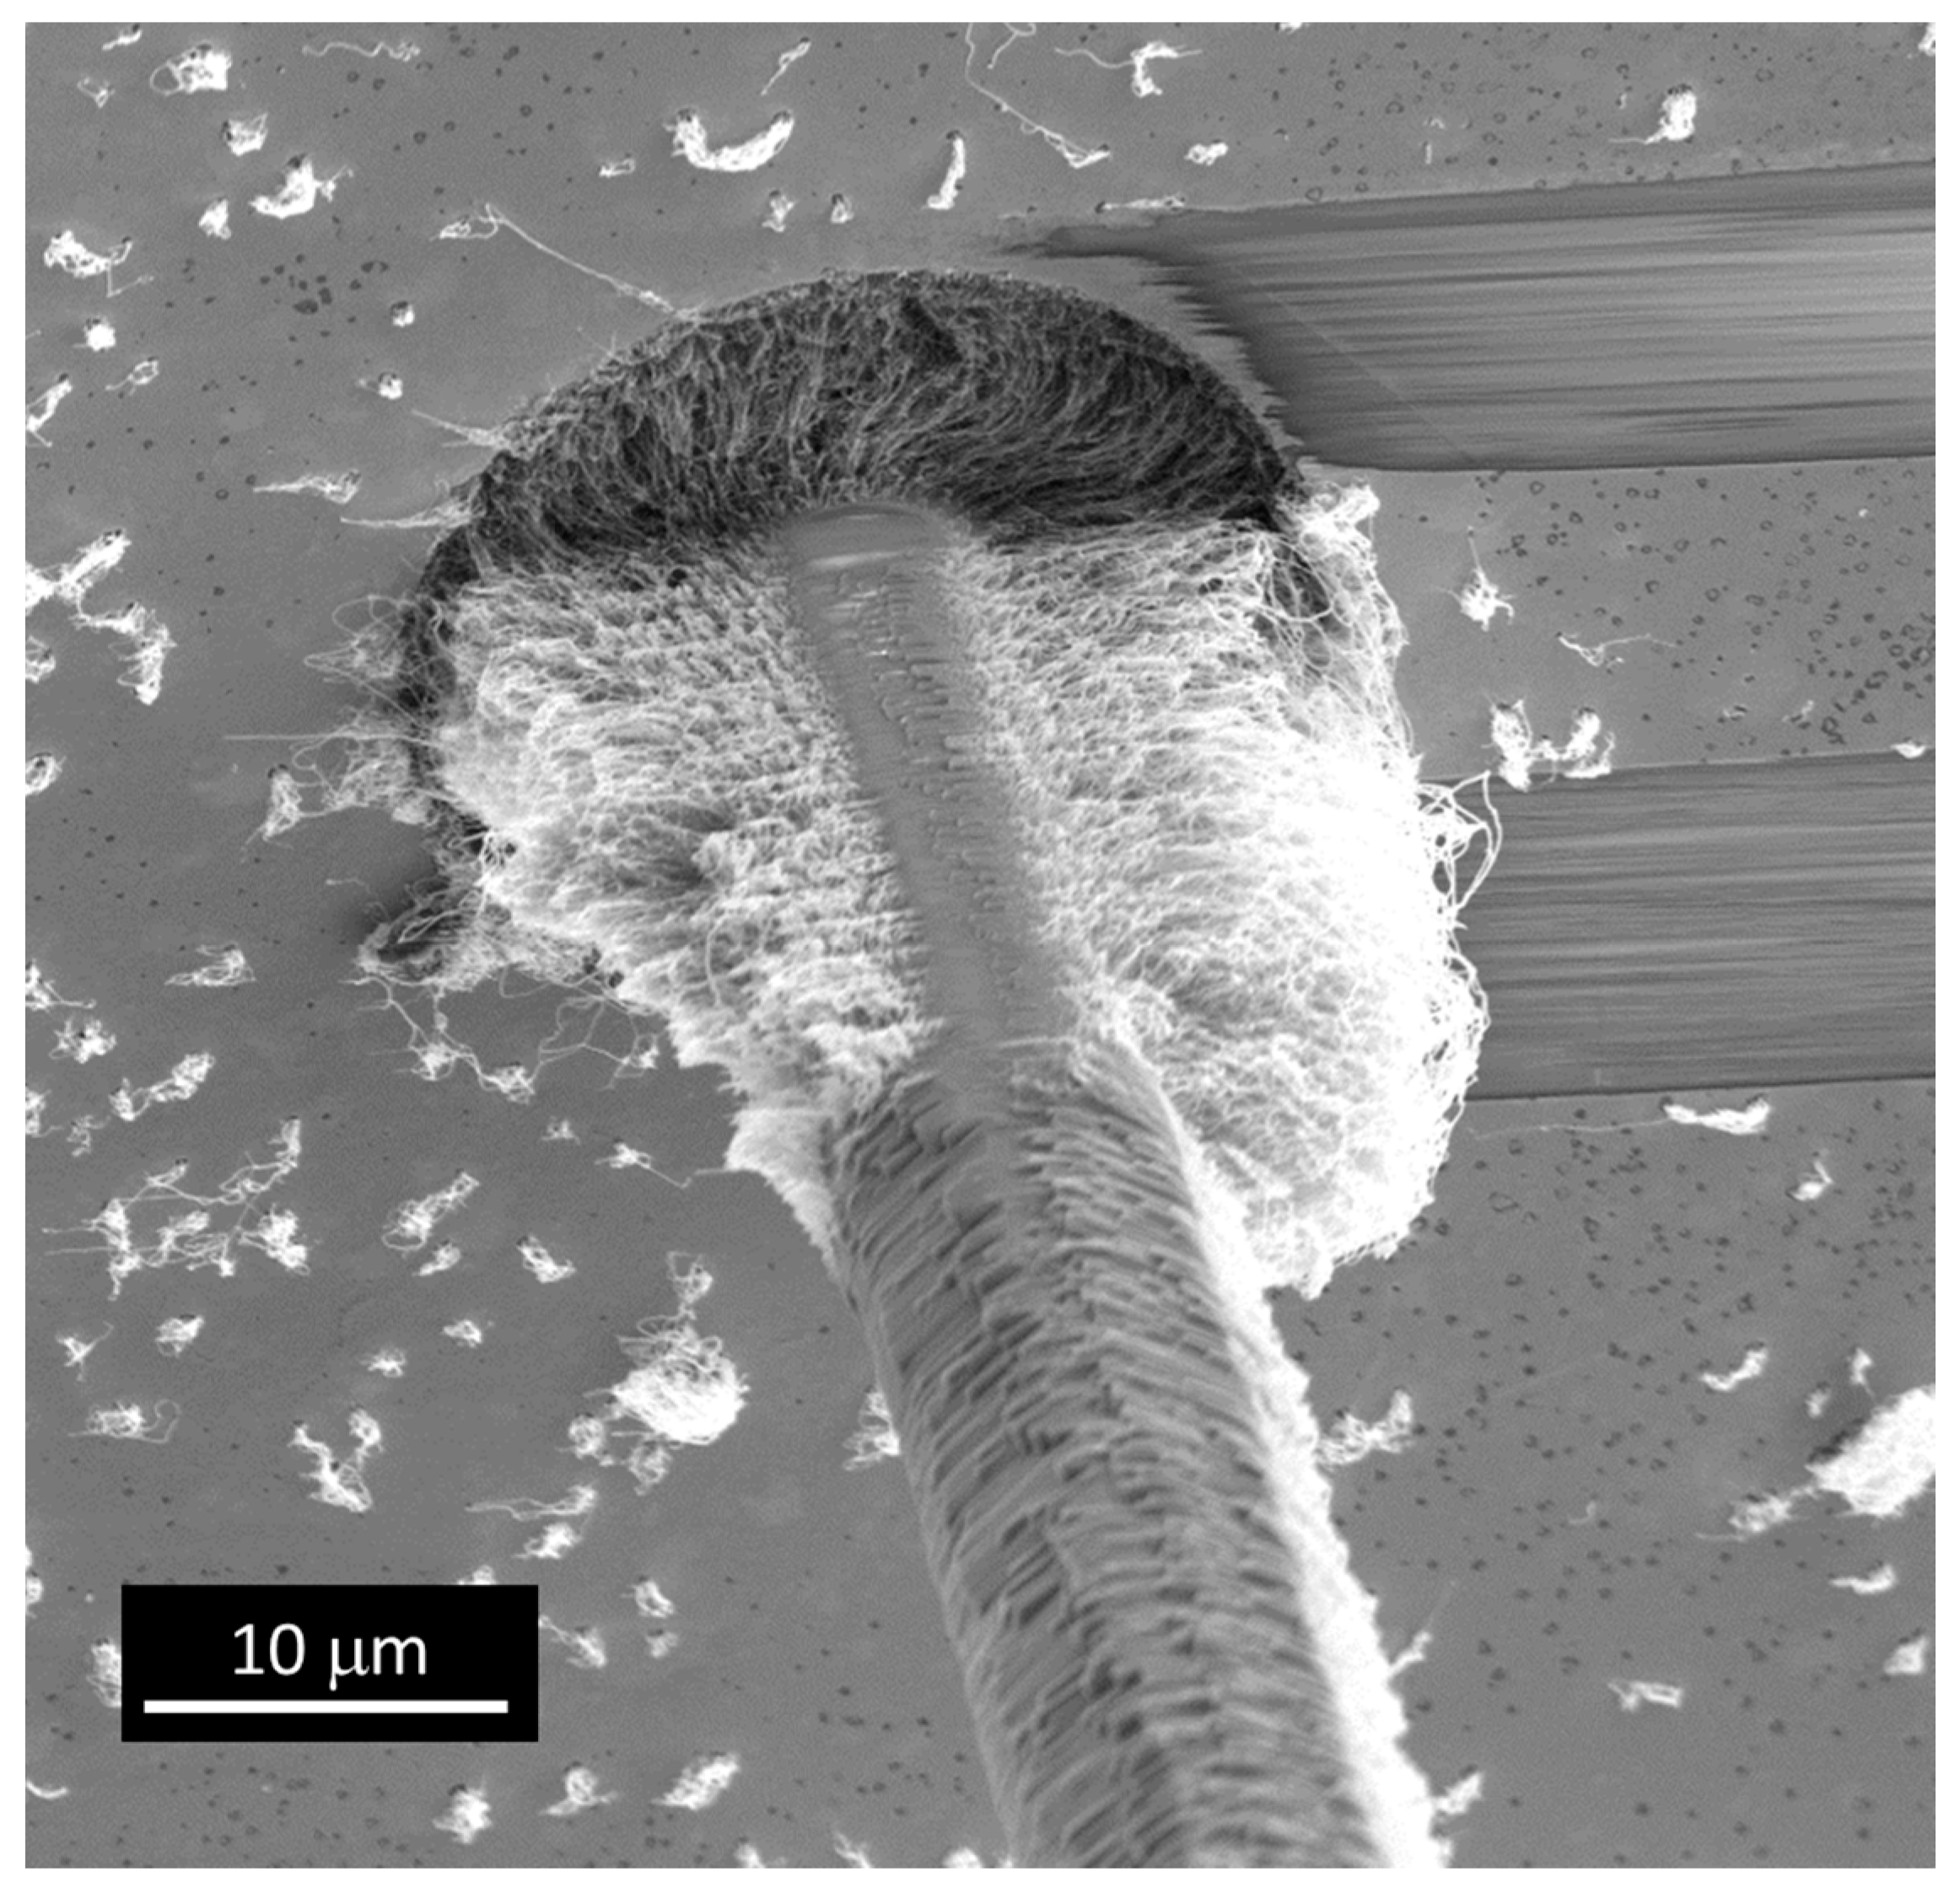
Here we discuss the frequency response of non-MEMS hair flow sensors consisting of a piezoresistive, radial array of CNTs grown on a glass microfiber hair partially within an electroded glass capillary. The length of the glass fiber hair is adjustable in height to a predictable and tunable first resonance frequency as well as a sensitive response before first resonance. Due to the strong resonance, higher-order resonant modes are accessible at even higher frequencies. The fabrication, sensitivity to steady aerodynamics, internal mechanics, and integration of arrays into aerodynamic structures of these CNT-based sensors have been previously discussed [1,4,13]. Essentially, the external aerodynamic loading induces a moment inside the capillary which compresses the radially grown CNT array, providing a sigmoidal resistance change (decrease) as a function of flow velocity or deflection.
In now considering the response as a function of dynamic flow (e.g., frequency of deflection), the natural frequencies of a vibrating Euler-Bernoulli beam are known to be
f n = 1 2 π α n 2 L E 2 E I ρ A
where I, E, ρ, A, and LE are the moment of inertia, Young’s modulus, density, cross-sectional area, and length of the beam, respectively. This assumes the bending stiffness (EI) and mass per length (ρA) do not greatly vary along the length of the beam. The αn values are determined from the boundary conditions of the beam. Assuming a beam that is free at one end (moment, shear = 0) and fixed at the other (slope = 0), the first four αn values are 1.875, 4.694, 7.854, and 10.996 [14]. While the total length of the hair (LT) includes the portion of fiber enclosed by the capillary, this model most closely matches these devices if the beam is considered only as the length of the fiber external to the capillary (LE) and the hair is assumed to be fixed at the opening of the capillary.
Going further, it has been previously shown that these sensors can be more accurately modeled as beams supported by an elastic foundation [4,15,16]. In the case of the dynamic response of the sensor, a stiffness constant k appears in the time-varying Euler beam equation:
E I 4 y ( x , t ) x 4 + k y ( x , t ) + ρ A 2 y ( x , t ) t 2 = 0
where k is zero outside the capillary (x ≥ 0). This “partial elastic base” condition can be solved by treating the two sections of the beam independently and matching the solutions at the opening of the capillary. The resonance frequencies are found from the relationship
f n = 1 2 π ( β n 2 L T 2 E I ρ A ) 2 + k ρ A
where the βn values are determined from the boundary conditions [15,17]. In this case, for these devices, the hair is modeled as having a free end outside of the capillary (x = LE) and a fixed end at the bottom of the capillary (x = LELT). In the absence of an elastic base (k = 0), the βn values are identical to the αn values in Equation (1) and the natural frequencies are the same as those found from the fixed base model but with LE replaced by LT. Further, for an infinite value of k in the elastic base model, the two models predict the same resonance frequencies. Using this approach, the frequency response of the experiment response of the fabricated hair sensors can be compared with their predicted responses.
The nanotubes surrounding the glass fiber inside the capillary act as the elastic base, supporting the fiber along the length of hair internal to the capillary. The value of the stiffness constant can be determined by characterizing the bending and deflection of the hair under mechanical loading or by measuring the electrical response under various loading conditions, noting that the electrical response is uniquely a function of the bending moment on the hair [4]. It has been shown that the relationship between the elastic base stiffness and the compressive modulus of the CNTs (κ) can be approximated as
k κ r π 2 ( R r )
where r is in the radius of the glass fiber and R is the inner radius of the capillary.

2. Results

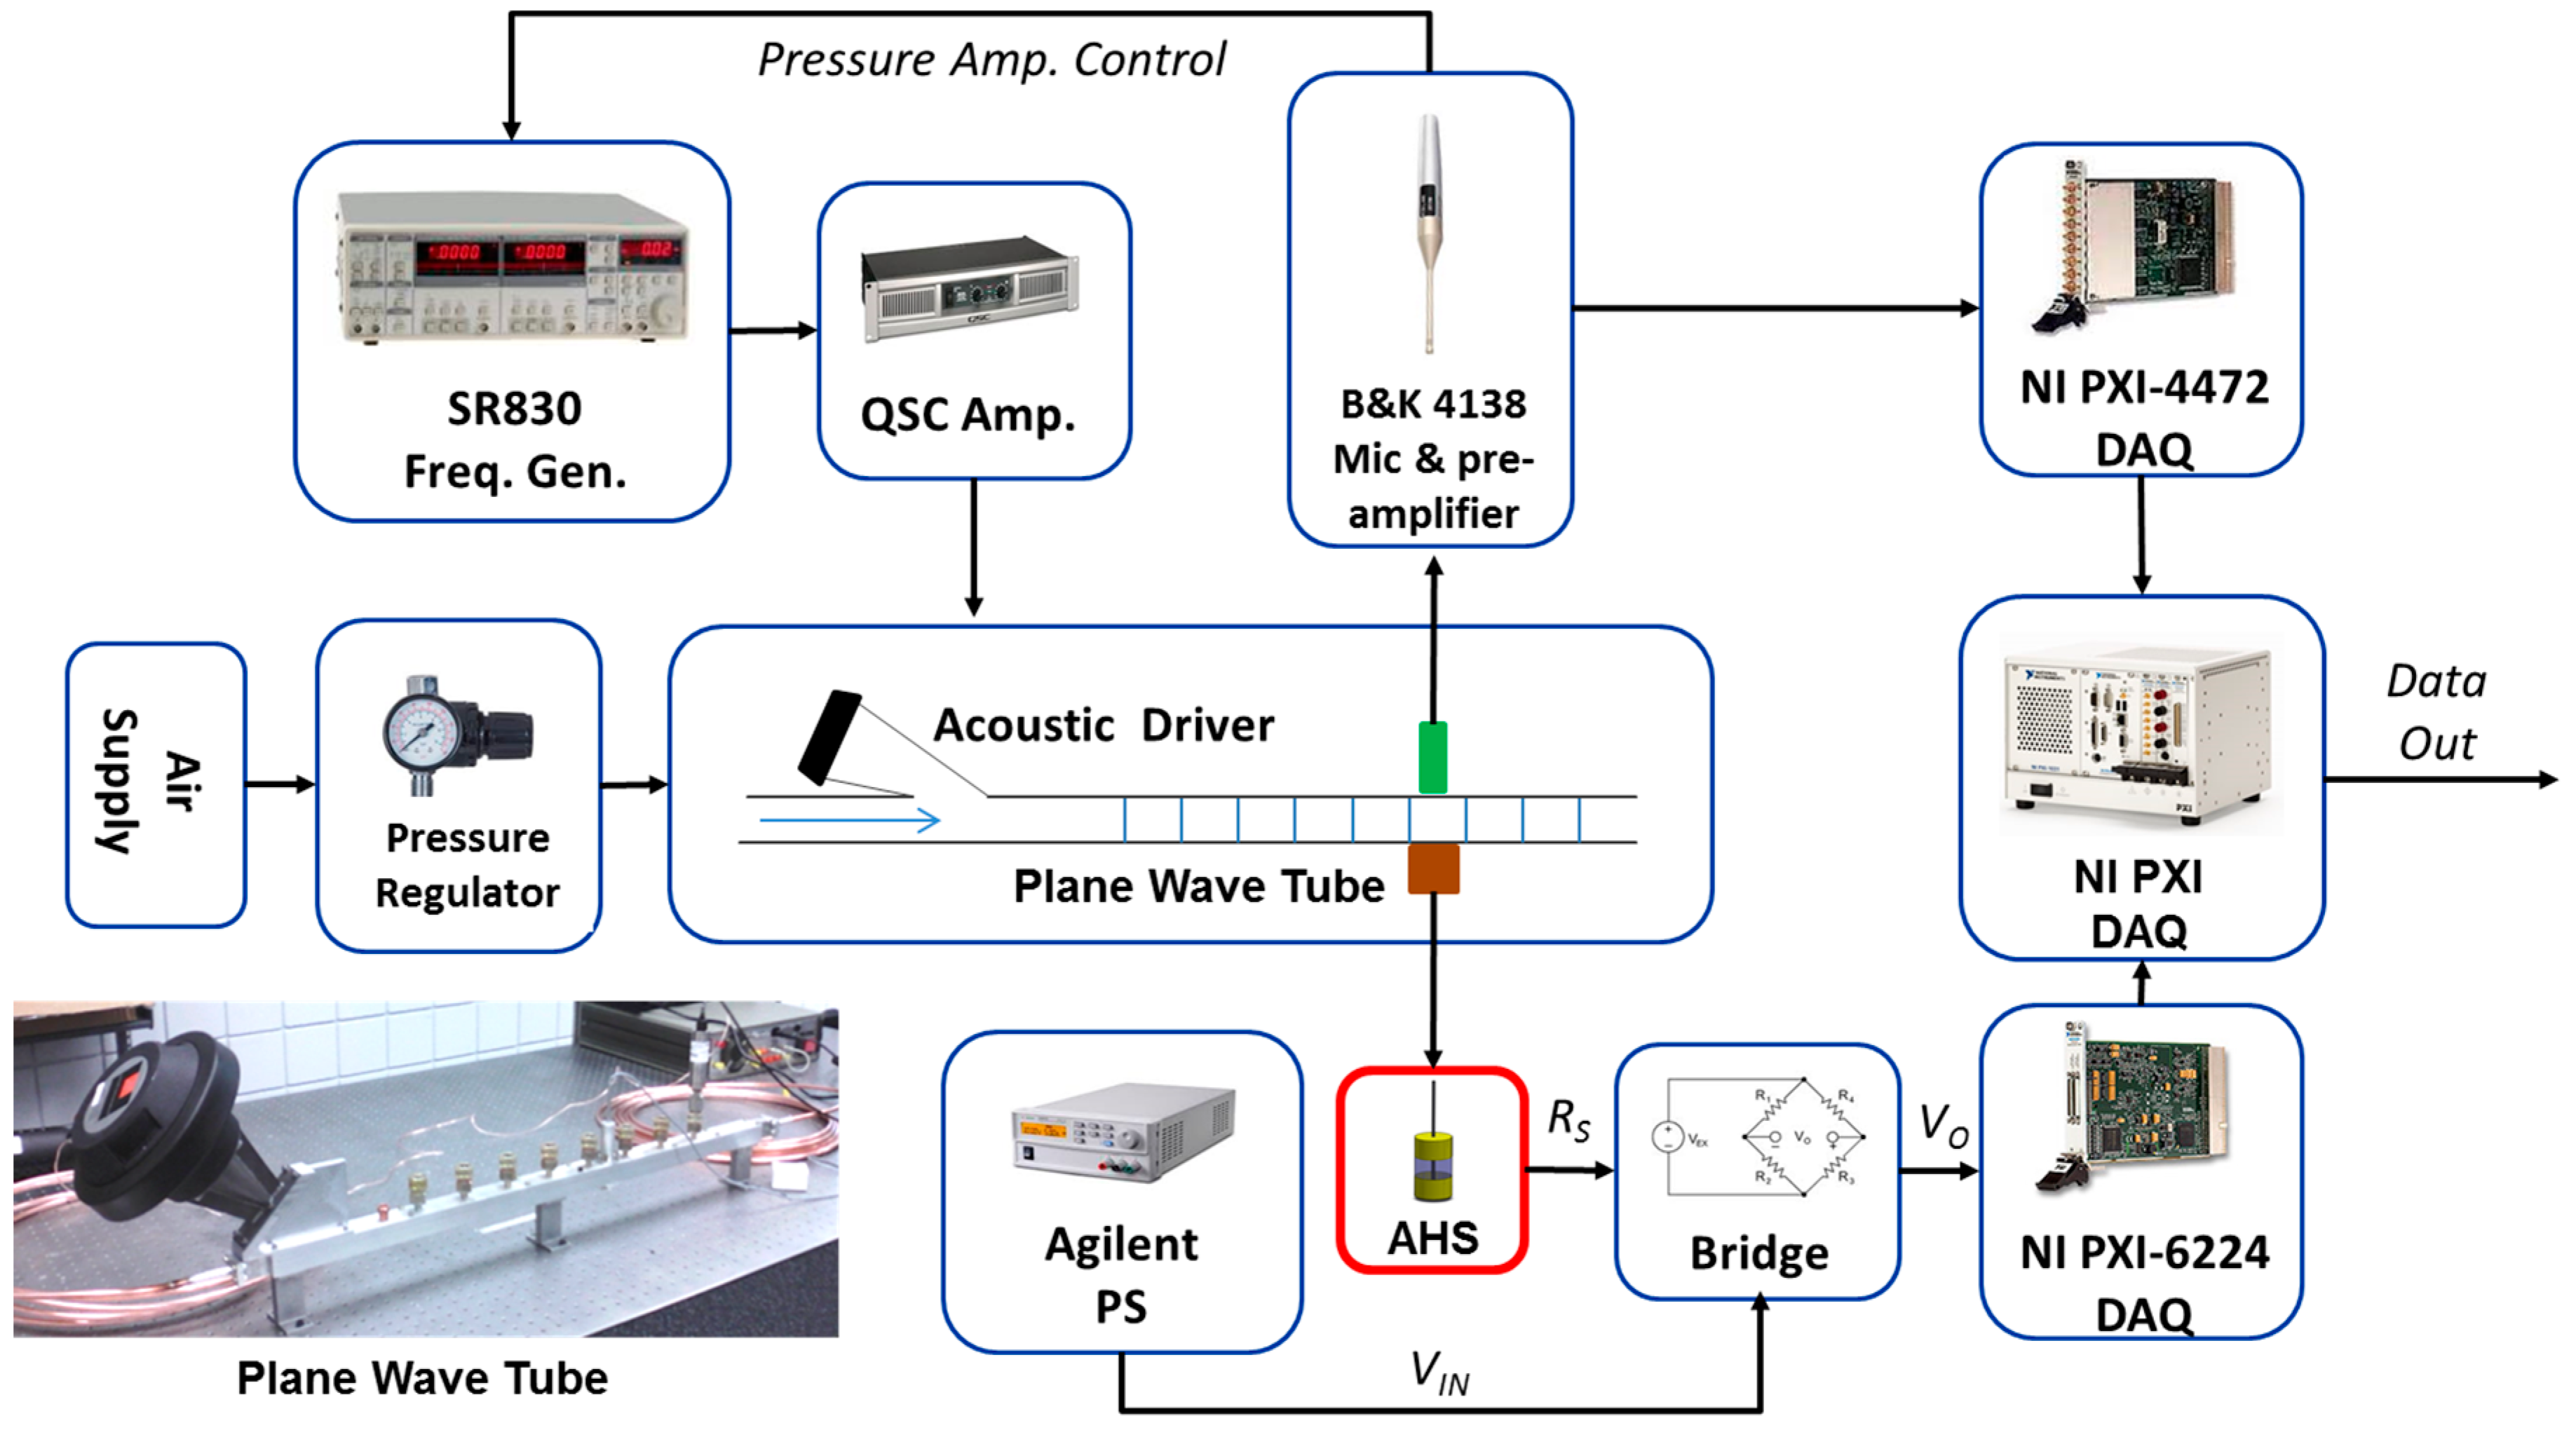
Three sensors were investigated in terms of their frequency response using a plane-wave tube. The air flow was dynamically modulated by an audio speaker connected to a 1-m-long, 5-mm-square inner diameter aluminum alloy tube. The speaker was coupled into to the tube at an angle and driven by a power amplifier receiving a sinusoidal input signal from a lock-in amplifier to expose the hairs to air flows at acoustic frequencies. The sound pressure near the sensor was measured with a microphone mounted at the top of the tube at its lengthwise and widthwise center. A proportional–integral–derivative (PID) controller was used to adjust the output of the speaker to maintain a constant signal on the microphone at each frequency. The sensors were mounted at the bottom of the tube directly below the microphone. Propagating plane waves were expected up to a cutoff frequency of about 34 kHz for this tube [18]. The setup is more completely described in the Materials and Methods Section.
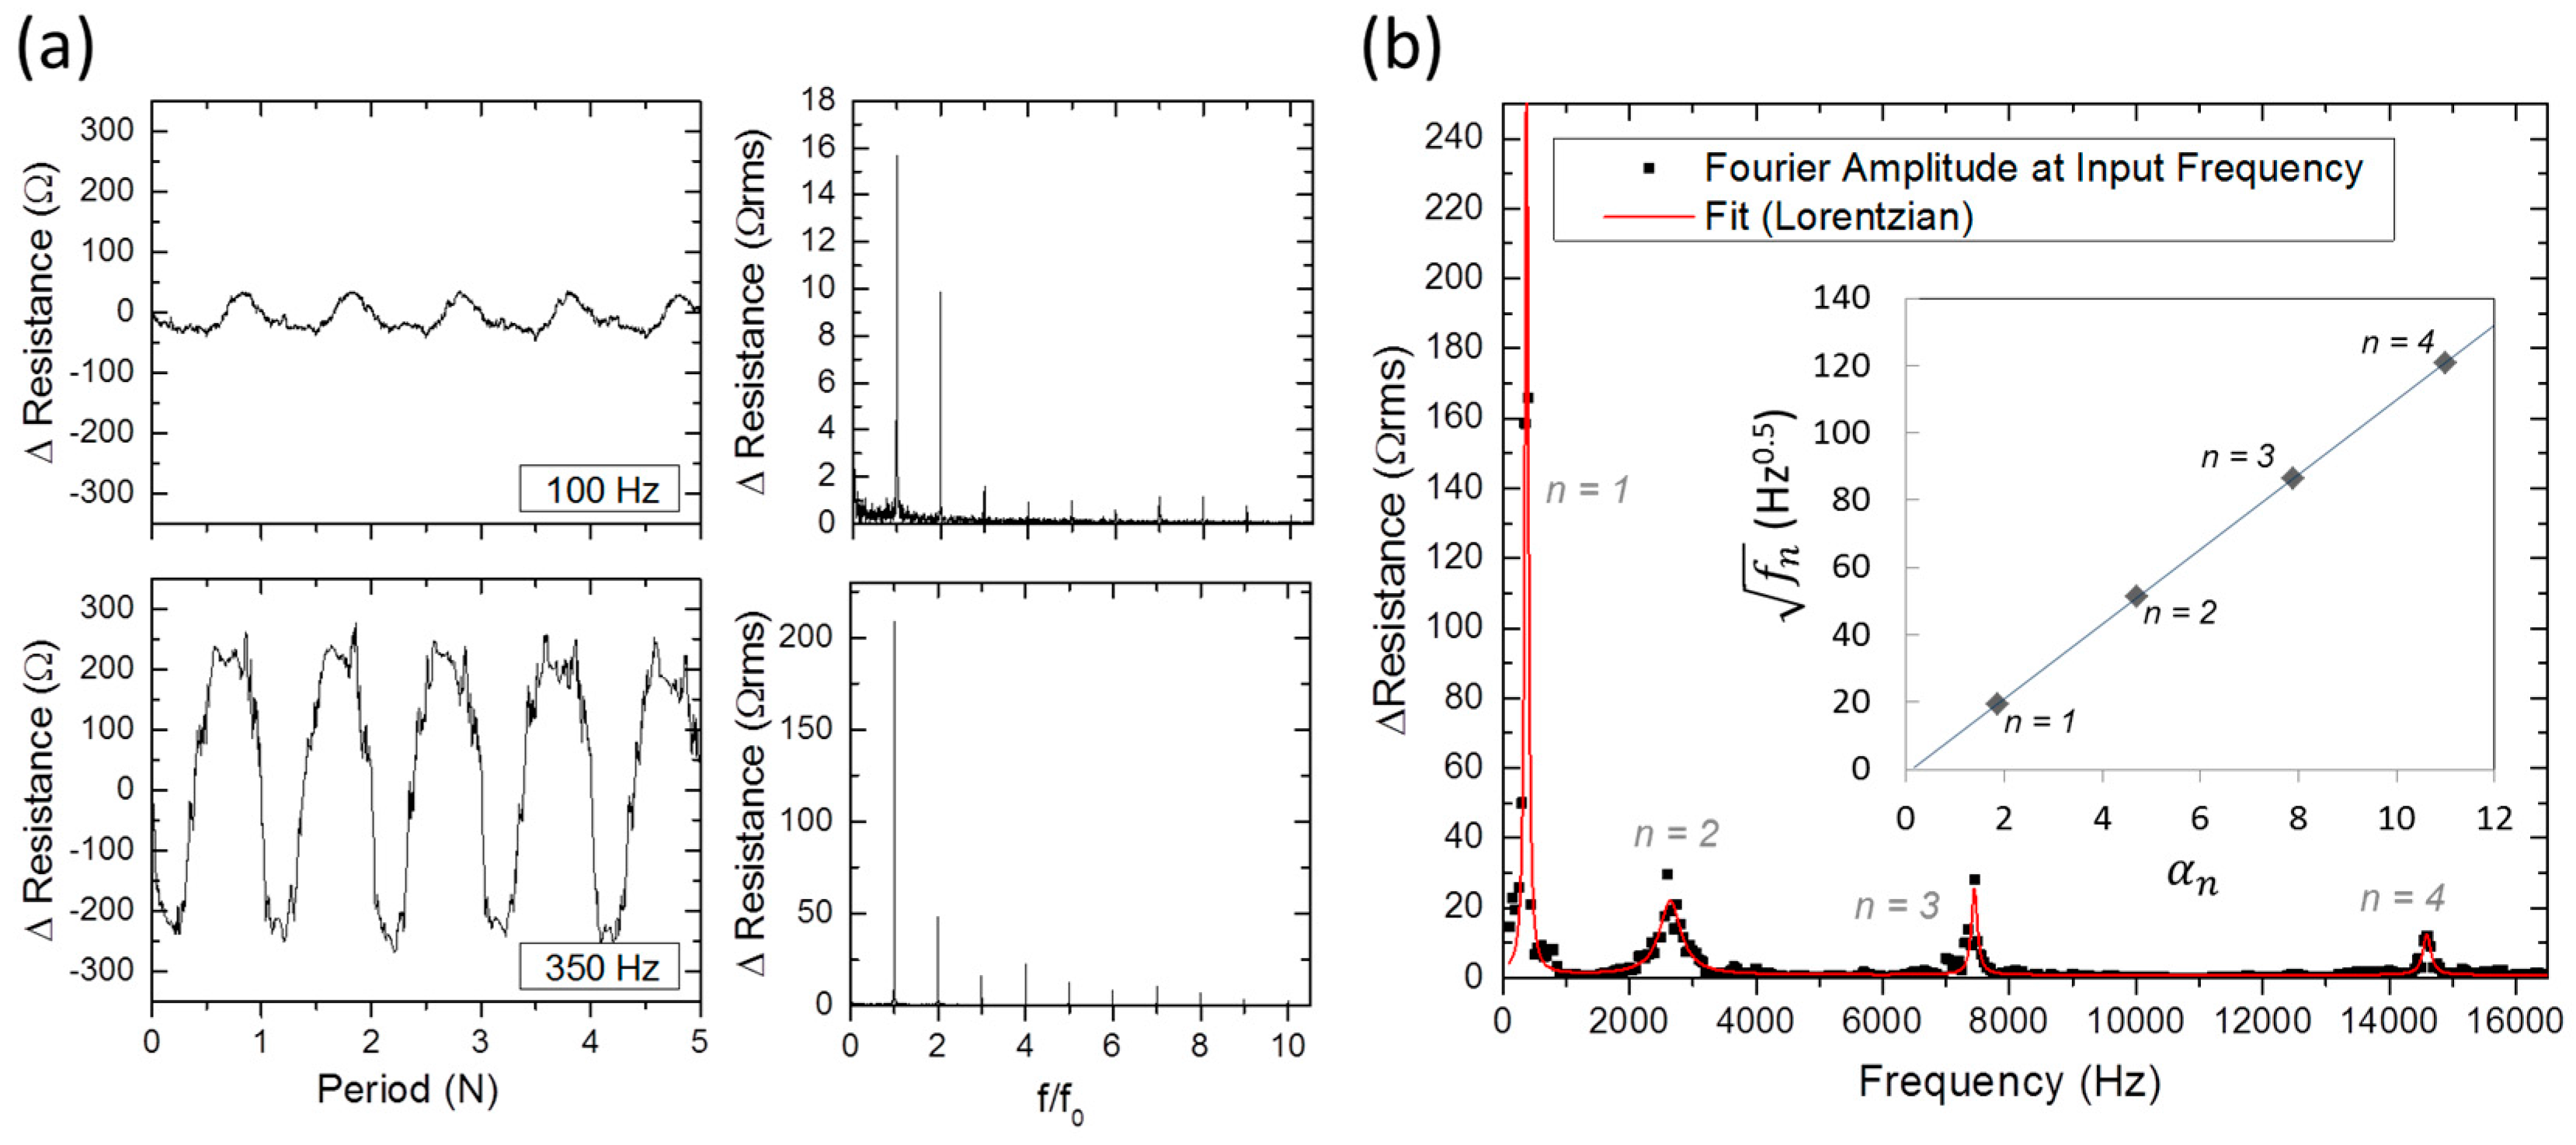
The response of Sensor 1 (LE = 4.00 mm) to dynamically modulated air flow is shown in Figure 1a over five periods at two drive frequencies (100 Hz and 350 Hz), along with the corresponding Fourier transformed frequency response. In both cases, the root mean square (RMS) amplitude of the supplied modulation was 300 Pa RMS as measured by the microphone. At 350 Hz, the hair was in resonance with the air flow, as suggested by the large increase in the magnitude of the resistance change and the sinusoidal response to the sinusoidal input. The magnitude of the Fourier transformed response at the driving frequency is plotted in Figure 1b versus the driving frequency. The square root of the resonance frequencies can be seen to vary linearly with the fixed-base αn of Equation (1) (inset of Figure 1b), indicating a well-behaved elastic response.
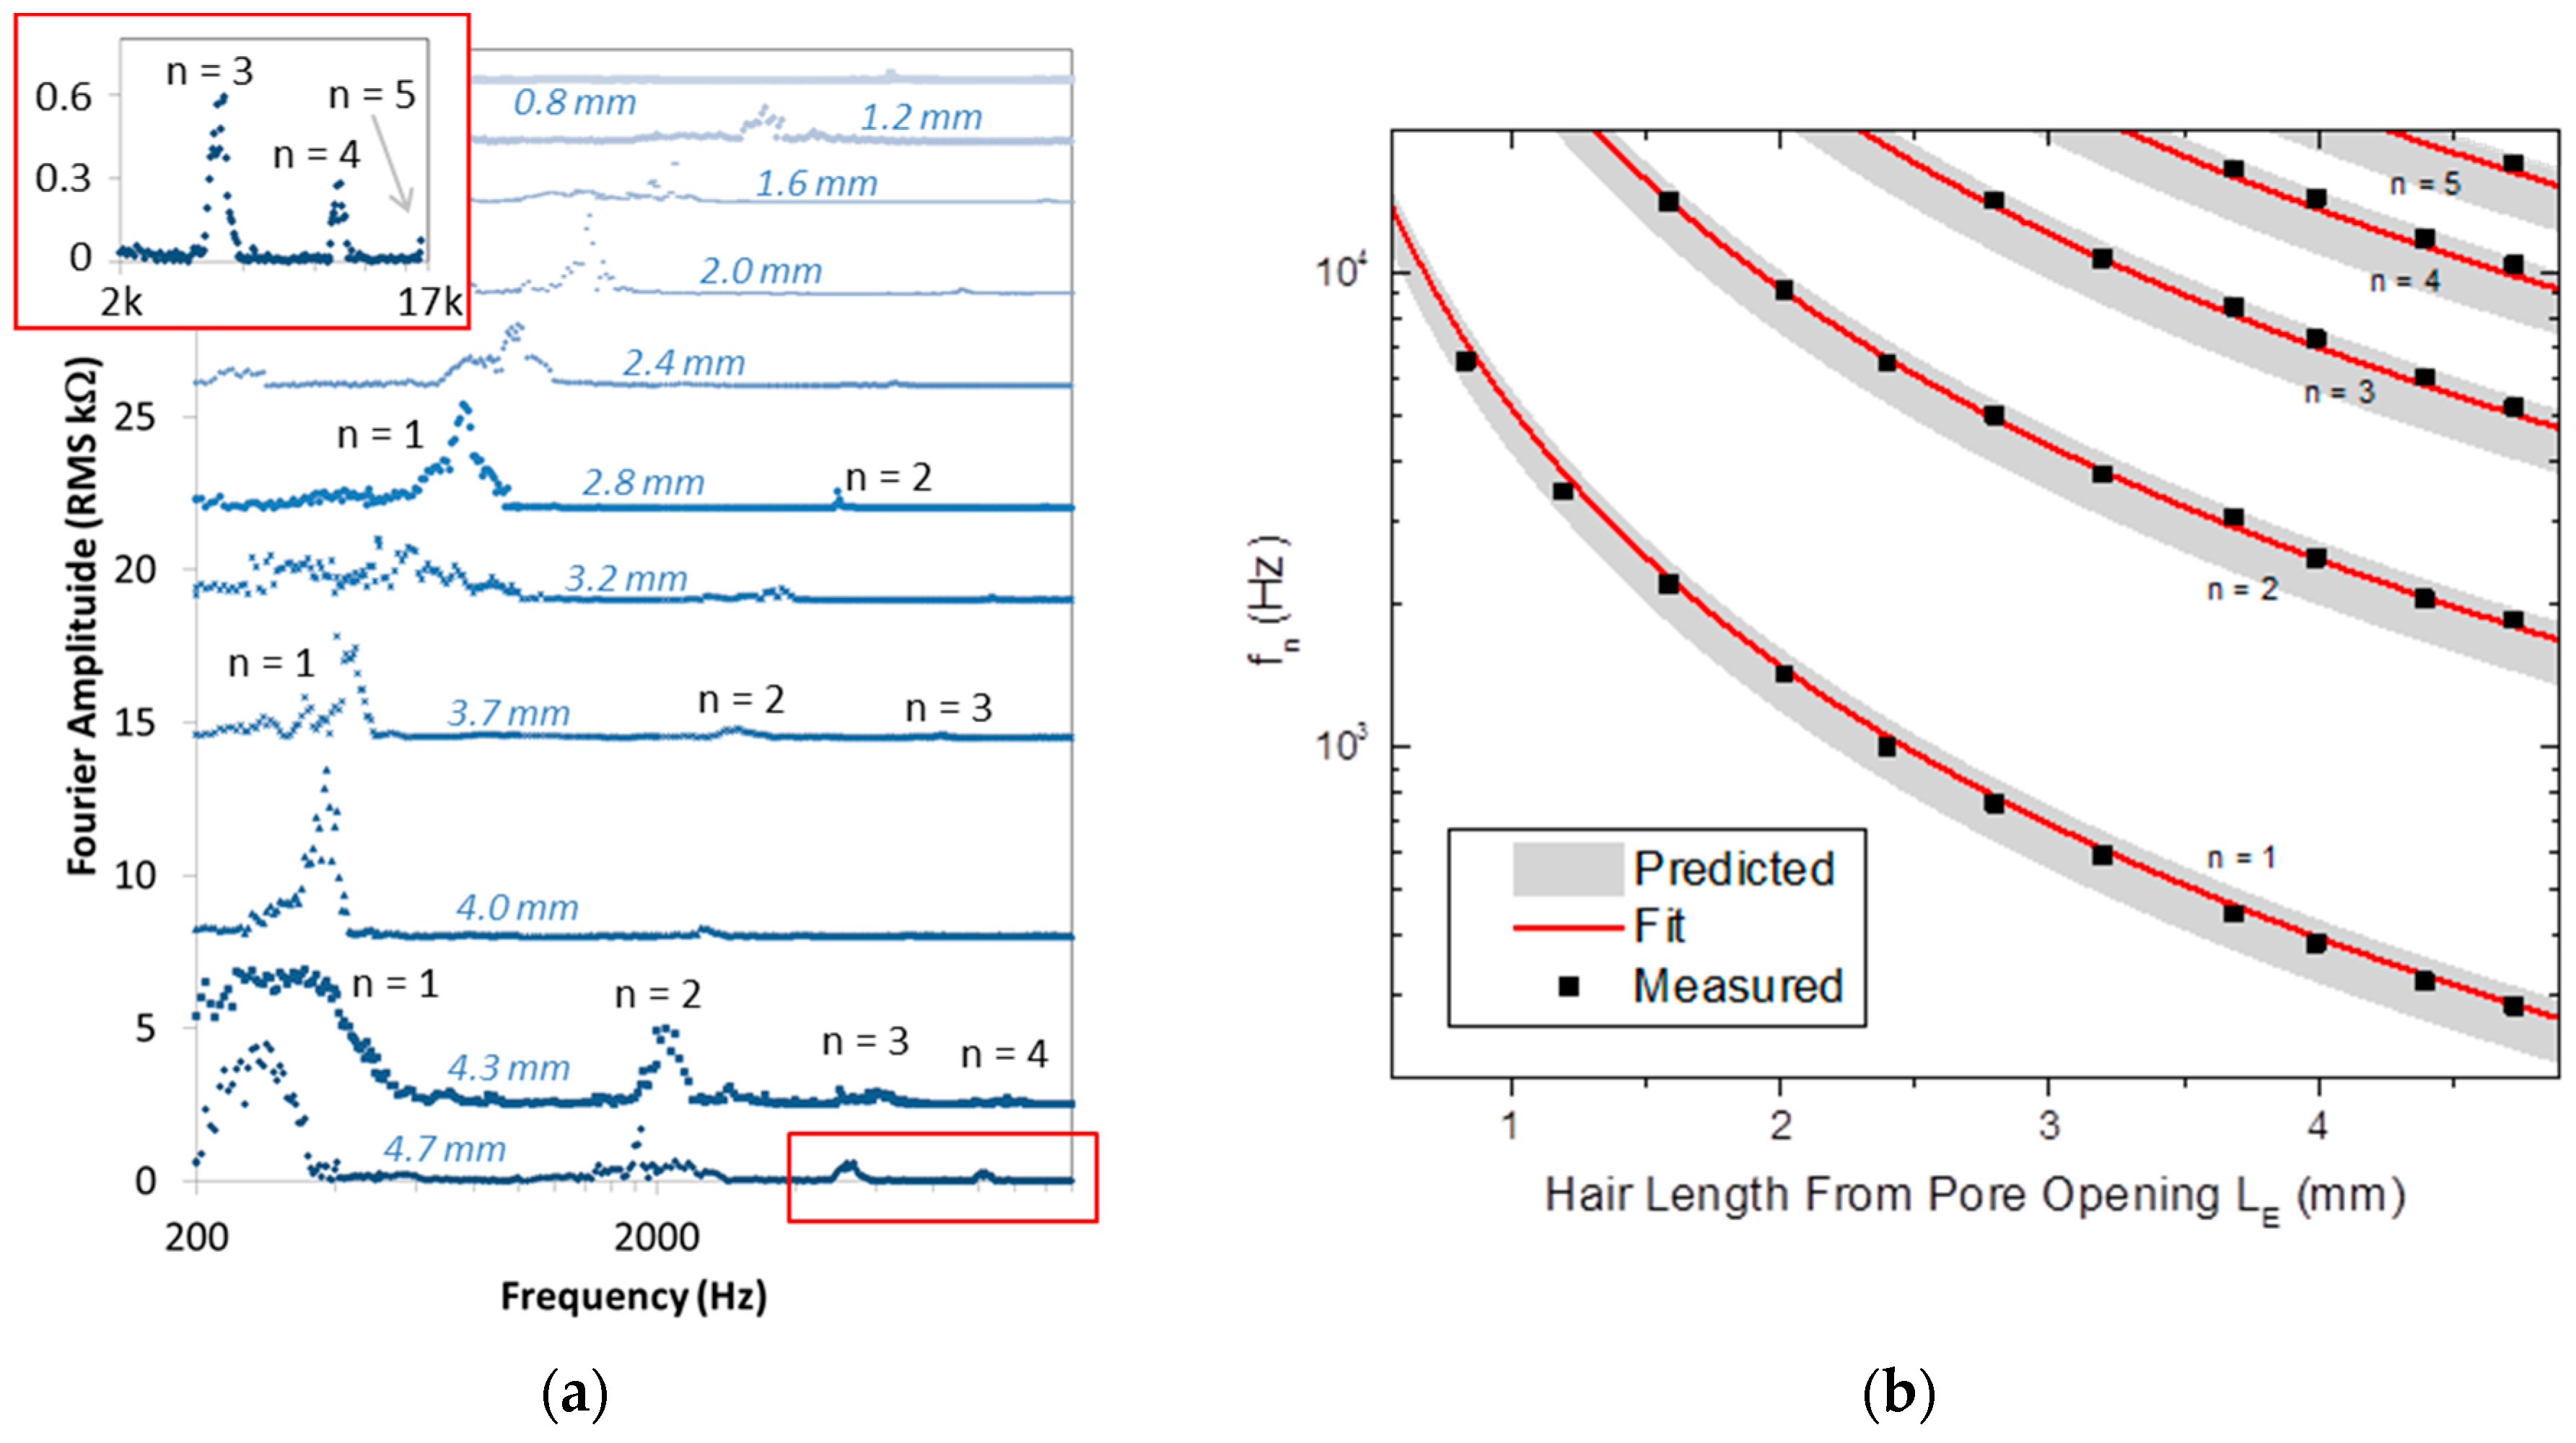
To investigate the relationship between the vibrational response of the sensors and their exposed hair length, a second sensor (Sensor 2) was incrementally reduced from an initial LE of 4.73 mm to a final LE of 0.83 mm. This sensor was one of 25 sensors previously examined in steady flow conditions [4]. The magnitude of the Fourier transformed response is plotted versus the frequency in Figure 2a for each length. Up to five resonance peaks are visible at the initial hair length and progressively shift to higher frequencies as LE is reduced as expected. The peaks corresponding to the primary mode can be fit to the expression for a damped oscillator with a small damping coefficient (e.g., 0.008 for LE of 2.78 mm). The resonance frequencies were extracted and are plotted versus the exposed length in Figure 2b.
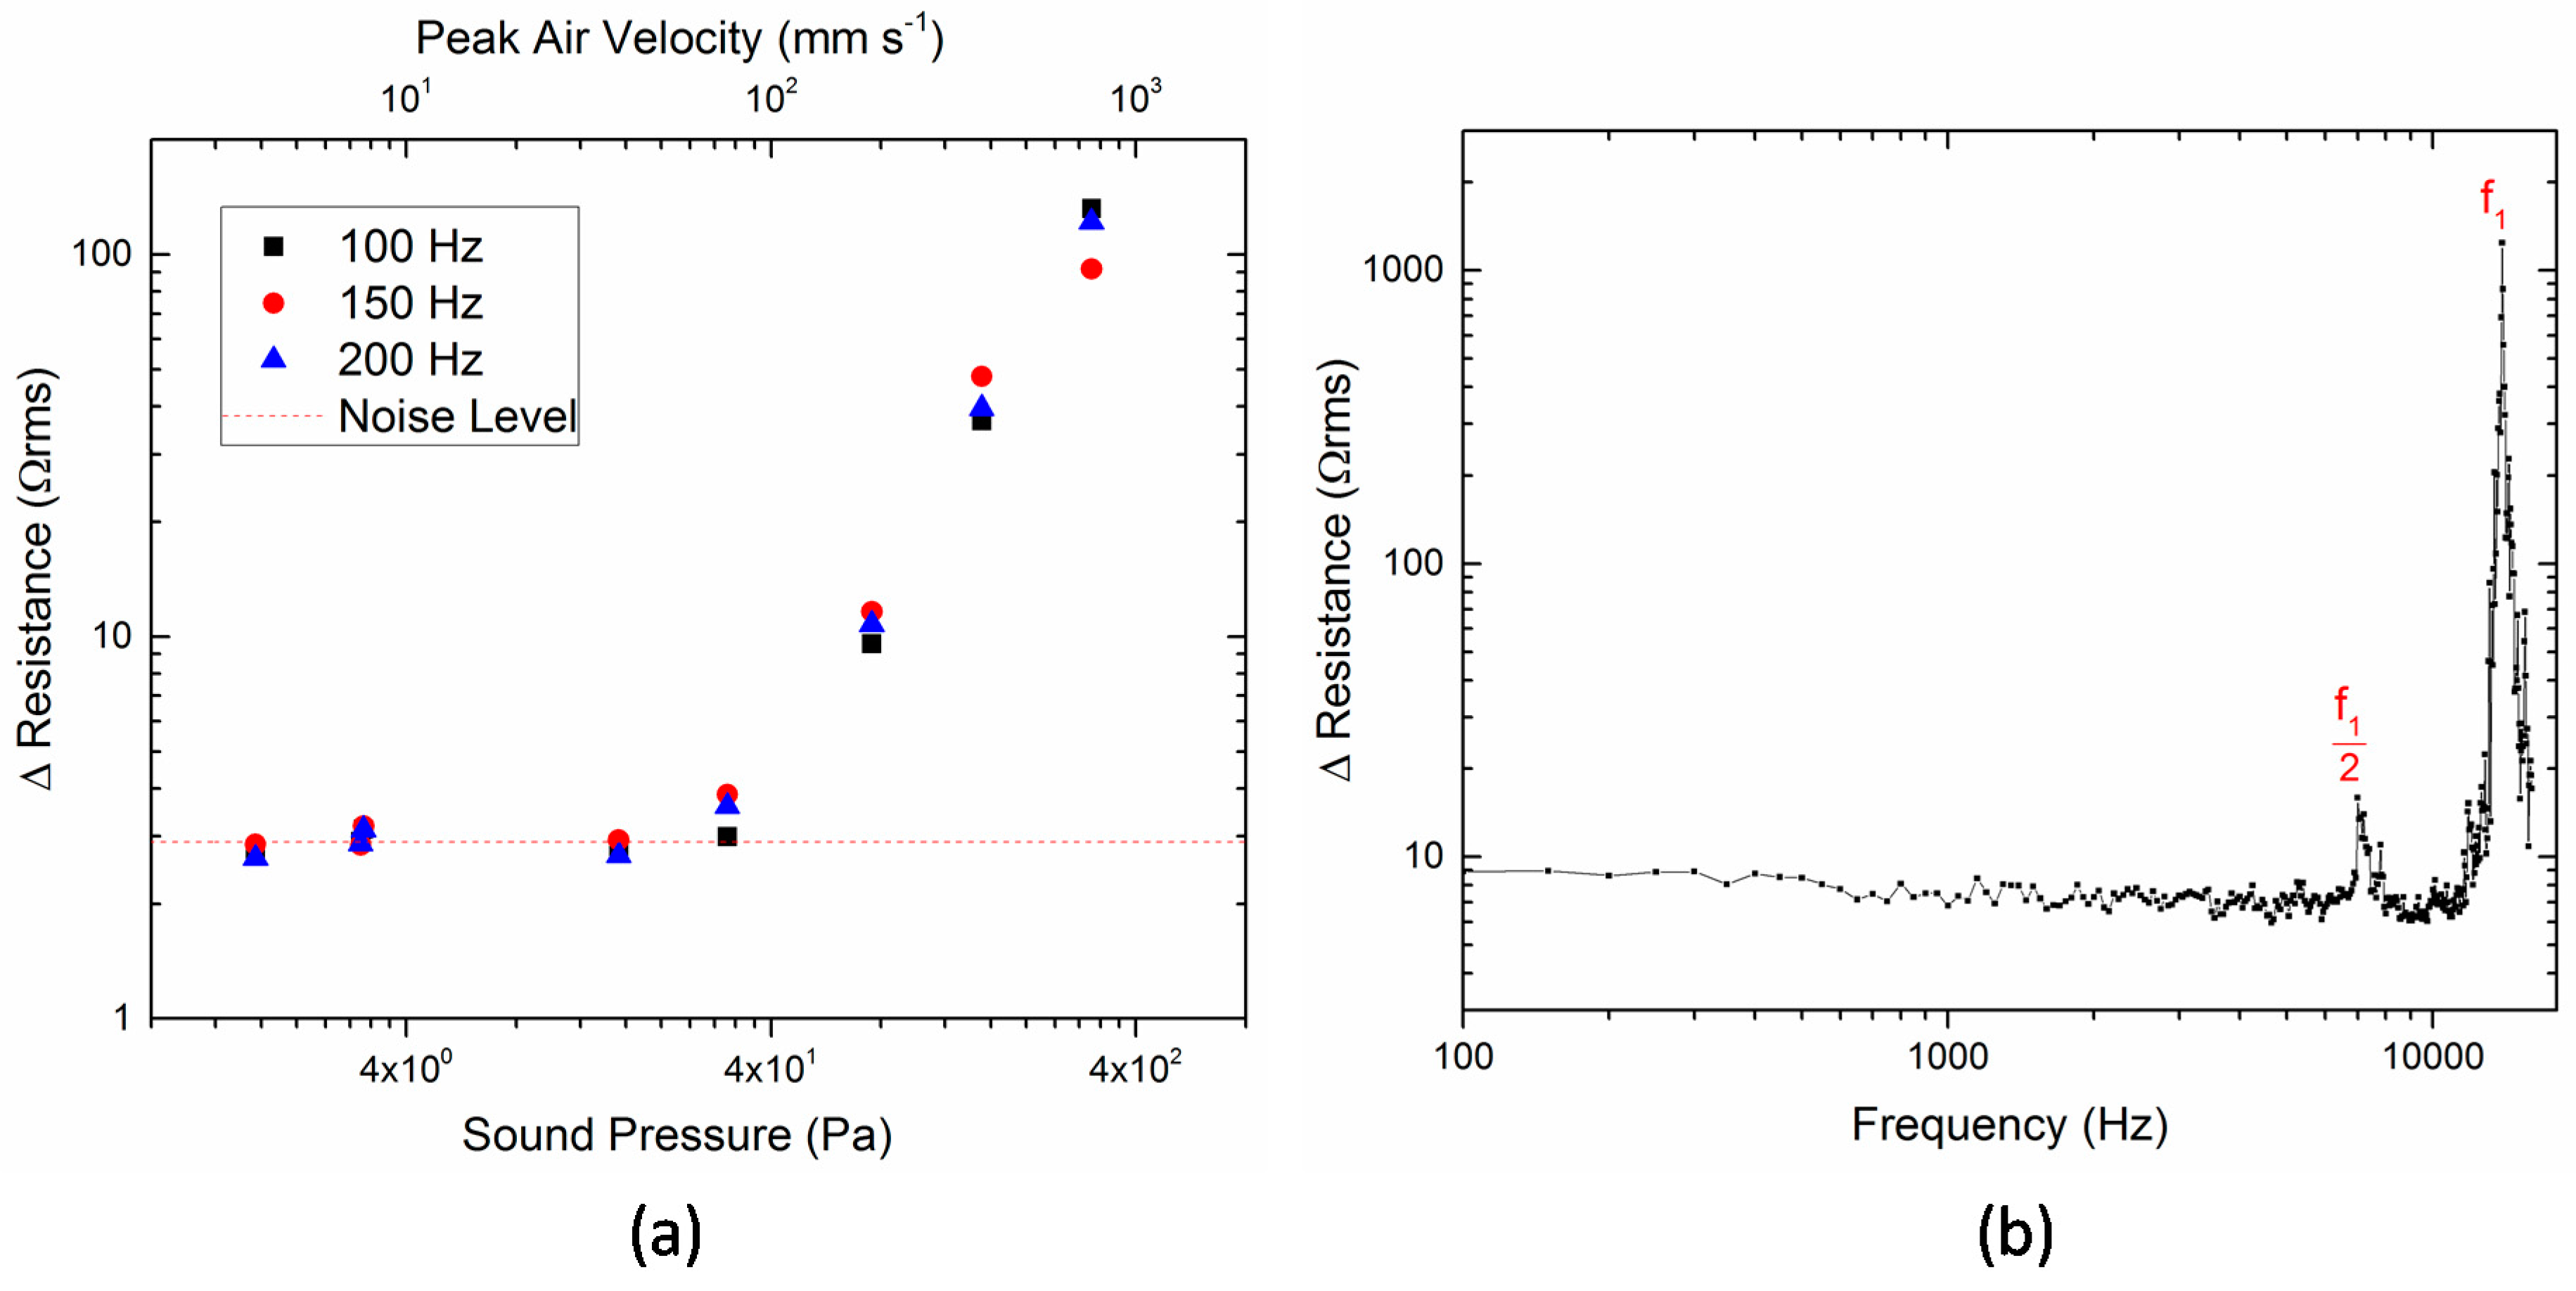
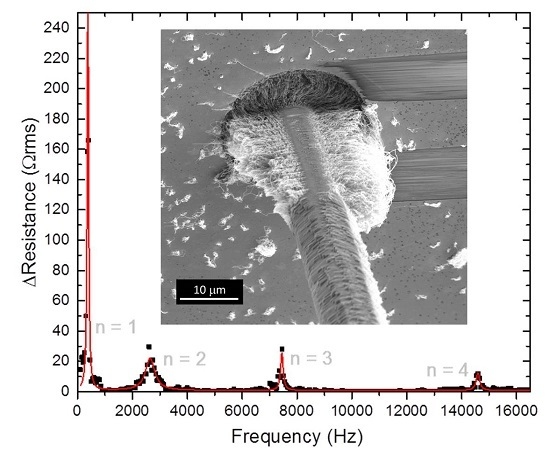
To assess the minimum detectable threshold of sensors such as these, the amplitude of the response is shown in Figure 3a for Sensor 3 (LE = 4.37 mm) versus the measured sound pressure amplitudes (p0). The peak air velocity (upeak) calculated from the sound pressure
u p e a k = p u s ρ a i r
is also indicated, where p is the pressure amplitude, us is the speed of sound, and ρair is density of air [18]. The three frequencies shown below are the first resonance frequency. The RMS noise level of the setup was seen to be about 2.9 Ω·rms with no detectable change in resistance above this value for low air velocities. The resistance change increased linearly above a threshold of 70 mm·s−1 air velocity, which is considered the dynamic detectable threshold for this sensor and measurement setup.
At a much shorter external length (0.62 mm), the sensitivity was decreased but the first resonance bandwidth was greatly increased. The frequency of the sinusoidal plane wave was swept from 100 Hz to 16 kHz at constant sound pressure amplitude of 300 Pa. The RMS change in the resistance of the sensor was seen to be approximately constant with the increasing frequency until the frequency approached the first resonance of the sensor at 13.9 kHz and the response of the sensor reached a peak (Figure 3b). A small peak was also seen around half this frequency due to the increased contribution of the higher modes of the input in the plane wave tube at integer multiples of the applied frequency. The response of 6 to 9 Ω·rms below resonance is above the noise limit, making this a viable sensor for ultra-large-bandwidth applications even though the cross-section is greatly reduced.

3. Discussion

It can be seen from Equation (1) or Equation (3) that the resonance frequency will vary inversely with the square root of the mass per length of the beam (ρA). For the S2 glass microfiber used in these experiments, ρA is 1.6 × 10⁻⁷ kg/m as calculated from the reported density. It is expected to be increased by the additional mass of the nanotubes. To determine the upper bound on ρA, the typical density of the CNT array (ρCNT = 0.5 g·cm−3) was estimated from mass and volume change measurements of CNT growth by the same method on large planar substrates. This density is somewhat larger than many reported values for CNT arrays since iron is continually fed to the system during synthesis, resulting in nanoparticles of iron within the volume of the CNT array [19]. The areal density is assumed to be preserved for the glass fiber such that the additional mass per length on a cylindrical fiber is given by 2π·rfiber·LCNT·ρCNT. The average length of the CNTs (LCNT) was measured to be 12 μm, so the predicted maximum ρA is 2.7 × 10⁻⁷ kg/m.
The resonance frequencies predicted by the partial elastic base model in Equation (3) are compared to the measured resonance frequencies in Figure 2b. The predicted resonance frequencies are within the bounded range of CNT densities expected, from negligible compared to the density of the glass fiber up to the maximum value estimated above. The measured resonance frequencies are found to fall within this band. The solid red line represents the best fit of the elastic base model to the measured resonance frequencies across all the modes and hair lengths. The mass per length is the only fit parameter and the best fit corresponds to a value of 1.9 × 10⁻⁷ kg/m.
The first resonance bandwidth at any given length, e.g., 5.2 kHz at LE = 1 mm, is large compared to other hair sensors. This is most obviously due to the large bending stiffness of the hair coupled with the low mass per density (e.g., the ratio of EI to ρA). Similarly, for hair sensors that rotate at the base, the resonance frequency is proportional to the square root of the ratio of the torsional stiffness of the hinge at the base of the hair to the mass per length of the hair [3,20]. The hair will move in rotation rather than bending as long as this torsional stiffness is small relative to the bending stiffness of the hair. In both the torsional and bending cases, the bandwidth can be increased by choosing hair materials with large specific stiffness.
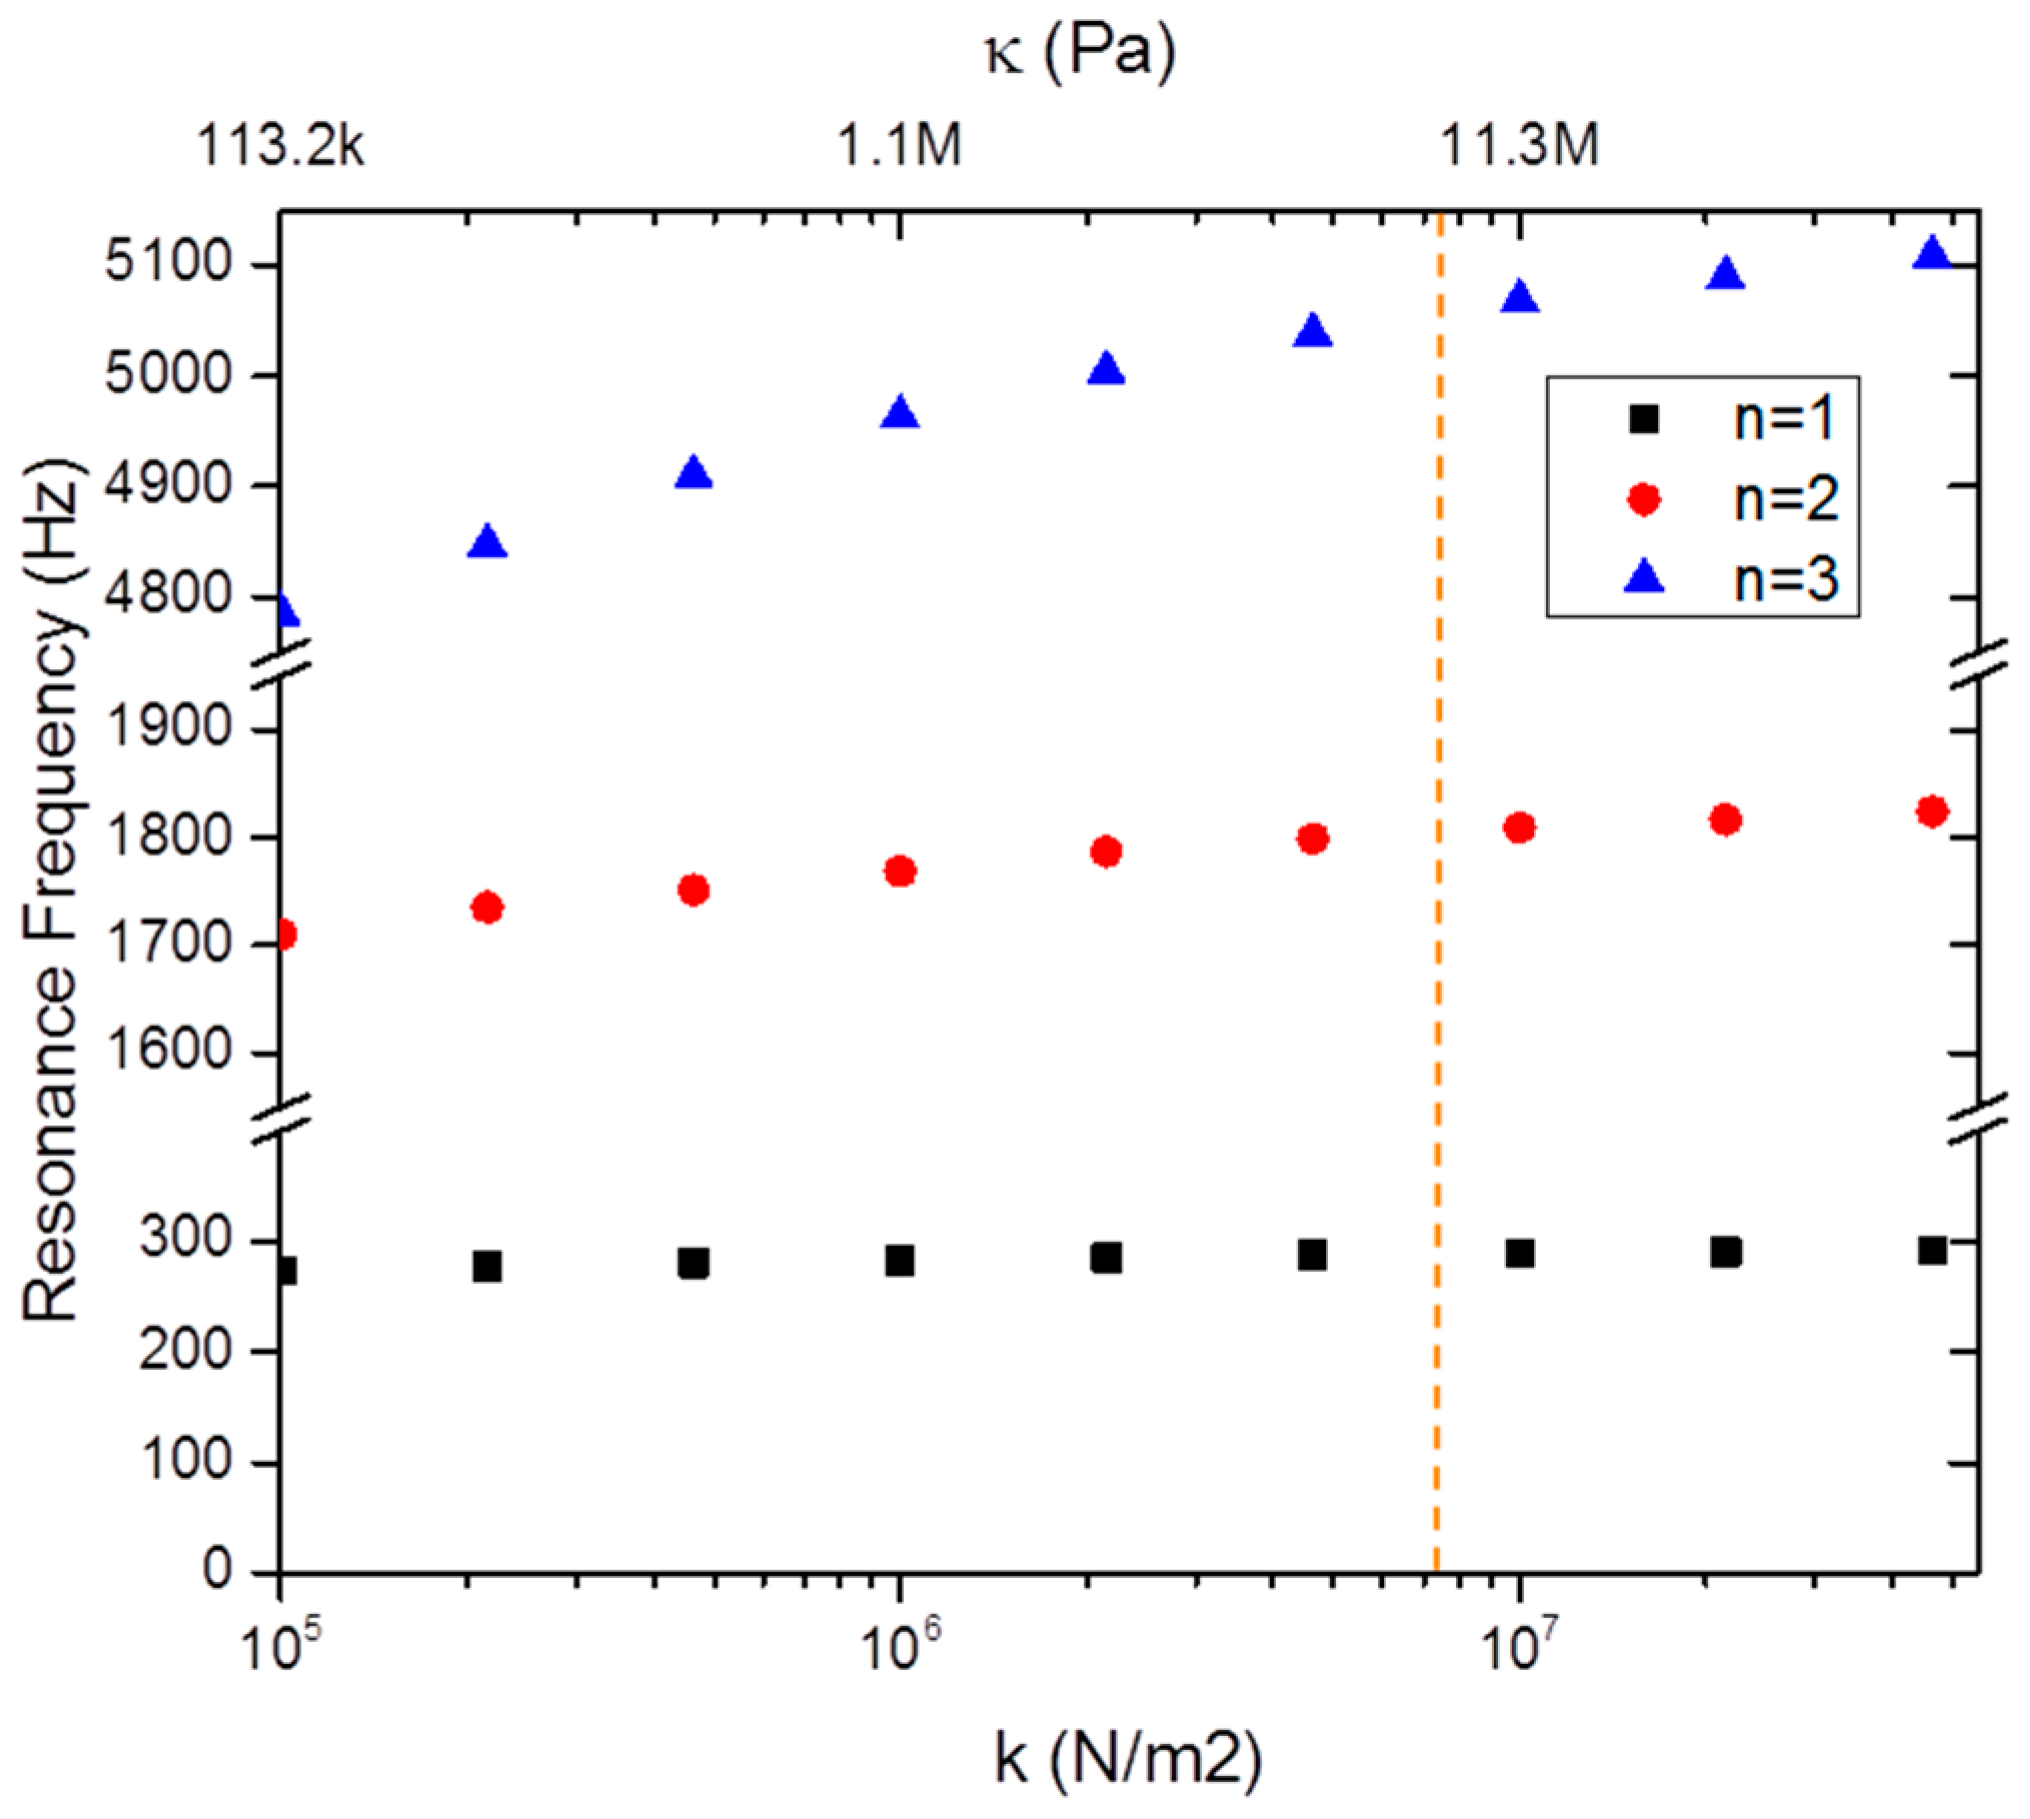
Using the elastic base model, the predicted role of the nanotube stiffness in the resonance frequencies of the sensors is shown in Figure 4 assuming the other properties of the sensor are identical to Sensor 3 and with LE = 4.37 mm. Reported values for the measured stiffness of nanotube arrays vary by as much as three orders of magnitude, most likely due to differences in synthesis conditions and substrate characteristics [21,22,23]. As the stiffness is changed in this system, there is little predicted change to the useful frequency bandwidth before first resonance even though the higher-order modes show an obvious decrease in frequency with decreasing nanotube stiffness.
Whereas the bandwidth shows little dependence on k, the sensitivity and possibly the detectable threshold should be enhanced by decreasing the nanotube array stiffness. Indeed, a quasi-static analysis by Slinker et al. indicates the sensitivity decreases as k1/2 [4]. Conversely, the quasi-static deflection range over which a change in resistance is significant (i.e., span of the middle section of the sigmoidal response) and the percent resistance change per deflection (the slope of the middle of the sigmoidal response) have opposite dependence on the length and fiber bending stiffness, with the former going as L−2 and (EI)1/2, while the latter goes as L and (EI)−1/2. Control of the stiffness of the support material and alternative means for signal generation (piezoelectric, etc.) may provide opportunities in the future to optimize the sensitivity of these devices without impacting the observed large bandwidth.

4. Materials and Methods

4.1. Sensor Fabrication

The hairs are glass microfibers (AGY 933 S-2) with a radius of 4.5 µm, a reported density of 2580 kg/m3, and a reported bending stiffness of 28 Nμm2. The microfibers are uniformly coated with a layer of alumina approximately 10-nm-thick by atomic layer deposition. The pore for the hair is a glass microcapillary with inner radius of 12.5 μm which is cut and polished to a final length of 1.2 mm. Gold electrodes are deposited on each end by sputtering at an angle such that the gold coats the inside walls of the capillaries to a depth approximately equal to twice the diameter. The glass microfibers are cut to initial length and inserted into the microcapillaries.
The entire assemblies are subjected to CNT synthesis in a tube furnace at 750 °C by continuous ferrocene/xylene liquid injection in an argon/hydrogen atmosphere. The CNTs grow preferentially on the alumina-coated glass fiber and radially from the fiber surface as a low density array of wavy, vertically aligned, entangled CNTs. As it grows, the CNT array self-positions the glass fiber near the radial center of the capillary. After CNT synthesis, the hair is fixed to the bottom capillary face with epoxy to prevent axial movement. The completed sensor is then inserted into an electrode polycarbonate disc for flush mounting within the plane-wave tube. Figure 5 shows an example sensor imaged near the opening of the capillary, with some of the nanotubes removed from the glass fiber by focused ion beam. Additional information can be found elsewhere [1,4].

4.2. Hybrid Plane-Wave Tube Measurements

A 1-m-long, 5-mm-square inner diameter aluminum alloy plane-wave tube connected on both ends to 8 m of copper pipe was used to expose the hairs to air flows at acoustic frequencies. A speaker driver (JBL 2446J, 16 ohms) was coupled into one end of the tube. The speaker is driven by a QSC GX3 power amplifier receiving a sinusoidal input signal from Stanford Research Systems SR 830 DSP Lock-In Amplifier. The signal measured by a Brüel & Kjær 4138 microphone mounted at the top of the tube at its lengthwise and widthwise center was fed to a 2670 preamplifier and recorded by the SR 830. A PID controller was used to adjust the output of the SR 830 to maintain a constant signal on the microphone. The sensors were mounted at the bottom of the tube directly below the microphone. The signals from the microphone and hair sensor were recorded by National Instruments Signal Acquisition Modules NI PXI-4472 (for the microphone) and NI PXI-6224 (for the AHS). The complete setup is shown in Figure 6.

Acknowledgments

The authors gratefully acknowledge the Air Force Office of Scientific Research (AFOSR), Byung-Lip (Les) Lee, Program Manager, for financial support of this research, Gregory Reich for discussions and collaborations regarding sensor performance for applications, Benjamin Severin and Peter Schumann for help setting up and running the equipment, and Matthew Maschmann for assistance with the experiments and the focused ion beam processing and imaging.

Author Contributions

Keith Slinker, Benjamin T. Dickinson and Jeffery W. Baur conceived and designed the experiments; Keith Slinker and Corey Kondash performed the experiments; Keith Slinker analyzed the data; Keith Slinker and Jeffery W. Baur wrote the paper.

Conflicts of Interest

The authors declare no conflict of interest.

References

  1. Maschmann, M.R.; Ehlert, G.J.; Dickinson, B.T.; Phillips, D.M.; Ray, C.W.; Reich, G.W.; Baur, J.W. Bioinspired carbon nanotube fuzzy fiber hair sensor for air-flow detection. Adv. Mater. 2014, 26, 3230–3234. [Google Scholar] [CrossRef] [PubMed]
  2. Chen, J.; Fan, Z.; Zou, J.; Engel, J.; Liu, C. Two-dimensional micromachined flow sensor array for fluid mechanics studies. J. Aerosp. Eng. 2003, 16, 85–97. [Google Scholar] [CrossRef]
  3. Krijnen, G.; Floris, A.; Dijkstra, M.; Lammerink, T.; Wiegerink, R. Biomimetic Micromechanical Adaptive Flow-Sensor Arrays. In Proceedings of the SPIE Bioengineered and Bioinspired Systems III, Maspalomas, Gran Canaria, Spain, 2–4 May 2007.
  4. Slinker, K.A.; Kondash, C.; Dickinson, B.T.; Baur, J.W. Cnt-based artificial hair sensors for predictable boundary layer air flow sensing. Adv. Mater. Technol. 2016. [Google Scholar] [CrossRef]
  5. Casas, J.; Dangles, O. Physical ecology of fluid flow sensing in arthropods. Annu. Rev. Entomol. 2010, 55, 505–520. [Google Scholar] [CrossRef] [PubMed]
  6. Junliang, T.; Xiong, Y. Hair flow sensors: From bio-inspiration to bio-mimicking—A review. Smart Mater. Struct. 2012, 21, 11. [Google Scholar]
  7. Magal, C.; Dangles, O.; Caparroy, P.; Casas, J. Hair canopy of cricket sensory system tuned to predator signals. J. Theor. Biol. 2006, 241, 459–466. [Google Scholar] [CrossRef] [PubMed]
  8. Droogendijk, H.; Dagamseh, A.M.K.; Sanders, R.G.P.; Yntema, D.R.; Krijnen, G.J.M. Characterization of bio-inspired hair flow sensors for oscillatory airflows: Techniques to measure the response for both flow and pressure. Meas. Sci. Technol. 2014, 25, 095005. [Google Scholar] [CrossRef]
  9. Chen, N.; Tucker, C.; Engel, J.M.; Yingchen, Y.; Saunvit, P.; Chang, L. Design and characterization of artificial haircell sensor for flow sensing with ultrahigh velocity and angular sensitivity. J. Microelectromech. Syst. 2007, 16, 999–1014. [Google Scholar] [CrossRef]
  10. Nima, T.; Stephen, A.S. Toward cell-inspired materials that feel: Measurements and modeling of mechanotransduction in droplet-based, multi-membrane arrays. Bioinspir. Biomim. 2016, 11, 036008. [Google Scholar]
  11. Sarlo, R.; Najem, J.S.; Leo, D.J. Flow field sensing with bio-inspired artificial hair cell arrays. Sens. Actuators B Chem. 2016, 236, 805–814. [Google Scholar] [CrossRef]
  12. Yilmazoglu, O.; Yadav, S.; Cicek, D.; Schneider, J.J. A nano-microstructured artificial-hair-cell-type sensor based on topologically graded 3d carbon nanotube bundles. Nanotechnology 2016, 27, 365502. [Google Scholar] [CrossRef] [PubMed]
  13. Magar, K.T.; Reich, G.W.; Kondash, C.; Slinker, K.; Pankonien, A.M.; Baur, J.W.; Smyers, B. Aerodynamic parameters from distributed heterogeneous cnt hair sensors with a feedforward neural network. Bioinspir. Biomim. 2016, 11, 066006. [Google Scholar] [CrossRef] [PubMed]
  14. Rao, S.S. Vibration of Continuous Systems; Wiley: Hoboken, NJ, USA, 2007. [Google Scholar]
  15. Slinker, K.; Kondash, C.; Maschmann, M.; Severin, B.; Reich, G.; Dickinson, B.T.; Baur, J. Artificial hair sensors from structural microfibers and cnt arrays for sensing air flow or mechanical shear. In Proceedings of the 20th International Conference on Composite Materials, Copenhagen, Danmark, 19–24 July 2015.
  16. Phillips, D.M.; Slinker, K.A.; Ray, C.W.; Hagen, B.J.; Baur, J.W.; Dickinson, B.T.; Reich, G.W. Artificial hair sensors: Electro-mechanical characterization. In Proceedings of the ASME 2014 Conference on Smart Materials, Adaptive Structures and Intelligent Systems, Newport, RI, USA, 8–10 September 2014; p. V002T006A016.
  17. Eisenberger, M.; Yankelevsky, D.Z.; Adin, M.A. Vibrations of beams fully or partially supported on elastic foundations. Earthq. Eng. Struct. Dyn. 1985, 13, 651–660. [Google Scholar] [CrossRef]
  18. Chandrasekaran, V.; Cain, A.; Nishida, T.; Cattafesta, L.N.; Sheplak, M. Dynamic calibration technique for thermal shear-stress sensors with mean flow. Exp. Fluids 2005, 39, 56–65. [Google Scholar] [CrossRef]
  19. Futaba, D.N.; Hata, K.; Namai, T.; Yamada, T.; Mizuno, K.; Hayamizu, Y.; Yumura, M.; Iijima, S. 84% catalyst activity of water-assisted growth of single walled carbon nanotube forest characterization by a statistical and macroscopic approach. J. Phys. Chem. B 2006, 110, 8035–8038. [Google Scholar] [CrossRef] [PubMed]
  20. Shimozawa, T.; Kumagai, T.; Baba, Y. Structural scaling and functional design of the cercal wind-receptor hairs of cricket. J. Comp. Physiol. A 1998, 183, 171–186. [Google Scholar] [CrossRef]
  21. Maschmann, M.R.; Dickinson, B.; Ehlert, G.J.; Baur, J.W. Force sensitive carbon nanotube arrays for biologically inspired airflow sensing. Smart Mater. Struct. 2012, 21, 094024. [Google Scholar] [CrossRef]
  22. Gao, Y.; Kodama, T.; Won, Y.; Dogbe, S.; Pan, L.; Goodson, K.E. Impact of nanotube density and alignment on the elastic modulus near the top and base surfaces of aligned multi-walled carbon nanotube films. Carbon 2012, 50, 3789–3798. [Google Scholar] [CrossRef]
  23. Maschmann, M.R.; Zhang, Q.; Du, F.; Dai, L.; Baur, J. Length dependent foam-like mechanical response of axially indented vertically oriented carbon nanotube arrays. Carbon 2011, 49, 386–397. [Google Scholar] [CrossRef]
Figure 1. The response of Sensor 1 with LE = 4.00 mm to dynamically modulated air flow: (a) The change in resistance at 100 Hz and 350 Hz over five periods and the corresponding Fourier transformed frequency response scaled by the input frequency (f0). (b) The amplitude of the Fourier transformed response at the input frequency versus the input frequency. The peaks correspond to the first four resonance modes (n) of the hair sensor. (Inset) The square root of the resonance frequencies (fn) versus the amplitude factors of the fixed-free Euler-Bernoulli beam with a linear fit.
Carbon 03 00006 g001
Figure 2. (a) The amplitude of the Fourier transformed response of Sensor 2 at the input frequency versus the input frequency for 11 hair lengths. Data sets all have minimums of near-zero RMS kW, but are offset in resistance for clarity. LE is indicated for each to the nearest 0.1 mm. The resonance peaks are labeled with their mode number and progressively shift to higher frequencies as the length is decreased. (inset) The high-frequency portion of the response at an LE of 4.7 mm. (b) The resonance frequencies fn versus the exposed length of the hair. The solid red lines correspond to a ρA of 1.9 × 10⁻⁷ kg/m and the gray band shows the predicted frequencies for a range of CNT masses.
Carbon 03 00006 g002
Figure 3. (a) The RMS change in resistance of Sensor 3 (LE = 4.37 mm) as function of sound pressure amplitude from or air velocity with instrument noise floor of 2.9 Ω·rms. The response increases linearly for air velocities above 70 mm·s−1. (b) After reducing the LE of Sensor 3 to 0.62 mm, the first resonance f1 is increased to 13.9 kHz and the response is relatively flat (3 Ω·rms minimum) before that resonance. There is an additional peak at half the resonance frequency, but this is believed to be due to the increased presence of higher modes within the plane wave tube.
Carbon 03 00006 g003
Figure 4. The resonance frequencies predicted for the sensors for various nanotube stiffness values (κ) or values of the stiffness-per-length constant in the elastic base model (k). The other properties of the modeled sensors are identical to Sensor 3 with LE = 4.37 mm. The dashed line represents the measured nanotube stiffness of Sensor 3.
Carbon 03 00006 g004
Figure 5. SEM image of a CNT and glass microfiber artificial hair sensor in a metal-coated glass microcapillary pore. CNTs more than about 100 μm from the capillary opening were completely removed radially by focused ion beam from the glass fiber for this image, while only the top and bottom CNTs were removed closer to the opening. The radial nanotube array is visible inside the capillary opening. Under normal operation it extends the length of the glass fiber inside and outside the capillary.
Carbon 03 00006 g005
Figure 6. Hybrid plane wave tube for steady and dynamic air flow tests.
Carbon 03 00006 g006

