2.1. Characterization of Pure and Hybrid Catalysts
The structural properties of all investigated catalysts are analyzed by scanning electron microscopy (SEM), X-ray diffraction (XR), thermogravimetric differential thermal analysis (TG/DTA) and Brunauer-Emmett-Teller (BET) method to evaluate the differences between pure γ–MnO2, Mn3O4, carbon materials and hybrid catalysts.
γ-MnO
2 is synthesized via co-precipitation of MnSO
4·H
2O and (NH
4)
2S
2O
8 according to a procedure presented by Xi
et al. [
18] and Li
et al. [
19].
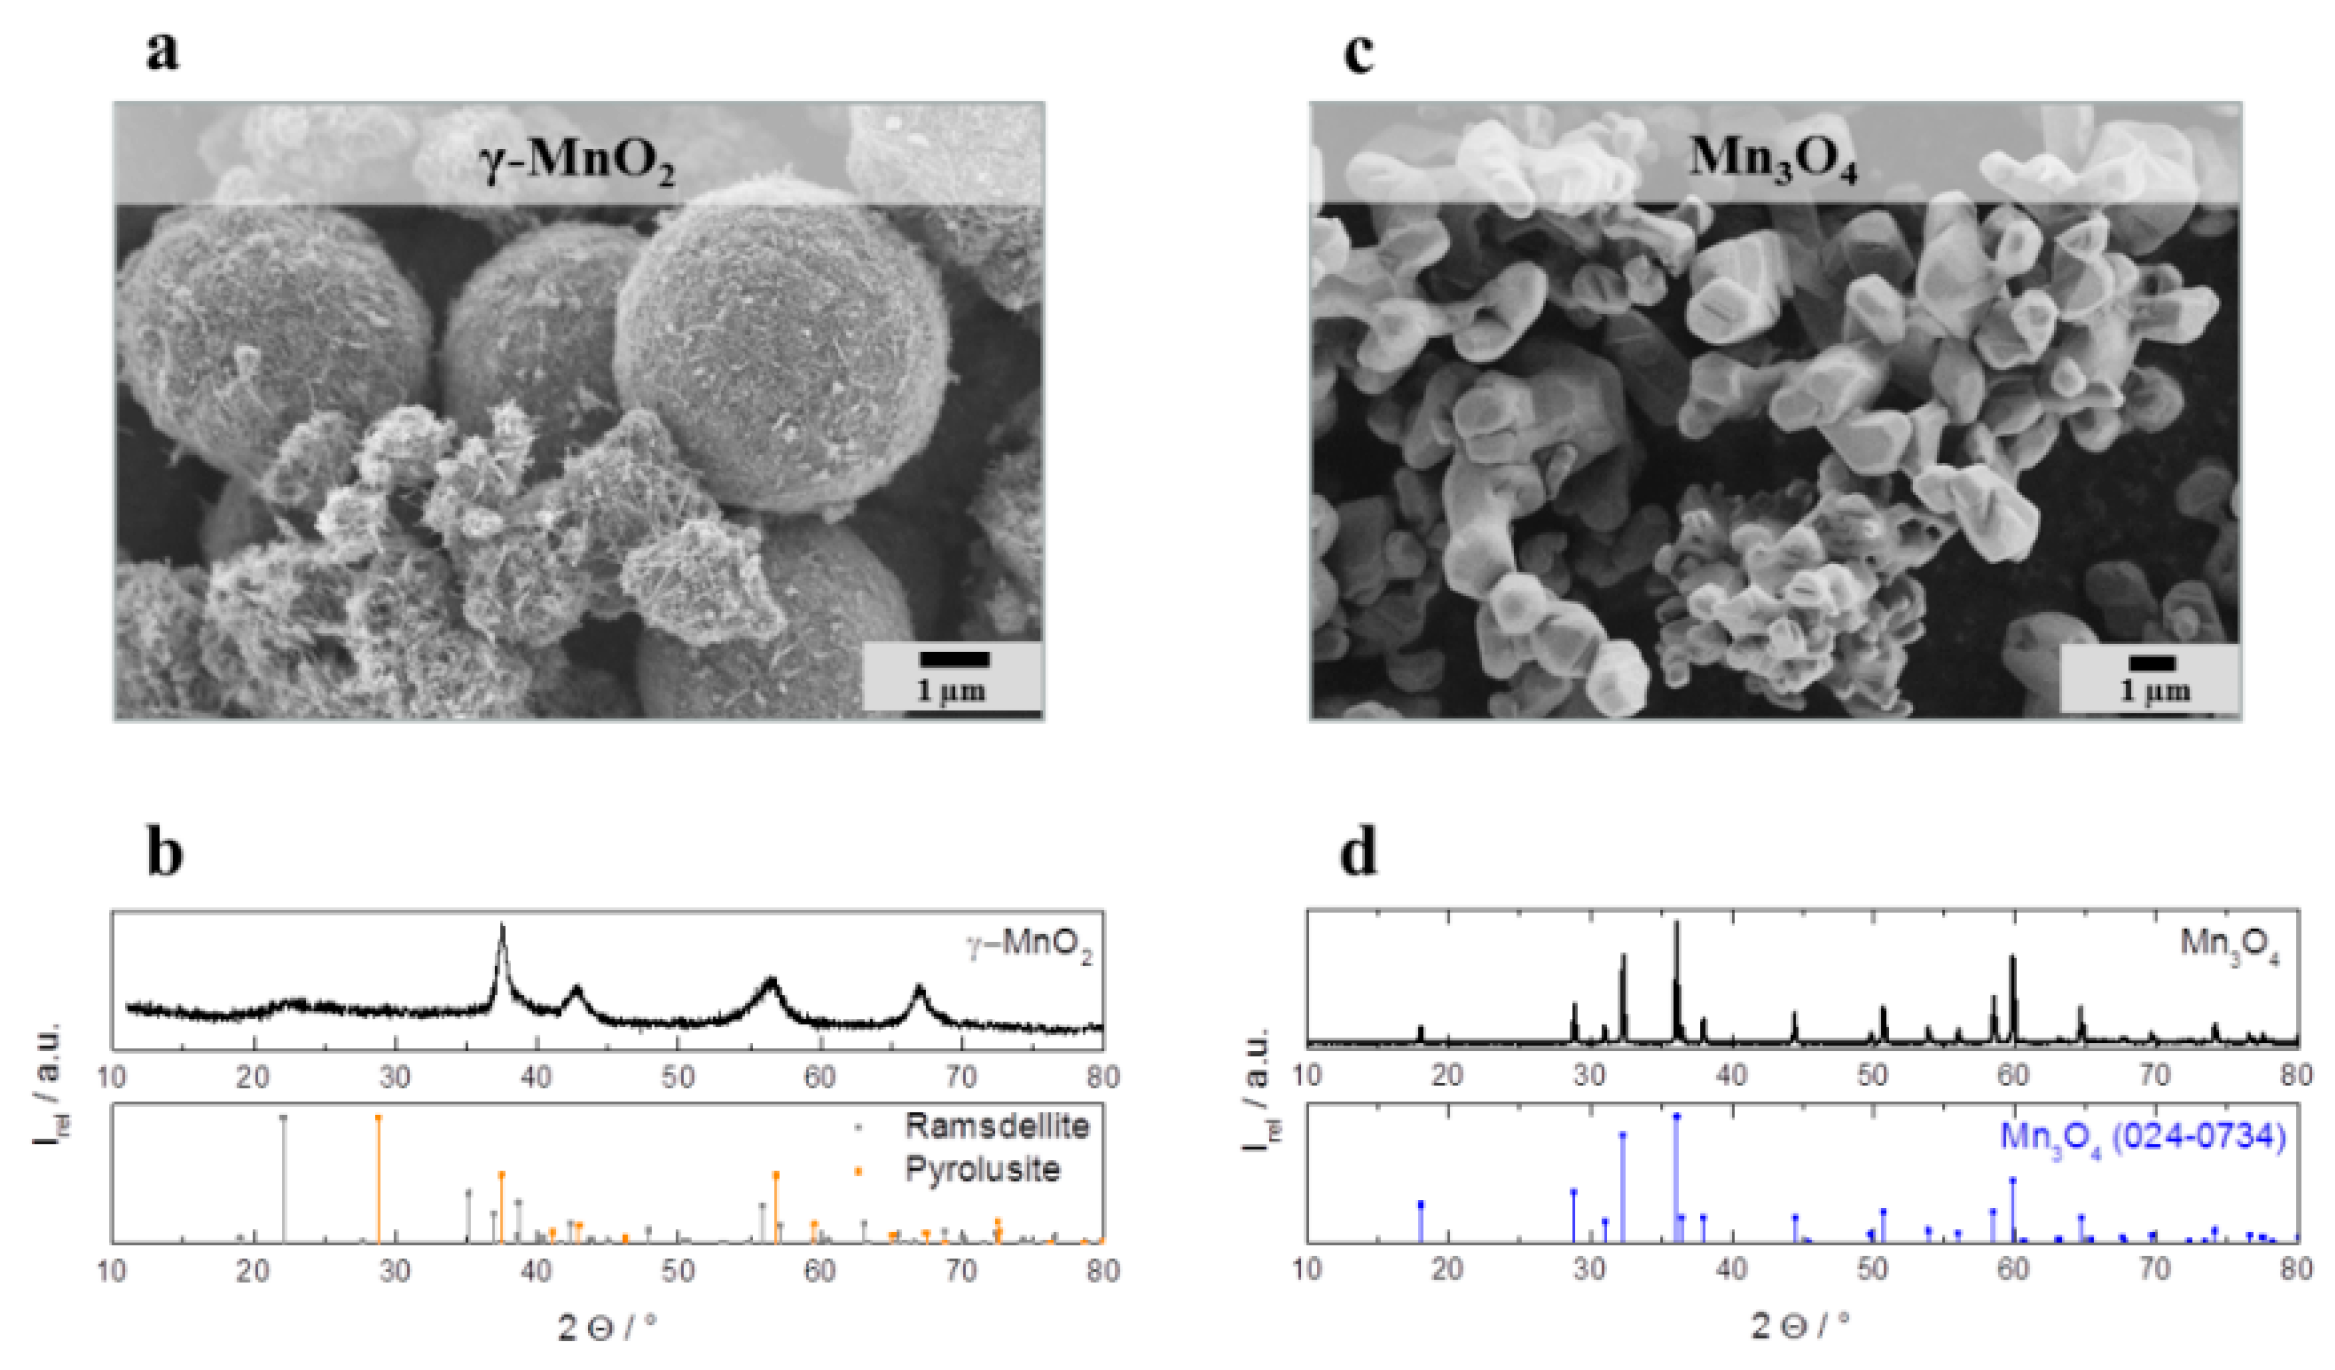
Figure 3a depicts a representative SEM image of spherical catalyst particles of about 4 µm diameter formed by needle-shaped nanochrystals. The associated XRD pattern (
Figure 3b) indicates the crystal structure of γ–MnO
2 which is a crystallographic deformation of α–MnO
2 (ramsdellite) and β–MnO
2 (pyrolusite). According to Gyenge and Drillet [
20] the peaks at 2θ: 37.5° (101), 43.0° (111), 57.0° (211), and 67.5° (310) can be identified as pyrolusite (JCPDS: 98-002-0229) and the small peak at 2θ = 22.0 (011) matches with ramsdellite (JCPDS: 98-002-0228). The broad peaks are attributed to nanoscale γ–MnO
2 crystallites. The second investigated pure catalyst is a commercial Mn
3O
4 (Sigma Aldrich, purity: 97%). The SEM image in
Figure 3c depicts agglomerated Mn
3O
4 particles with a diameter of approximately 1 µm for the primary particles. The corresponding XRD pattern (
Figure 3d) displays the expected Mn
3O
4 spinel crystal structure with the following characteristic reflections at 18.0° (101), 28.5° (110), 37.2° (101), 40.9° (200), 42.6° (111), 56.5° (211), 59.2° (220), 64.7° (002), 67.1° (310), 72.1° (301), 72.3° (112) (JCPDS: 024-0734). In addition to the crystal structure, γ-MnO
2 and Mn
3O
4 differ in their specific surface areas. Due to its urchin like structure, γ–MnO
2 exhibits a much higher specific surface area (S
BET = 104 m² g
−1) than the smooth Mn
3O
4 particles (S
BET = 1 m² g
−1).
To investigate the influence of carbon materials on the hybrid catalysts, three carbon materials with different properties such as specific surface area or carbon modification were selected (
Table 1). Super C 65 is a carbon black material which is used as a conductive agent in LIB electrodes [
21] and Vulcan XC 72 is as catalyst support in fuel cells [
22] which is employed due to its high electric conductivity. The intention in the application of Super C 65 and Vulcan XC 72 is to support the electric conductivity of the hybrid catalyst through a direct link between manganese oxide and carbon black. For a further study on the influence of an increased surface area, Kuraray YP 50F, is chosen. Kuraray YP 50F is an activated carbon material with a surface area of S
BET = 1485 m² g
−1 which is known for its application in electric double layer capacitors (ELDC) [
23].
Figure 3.
(a) Scanning electron microscope (SEM) image and (b) X-ray diffraction pattern of as prepared γ-MnO2 particles. (c) SEM image and (d) X-ray diffraction pattern of commercial Mn3O4 particles.
Figure 3.
(a) Scanning electron microscope (SEM) image and (b) X-ray diffraction pattern of as prepared γ-MnO2 particles. (c) SEM image and (d) X-ray diffraction pattern of commercial Mn3O4 particles.
Table 1.
Used carbon materials for hybrid catalysts.
Table 1.
Used carbon materials for hybrid catalysts.
| Carbon Material | Manufacturer | Specific Surface Area SBET (m² g−1) | Carbon Modification |
|---|
| Super C 65 | Imerys (CHE) | 63 | carbon black |
| Vulcan XC 72 | Cabot (USA) | 230 | carbon black |
| Kuraray YP 50F | Kuraray Chemical Co., LTD (JPN) | 1485 | activated carbon |
The middle row of the SEM images in
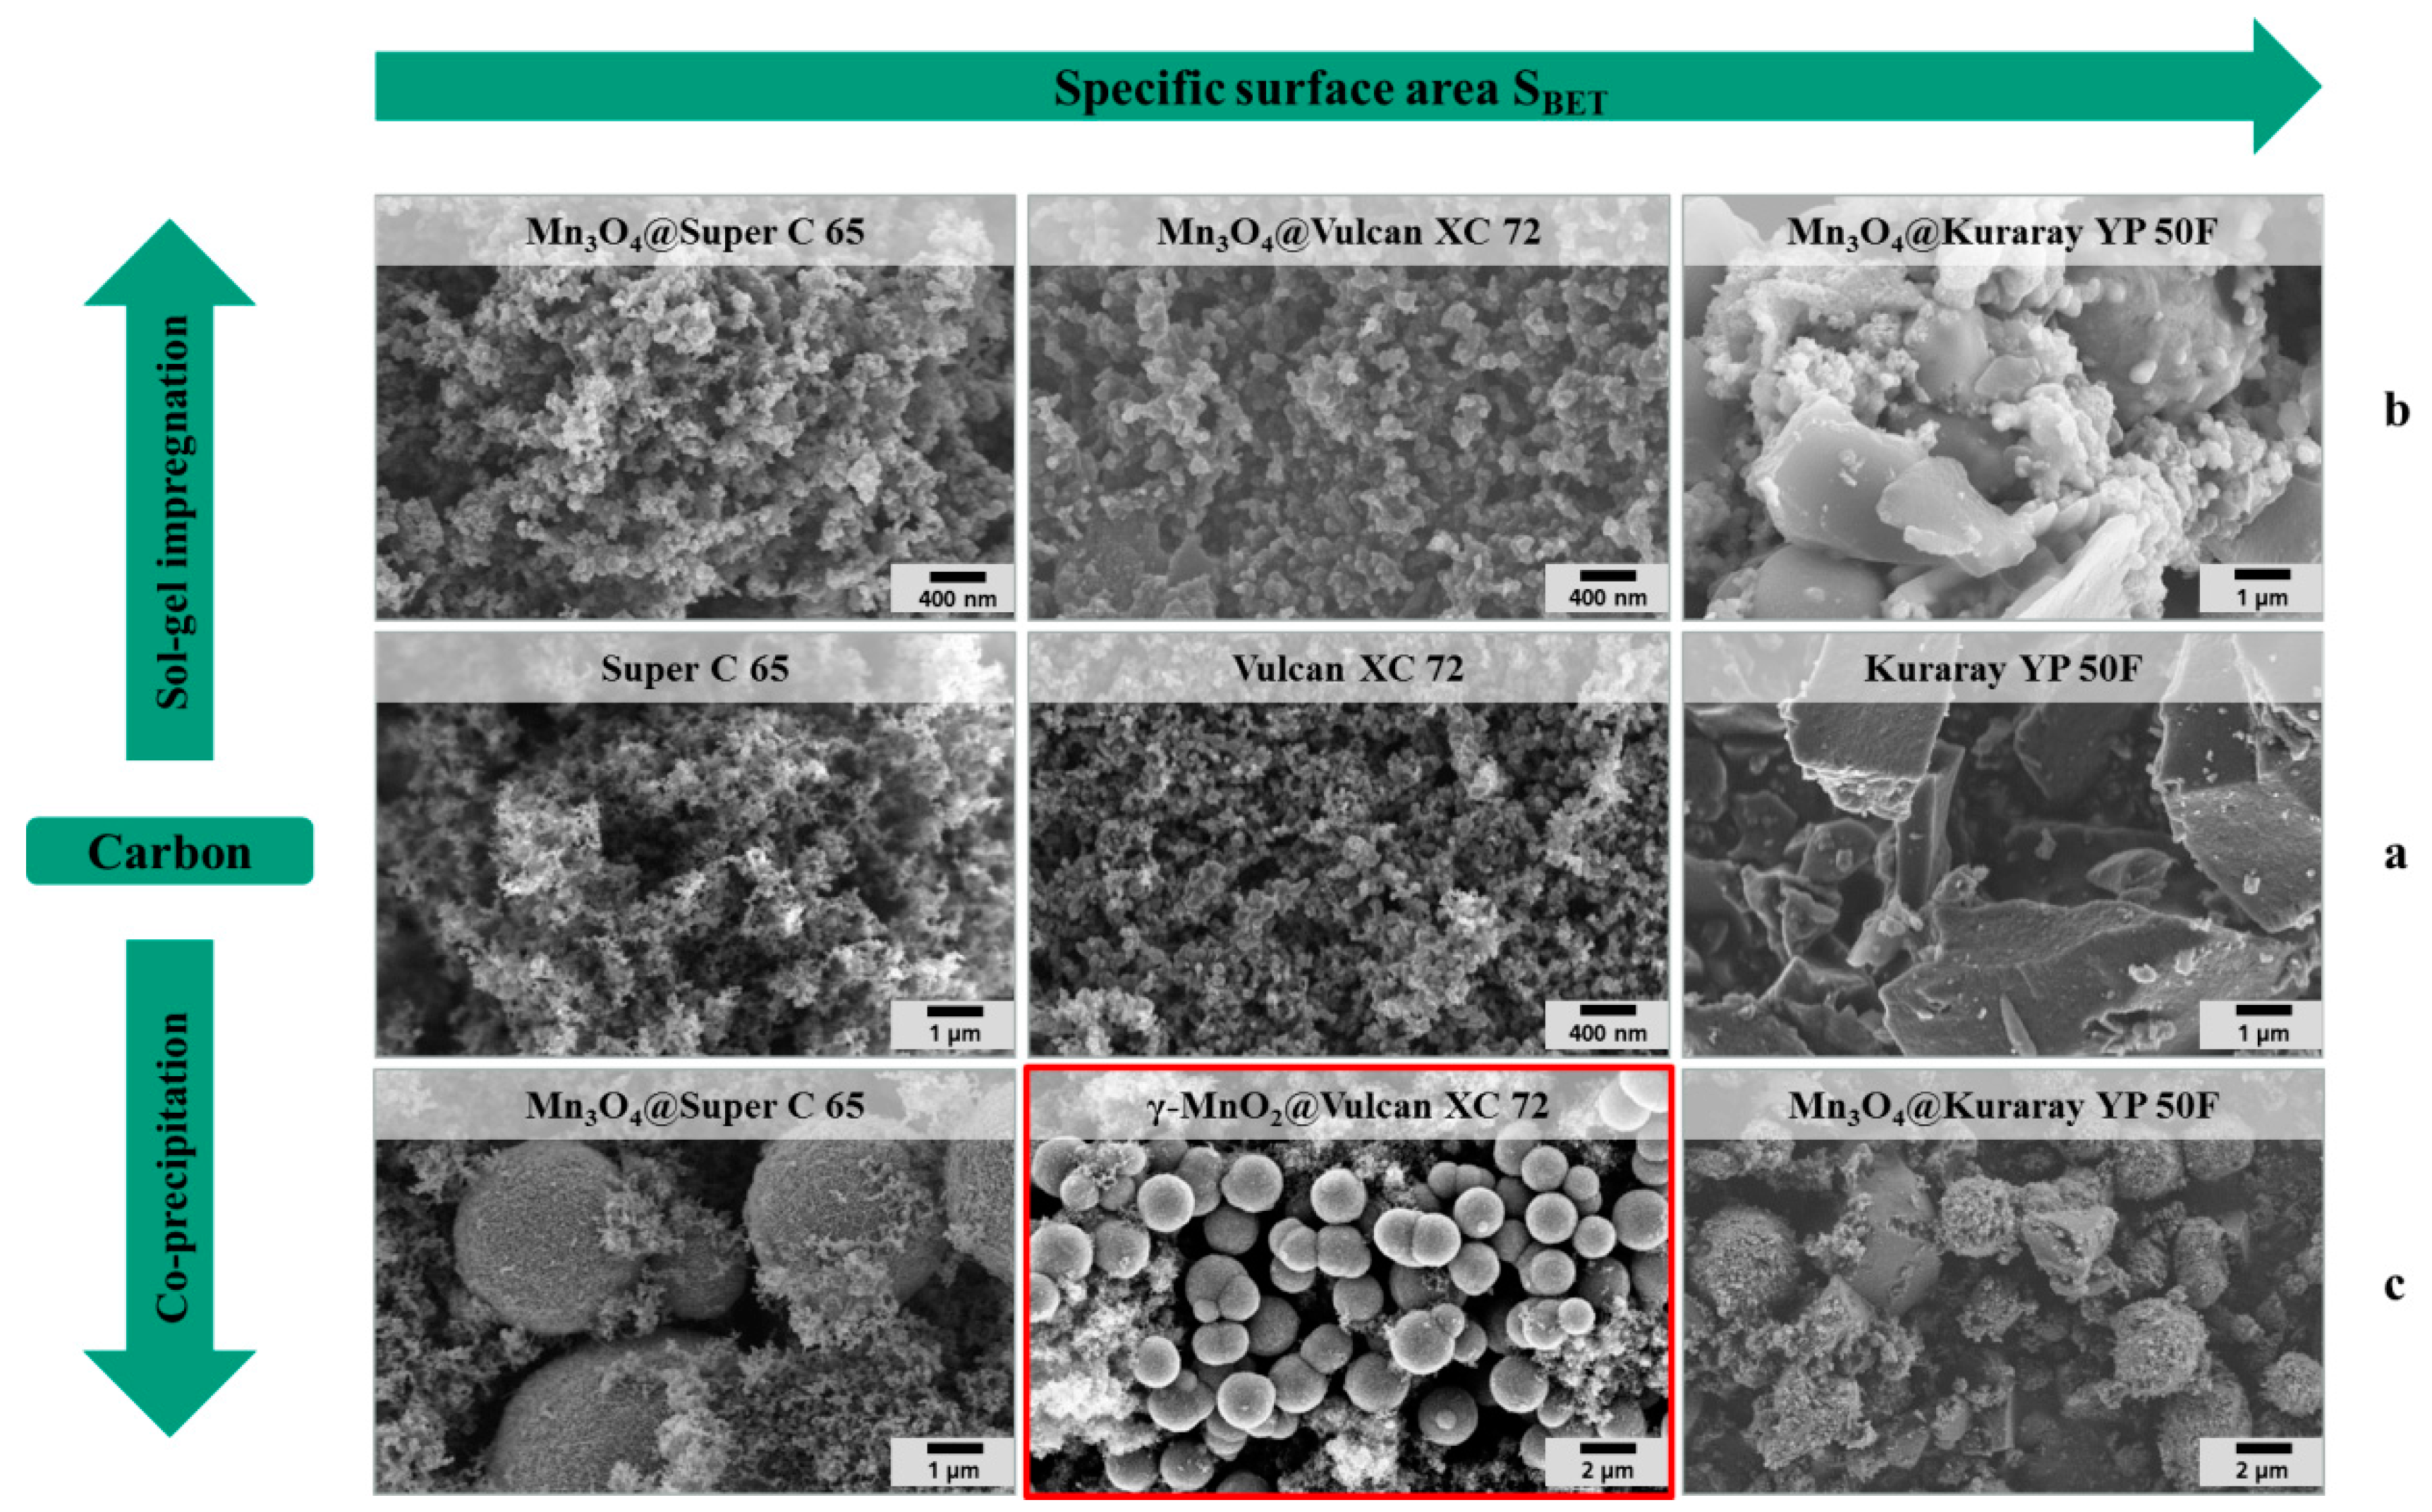
Figure 4a depicts the pure carbon materials before modification. The fine particulate morphology of both carbon black materials (Super C 65 and Vulcan XC 72) is clearly distinguishable from the coarse irregular shape of the activated carbon particles (Kuraray YP 50F).The first row of the SEM images in
Figure 4b pictures the carbon materials coated by sol-gel impregnation. In the SEM images, not much difference in the surface morphology between the pure carbon materials and the coated carbon materials is found. The X-ray diffraction patterns of the sol-gel hybrid catalysts (
Figure 5a) show the spinel structure of Mn
3O
4 after crystallization for 4 h at 300 °C.
Figure 4.
SEM images of (a) pure carbon materials, (b) hybrid catalysts synthesized via sol-gel impregnation and (c) hybrid catalysts synthesized via co-precipitation.
Figure 4.
SEM images of (a) pure carbon materials, (b) hybrid catalysts synthesized via sol-gel impregnation and (c) hybrid catalysts synthesized via co-precipitation.
Figure 5.
X-ray diffraction pattern of hybrid catalysts synthesized via (a) sol-gel impregnation and (b) co-precipitation.
Figure 5.
X-ray diffraction pattern of hybrid catalysts synthesized via (a) sol-gel impregnation and (b) co-precipitation.
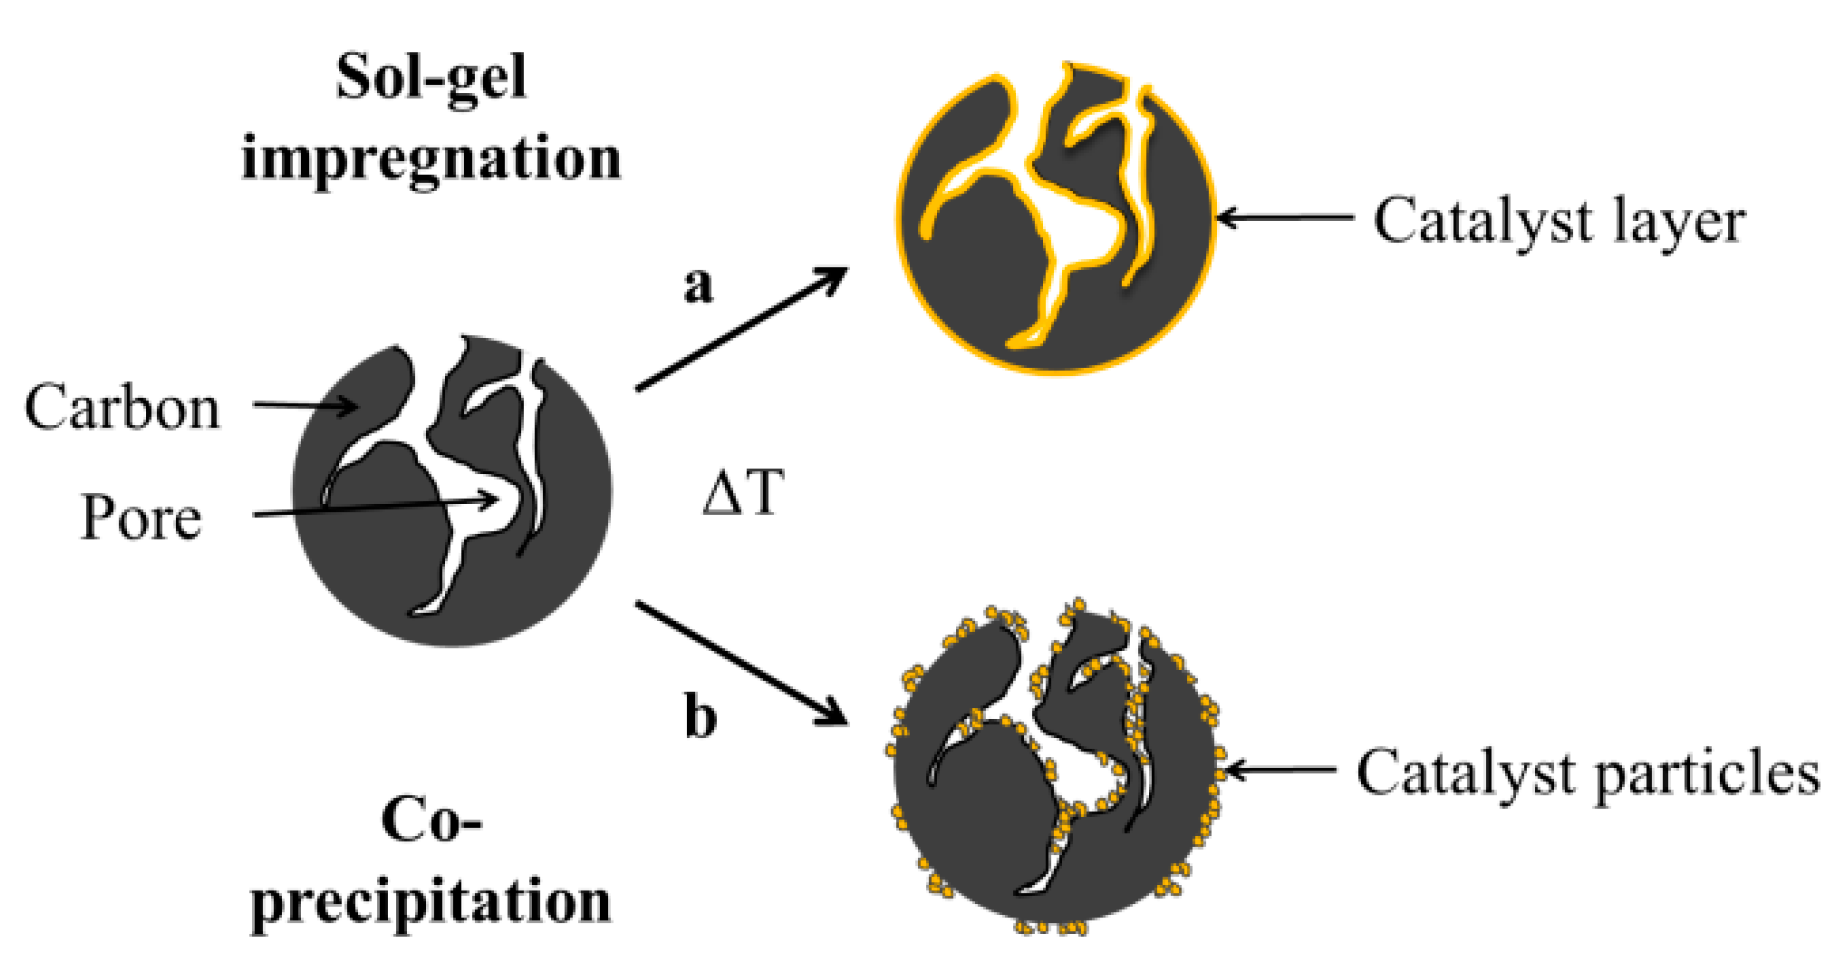
Figure 4c shows the SEM images of the hybrid catalysts which are synthesized via co-precipitation. As a result of this synthesis method, spherical manganese oxide particles with a diameter of a few microns are formed and embedded into the carbon matrix. The X-ray diffraction patterns of the hybrid manganese oxide catalyst in the presence of Super C 65 and Kuraray YP 50F (
Figure 5b) offer the crystal structure of Mn
3O
4. In the presence of Vulcan XC 72 a different X-ray diffraction pattern results with the product γ–MnO
2@Vulcan XC 72. The first peak (marked as 1) at 2θ = 24.5° can be correlated with pure Vulcan XC 72. According to the X-ray diffraction of γ–MnO
2 (
Figure 3b) the peaks (marked as 2) at 2θ: 37.5° (101), 43.0° (111), and 57.0° (211) can be identified as pyrolusite (JCPDS: 98-002-0229). The peak marked as 3 at 2θ = 31.8° (014) matches with MnCO
3 (JCPDS: 98-003-7242) and the peaks marked as 4 at 2θ: 65.0° (200) and 69.9° (190) matches with γ–MnO
2 (JCPDS: 98-015-0462).
In
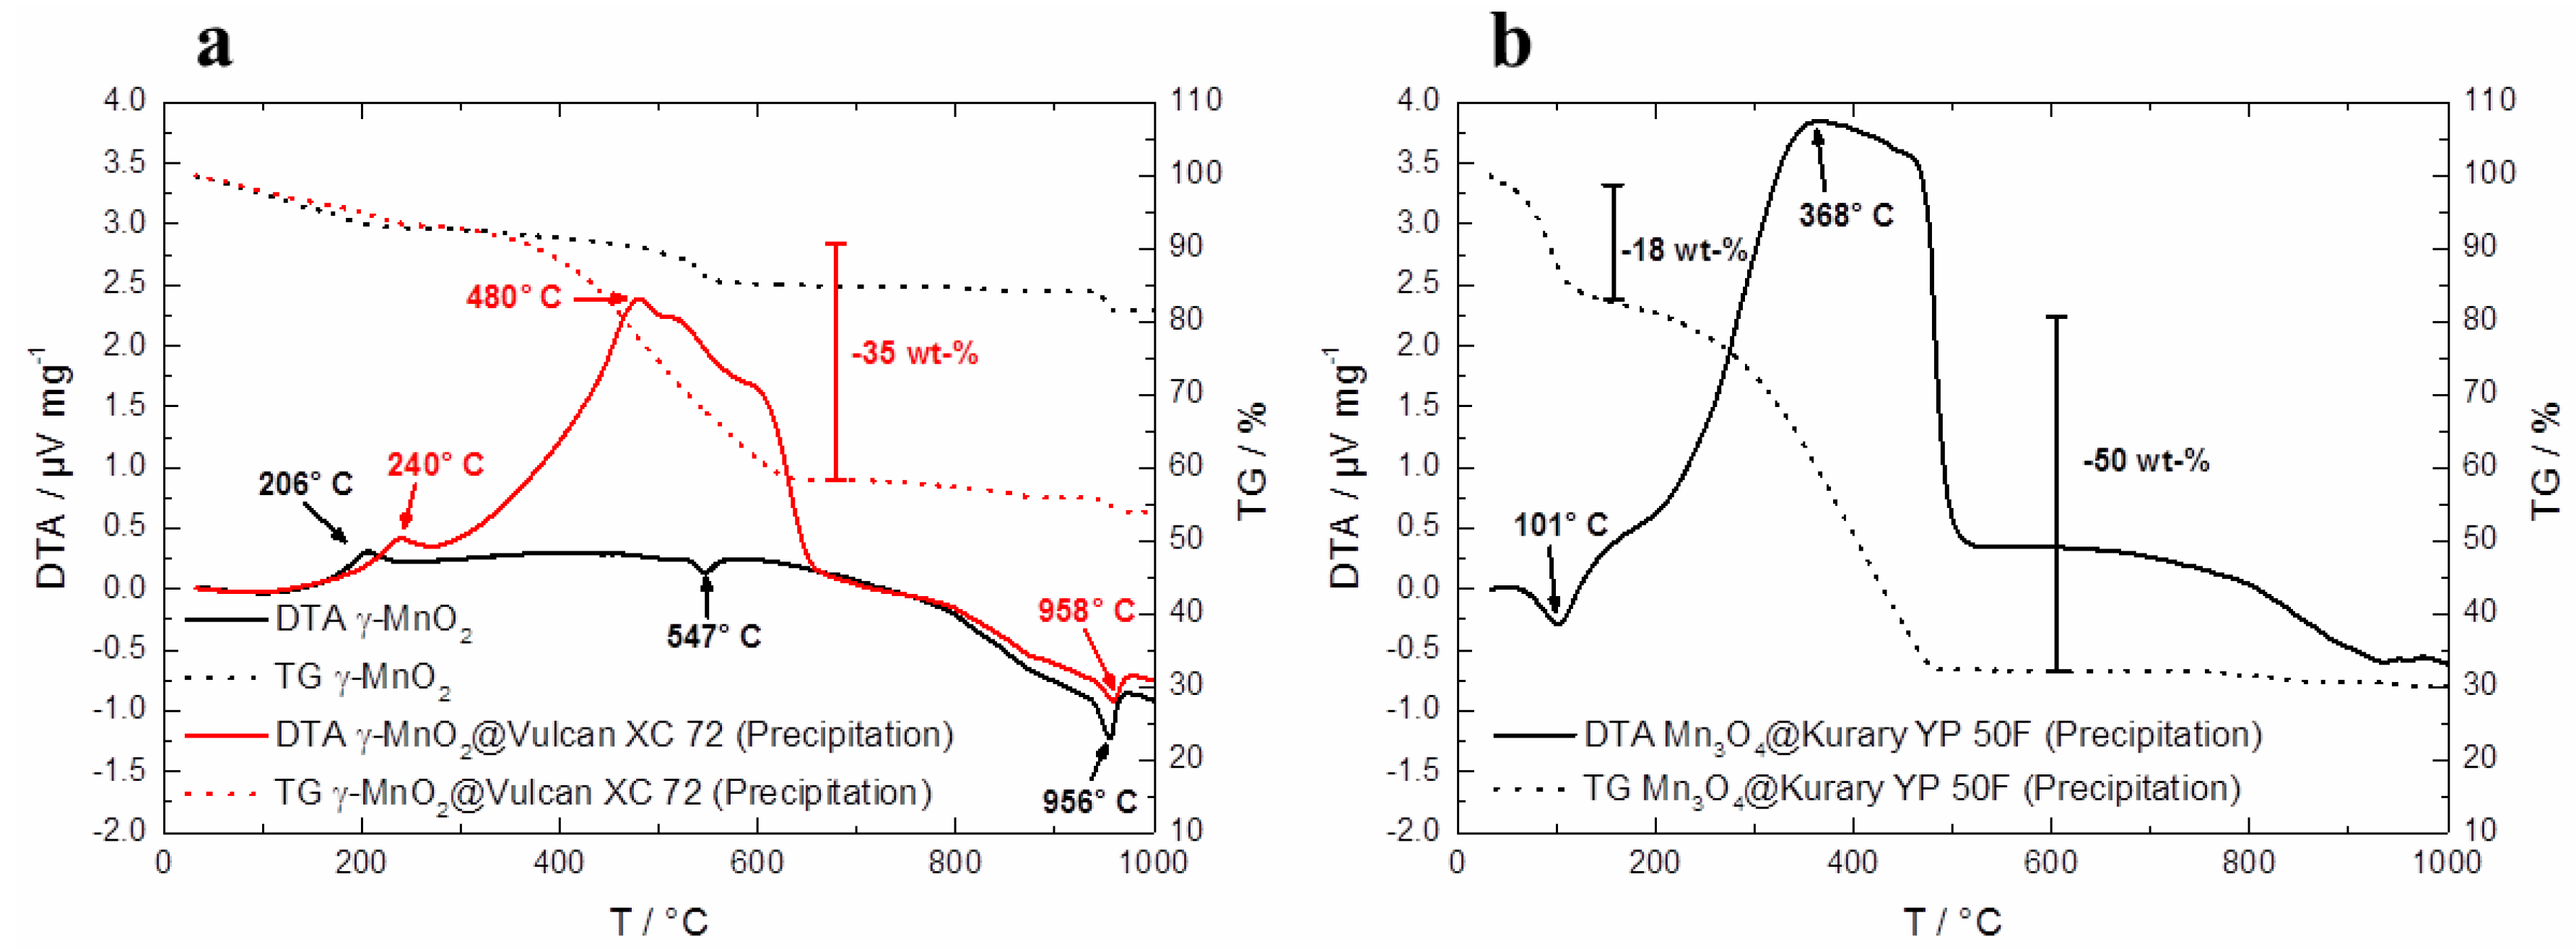
Figure 6a, TG/DTA measurements of pure γ–MnO
2 and γ–MnO
2@Vulcan XC 72 synthesized via co-precipitation are plotted. Therein, the first exothermic peak for γ–MnO
2 at 206 °C and at 240 °C for γ–MnO
2@Vulcan XC 72 is related to the formation of γ–MnO
2. Furthermore, the endothermic peaks for γ–MnO
2 at 547 °C and at about 950 °C result from the reduction of MnO
2 to Mn
2O
3 to Mn
3O
4 [
24]. The big mass loss of about 35 wt % between 400 and 600 °C in the TG curve of γ–MnO
2@Vulcan XC 72 is mainly related to the decomposition of Vulcan XC 72.
The TG/DTA curves of Mn
3O
4@Kuraray YP 50F (Precipitation) in
Figure 6b represent a different curve progression. At the first mass loss of about 18 wt % between RT and 100 °C mainly H
2O is detected. The second big mass loss (50 wt %) between 200 and 500 °C as well as the exothermic DTA peak at 368 °C is related to the decomposition of Kuraray YP 50F. The reason for this different TG/DTA behavior between the precipitated hybrid catalysts (based on Vulcan XC 72 and Kuraray YP 50F) can be seen in the pH value of the carbon materials. Kuraray YP 50F and Super C 65 exhibit an alkaline pH value of 9. However, Vulcan XC 72 shows a neutral pH value of about 7. The co-precipitation reaction of γ–MnO
2 without carbon material is proton catalyzed, which means that by addition of Vulcan XC 72 with a neutral pH value the same reaction takes place and the product γ–MnO
2 is formed. The addition of an alkaline material such as Kuraray YP 50F or Super C 65 results in the formation of Mn
3O
4 as reaction product. Dhaouadi
et al. [
25] reported the formation of Mn
3O
4 in alkaline media. In this reaction, first Mn(OH)
2 is formed, which decomposes into MnO and H
2O (mass loss in
Figure 6b between RT and 100 °C in the TG curve). During heat treatment MnO is oxidized to Mn
3O
4.
Figure 6.
Thermogravimetric differential thermal analysis (TG/DTA) measurements (before tempering at 300 °C) of (a) pure γ–MnO2 and γ–MnO2@Vulcan XC 72 synthesized via co-precipitation; (b) Mn3O4@Kuraray YP 50F synthesized via co-precipitation.
Figure 6.
Thermogravimetric differential thermal analysis (TG/DTA) measurements (before tempering at 300 °C) of (a) pure γ–MnO2 and γ–MnO2@Vulcan XC 72 synthesized via co-precipitation; (b) Mn3O4@Kuraray YP 50F synthesized via co-precipitation.
In
Table 2, the specific surface areas of all hybrid catalyst materials are depicted. By comparing these values it can be seen that, the co-precipitated hybrid catalysts show a higher specific surface area than the sol-gel impregnated ones, e.g., for Kuraray YP 50F S
BET (Sol) = 239 m² g
−1 vs. S
BET (Precipitation) = 869 m² g
−1. However, the co-precipitated hybrid catalysts have a higher carbon content (extracted from TG/DTA data). Especially in the case of Vulcan XC 72 (S
BET = 230 m² g
−1) and Kuraray YP 50F (S
BET = 1485 m² g
−1) the pure carbon materials have a much higher specific surface area than pure γ–MnO
2 (S
BET = 104 m² g
−1) or Mn
3O
4 (S
BET = 1 m² g
−1). Additionally, the SEM images of
Figure 4 demonstrate that in the case of so-gel impregnated hybrid catalysts the carbon materials are covered with a Mn
3O
4 shell. This might causes a blocking of the carbon pores and reduces the specific surface area of these hybrid catalysts in comparison to the corresponding carbon material. For the co-precipitated catalysts γ–MnO
2 or Mn
3O
4 particles are present adjacent to the carbon materials. Therefore, the specific surface area results in an arithmetic mean of carbon and manganese oxide which is much higher compared to the sol-gel impregnated hybrid catalyst.
Table 2.
Structural properties of all investigated materials.
Table 2.
Structural properties of all investigated materials.
| Catalyst | Synthesis Pathway | Carbon Content of Hybrid Catalyst (wt %) | Specific Surface Area SBET (m² g−1) |
|---|
| γ-MnO2 | Co-precipitation | 0 | 104 |
| Mn3O4 | Sigma Aldrich | 0 | 1 |
| Mn3O4@Super C 65 | Sol-gel impregnation | 32 | 52 |
| Mn3O4@Super C 65 | Co-precipitation | 35 | 73 |
| Super C 65 | | 100 | 63 |
| Mn3O4@Vulcan XC 72 | Sol-gel impregnation | 24 | 50 |
| γ-MnO2@Vulcan XC 72 | Co-precipitation | 39 | 116 |
| Vulcan XC 72 | | 100 | 230 |
| Mn3O4@Kuraray YP 50F | Sol-gel impregnation | 18 | 239 |
| Mn3O4@Kuraray YP 50F | Co-precipitation | 28 | 869 |
| Kuraray YP 50F | | 100 | 1485 |
2.2. Electrocatalytic Activity of Pure and Hybrid Catalysts
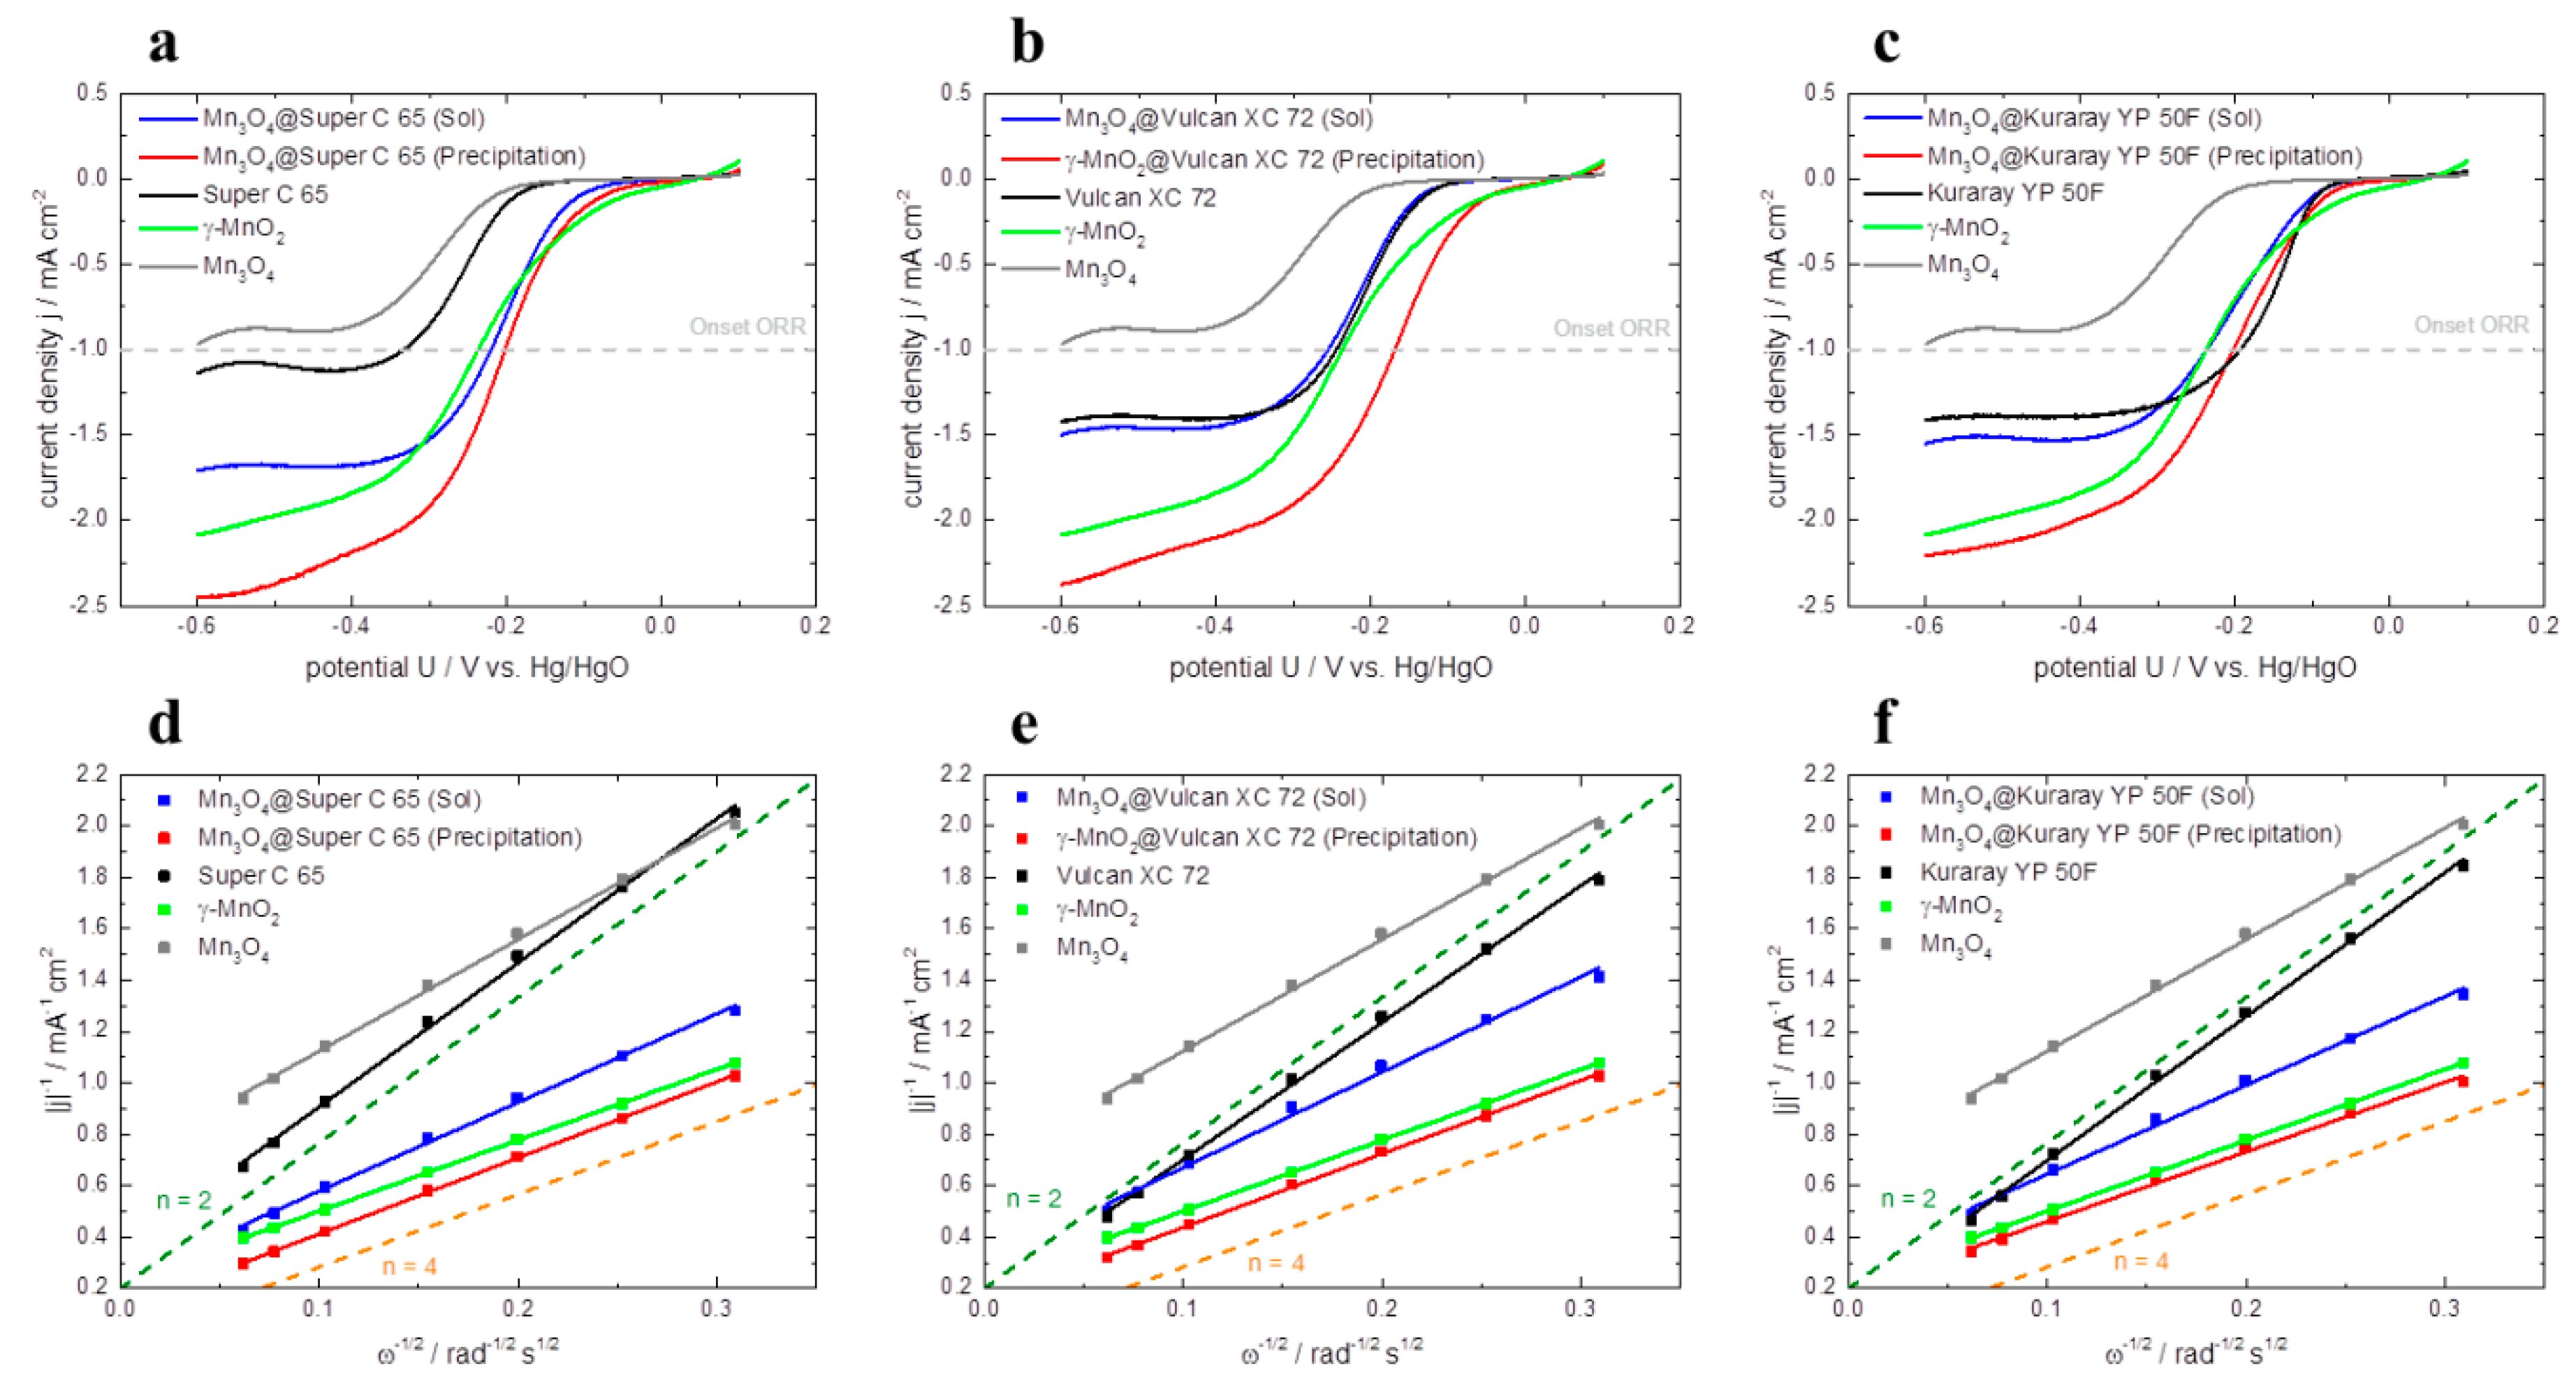
The electrocatalytic activity for the oxygen reduction reaction (ORR) is measured by rotating disc electrode (RDE). The polarization curves of all investigated catalysts are depicted in
Figure 7a–c. All measurements are carried out in O
2-saturated 1 M KOH (aq.) solution at a rotation rate of 900 rpm. For comparison of the different catalysts the onset potential at −1 mA cm
−² and the corresponding limiting current density at −0.5 V
vs. Hg/HgO are employed (
Table 3). The higher the onset potential of the reaction is, the lower the overpotentials for the ORR.
In
Figure 7a the polarization curves of Mn
3O
4@Super C 65 (Sol) and Mn
3O
4@Super C 65 (Precipitation) are compared to pure catalysts Mn
3O
4 and γ–MnO
2 as well as to pure Super C 65. The catalytic activity of the latter materials can be ranked in the following ascending order: Mn
3O
4 < Super C 65 < γ–MnO
2. Furthermore, it can be seen that the sol-gel impregnation of Super C 65 with Mn
3O
4 reduces the onset potential compared to Super C 65 by 111 mV
vs. Hg/HgO. At the same time, the limiting current density of Mn
3O
4@Super C 65 (Sol) is increased by 0.8 mA cm
−2 compared to Mn
3O
4. The highest ORR activity in this plot is detected for Mn
3O
4@Super C 65 synthesized via co-precipitation. This hybrid catalyst exhibits an onset potential for ORR of −203 mV vs Hg/HgO and a limiting current density of −2.38 mA cm
−². These results show that the combination of carbon and catalyst strongly enhances the catalytic activity for the ORR in comparison to pure materials Super C 65 and Mn
3O
4 [
13,
15,
16].
The same ranking of ORR activity is also found for the hybrid catalysts containing Vulcan XC 72 and Kuraray YP 50F as carbon material (
Figure 7b–c). Independent of the used carbon material, again the catalysts synthesized via co-precipitation show higher ORR activity than the sol-gel impregnated ones (e.g., the difference in onset potentials of the hybrid catalysts based on Super C 65: 19 mV; Vulcan XC 72: 86 mV; Kuraray YP 50F: 35 mV and the difference in limiting current density for Super C 65: 0.70 mA cm
−², Vulcan XC 72: 0.77 mA cm
−² and Kuraray YP 50F: 0.62 mA cm
−²). One reason for this could be that the pores of the carbon as well as of the manganese oxide are more accessible for oxygen, which results in a large three-phase boundary layer for the reduction of oxygen to OH
−. Another reason for the higher catalytic activity of the co-precipitated catalysts compared to the sol-gel impregnated ones could be the presence of a small amount of Ag in the co-precipitated hybrid catalysts. AgNO
3 is used as catalyst for the co-precipitation synthesis and after heat treatment a little amount of Ag is contained in the co-precipitated catalysts and perhaps gives an additional catalytic effect for the ORR.
For pure carbon materials, Kuraray YP 50F shows the highest onset potential of −194 mV vs. Hg/HgO and almost the same limiting current density of −1.38 mA cm−² as Vulcan XC 72. Super C 65 exhibits the lowest limiting current density of −1.09 mA cm−² and the poorest onset potential among the investigated carbon materials of −333 mV vs. Hg/HgO. This behavior can be correlated to the specific surface area of the carbon materials—the higher the specific surface area the more active the carbon material for the ORR. In contrast to this, hybrid catalysts show a different behavior. In this case, it appears that the surface area has not such a big influence on the ORR activity.
Figure 7.
Oxygen reduction reaction (ORR) polarization curves of pure γ–MnO2, Mn3O4, pure carbon materials and hybrid catalysts based on (a) Super C 65, (b) Vulcan XC 72, (c) Kuraray YP 50F in O2-saturated 1 M KOH (aq.) solution at a rotations rate of 900 rpm and a scan rate of 5 mV s−1. Corresponding Koutecky-Levich plots of pure γ–MnO2, Mn3O4, pure carbon materials and hybrid catalysts based on (d) Super C 65, (e) Vulcan XC 72, (f) Kuraray YP 50F at −0.5 V vs. Hg/HgO.
The number of electrons
n transferred during ORR and thus the underlying mechanism of the ORR (according to Equations (1–3)) is evaluated by the Koutecky-Levich equation [
10,
26,
27]:
(
j: measured current density (at −0.5 V
vs. Hg/HgO);
jk: kinetic current density;
ω: angular velocity;
B: slope of the regression line;
n: number of electrons transferred;
F: faraday constant;
ν: kinetic viscosity of the electrolyte,
: O
2 concentration in the electrolyte;
: diffusion coefficient of O
2 in the electrolyte).
The corresponding Koutecky-Levich plots at –0.5 V
vs. Hg/HgO of all investigated catalysts are presented in
Figure 7. From the slope of the regression line, the number of transferred electrons
n can be calculated according to Equation 5 (
Table 3). All investigated pure carbon materials catalyze the ORR via the indirect two electron mechanism (
n = 2) [
10,
17,
28,
29]. Pure γ–MnO
2 and the hybrid catalysts which are synthesized via co-precipitation follow the direct four electron mechanism (
n = 4) [
7,
17]. The hybrid catalysts synthesized via sol-gel impregnation exhibit electron transfer numbers in the area of about
n = 3. In this case both the direct four electron mechanism as well as the indirect two electron mechanism takes place.
Table 3.
Electrochemical properties of all investigated catalyst materials.
Table 3.
Electrochemical properties of all investigated catalyst materials.
| Catalyst | Synthesis Pathway | Onset Potential at −1 mA cm−² (mV vs. Hg/HgO) | Limiting Current Density at −0.5 V vs. Hg/HgO (mA cm−²) | Electron Transfer Number n |
|---|
| γ-MnO2 | Co-precipitation | −238 | −1.97 | 4 |
| Mn3O4 | Sigma Aldrich | - | −0.88 | 2.6 |
| Mn3O4@Super C 65 | Sol-gel impregnation | −222 | −1.68 | 3.3 |
| Mn3O4@Super C 65 | Co-precipitation | −203 | −2.38 | 4 |
| Super C 65 | | −333 | −1.09 | 2 |
| Mn3O4@Vulcan XC 72 | Sol-gel impregnation | −256 | −1.46 | 3.0 |
| γ-MnO2@Vulcan XC 72 | Co-precipitation | −170 | −2.23 | 4 |
| Vulcan XC 72 | | −245 | −1.39 | 2 |
| Mn3O4@Kuraray YP 50F | Sol-gel impregnation | −238 | −1.51 | 3.3 |
| Mn3O4@Kuraray YP 50F | Co-precipitation | −203 | −2.13 | 4 |
| Kuraray YP 50F | | −194 | −1.38 | 2 |
2.3. Discharge Behavior in Zn-Air Full Cells
Subsequent to the RDE characterization, all investigated catalysts and pure carbon materials were introduced into the reactive layer of a GDE (
Figure 3). For comparison, also pure carbon materials were processed as well. In
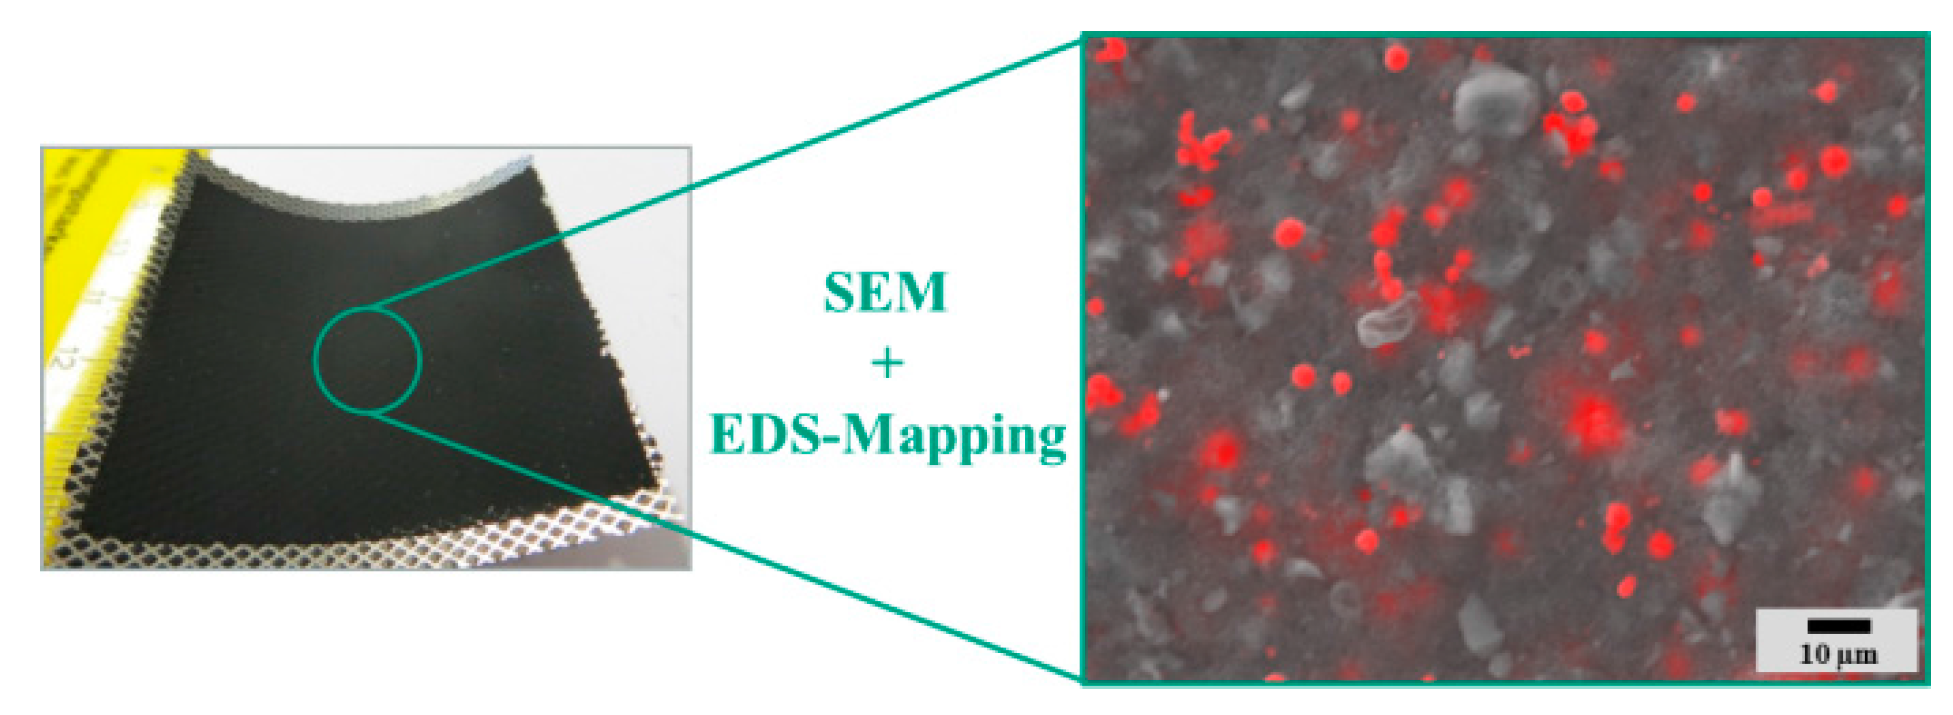
Figure 8, the surface morphology of the reactive layer containing 20 wt % γ–MnO
2@Vulcan XC 72 (Precipitation) hybrid catalysts is exemplarily represented. The homogeneous distribution of the hybrid catalyst (red) is visualized by EDS mapping.
Figure 8.
SEM image of the reactive layer of an as prepared GDE containing γ-MnO2@Vulcan XC 72 (precipitation) including energy dispersive X-ray spectroscopy (EDS) mapping (red color corresponds to manganese).
Figure 8.
SEM image of the reactive layer of an as prepared GDE containing γ-MnO2@Vulcan XC 72 (precipitation) including energy dispersive X-ray spectroscopy (EDS) mapping (red color corresponds to manganese).
The prepared GDEs are tested in Zn-air full cells employing 6 M KOH (aq.) as electrolyte, zinc granules as anode material, and a constant flow of ambient air in a commercial El-Cell
® ECC-Air test cell. In
Figure 9, the resulting polarization curves of the GDEs are plotted. In graphs a, b, and c the polarization curves of the hybrid catalysts are compared to pure γ–MnO
2 and Mn
3O
4 catalysts as well as the corresponding carbon material to investigate the impact of manganese oxide coating on full cell performance. Within the graphs it can be seen that all cells containing hybrid catalysts via co-precipitation (red lines) show a higher cell voltage than cells prepared with sol-gel impregnated catalysts (blue lines). Thus, it appears that the polarization behavior of co-precipitated catalysts is much better than the polarization behavior of sol-gel impregnated catalysts. This behavior can be correlated with the RDE polarization curves.
Figure 9.
Polarization curves of pure γ–MnO2, Mn3O4, pure carbon materials and hybrid catalysts based on (a) Super C 65, (b) Vulcan XC 72, (c) Kuraray YP 50 F, in Zn-air full cells.
Figure 9.
Polarization curves of pure γ–MnO2, Mn3O4, pure carbon materials and hybrid catalysts based on (a) Super C 65, (b) Vulcan XC 72, (c) Kuraray YP 50 F, in Zn-air full cells.
The discharge curves of all prepared GDEs are presented in
Figure 10. Just like in the polarization behavior measured by RDE and in full cells, the GDEs containing the co-precipitated hybrid catalysts exhibit higher specific capacities compared to the sol-gel impregnated ones (for Super C 65: 75 mAh g
−1 higher, for Vulcan XC 72: 132 mAh g
−1 higher and for Kuraray YP 50F: 146 mAh g
−1 higher) as well as the pure materials. The support of carbon with the co-precipitated synthesis route improves the discharge and polarization behavior. Additionally the amount of manganese oxide is strongly reduced in the hybrid catalysts. The highest specific capacity of the hybrid catalyst is reached with Vulcan XC 72 with 449 mAh g
−1 (discharge time: 10.75 h) and a discharge plateau of 1.11 V at 200 mAh g
−1. In this case the specific capacity can be increased by 25% (with 39% less amount of γ–MnO
2) compared to pure γ–MnO
2. This improved behavior correlates to the RDE polarization curves of γ–MnO
2@Vulcan XC 72 (precipitation). In the publication of Li
et al. [
13] a Zn-air discharge curve of a GDE with a Vulcan XC 72 / α-MnO
2 (1:1) mixed catalyst is displayed which is discharged for 11.5 h (at 10 mA/cm²) and exhibits a discharge plateau of 1.2 V. These results are comparable with the here presented hybrid catalyst γ–MnO
2@Vulcan XC 72 synthesized by co-precipitation. The electrochemical properties of all investigated GDEs are shown in
Table 4.
Figure 10.
Discharge curves of pure γ–MnO2, Mn3O4, pure carbon materials and hybrid catalysts based on (a) Super C 65, (b) Vulcan XC 72, (c) Kuraray YP 50F in Zn-air full cells at a constant current density of 10 mA cm−².
Figure 10.
Discharge curves of pure γ–MnO2, Mn3O4, pure carbon materials and hybrid catalysts based on (a) Super C 65, (b) Vulcan XC 72, (c) Kuraray YP 50F in Zn-air full cells at a constant current density of 10 mA cm−².
Table 4.
Electrochemical properties of all investigated gas diffusion electrodes (GDEs).
Table 4.
Electrochemical properties of all investigated gas diffusion electrodes (GDEs).
| Catalyst | Synthesis Pathway | Cell Potential at 30 mA cm−² (V) | Cell Potential at 200 mAh g−1 (V) | Specific Capacity (mAh g−1) |
|---|
| γ-MnO2 | Co-precipitation | 0.89 | 1.08 | 344 |
| Mn3O4 | Sigma Aldrich | 0.84 | 1.10 | 314 |
| Mn3O4@Super C 65 | Sol-gel impregnation | 0.84 | 1.09 | 295 |
| Mn3O4@Super C 65 | Co-precipitation | 0.88 | 1.10 | 362 |
| Super C 65 | | 0.86 | 1.08 | 330 |
| Mn3O4@Vulcan XC 72 | Sol-gel impregnation | 0.86 | 1.08 | 317 |
| γ-MnO2@Vulcan XC 72 | Co-precipitation | 0.91 | 1.11 | 449 |
| Vulcan XC 72 | | 0.87 | 1.08 | 314 |
| Mn3O4@Kuraray YP 50F | Sol-gel impregnation | 0.75 | 1.08 | 275 |
| Mn3O4@Kuraray YP 50F | Co-precipitation | 0.85 | 1.10 | 421 |
| Kuraray YP 50F | | 0.81 | 1.08 | 343 |
