Article

Formation of Improved Metallurgical Properties and Carbon Structure of Coke by Optimizing the Composition of Petrographically Heterogeneous Interbasin Coal Batches

1
The Department of Oil, Gas and Solid Fuel Refining Technologies, Kharkiv Polytechnic Institute, National Technical University, 61002 Kharkiv, Ukraine
2
Ukrainian State Research Institute for Carbochemistry, 610237 Kharkiv, Ukraine
3
The Department of Chemical Technology and Engineering, State University of Economics and Technology, 50005 Kriviy Rih, Ukraine
4
ArcelorMittal Krivoy Rog, 50095 Krivoy Rog, Ukraine
5
Department of Information Protection, Lviv Polytechnic National University, 79013 Lviv, Ukraine
*
Author to whom correspondence should be addressed.
Submission received: 6 August 2025 / Revised: 23 August 2025 / Accepted: 28 August 2025 / Published: 4 September 2025
(This article belongs to the Topic Advances in Carbon-Based Materials)

Abstract

Given the multi-basin raw material base for coking that has been formed at most industry enterprises, there is an urgent need to optimize the component composition and improve the basic technological methods of coal raw material preparation, taking into account the petrographic characteristics of coal batches. A comprehensive study of the components included in a coke chemical enterprise’s coking raw material base was carried out. The work used standardized methods for studying coal and coal batches’ technological and plastic–viscous properties. The qualitative characteristics of coke were determined using physical–mechanical and thermochemical methods of studying standardized indicators: crushability (M25), abrasion (M10), reactivity (CRI), post-reaction strength (CSR), and specific electrical resistance (ρ). The results were analyzed using the licensed Microsoft Excel computer program. Based on the results of proximate, plastometric, and petrographic analyses of the studied coal samples and data from experimental industrial coking, proposals were made to optimize the component composition, properties of the coal batch, and technology for its preparation for coking. The established inverse dependence of Gibbs free energy (ΔGf,total) on the reaction capacity of coke CRI and its direct reliance on its post-reaction strength CSR confirmed the feasibility of using ΔGf,total as a thermodynamic predictive parameter for optimizing and compiling coal batches that produce less reactive, stronger coke. This made it possible to improve the quality indicators of metallurgical coke. Thus, according to the M25 crushability index, the mechanical strength increased by 0.6%, and the M10 abrasion decreased by 0.4%. Significant improvements in thermochemical properties and an increase in the orderliness of the carbon structure were recorded: the CRI reactivity decreased by 3.1%, the CSR post-reaction strength increased by 8.3%, and the specific resistance decreased by 8.4%.

1. Introduction

At present, blast furnace production sets higher requirements for coke quality, the standards of which are fixed both in the current technical specifications (Ad, Sdt, M10, and M25) and in ISO 18894-2006 (CRI and CSR). Thus, the current requirements for coke quality are M25 ≥ 88.0–90.0%, M10 ≤ 6.0–6.5%, CSR—60.0–75.0%, and CRI—25–30.0%.
Analysis of coal resources shows that the domestic raw material base cannot produce blast furnace coke of improved quality on its own. Consequently, the question of attraction and rational use of imported components (coals from far abroad) in coal batches for coking arises [1,2,3,4,5,6].
For coking of imported raw coal, which differs in technological properties and petrographic characteristics and comes from different countries, basins, and continents, the composition of the coal batch according to the ranks of coal does not reflect the actual composition of the mixture and its characteristics and does not fully take into account the peculiarities of the composition or properties of specific components of the organic mass of coal. Classification of distant foreign coal and its aggregation into classes and groups [1] differs from the accepted classification of ranks in accordance with DSTU 3472-2015 [7]. Therefore, the use of imported coal is complicated by different approaches to classification and inconsistencies between domestic and foreign regulatory documents.
An essential factor that necessitates the consideration of petrographic characteristics when compiling blends is that most enrichment plants in Ukraine do not have a permanent coal raw material base. As a result, they are forced to enrich coal of two or more ranks, which leads to mutual contamination and a decrease in the technological value of the obtained concentrate [8]. In this regard, the declared rank of concentrates often does not correspond to reality, which complicates the production of coke of planned quality.
Therefore, it is obligatory to formulate the coal mixture taking into account the maceral composition, the indicator of vitrinite reflection, the distribution of vitrinite components by stages of metamorphism, and the optimal ratio between clinkering (ƩCC) and lean (fusinized) components (ƩFC). When predicting the output and properties of coke, we should consider that the macerals of the groups of vitrinite, liptinite, and one-third of semivitrinite constitute the sum of reactive and clinkering components. In contrast, the whole of inertinite and two-thirds of semivitrinite have an oppressive effect on the system [9].
Various models have been developed to optimize charge composition and predict coke quality. The first generation of models focuses on predicting cold mechanical strength indicators (i.e., ASTM stability and indices obtained when processing coke in a MICUM drum). The second-generation models use CRI and CSR as coke quality parameters. No universal models for predicting coke quality have been developed due to the specific characteristics of coal from different coal basins, countries, and continents, which can vary significantly in composition, structure, and properties.
Analyses of mathematical models for predicting coke quality considering the properties of coal have been conducted by steel companies and research institutes and are presented in [10,11,12,13,14,15,16,17,18,19,20,21,22,23,24,25,26]. The main variables considered in some mathematical models are presented in Table 1.
Analyzing the data in the table, most mathematical models consider the vitrinite reflectance and the content of inert (fused) components, the maximum fluidity, and the basicity of coal ash.
Given the multi-basin raw material base for coking, which determines differences in the technological properties and material composition of coal concentrates, it is necessary to refine and improve the basic technological methods of preparation when using them in coal batches. The study aims to develop recommendations for obtaining blast furnace coke of stable quality while optimizing the composition, properties, and degree of crushing of the batch, taking into account its petrographic characteristics.
When blending coal to obtain coke of a particular strength, including the maximum possible strength, the criterion for the technological properties of the blend that meets these requirements should not be the rank (quality) but rather the optimality, based on the calculation of specific values of the properties of the charge according to the properties of its components. One such unique indicator could be the value of the Gibbs free energy of formation (ΔGf,total). The uniqueness and practical value of introducing the thermodynamic index (ΔGf,total) lie in the fact that it considers the content of vitrinite and inertinite and the reflection coefficients for all maceral types. This approach allows the overall thermodynamic stability of the coal mixture to be assessed using a single integral value.

2. Materials and Methods

Samples were collected and prepared per the State Standard of Ukraine 4096-2002, “Brown coal, hard coal, anthracite, combustible shale, and coal briquettes—methods of sample selection and preparation for laboratory tests” [27].
The research methods used to study the properties of coal raw materials and coke are presented in Table 2.
The degree of crushing of the coal batch according to the above method [43], depending on its petrographic characteristics and sinterability, can be determined by the following equation:
k = 75 V t 0.9 1.39 100 + 90 V t 0.5 0.89 + 1.4 2.6 100 + 90 F C 100 ,   %
where Σ (0.5–2.6) is the content of the vitrinite components with reflectance in the range 0.5–2.6%, corresponding to different coal ranks; 75 is the recommended degree of crushing of Zh and K coal, %; 90 is the recommended degree of crushing of G, PS, and T coal, %; and ΣFC is the sum of fusinized components (I + 2/3 Sv), %.
The variants of experimental batches were developed to test them by box coking. Box coking was carried out using the following methodology. Experimental batches weighing 5.5 kg were loaded into metal crates. With the crate volume of 7.3 dm3, the density of the experimental batch in them was approximately 0.760 t/m3, which corresponds to the average practical data on the density of the batch in the chamber.
Photos of the boxes are presented in Figure 1.
Coking of experimental batches was carried out on coke batteries (adequate volume of the chamber: 21.6 m3) in specially selected ovens with good condition of masonry of heating partitions and a stable thermal regime.
Loading of boxes was carried out through the middle hatch after the release of the batch from the coke and machine hoppers of the coal loading car so that the boxes with the batch were located at a level of approximately 2.5 m from the bottom of the coking chamber, that is, in the zone of optimal temperature conditions. Four boxes were loaded into each chamber according to the number of experimental batches. Experimental coking was carried out under the thermal regime, the parameters of which are presented in Table 3.
Once the coking process was complete, the cake was delivered using standard technology (from the chamber to the quenching car, then quenching and unloading onto the coke slide). If necessary, the boxes were quenched with water and pre-cooled in air.
The obtained experimental coke was extracted from the crates, weighed, and dried to constant weight to determine the yield of gross coke from the batch and for subsequent analyses.

3. Results

3.1. Detailed Study of American Coal

To determine the optimal conditions for preparation and coking of a batch with a large content of petrographically heterogeneous coal in the laboratory and experimental industrial conditions, studies were conducted to determine their rational rank and component composition, preparation schemes, and coking mode, as well as to assess the impact of these measures on the quality of blast furnace coke (in terms of mechanical strength and specific electrical resistance).
Carrying out the above measures is especially relevant in coke chemical enterprises in Ukraine, as the raw material base contains coal from different basins.
Samples of coal concentrates, which constitute the raw material base of the coke plant, and production batches were selected and studied. These samples’ technological properties, petrographic characteristics, and plastic–viscous properties were determined. The obtained data are presented in Table 4, Table 5 and Table 6.
Based on the results of the analysis, the conclusion is that American coal is characterized by low ash and sulfur content. In terms of its overall genetic characteristics and plastic–viscous properties, it is typical fatty coal. The obtained indicators for characterizing thermoplastic properties (dilatometric indicators according to the Odier–Arnou method: contraction (a), dilatation (b), and maximum fluidity according to Gieseler (Fmax)) give an idea of the behavior of American coal under real coking conditions. Thus, the plastic mass of coal is homogeneous in composition, contains fewer low-molecular components, and the liquid phase components exhibit a well-defined plasticizing effect. During thermal destruction, a significant amount of non-volatile, slow-moving products are formed, characterized by high fluidity and the ability to bake the residual material of destructive coal grains and a large quantity of non-clinkering additives. This is evidenced by data obtained using the Rog and Gray–King methods. Like all bituminous coal in the medium stage of metamorphism, the plastic mass of this coal has a pronounced tendency to swell, which is confirmed by high values of the free swelling and dilatation index according to the Odibier–Arnou method.
Equimetamorphosed American bituminous coals are very similar to Ukrainian bituminous coals. The American coals studied in terms of the nature of the thermochemical transformations occurring in the temperature range of plasticity are very similar to the processes occurring with Ukrainian coals, which allows us to judge their good compatibility during coking in mixtures. This, in turn, gives reason not to make any significant adjustments to the thermal regime of their coking. However, given that the maximum rate of mass loss of Ukrainian coals occurs in the range of maximum fluidity according to Gieseler (tmax = 430–440 °C), it can be assumed that it is this feature of their thermal transformations that determines the production of coke with better mechanical strength (in particular, abrasion resistance) due to improved plastic contact between grains under the action of increased pressure from the gaseous products of thermal destruction in a closed volume.
Thus, based on the entire complex of studied properties, American coal is analogous to Ukrainian bituminous coal of a medium stage of metamorphism, differing from the latter in terms of a lower ash and sulfur content as well as a slightly higher content of lean (fusinized) macerals of the inertinite group.

3.2. Using American Coal in Coking Batches

The production batch of the plant has increased ash (Ad = 10.4%) compared to the batch of other plants of Ukraine, where the ash of the batch, as a rule, varies within 8.5–9.0%. Sulfur content in the batch is low (Std = 0.83%). It should be noted that the composition of the batch vitrinite includes coals from almost all stages of metamorphism, from low metamorphosed to highly metamorphosed. The principal amount of vitrinite constituents has reflection coefficient Ro values in the range of 0.65–0.84 (20%) and 0.90–1.19 (59%).
The total content of vitrinite constituents with a mean vitrinite reflection coefficient of 0.9–1.39% is 66%. However, taking into account that the absolute content of vitrinite in the batch is only 74%, the actual amount of vitrinite components having a mean vitrinite reflection coefficient of 0.9–1.39% in the organic mass amounts to only 46.9%, which is far from the recommended minimum value of 53%, which ensures the production of high-strength metallurgical coke. Reduced amounts of well-clinkering components of vitrinite and increased content of non-clinkering macerals of the inertinite group, as well as high ash, cause low sinterability and coking ability of the batch as a whole, which is reflected in the results of the study of plastic and viscous properties of the batch.
The production batch was sorted into size classes, and the technical analysis indicators, sintering ability according to the Rog method, and petrographic characteristics were determined. In addition, the content and quality of fractions lighter and heavier than 1400 kg/m3 were determined to be in charge size classes greater than 1 mm. These data are presented in Table 7 and Table 8.
The study’s results indicate a suboptimal distribution of particle sizes and quality. Thus, the charge contains 45.6% dust-like fractions with a size of less than 0.5 mm, which significantly complicates the process of smokeless loading, contributing to the entry of the smallest coal particles into the tar, which increases its ash and density.
At the same time, the batch contains many high-ash, poorly clinkering large grains larger than 6 mm, which are centers of crack formation in coke, reducing its resistance to crushing forces.
Grains of batches larger than 1 mm contain 21.3% industrial product fractions with an ash content of 28.4% and reduced clinkering ability, which is characterized by the Rog method and is only 21 units. At the same time, the rest of the load has a value of 60 units.
Thus, the calculation of the optimal degree of crushing [43], which ensures maximum strength indicators of metallurgical coke, taking into account the data in Table 7, showed that it should be according to Equation (1):
k = 75 74 66 100 + 90 74 24 + 9 100 + 90 23 100 = 79 %  
In the studied batch sample, the content of the 0–3 mm class is 82.7%, which is definitely higher than the optimal value. At the actual level of crushing, the content of dust-like fractions in the batch is already very high, which leads to a decrease in the bulk density of the batch in the coking chamber and several technological difficulties when loading the batch into the hopper of the loading car, smoke-free loading, etc.
In this regard, it is necessary to install devices to screen out minor ranks of charge before its final crushing to avoid significant over-crushing.
Three variants of experimental batches were developed and compiled. The component composition of the base (production) batch and experimental variants of the batches is shown in Table 9. The data in Table 10 characterize the technological properties of the batches. The petrographic characteristics of the pilot batches are given in Table 11.
During the development of variants of experimental batches, we were guided by the fact that, first of all, it was necessary to reduce the content of non-binding macerals of the inertinite group in the experimental batches in comparison with the basic one at the expense of coal H. Also, it was necessary to exclude coal F from the batch, which did not contain vitrinite with a reflection index of 1.2–1.39 and had an increased number of components in its composition, with Ro = 0.65–0.84%. Ro = 0.90–1.19% and Ro = 1.7–2.59%. The introduction of petrographically homogeneous G coal into the batch and the increase in the content of G and E coal, which had the minimum content of inertinite group macerals, also contributed to solving the above problems.
The data analysis in Table 12 shows that the objectives were achieved.
The content of lean (fusinized) macerals (the sum of lean (fusinized) components ƩFC) in the experimental batch compared to the base batch decreased from 23% to 19–20%. The amount of vitrinite components with a mean vitrinite reflection coefficient of 0.9–1.39% in organic mass increased from 45.1% in the base batch to 51.4, 49.9, and 48.8%, respectively, in the experimental variants.
The quality results of the experimental cokes are shown in Table 12 and Table 13.
As can be seen from the data presented, the ash content of the base and experimental cokes is high and ranges from 12.6 to 12.9%. At the same time, the sulfur content is low and varies between 0.52 and 0.61%. The ash content coefficients depend on the yield of volatile substances from the charge, decreasing with lower yield and increasing with higher yield. The residual sulfur coefficient in coke ranges from 0.800 to 0.869.
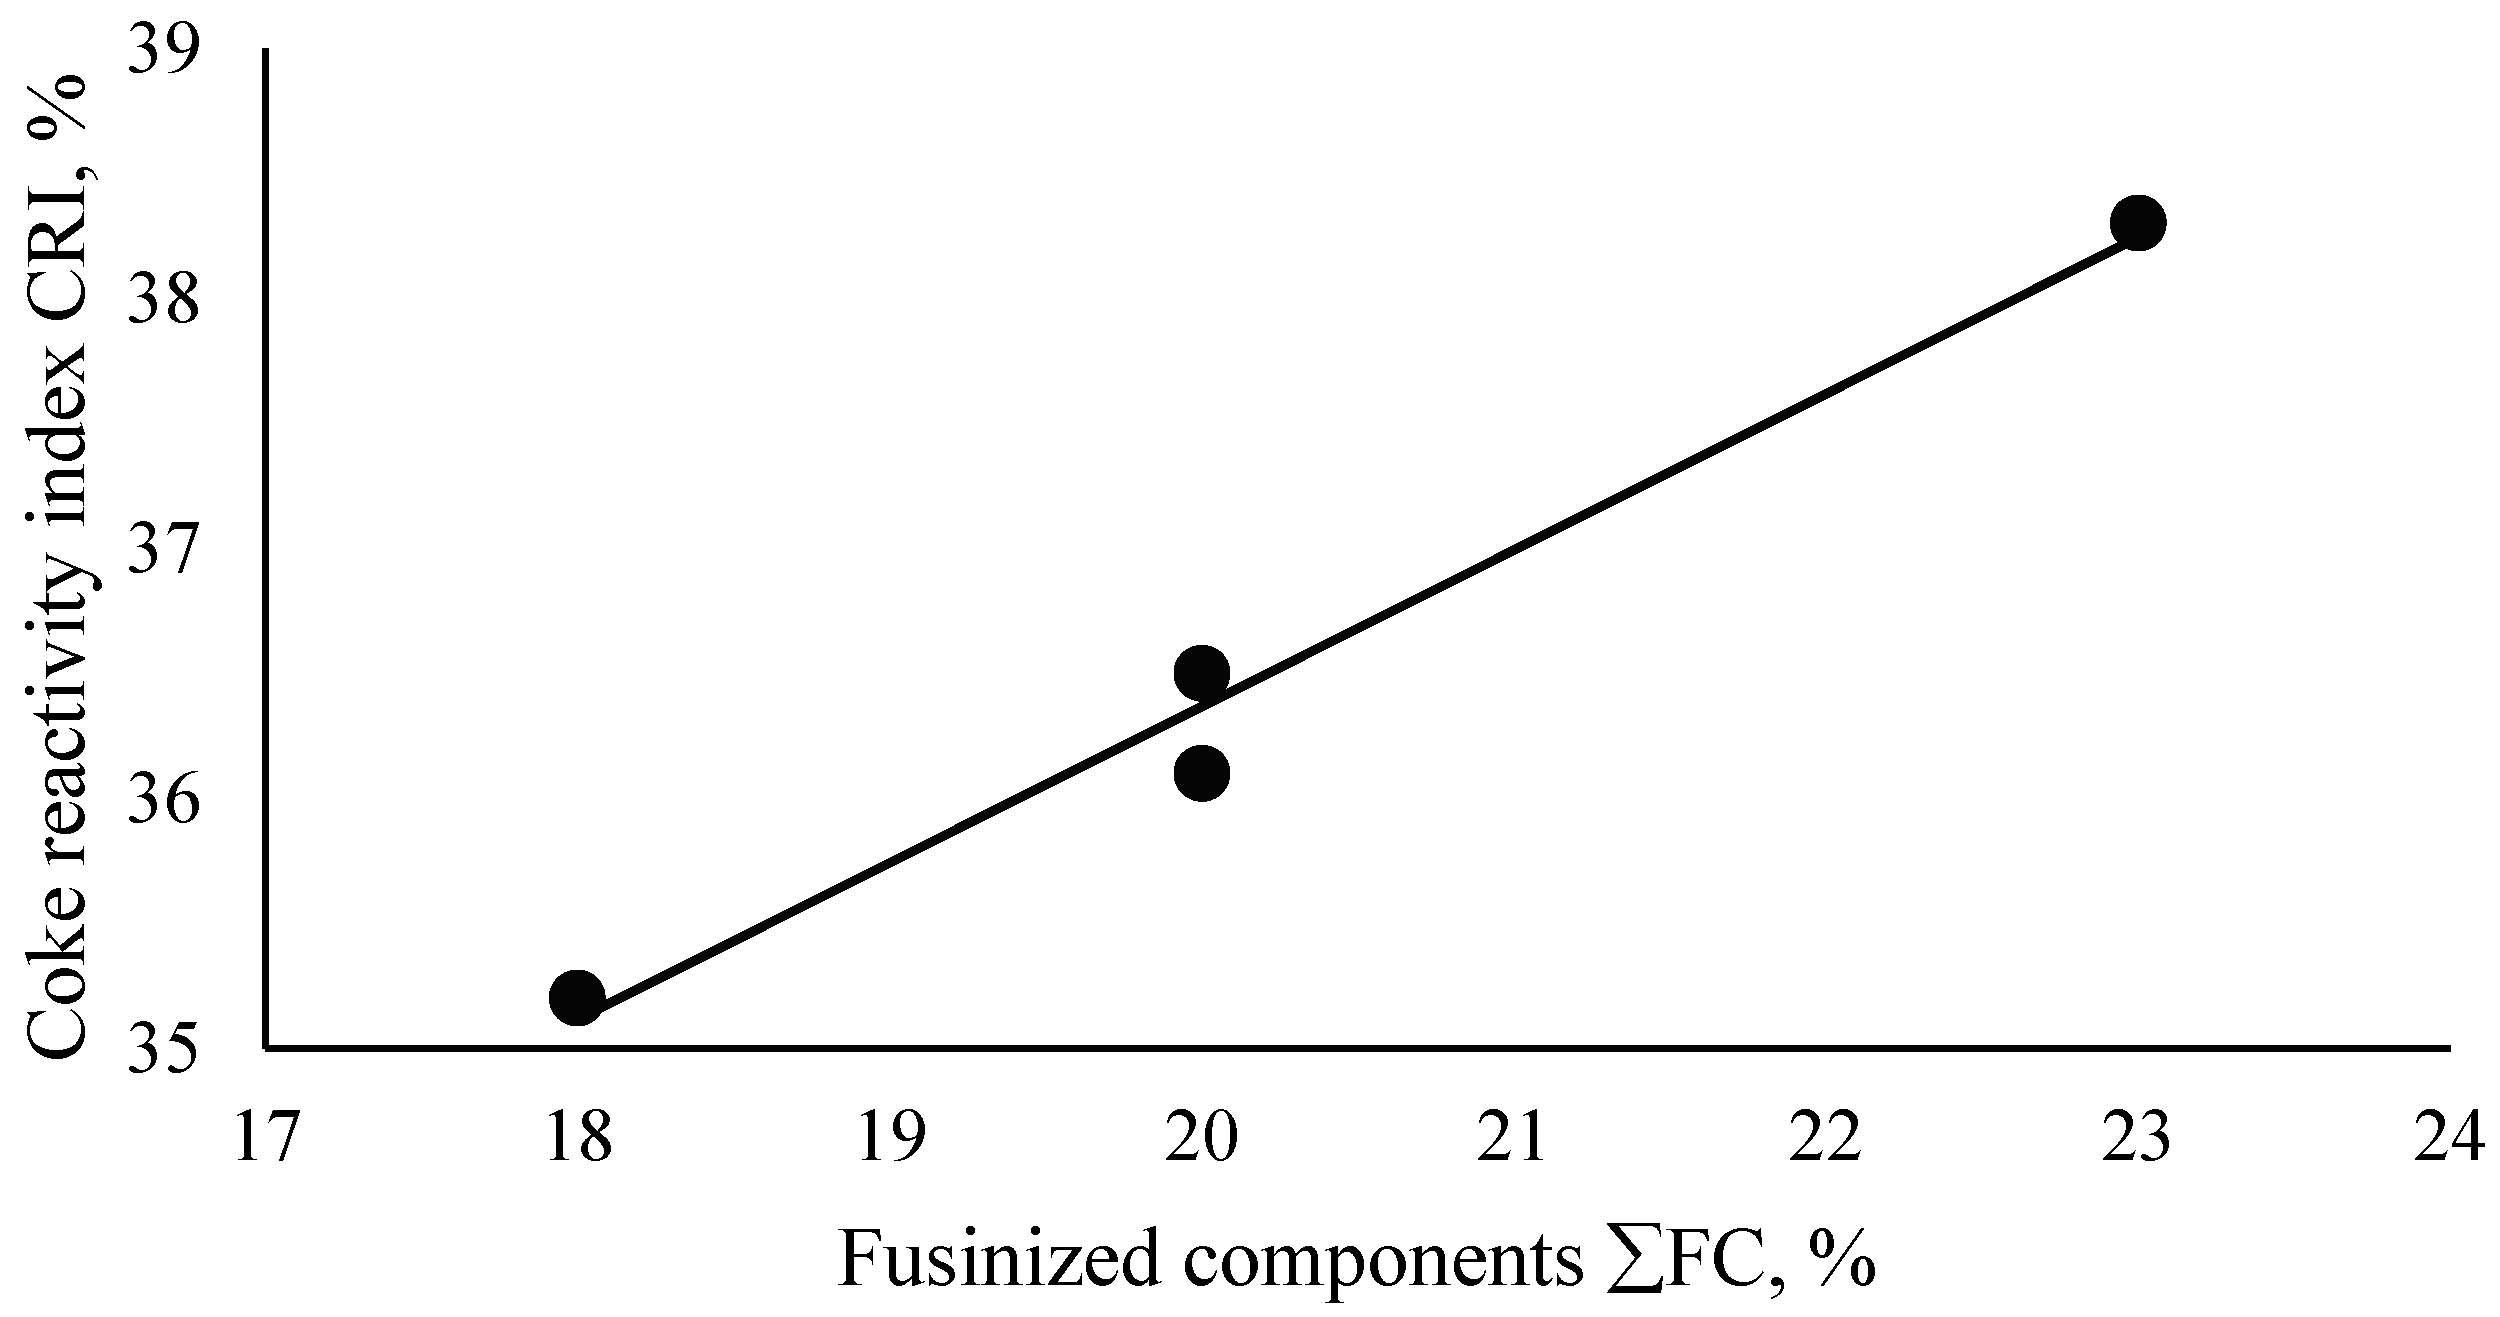
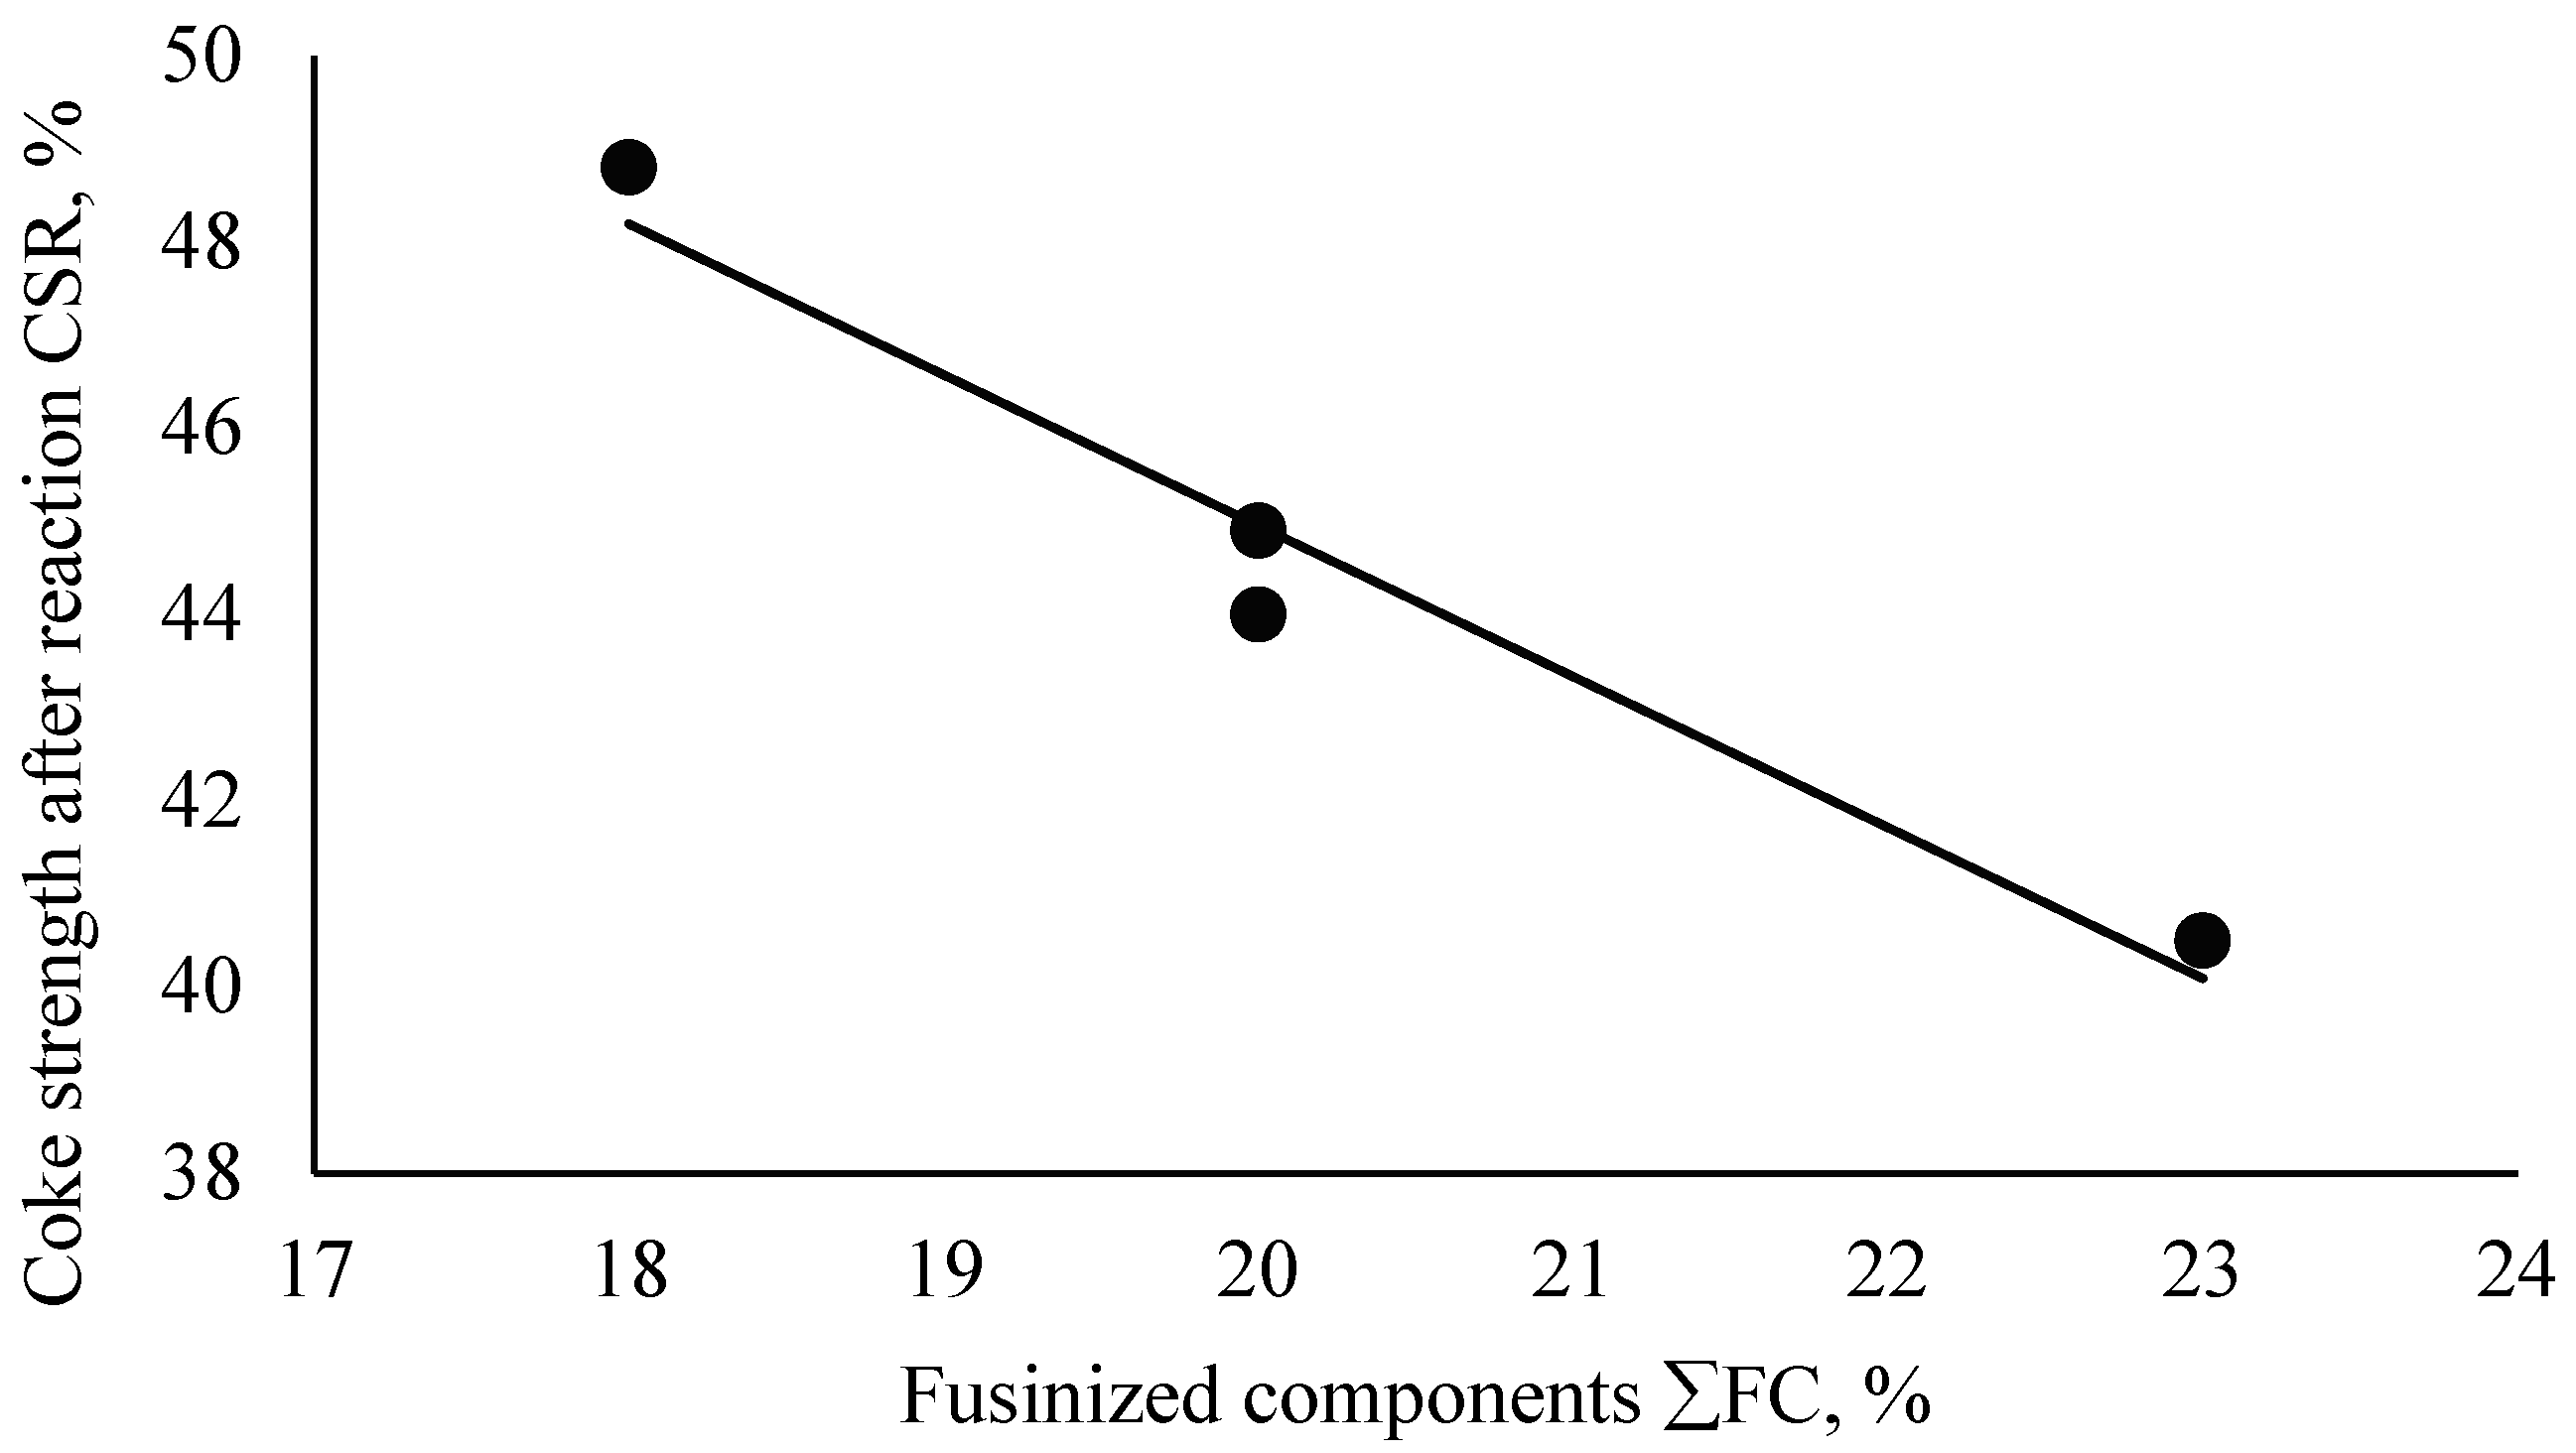
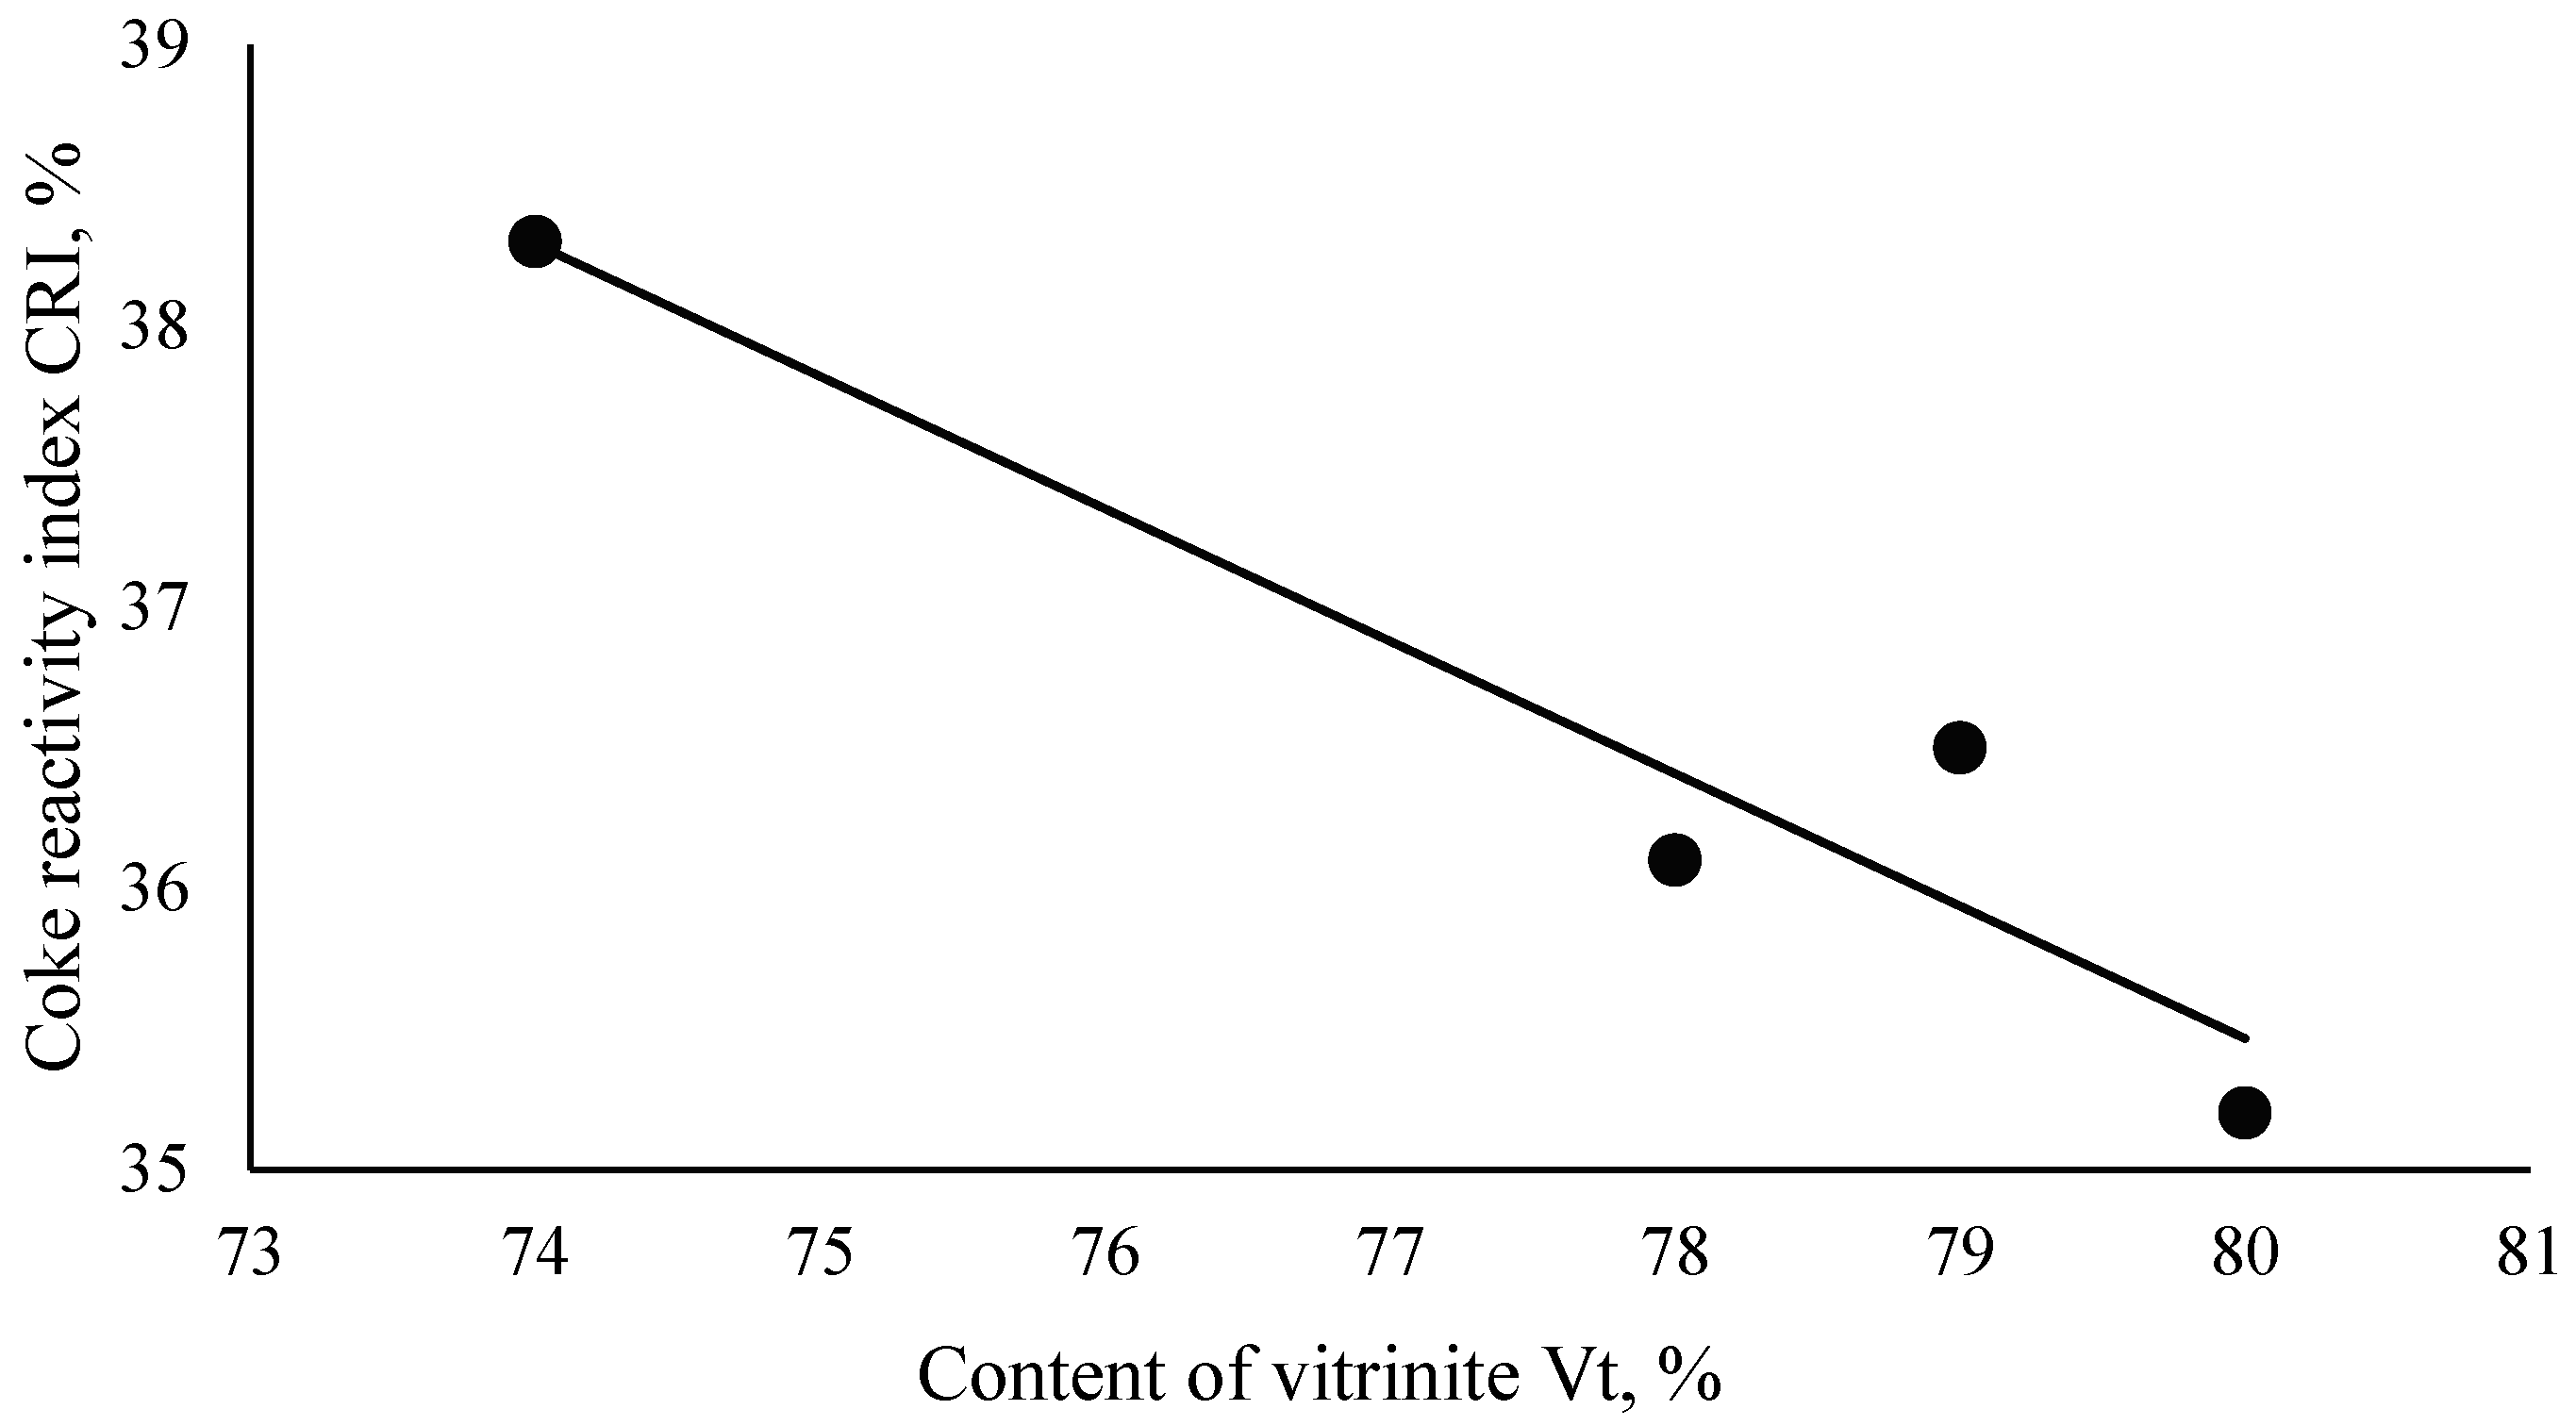
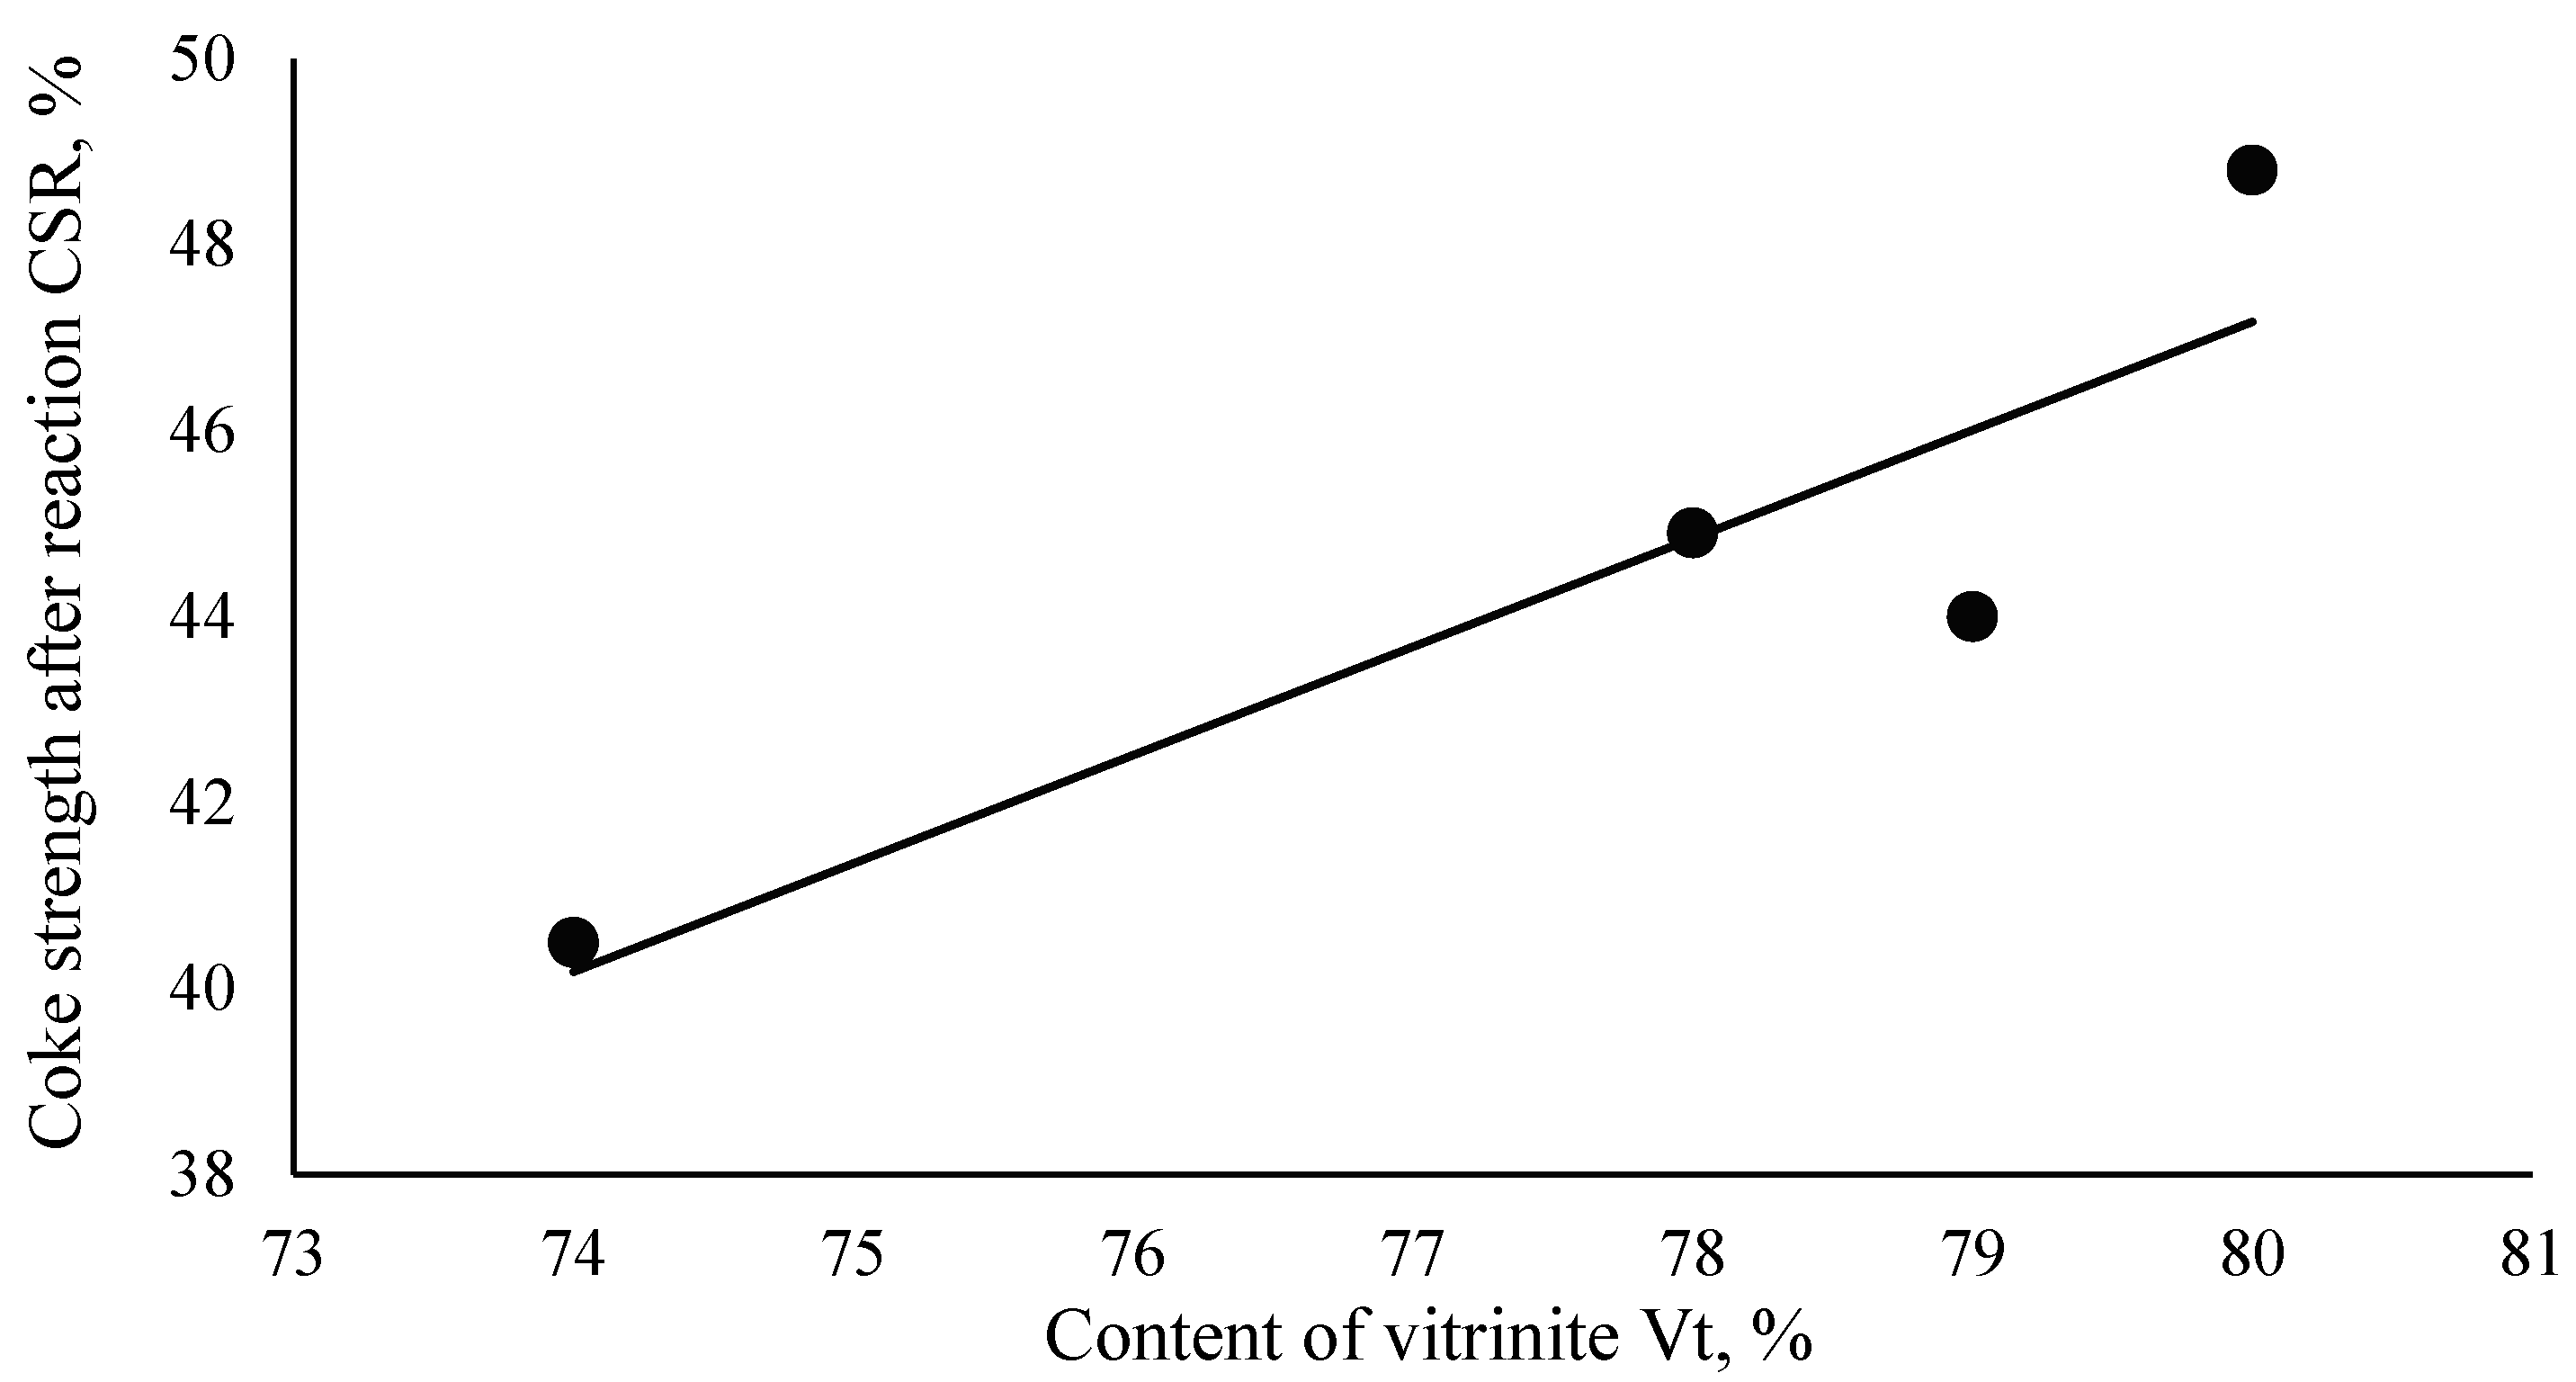
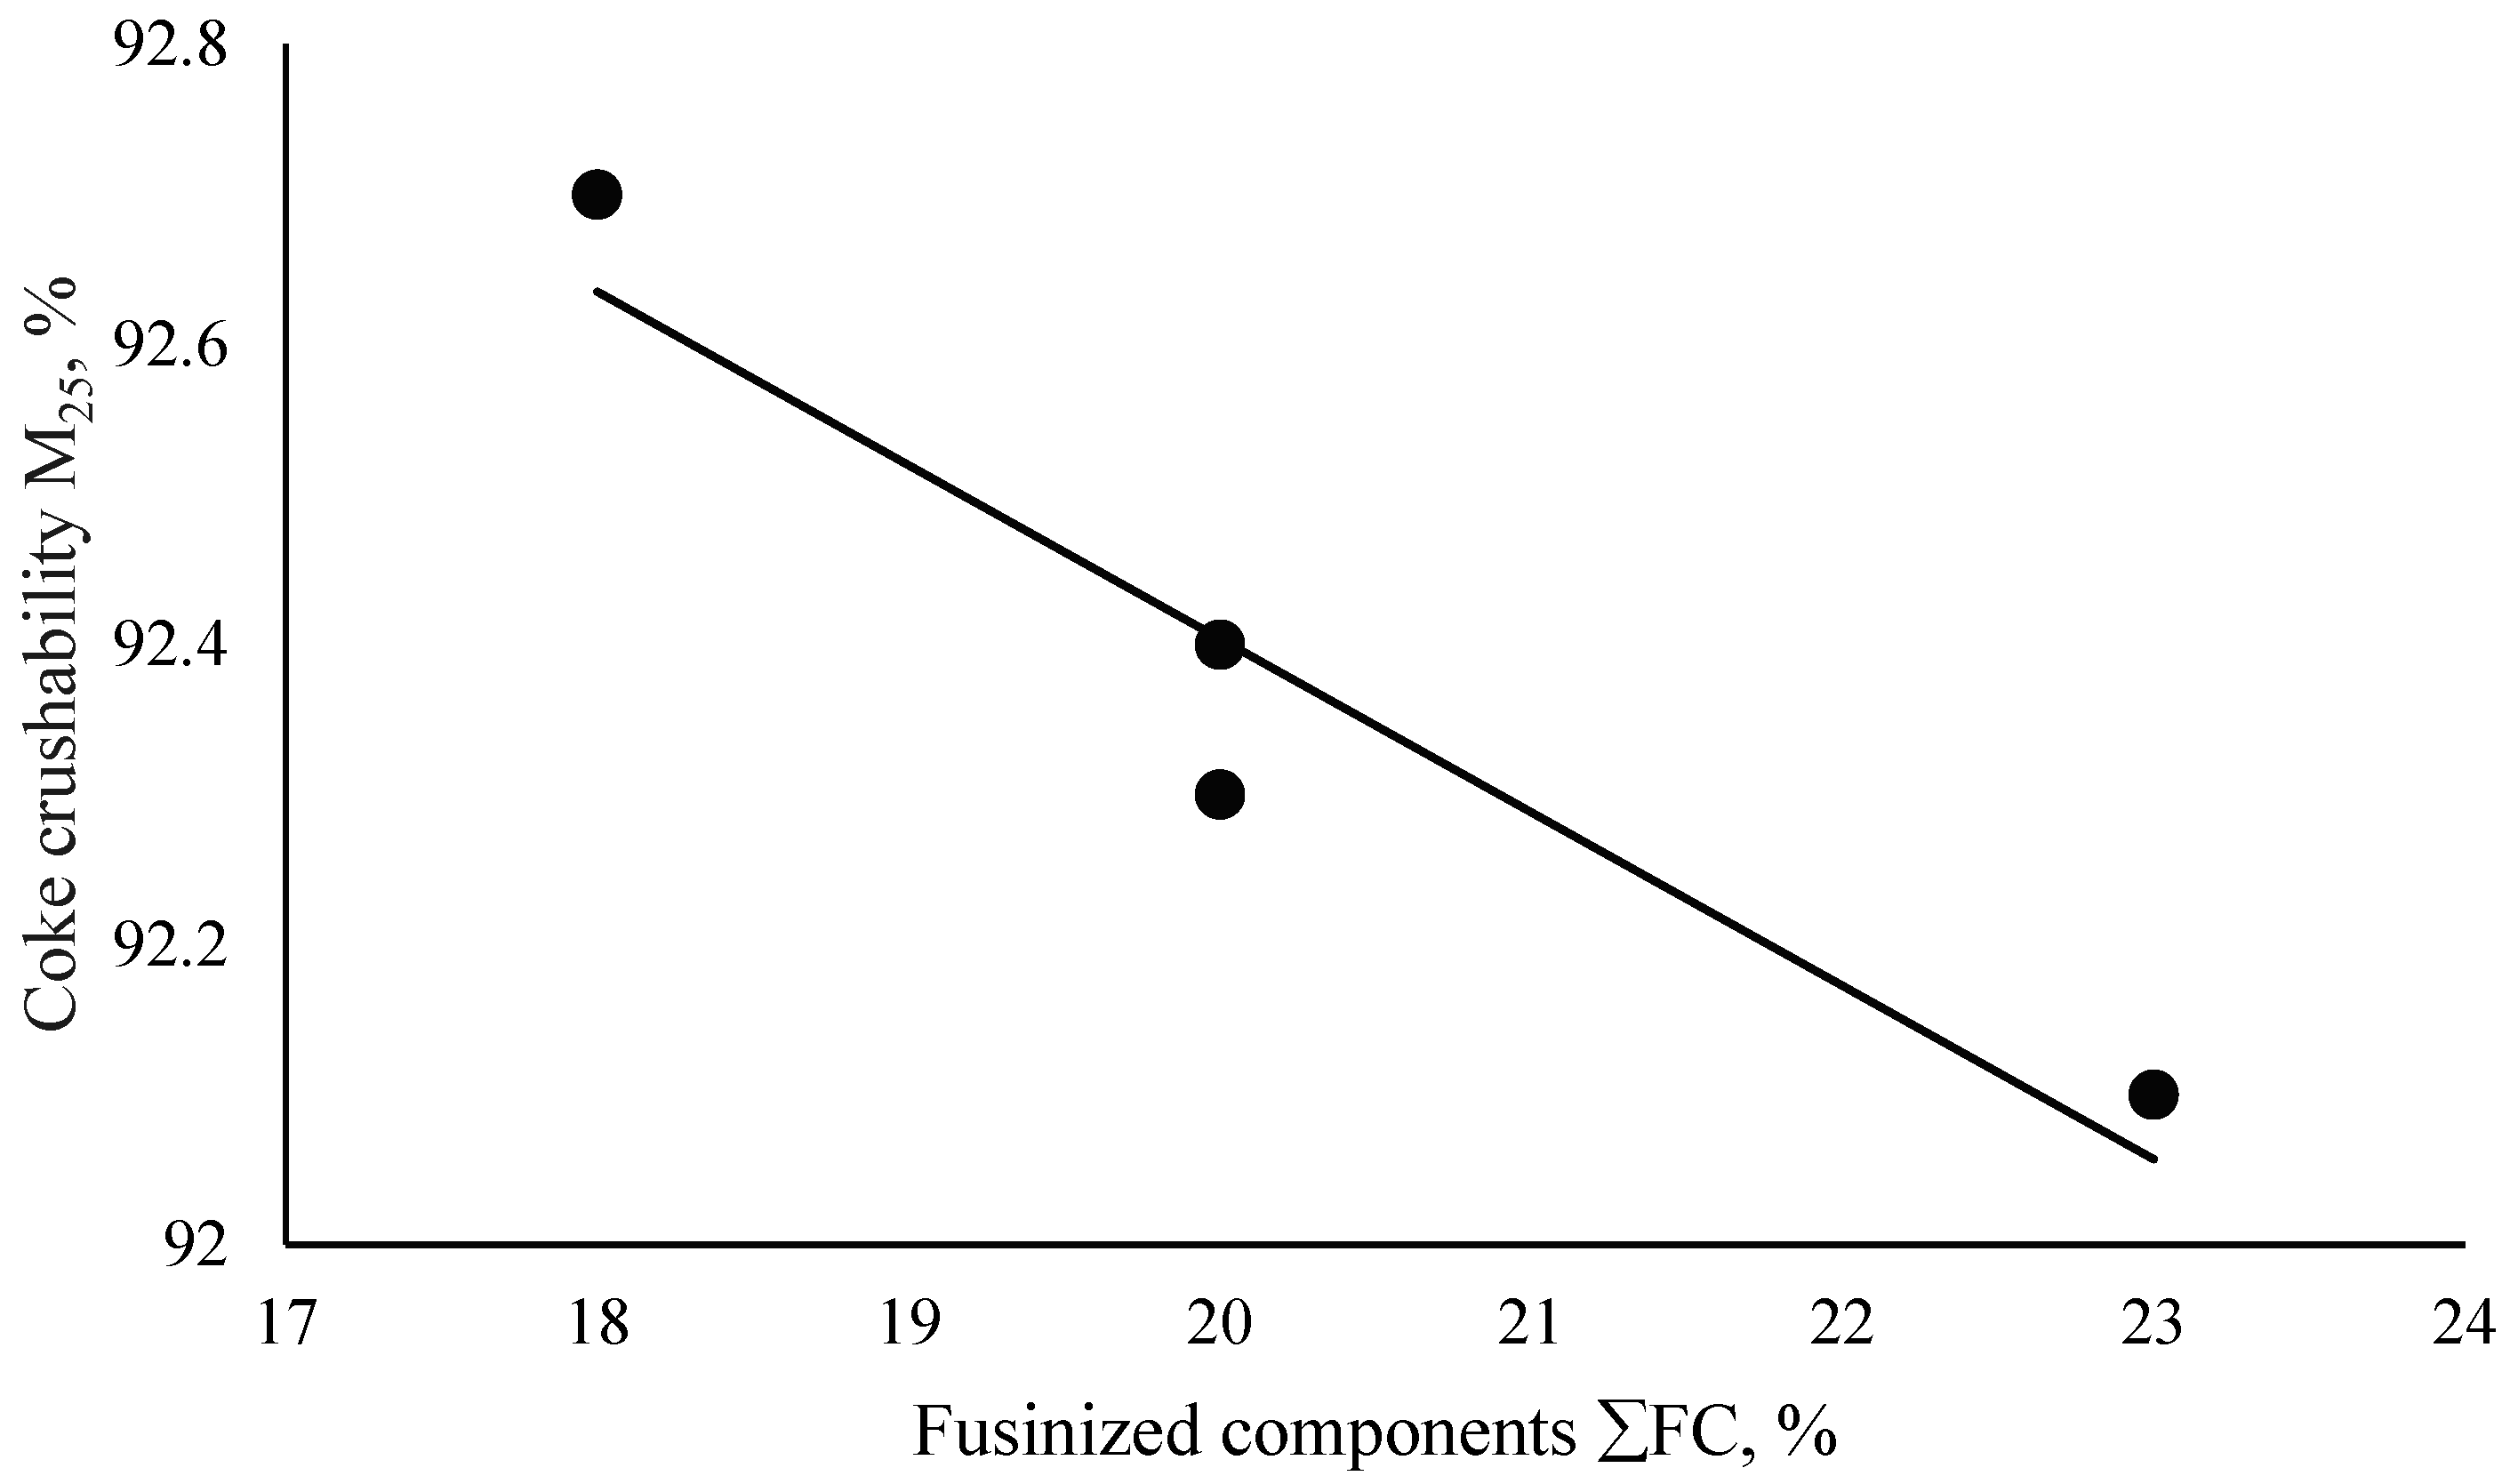
The influence of coal raw material properties on the quality characteristics of coke is illustrated by the graphical dependencies represented in Figure 2, Figure 3, Figure 4, Figure 5 and Figure 6.
The equations describing the obtained graphical dependences are given in Table 14.
Specific resistivity is a measure of the temperature effect during the process of thermal destruction of coal and coke conversion. Under the influence of temperature, structural changes in the organic matrix of coal transform its physical properties and therefore its electrical resistivity [44]. Depending on the final temperature of the process, the specific electrical resistivity decreases as the temperature increases. Since determining electrical resistivity is simpler, does not require reagents, and takes significantly less time than measuring reactivity, it can be considered an operational method for determining coke’s structural characteristics and readiness [45,46]. Therefore, the specific electrical resistance index can characterize the degree of coke readiness.
To ensure a rational temperature regime for coking petrologically heterogeneous interbasin coal batches, it is necessary to systematically control the coking temperature regime, increase the readiness of coke in the head zones of the coking chamber, and systematically control the completeness of loading. Heights and temperatures of the subbed space were measured. The study of coke structure is based on the analysis of coke carbon, the distribution of carbon atoms in hybrid states, and the degree of ordering, i.e., the ratio of ordered and disordered carbon. Coal exhibits dielectric properties [47], which is explained by the large number of σ-bonds formed by the carbon atom in the sp3 hybridization state. Under the influence of high temperatures in coking and deep cracking, macromolecules are practically deprived of side chains, leading to condensed polyaromatic structures containing carbon in sp hybridization. This improves the orderliness of the coke structure, bringing it closer to the structure of graphite, whose single crystals consist of a large number of parallel layers formed by hexagons of carbon atoms. In the interlayer space, π electrons form a unified electron cloud with sufficient mobility. This explains the high electrical conductivity of carbon materials. Thus, the resistivity value can control the degree of orderliness of the structure of carbonaceous materials.
It should also be noted that the organic carbon matrix consists of carbon atoms and other heteroatoms, such as hydrogen, oxygen, nitrogen, halogen, sulfur, phosphorus, etc. These atoms are bonded to the carbon edges and determine the chemical properties of the coal surface. The presence of oxygen functional groups (phenols, quinones, and carboxyl groups) on the surface significantly affects these materials’ reactivity, dispersibility, and electrical properties [48]. Surface chemistry affects carbon’s chemical behaviors in specific chemical reactions [49].
Thus, the readiness of the obtained coke is good, as indicated by the data on the yield of volatile substances, equal to 0.5–1.1%, and the specific electrical resistivity, which is in the range of 0.0547–0.0597 Om·cm. Increased readiness and orderliness of the coke structure lead to decreased electrical resistivity. Thus, an increase in coke strength after reaction (CSR) leads to a decrease in resistivity. A decrease in coke reactivity leads to a rise in electrical resistivity. The dependence of the specific resistivity of coke on its reactivity is illustrated by the graph in Figure 7, with a correlation coefficient of 0.83.
Indices of reactivity (CRI) and post-reaction strength (CSR) determined by the “Nippon Steel” method are the worst for coke from the base batch, and the best values are obtained for coke from batch variant 3. Coke from the batch of variants 1 and 2 is also better than coke from the basic batch, primarily because F coal, which has a high ash content of 12.8%, was removed from the composition of the experimental batch.
The analysis shows that the best values of M25 and M10 are coke from the batch of variants 2 and 3 containing G coal.
Transitioning to batch coking without H and F coals improves mechanical strength and CRI and CSR indicators. Quality indicators of metallurgical coke are enhanced due to the introduction of 10% G coal into the batch.
The effect of petrographic nonuniformity within coal batches on a specific coke property was studied by calculating each batch’s weighted Gibbs free energy of formation (ΔGf,total). This provides a single representative thermodynamic descriptor of the batch’s tendency to undergo structural transformation during coking:
Δ G f , total   =   i n % i 100 × Δ G f , i
where %i is the percentage of maceral group i, and ΔGf,i is the Gibbs free energy of formation for maceral type i.
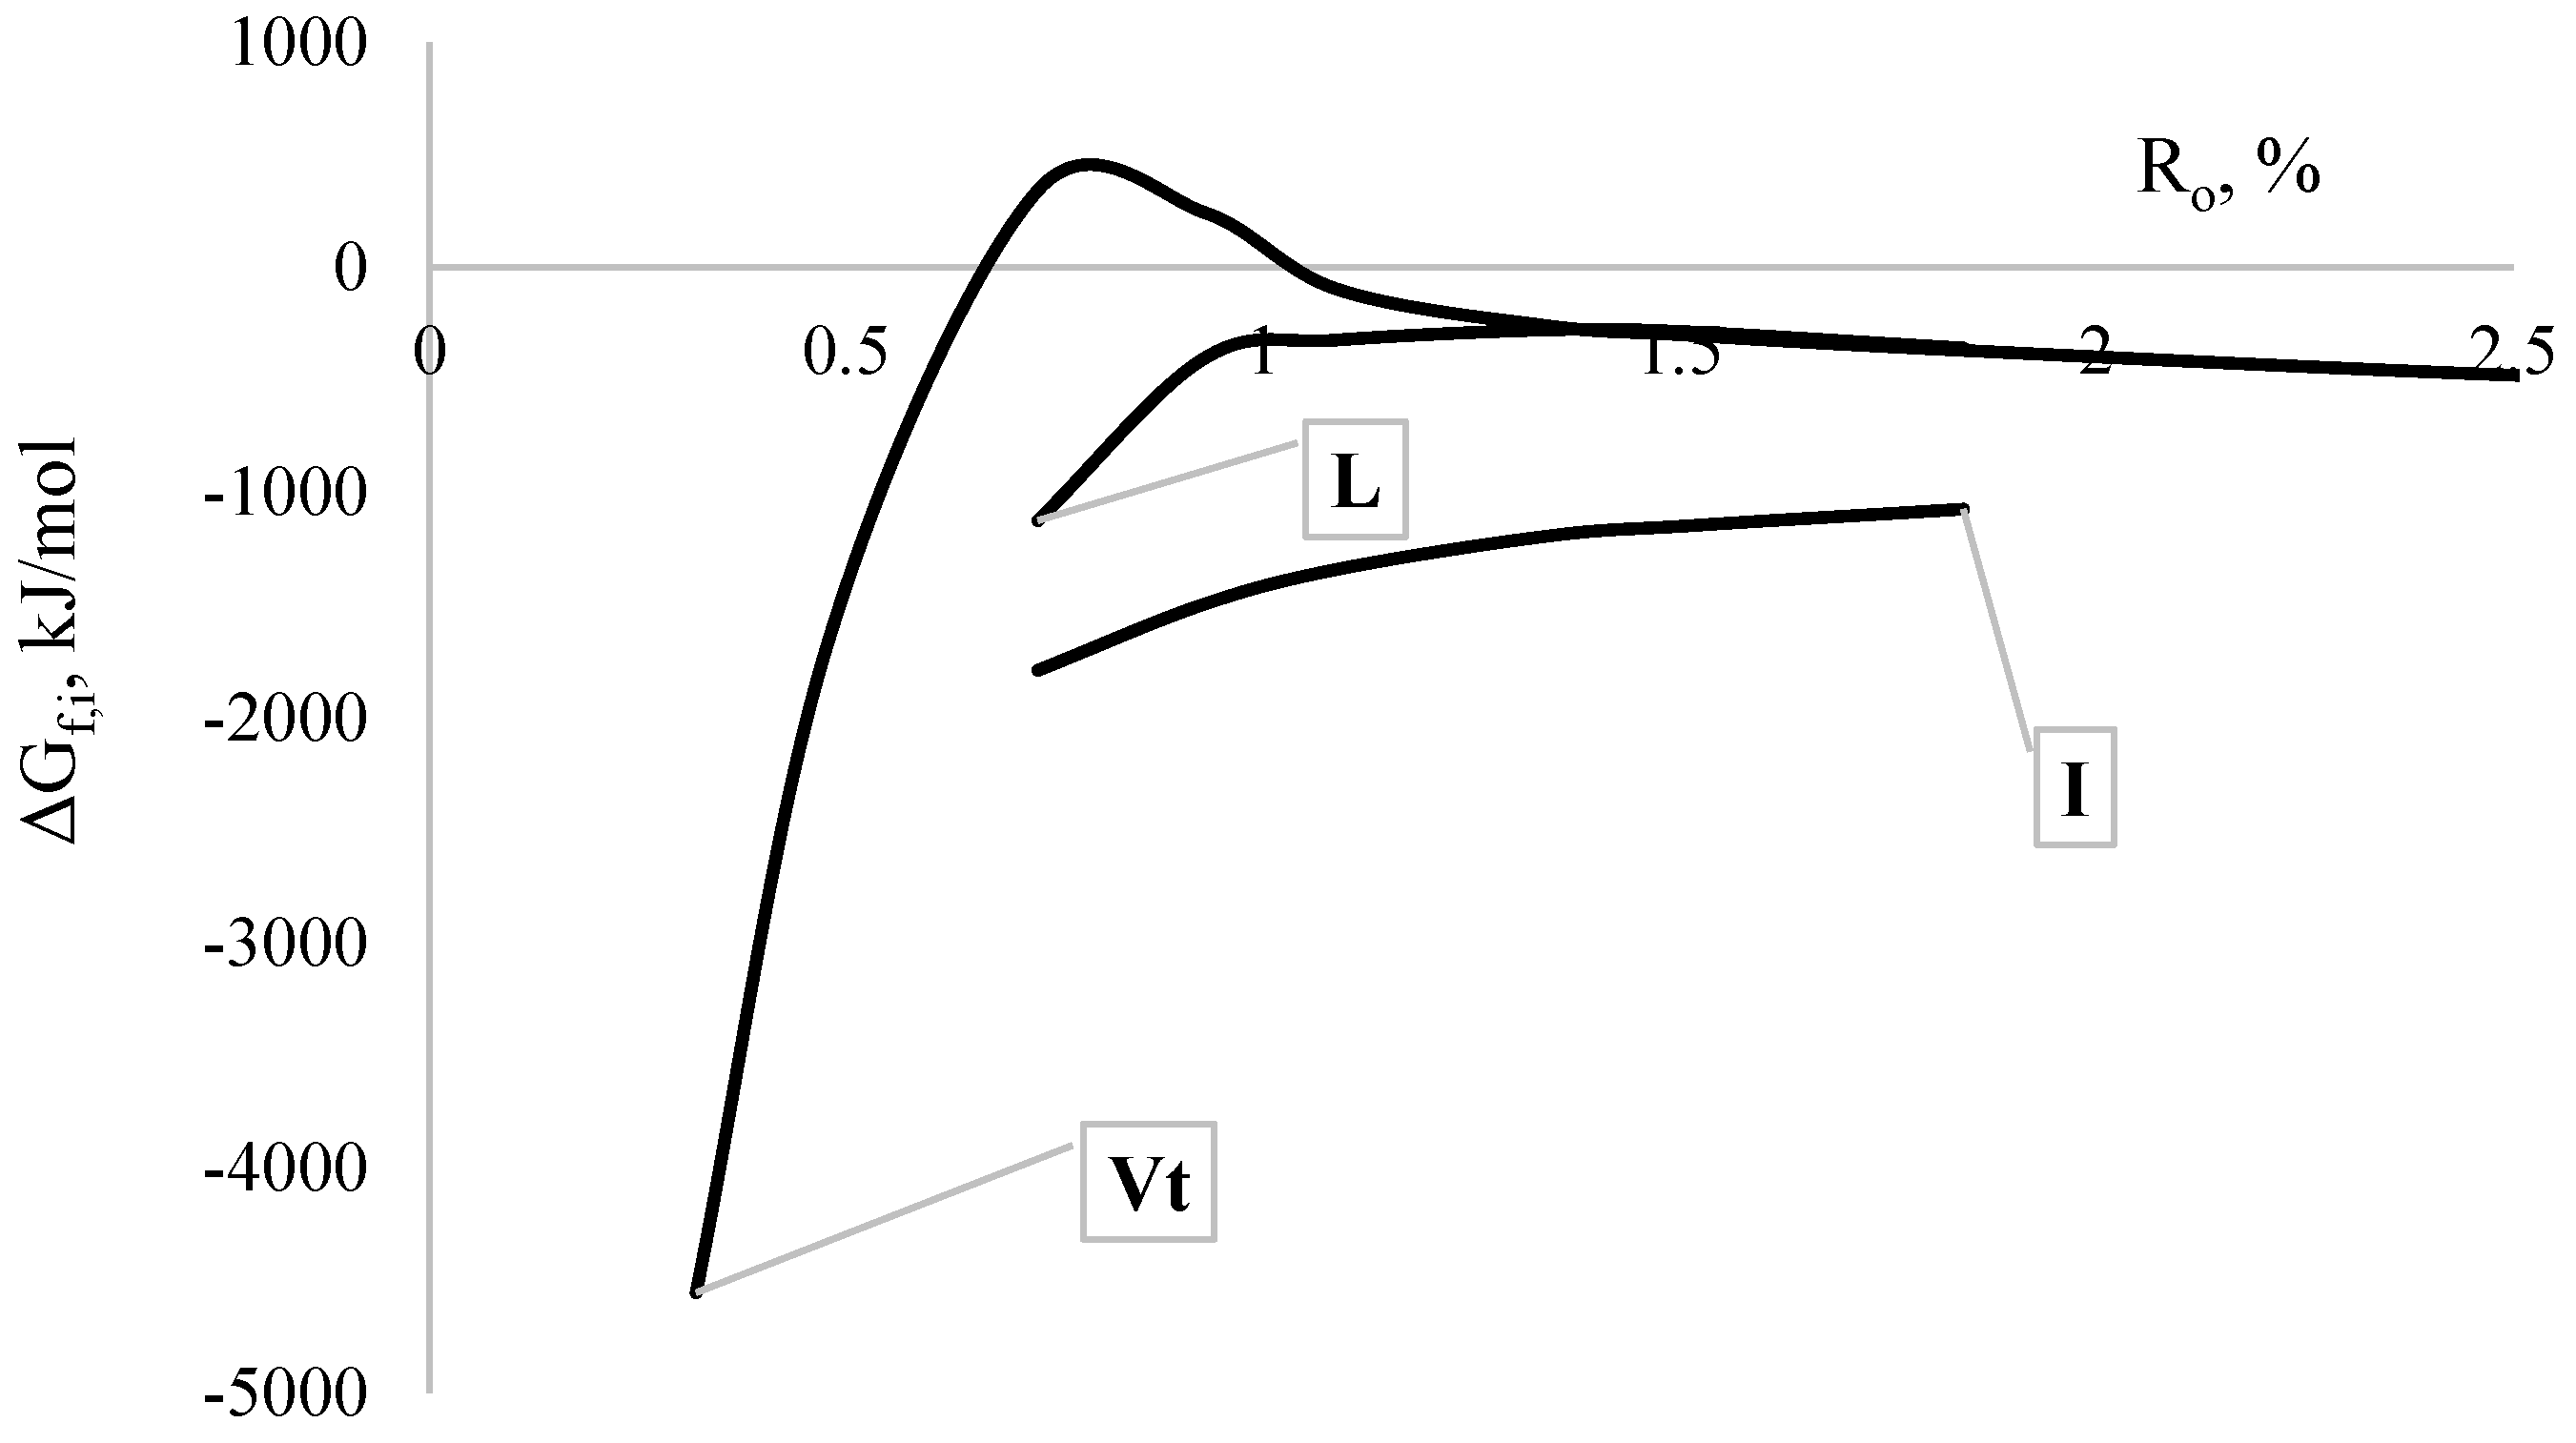
The thermodynamic parameters for the coal macerals were taken from [50]; these values are also visualized in Figure 8, where ΔGf,i is presented as a function of the mean reflection coefficient (Ro). Results of the calculations are presented in Table 15.
The table presents a comparative analysis of four coal batches using the calculated total Gibbs free energy of formation (ΔGf,total) based on the weighted contributions of their maceral groups (vitrinite, semivitrinite, inertinite, and liptinite).
Batches with more negative ΔGf,total (e.g., the base batch and batch 2) exhibit a higher thermodynamic driving force for carbon structure ordering during coking. Batch 1, which has the least negative ΔGf,total, is thermodynamically the least favorable for this transformation.
Analysis indicates that the coke reactivity index (CRI) decreases as ΔGf,total becomes more negative. This suggests that cokes produced from thermodynamically more favorable batches (more negative ΔGf,total) are less reactive, likely due to higher structural ordering and lower microporosity.
Conversely, the coke strength after reaction (CSR) increases with more negative ΔGf, total, reinforcing the link between thermodynamic favorability and the mechanical integrity of the resulting coke. These correlations support using ΔGf,total, as a predictive thermodynamic parameter for optimizing coal batch selection and anticipating coke performance.
The values of ΔGf,i were empirically derived from experimental assessments of maceral-specific thermodynamic behavior based on elemental composition and calorimetric data. Accordingly, ΔGf,total functions as an integrated descriptor of the maceral composition, directly influencing plasticity development, mesophase formation, and the eventual structural ordering of carbon. The proposed Gibbs energy index for the coal charge accounts not only for the relative content of maceral groups but also for their degree of metamorphism, as indicated by the vitrinite reflectance.
This index is reproducible within the known uncertainty limits of petrographic analysis. Since ΔGf,total is calculated from quantitatively determined maceral proportions (%i) and fixed ΔGf,i values are assigned to each maceral type, and it can be reliably recalculated for any coal blend with available petrographic data.
Thus, ΔGf,total provides a thermodynamically grounded basis for comparing coal blends. Its value lies in bridging petrographic heterogeneity with the inherent thermodynamic propensity for structural ordering, offering a complementary indicator to traditional assessments of coking performance.
The uniqueness and practical value of introducing the thermodynamic index (ΔGf,total) lie in considering the contents of vitrinite and inertinite and incorporating reflection coefficients for all macerals. This approach allows the estimation of the overall thermodynamic stability of a coal blend using a single integral value.

4. Conclusions

The coke quality for blast furnace smelting largely depends on the properties of coal raw materials and the efficiency of their preparation. Coking coal has been and remains a critically crucial raw material resource of strategic importance for industry functioning and economic development in many countries. Ensuring the economic efficiency and effectiveness of coke production in the conditions of a multi-basin raw material base for coking requires optimizing the component composition of coal batches and improving the primary technological preparation methods considering its petrographic characteristics.
This work used standardized methods for studying coal and coal batches’ technological and plastic–viscous properties. The qualitative characteristics of coke were determined using physical–mechanical and thermochemical methods of studying standardized indicators: crushability (M25), abrasion (M10), reactivity (CRI), post-reaction strength (CSR), and specific electrical resistance (ρ). Statistical analysis of the results and analysis of the influence of raw material factors on the mechanical and thermochemical properties of coke were performed using the licensed Microsoft Excel computer program.
Based on the results of experimental industrial coking of scientifically based batch compositions developed with the presence of imported coal, two variants of coal batches where the coke had the best quality indicators were proposed. The quality indicators of metallurgical coke were improved by adding 10% G coal to the batch. Thus, according to the M25 crushability indicator, the mechanical strength increased by 0.6%, and the M10 abrasion decreased by 0.4%. Significant improvements in thermochemical properties and an increase in the orderliness of the carbon structure were recorded: the CRI reactivity decreased by 3.1%, the CSR post-reaction strength increased by 8.3%, and the specific resistance decreased by 8.4%.
The inverse relationship of ΔGf,total with CRI and its direct relationship with CSR validate its use as a thermodynamic predictor for selecting coal batches that yield less reactive, stronger coke.
The next stage of research involves accumulating a large amount of experimental data and developing general recommendations for coke plants in conditions of deteriorating coking raw material base and irregular supply of coal concentrates, focusing on optimizing the component composition and determining the optimal degree of crushing while taking into account the petrographic composition and sinterability of the batches.

Author Contributions

Conceptualization, D.M. and K.S.; methodology, D.M., M.K. and L.B.; investigation, D.M., K.S., N.M., S.N. and M.M.; data curation, D.M. and K.S.; writing—original draft preparation, K.S., M.K., L.B. and M.M.; writing—review and editing, M.K., N.M., L.B., S.N. and M.S.; visualization, M.S. and D.M.; supervision, D.M.; project administration. D.M. All authors have read and agreed to the published version of the manuscript.

Funding

This research received no external funding.

Data Availability Statement

The data presented in this study are available on request from the corresponding author.

Conflicts of Interest

Author Natalya Mukina was employed by the company ArcelorMittal Krivoy Rog. Author Natalya Mukina declares that the research was conducted without any commercial or financial relationships that could be construed as a potential conflict of interest. The remaining authors declare no conflicts of interest.

References

  1. Suárez-Ruiz, I.; Crelling, J.C. Applied Coal Petrology. The Role of Petrology in Coal Utilization; Elsevier: Amsterdam, The Netherlands, 2018; 388p. [Google Scholar]
  2. December 2022 Crude Steel Production and 2022 Global Crude Steel Production Totals. World Steel Association. Available online: https://worldsteel.org/media-centre/press-releases/2023/december-2022-crude-steel-production-and-2022-global-totals/ (accessed on 31 January 2023).
  3. Metallurgical Coke Global Market Report 2023. Available online: https://www.researchandmarkets.com/report/metallurgical-coke (accessed on 2 August 2023).
  4. Kovalyov, E.T.; Vasiliev, Y.S.; Kuznichenko, V.M.; Krivonis, V.V.; Danilov, A.B.; Solovyov, M.A. Theory and practice of production of high-quality blast furnace coke from rammed charges of reduced spiciness. J. Coal Chem. 2009, 3–4, 24–30. [Google Scholar]
  5. Gordienko, A.I.; Redin, V.A.; Dolgarev, G.V.; Chalenko, V.I.; Wegera, I.M. Experience in the development and operation of the experimental and industrial plant for thermal preparation of the charge at OJSC “Yasiniv Coke Chemical Plant”. J. Coal Chem. 2008, 5–6, 22–25. [Google Scholar]
  6. Chernyshov, Y.A.; Ovchinnikova, S.A.; Podlubny, A.V. The use of petrographic characteristics and new complex indicators to evaluate the properties of coal and interbasin charges of Zaporizhkoks JSC. J. Coal Chem. 2009, 1–2, 12–20. [Google Scholar]
  7. National Standard of Ukraine 3472-2015; Lignite, Stone and Anthracite Coal. Classification. Derzhspozhivstandard of Ukraine: Kyiv, Ukraine, 2015.
  8. Miroshnichenko, D.; Shmeltser, K.; Kormer, M. Factors affecting the formation the carbon structure of coke and the method of stabilizing its physical and medical properties. C-J. Carbon Res. 2023, 9, 66. [Google Scholar] [CrossRef]
  9. North, L.; Blackmore, K.; Nesbitt, K.; Mahoney, M.R. Models of coke quality prediction and the relationships to input variables: A review. Fuel 2018, 219, 426–445. [Google Scholar] [CrossRef]
  10. Gupta, S.; Shen, F.; Lee, W.J.; O’Brien, G. Improving coke strength prediction using automated coal petrography. Fuel 2012, 94, 368–373. [Google Scholar] [CrossRef]
  11. Dash, P.S.; Guha, M.; Chakraborty, D.; Banerjee, P.K. Prediction of coke CSR from coal blend characteristics using various techniques: A comparative evaluation. Int. J. Coal Prep. Util. 2012, 32, 92–169. [Google Scholar] [CrossRef]
  12. Miroshnichenko, D.; Ulanovskij, M. Reactivity of coke: Methods of measuring and influence factors. Coke Chem. 2004, 5, 21–31. [Google Scholar]
  13. Gupta, A.; Das, A.K.; Chauhan, G.I.S. A coal-blending model: A tool for better coal blend preparation. Coal Prep. 2007, 27, 28–38. [Google Scholar] [CrossRef]
  14. Nag, D.; Haldar, S.K.; Choudhary, P.K.; Banerjee, P.K. Prediction of coke CSR from ash chemistry of coal blend. Int. J. Coal Prep. Util. 2009, 29, 243–250. [Google Scholar] [CrossRef]
  15. Todoschuk, T.W.; Price, J.; Gransden, J. Development of coke strength after reaction (CSR) at Dofasco. Iron Steel Technol. 2004, 1, 73–84. [Google Scholar]
  16. Wang, Q.; Guo, R.; Zhao, X.-F.; Sun, J.-F.; Zhang, S.; Liu, W.-Z. A new testing and evaluating method of cokes with greatly varied CRI and CSR. Fuel 2016, 182, 879–885. [Google Scholar] [CrossRef]
  17. Jordan, P. Characterising Coals for Coke Production and Assessing Coke: Predicting Coke Quality Based on Coal Petrography, Rheology and Coke Petrography. Master’s Thesis, Faculty of Engineering and the Built Environment, University of Witwatersrand, Johannesburg, South Africa, 2008; p. 121. [Google Scholar]
  18. Pusz, S.; Buszko, R. Reflectance parameters of cokes in relation to their reactivity index (CRI) and the strength after reaction (CSR), from coals of the Upper Silesian Coal Basin, Poland. Int. J. Coal Geol. 2012, 90–91, 43–49. [Google Scholar] [CrossRef]
  19. Bulanov, E.A.; Krutenkov, V.G.; Shilyakov, A.V. Predicting the postreactive strength (CSR) and reactivity (CRI) of dry-slaked metallurgical coke on the basis of Audibert-Arnu dilatometry. Coke Chem. 2009, 52, 404–407. [Google Scholar] [CrossRef]
  20. Dash, P.S.; Guha, M.; Chakraborty, D.; Krishnan, S.; Banerjee, P. Application of various techniques for predicting coke CSR from coal blend properties through laboratory scale experiments. Tata Search 2005, 1, 89–100. [Google Scholar]
  21. Kumar, A.; Saxena, V.; Varma, A.; Tiwari, H.; Kumar, A. Effect of dilatation of coal blend on push force and coke quality in stamp charge coke making process. Int. J. Eng. Sci. Res. Technol. 2015, 4, 638–644. [Google Scholar]
  22. Wang, W.; Fan, G.; Cheng, T. Study on prediction model for coke property under hot state. Fuel Chem. Process. 2009, 1, 002. (In Chinese) [Google Scholar]
  23. Xie, H.-S.; Liu, Y.-X.; Lu, Q.; Meng, J.-B. Coke quality prediction models. J. Northeast. Univ. Nat. Sci. 2007, 28, 373. (In Chinese) [Google Scholar]
  24. Jee, K.E. The Effect of Coal Properties on Carbonization Behaviour and Strength of Coke Blends. Master’s Thesis, School of Materials & Science Engineering, Science Engineering, Faculty of Science, The University of New South Wales, New South Wales, Australia, 2012; p. 151. [Google Scholar]
  25. De Córdova, M.; Madias, J.; Barreiro, J. Review of modeling of coal blends for prediction of coke. In Proceedings of the Contriuciao Tecnica ao 46 Seminario de Reducao de Minerio de Ferro e Materias-Primas, Rio de Janeiro, Brasil, 26–30 September 2016. [Google Scholar]
  26. Tiwari, H.P.; Banerjee, P.K.; Saxena, V.K. A novel technique for assessing the coking potential of coals/coal blends for non-recovery coke making process. Fuel 2013, 107, 615–622. [Google Scholar] [CrossRef]
  27. State Standard of Ukraine 4096-2002; Brown Coal, Hard Coal, Anthracite, Combustible Shale and Coal Briquettes. Methods of Sample Selection and Preparation for Laboratory Tests. Technical Committee of Ukraine on Standardization TK-92: Kyiv, Ukraine, 2002.
  28. ISO 1171-97; Solid Mineral Fuels. Methods for Determination of Ash. International Organization for Standardization: Geneva, Switzerland, 1997.
  29. ISO 589-81; Hard Coal—Determination of Total Moisture. International Organization for Standardization: Geneva, Switzerland, 1981.
  30. ISO 562:2024; Hard Coal and Coke—Determination of Volatile Matter. International Organization for Standardization: Geneva, Switzerland, 2024; Technical Committee ISO/TC 27/SC 5 ICS: 73.040 75.160.10.
  31. ISO 334:2020; Coal and Coke. Determination of Total Sulfur. Eschka Method. International Organization for Standardization: Geneva, Switzerland, 2020.
  32. ISO 7404-3-84; Methods for the Petrographic Analysis of Bituminous Coal and Anthracite—Part 3: Method of Determining Maceral Group Composition. International Organization for Standardization: Geneva, Switzerland, 1984.
  33. ISO 7404-5-85; Methods for the Petrographic Analysis of Coal—Part 5: Method of Determining Microscopically the Reflectance of Vitrinite. International Organization for Standardization: Geneva, Switzerland, 1985.
  34. State Standard of Ukraine 7722:2015; Hard Coal. Method of Determining Plastometric Characteristics. State Enterprise “Ukrainian Scientific Research and Training Center for Problems of Standardization, Certification and Quality”: Kyiv, Ukraine, 2015.
  35. State Standard of Ukraine 7723:2015; Coal. Determination of the Sintering Index by the Rog Method. State Enterprise “Ukrainian Scientific Research and Training Center for Problems of Standardization, Certification and Quality”: Kyiv, Ukraine, 2015.
  36. ISO-FDIS 103 29; Coal—Determination of Plastic Properties—Constant-Torque Gieseler Plastometer Method. International Organization for Standardization: Geneva, Switzerland, 2017; Technical Committee ISO/TC 27/SC 5 ICS:73.040.
  37. ISO 349:2020; Hard Coal—Audibert-Arnu Dilatometer Test. International Organization for Standardization: Geneva, Switzerland, 2020; Technical Committee ISO/TC 27/SC 5 ICS:73.040.
  38. ISO 501:2025; Hard Coal. Method for Determining the Free Swelling Index. International Organization for Standardization: Geneva, Switzerland, 2025; Technical Committee ISO/TC 27/SC 5ICS: 73.040 75.160.10.
  39. ISO 502:2025; Hard Coal—Determination of Caking Power—Gray-King Coke Test. International Organization for Standardization: Geneva, Switzerland, 2025; Technical Committee ISO/TC 27/SC 5 ICS:73.040.
  40. ISO 556-80; Coke (Greater than 20 mm in Size)-Determination of Mechanical Strength. International Organization for Standardization: Geneva, Switzerland, 1980.
  41. ISO 18894:2006; Coke-Determination of Coke Reactivity Index (CRI) and Coke Strength After Reaction (CSR). International Organization for Standardization: Geneva, Switzerland, 2006.
  42. State Standard of Ukraine 8831:2019; Coke. Method for Determining the Resistivity of Coal Coke Powder. UkrNDNC SE: Kyiv, Ukraine, 2019.
  43. Lyalyuk, V.P.; Kassim, D.A.; Shmeltser, E.O.; Lyakhova, I.A. Improving the technology of preparing coal for the production of blast-Furnace coke under the conditions of multi-basin raw material base. Message 2. Optimizing the degree of crushing by means of petrographic characteristics of the batch. Pet. Coal 2019, 61, 94–99. [Google Scholar]
  44. Miroshnichenko, D.; Shmeltser, K.; Kormer, M.; Sahalai, D.; Pyshyev, S.; Kukhar, O.; Korchak, B.; Chervinskyy, T. Influence of Raw Materials and Technological Factors on the Sorption Properties of Blast-Fuel Coke. ChemEngineering 2024, 8, 30. [Google Scholar] [CrossRef]
  45. Miroshnichenko, D.; Shmeltser, K.; Kormer, M.; Soloviov, Y.; Pyshyev, S.; Korchak, B.; Shved, M.; Prysiazhnyi, Y. Electrical Resistance as an Aggregate Characteristic of Coke Properties for Electrochemical and Coke Production. Electrochem 2024, 5, 258–273. [Google Scholar] [CrossRef]
  46. Lyalyuk, V.P.; Sokolova, V.P.; Lyakhova, I.A.; Kassim, D.A.; Shmeltser, E.O.; Miroshnichenko, D.V. The using of coal blends with an increased content of coals of the middle stage of metamorphism for the production of the blastfurnace coke. Message 2. Assessment of coke quality. Pet. Coal 2019, 61, 52–57. [Google Scholar]
  47. Saranchuk, V.I.; Oshovsky, V.V.; Lavrenko, A.T.; Koshkarev, Y.M. Method for determining the value of electrical resistance of coal depending on temperature. Sci. J. DonNTU Chem. Chem. Technol. 2013, 134, 138–143. [Google Scholar]
  48. Dang, Y.; Liu, Y.; Xiang, P.; Tan, Z.; Tian, Z.; Greiner, M.; Heumann, S.; Ding, Y.; Qiao, Z.A. Carbon Surface Chemistry: Benchmark for the Analysis of Oxygen Functionalities on Carbon Materials. Adv. Mater. 2025, 37, 2418239. [Google Scholar] [CrossRef] [PubMed]
  49. Ding, Y.; Qiao, Z.A. Carbon Surface Chemistry: New Insight into the Old Story. Adv. Mater. 2022, 34, 2206025. [Google Scholar] [CrossRef] [PubMed]
  50. Gagarin, S.G. Thermodynamic parameters of coal macerals. Coke Chem. 2008, 51, 163–170. [Google Scholar] [CrossRef]
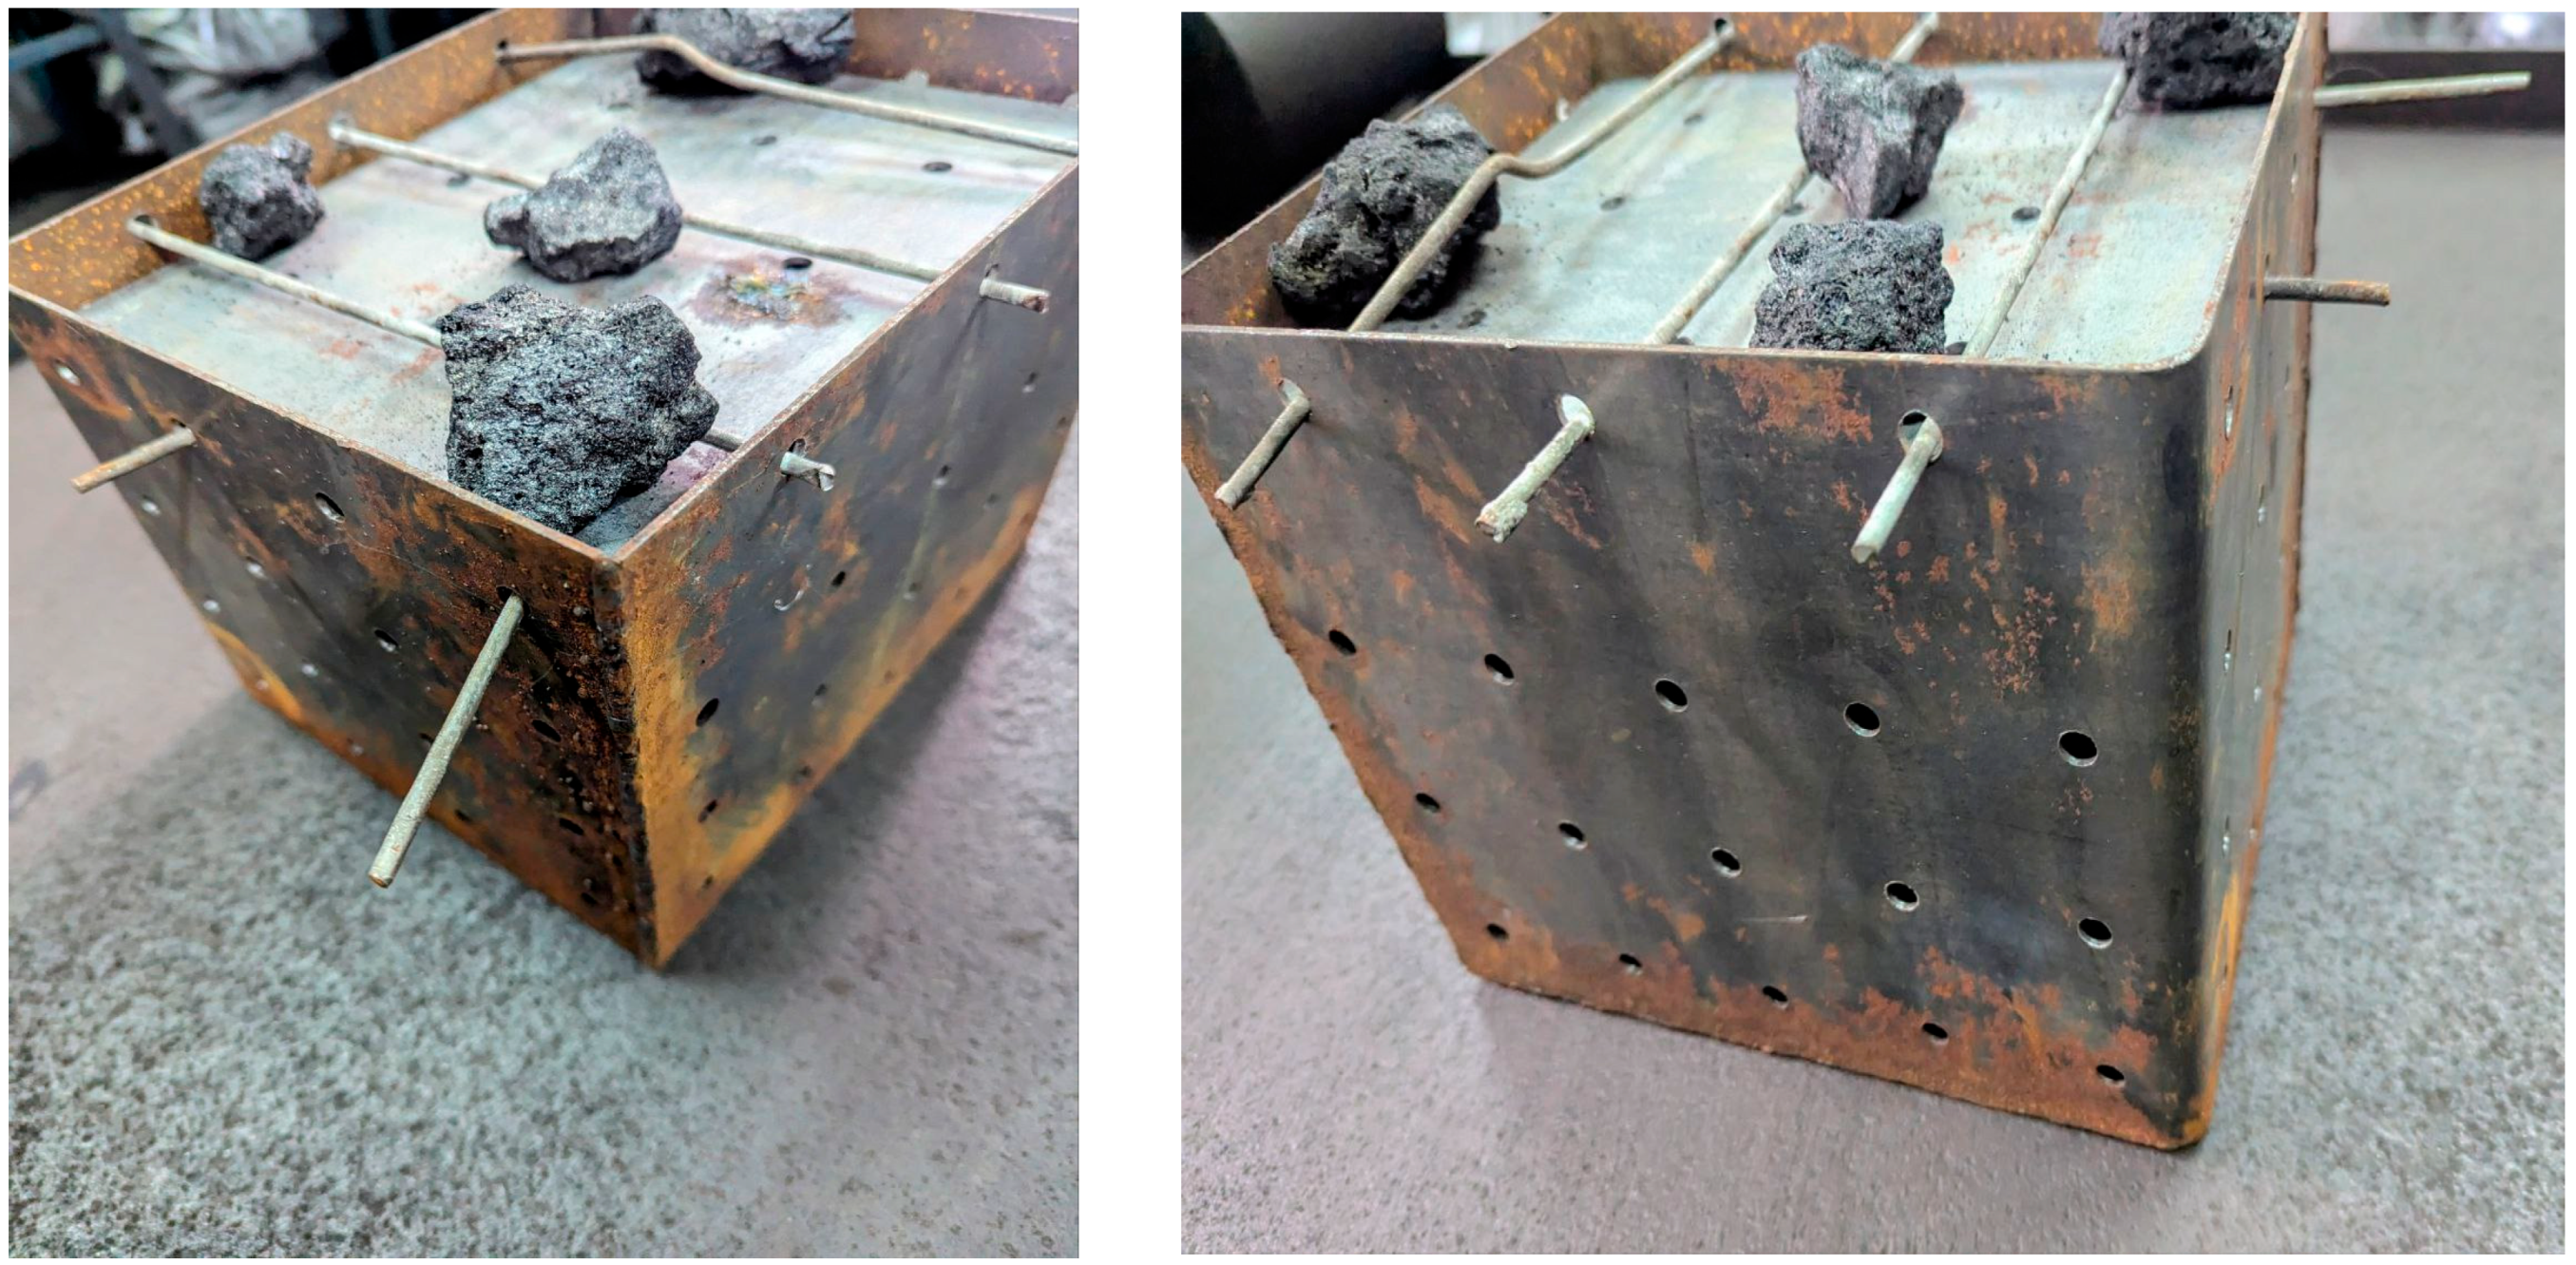
Figure 1. Metal boxes for coking of pilot batches.
Carbon 11 00069 g001
Figure 2. Dependence of the coke reactivity index and the content of fusinized components.
Carbon 11 00069 g002
Figure 3. Dependence of the coke strength after reaction and the content of fusinized components.
Carbon 11 00069 g003
Figure 4. Dependence of the coke reactivity index and the content of vitrinite.
Carbon 11 00069 g004
Figure 5. Dependence of the coke strength after reaction and the content of vitrinite.
Carbon 11 00069 g005
Figure 6. Dependence of the coke crushability M25 and the content of fusinized components.
Carbon 11 00069 g006
Figure 7. Dependence of the coke electrical resistivity and coke reactivity index.
Carbon 11 00069 g007
Figure 8. Gibbs free energy of coal macerals as a function of mean reflection coefficient (plotted using data from [50]).
Carbon 11 00069 g008
Table 1. CSR prediction models and the variables they consider.
Company
/Research Institute/
Researchers
Variable Characteristics of Coal
Petrographic CharacteristicsRheological Properties of Coal in the Plastic StateCharacteristics of the Inorganic PartOthers
British SteelVitrinite reflectance Coke ash
Nippon SteelInertinite content, %, vitrinite reflectanceMaximum fluidityAsh basicity index
BCRAInertinite content, %Maximum fluidityContent of basic oxides in coalCarbon and oxygen content in coal, coke, and porosity
Kobe SteelVitrinite reflectanceMaximum fluidityAsh basicity
BHPContent of inert componentsMaximum fluidityCoal ash basicityYield of volatile matter
Inland Steel The temperature of transition of coal into a plastic stateAsh basicity indexSulfur content in coal
ISCORVitrinite reflectance, content of fusite componentsMaximum fluidityContent of basic oxides in coal ash
Tata SteelVitrinite reflectance, the ratio between cohesive and inert macerals, reflectogram of the vitrinite componentMaximum fluidity, free swelling indexAsh, SiO2/Al2O3 ratio, alkali indexComposite coking potential (CCP), type of coke residue according to the Gray–King method
Table 2. Methods used to characterize materials.
MaterialsIndicatorMethods
Characteristics of coal raw materials
(coals, batches)
AdISO 1171-97 “Solid mineral fuels. Methods for the determination of ash” [28]
WaISO 589-81 “Hard coal—Determination of total moisture” [29]
Vd, VdafISO 562:2024 “Hard coal and coke—Determination of volatile matter “[30]
SdtISO 334:2020; Coal and Coke. Determination of Total Sulfur. Eschka Method[31]
Ro, Vt, L, Sv, IISO 7404-3-84 “Methods for the petrographic analysis of bituminous coal and anthracite—Part 3: Method of determining maceral group composition”; ISO 7404-5-85 “Methods for the petrographic analysis of coals—Part 5: Method of determining microscopically the reflectance of vitrinite”[32,33]
X, YState standard of Ukraine 7722:2015 “Hard coal. Method of Determining Plastometric Characteristics” [34]
RIState standard of Ukraine 7723:2015 Coal. Determination of the sintering index by the Rog method[35]
Fmax, t1, t2, ΔtISO-FDIS 10329 Coal—Determination of plastic properties—Constant-torque Gieseler plastometer method
[36]
tI, tII, tIII,
a, b
ISO 349:2020 Hard coal—Audibert–Arnu dilatometer test [37]
FSIISO 501:2012 Hard coal. Method for determining the free swelling index [38]
GISO 502:2025 Hard coal—Determination of caking power—Gray–King coke test [39]
Characteristics of cokeM25 M10ISO 556-80 “Coke (greater than 20 mm in size)—Determination of mechanical strength” [40]
CRI
CSR
SO 18894:2006 “Coke—Determination of coke reactivity index (CRI) and coke strength after reaction (CSR)” [41]
ρState standard of Ukraine 8831:2019 Coke. Method for the determination of the resistivity of coal coke powder[42]
Table 3. Coking conditions for coal batches.
Coking Period, HoursTemperatures in the Control Verticals, °CCoke Cake Axis Temperature, °C
Machine SideCoke Side
15.5132013501100
Table 4. Technological properties of coal samples and batch.
SampleRank of Coal
DSTU
3472-2015
Proximate Analysis, %Plastometric
Parameters, mm
AdSdtVdVdafXY
AG9.4 ± 0.20.32 ± 0.0537.3 ± 0.341.2 ± 0.335 ± 314 ± 1
B (coal USA)Zh6.9 ± 0.21.03 ± 0.0530.8 ± 0.333.1 ± 0.317 ± 320 ± 1
CZh9.1 ± 0.20.54 ± 0.0529.8 ± 0.332.7 ± 0.331 ± 319 ± 1
DK/KO/KZh12.2 ± 0.20.67 ± 0.0521.5 ± 0.324.5 ± 0.328 ± 315 ± 1
EK8.8 ± 0.20.72 ± 0.0526.6 ± 0.329.2 ± 0.317 ± 312 ± 1
FK12.8 ± 0.21.75 ± 0.0524.0 ± 0.327.5 ± 0.336 ± 314 ± 1
GPS9.9 ± 0.20.40 ± 0.0519.0 ± 0.321.1 ± 0.316 ± 311 ± 1
HK8.6 ± 0.20.41 ± 0.0518.2 ± 0.320.0 ± 0.325 ± 311 ± 1
Base batch-10.4 ± 0.20.83 ± 0.0526.5 ± 0.329.6 ± 0.334 ± 313 ± 1
Table 5. Petrographic characteristics of the samples studied.
SamplePetrographic Composition
(Without Mineral Impurities), %
Mean Vitrinite
Reflection Coefficient, %
VtSvILΣ FCRo
A85 ± 4-12 ± 23 ± 2120.69 ± 0.02
B (coal USA)73 ± 5-22 ± 55 ± 2221.02 ± 0.02
C79 ± 5-20 ± 51 ± 2200.94 ± 0.02
D91 ± 4-8 ± 21 ± 281.06 ± 0.02
E89 ± 41 ± 28 ± 22 ± 291.31 ± 0.02
F76 ± 53 ± 221 ± 5-231.14 ± 0.02
G89 ± 41 ± 210 ± 2-111.53 ± 0.02
H38 ± 62 ± 260 ± 6-621.28 ± 0.02
Base batch74 ± 51 ± 222 ± 53 ± 2231.07 ± 0.02
Table 6. Characteristics of the plastic–viscous properties of the samples studied.
SampleRank of Coal
DSTU 3472-2015
Plastometric
Parameter, mm, Y мм/(Rog’s Index, Units)
Free Swelling IndexPlastic–Viscous
Properties According
to Gieseler
Dilation
According to
Odbert-Arnou, °C
Sintering
According to Gray–King, GK
Y/(RI)FSIt1,
°C
tmax, °Cth, °C∆t, °CFmax, ddpmt1tIItIIIa, %b, %
Coal USAZh20/806 1/2370435480110>280036041547529191G8
Batch-13/5853704304751056923804304602318G4
Table 7. Properties of production batch size classes.
BatchGranulometric Composition, %Proximate Analysis, %Sintering
According to Rog, Units
Class, mmYield,
%
WaAdVdVdafRI
>103.21.417.526.432.045
10–65.51.611.026.329.553
6–38.62.09.428.731.748
3–211.61.89.327.530.453
2–111.51.78.427.329.866
1–0.514.02.28.526.729.265
0.5–0.2513.02.08.127.529.965
<0.2532.62.112.825.028.656
Total batch (actual) 100.01.710.426.529.658
Total batch (calculated) 100.02.010.426.529.658
Fractional composition of the batch (class > 1 mm)
Fraction < 1400 kg/m3 78.72.16.429.331.360
Fraction > 1400 kg/m3 21.32.228.419.627.421
Table 8. Petrographic characteristics of production batch size classes.
Class, mmYield of Grain Size,
%
Petrographic Composition
(Without Mineral Impurities),
%
Mean Vitrinite Reflection Coefficient, %Stages of Vitrinite Metamorphism, %
0.50–0.66–0.90–1.20–1.40–1.70–2.60
0.650.891.191.391.692.59And More
Coal Ranks, Which Roughly Correspond to
The Stages of Vitrinite Metamorphism
VtSvILΣ FCRoDGGZhKPSTA
123456789101112131415
>10; 10–6; 6–317.3611344351.11425553445
3–2; 2–123.1701281291.08423586513
1–0.5; 0.5–0.25; <0.2559.6721252261.104146111631
Total batch (actual)100.0741233231.07420597522
Total batch (calculated)100.0731242241.10418598533
Fractional composition of the batch (class > 1 mm)
Fraction < 1400 kg/m3 78.779-183180.9883148643-
Fraction > 1400 kg/m321.3542395411.21216578746
Table 9. Component composition of the batches.
Component Composition of the Batches, %
Base BatchBatch 1Batch 2Batch 3
A510-10
B (coal USA)30303030
C8101010
D35404040
E-1010-
F12---
H10---
G--1010
100.00100.00100.0100.0
Table 10. Technological properties of the experimental batches.
SampleProximate Analysis, %Plastometric
Parameters, mm
AdSdtVdVdafXY
Base batch10.40.8326.529.63413
Batch 19.70.6528.030.92716
Batch 29.90.6526.128.82516
Batch 39.80.6127.230.02716
Table 11. Petrographic characteristics of the experimental batches.
SamplePetrographic Composition
(Without Mineral Impurities), %
Mean Vitrinite
Reflection Coefficient, %
VtSvILΣ FCRo
Base batch741223231.07
Batch 179-201201.00
Batch 2781192201.10
Batch 3801183181.05
Table 12. Qualitative indicators of box coking, coke, and ashing and desulphurization coefficients.
SampleProximate
Analysis, %
Ashing
Coefficient
Desulphurization CoefficientCRI,
%
CSR,
%
ρ,
Om·cm
AdStdVdaf
Base batch12.90.610.91.3030.80638.3 ± 3.540.5 ± 3.50.0597
Batch 1 12.90.530.61.3300.81536.5 ± 3.544.0 ± 3.50.0568
Batch 212.60.520.51.2990.80036.1 ± 3.544.9 ± 3.50.0562
Batch 312.80.531.11.3120.86935.2 ± 3.548.8 ± 3.50.0547
Table 13. Qualitative indicators of coke.
SampleYield and Strength
of Coke, %
YieldM25M10
Base batch76.3192.1 ± 37.3 ± 1
Batch 1 75.2692.3 ± 37.5 ± 1
Batch 276.6092.4 ± 37.0 ± 1
Batch 375.8292.7 ± 36.9 ± 1
Table 14. Mathematical equations.
Mathematical EquationsStatistical Assessment
rD, %
(3) CRI = 0.6255·ΣFC + 23.8590.9998
(4) CSR = −1.6196·ΣFC + 77.3470.9895.86
(5) CRI = −0.4711·Vt + 73.1520.9590.51
(6) CSR = 1.1639·Vt − 45.940.980.56
(7) M25 = −0.1157·ΣFC + 94.7180.9591.01
Table 15. Thermodynamic assessment of petrographic nonuniformity of coal batches.
ParameterBase BatchBatch 1Batch 2Batch 3
Reflection coefficient Ro, %Vt1.071.001.101.05
Sv1.28-1.321.26
I1.981.852.041.94
L0.580.540.590.57
ΔGf,i, kJ/molVt−64.971.8−112.5−10.7
Sv−1227.2-−1203.8−1239.0
I−1039.0−1069.6−1026.6−1047.7
L−1665.4−1810.0−1614.8−1712.4
ΔGf,total, kJ/mol−338.8−175.3−327.2−260.9
Disclaimer/Publisher’s Note: The statements, opinions and data contained in all publications are solely those of the individual author(s) and contributor(s) and not of MDPI and/or the editor(s). MDPI and/or the editor(s) disclaim responsibility for any injury to people or property resulting from any ideas, methods, instructions or products referred to in the content.