Article

Green Synthesis of a Highly Active Ag/Activated Carbon Nanocomposite from Tamarind Seeds for Methyl Orange Removal

1
Department of Environment and Agricultural Natural Resources, College of Agricultural and Food Sciences, King Faisal University, P.O. Box 400, Al-Ahsa 31982, Saudi Arabia
2
Fab Lab, Abdulmonem Al Rashed Humanitarian Foundation, P.O. Box 13315, Al-Ahsa 39812, Saudi Arabia
3
King Abdulaziz and His Companions Foundation for Giftedness and Creativity “Mawhiba”, P.O. Box 300820, Riyadh 11372, Saudi Arabia
4
Department of Arid Land Agriculture, College of Agriculture and Food Sciences, King Faisal University, P.O. Box 400, Al-Ahsa 31982, Saudi Arabia
5
Department of Chemistry, College of Science, Jouf University, Sakaka P.O. Box 2014, Saudi Arabia
*
Author to whom correspondence should be addressed.
Submission received: 24 February 2025 / Revised: 12 April 2025 / Accepted: 15 April 2025 / Published: 17 April 2025
(This article belongs to the Special Issue Carbon Functionalization: From Synthesis to Applications)

Abstract

:
This study investigated the enhanced adsorption capacity of a silver nanoparticle (AgNPs)-incorporated tamarind seed activated carbon nanocomposite (Ag/TSAC) for the elimination of methyl orange (MO) from aqueous solutions. The nanocomposite was analyzed using TGA, SEM, FTIR, and BET, revealing a mesoporous structure with a surface area of 54.92 m2/g. The results showed that the structure of tamarind seeds altered during pyrolysis, as shown by the loss of many functional groups and a weight decrease of 66.61% in the nanocomposite. The efficiency of the nanocomposite in eliminating MO was assessed by batch adsorption studies, which also examined the effects of solution pH, starting MO concentration, and nanocomposite dose. The best MO removal was seen at pH 2, indicating a positive electrostatic interaction between the dye and adsorbent. The results demonstrated that the Ag/TSAC nanocomposite significantly enhanced MO removal efficiency from 19% to 96% under optimal adsorptive conditions, due to the synergistic effect of the high surface area of activated carbon and the enhanced adsorption sites provided by the AgNPs. The study demonstrates the potential of Ag/activated carbon nanocomposite as a sustainable adsorbent for removing MO dye from wastewater using a second-order model and Langmuir model.

Graphical Abstract

1. Introduction

Traditionally, techniques including mechanical separation, filtration, flocculation, coagulation, and chemical treatment have been used to cleanse and purify water. While some of these traditional methods remain important, new technologies can provide a faster and more efficient means of treating water. The development of novel functional nanoparticles that can capture a variety of contaminants from water has lately increased interest in nanotechnology [1,2,3,4,5]. Nanomaterials may be created using top-down or bottom-up methods, and their sizes range from 1 to 100 nm [1,2]. Nanomaterials have a significant surface area because of their tiny size, which increases the amount of interaction between them and contaminated water [1,2,6]. As a result of this increased contact, the nanomaterial is more efficient at adsorbing various pollutants. Through particular interactions between the pollutants and the functional groups that are either naturally occurring or intentionally grafted to improve adsorbent–pollutant interactions, nanomaterials are able to absorb pollutants.
Numerous contaminants can be found in contaminated water, such as organic pollutants including dyes, pesticides, medications, and decomposed organic debris, as well as heavy metals [7,8,9]. Among these contaminants, dyes are those that alter the color of water and are hazardous [10,11]. As a result, the stream receives less sunlight, which lowers the photosynthetic response and impacts the aquatic biota. The industries that produce synthetic colors, leather goods, and textiles are the main producers of dyes in water [10]. One industrially relevant hazardous dye that has been shown to have detrimental effects on people is the anionic dye methyl orange (MO) [11]. Numerous techniques, including adsorption, biological degradation, coagulation, flocculation, photodegradation, and catalytic degradation, have been used to remove methyl orange [10,12,13,14,15]. Adsorption is regarded as one of the best methods for treating wastewater [15]. Its simplicity, affordability, and low maintenance requirements set it apart from competing approaches. Additionally, it has a quick kinetic, uses very few chemicals, is extremely selective, and is sensitive even at low dye concentrations [5]. Because of its high carbon content, high surface area with numerous functional groups, and reasonably priced raw ingredients, activated carbon (AC) offers numerous advantages [16]. Additionally, activated carbons are chemically and electrically stable and have several functional groups that make them useful as supports for metal nanoparticles [17]. In recent studies, activated carbon nanocomposites have been synthesized to eliminate wastewater dyes due to their porous structure and nanoparticle properties [18]. A new composite, AgNO3/AC, is produced when AgNO3 nanoparticles are added to activated carbon, which increases the active site of the activated carbon, thereby increasing its efficiency for removing contaminants [19]. More attention is needed for metal nanoparticles on account of their diverse applications and morphology-dependent characteristics [18]. The possibilities and novel characteristics of these compounds have generated significant research interest [19].
In wastewater treatment, silver nitrate has been utilized as an efficient adsorbent substance. Silver nitrate nanoparticles can be synthesized biogenically using plant-based methods, which are economical, eco-friendly, and avoid using harmful and dangerous reducing agents like sodium borohydride. Moreover, the biomolecules in the plant serve as a capping and reducing agent, which lessens aggregation and homogenizes particle shape [20]. In order to create silver nitrate nanoparticles for this study, pod extract from Acacia Nilotica was employed as a reducing agent. A. Nilotica belongs to the Leguminosae-Mimosoideae family of tropical plants. Numerous illnesses, including cancer, diarrhea, cough, and others, have traditionally been treated with it. A. Nilotica contains a wide variety of biomolecules, including as saponins, alkaloids, flavonoids, and phenolic chemicals [20], that can serve as an agent to stabilize and reduce Ag+ ions. Since dye contamination problems pose a threat to the environment, new adsorbent materials are needed to remove dye from wastewater. Currently, no reports have been published on the synthesis of tamarind seed activated carbon nanocomposite as nano-adsorbent for dye removal. Hence, in the present study, to create a nanocomposite, silver nanoparticles were greenly synthesized utilizing Acacia Nilotica and then incorporated into activated carbon derived from tamarind seeds. TGA, SEM (FEI, Yakima, WA, USA), BET surface area, and FTIR (Agilent Cary, Santa Clara, CA, USA) were used to describe this nanocomposite. UV-vis spectroscopy (Agilent Cary, Santa Clara, CA, USA) was used to examine the adsorption of MO dye from aqueous solutions using a produced nanocomposite. The effects of starting MO concentrations, pH, activated carbon dosage, and adsorbent dose were examined. The MO dye’s adsorption kinetics and isotherms were also examined.

2. Material and Methods

2.1. Material

The tamarind seeds were collected from a nearby market in Al-Ahsa, Saudi Arabia. Silver nitrate (99.9%, AgNO3, Merck, Darmstadt, Germany) was used for the synthesis of the AgNO3/TS activated carbon nanocomposite. Sodium hydroxide (0.1 M NaOH, Merck) and hydrochloric acid (0.1 M HCl, Merck) were used to adjust the pH of the solution. Adsorption processes were evaluated using methyl orange (98% MO).

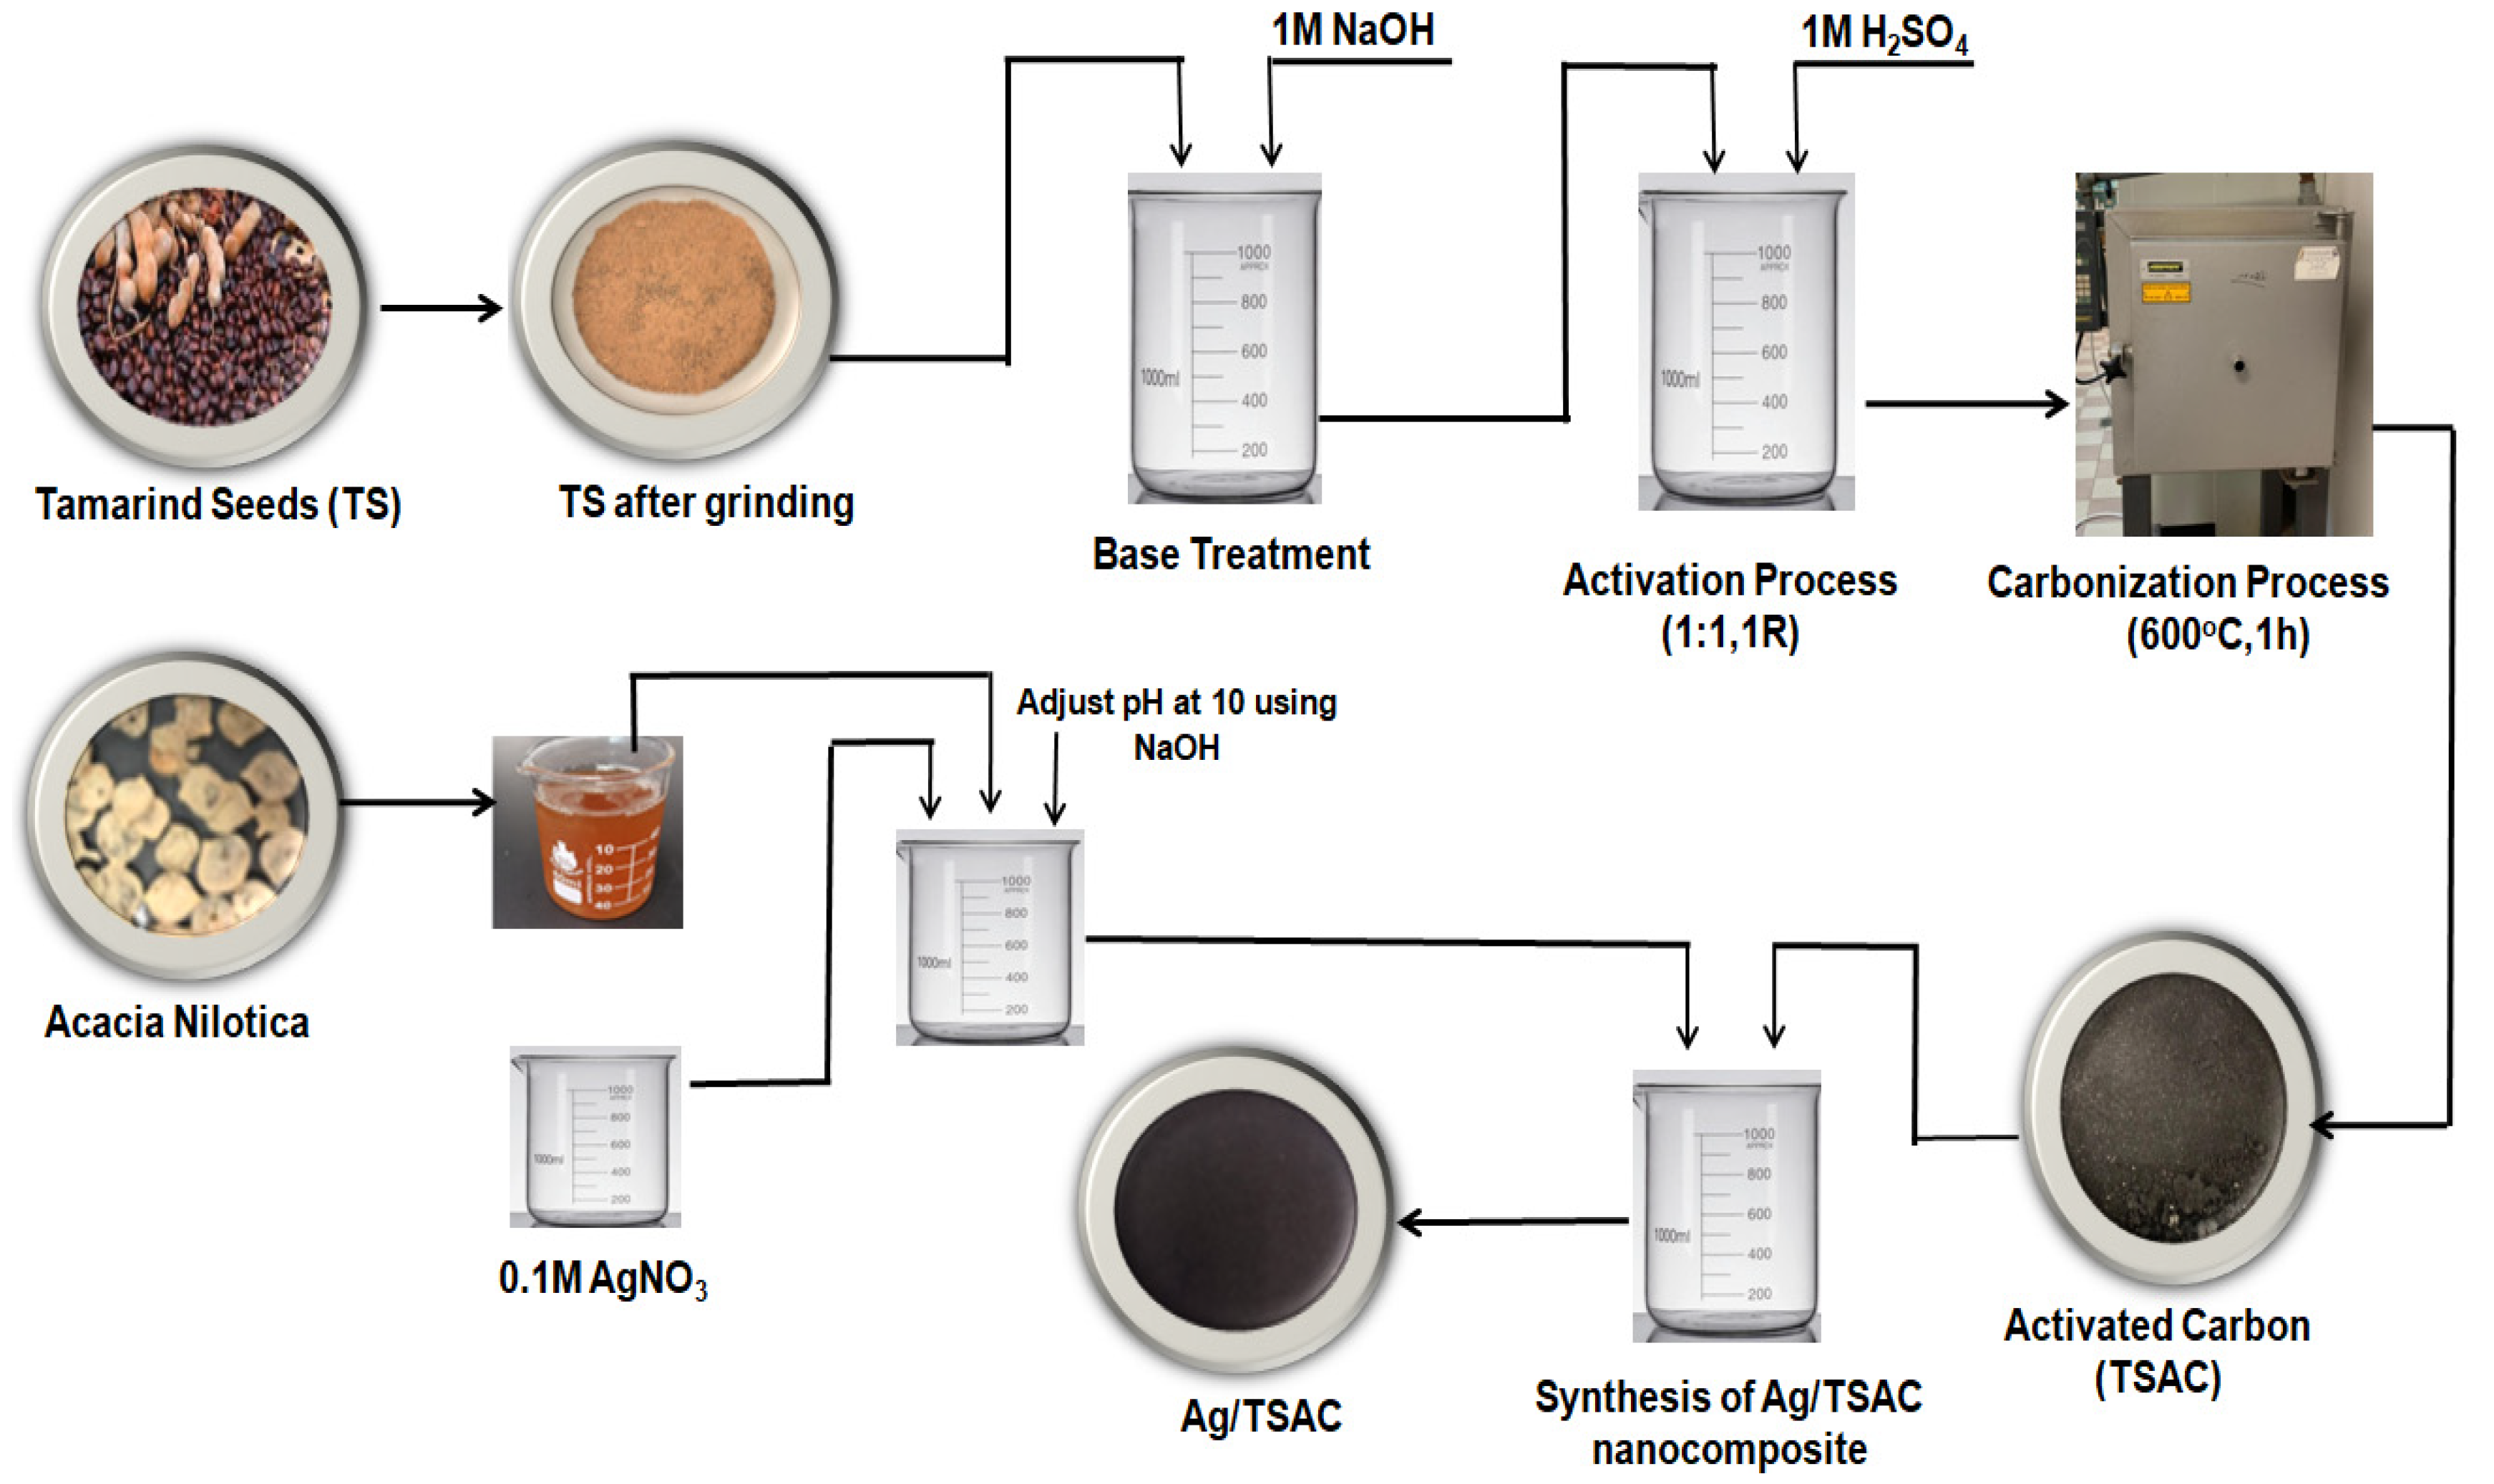
2.2. Making an Extract from Acacia Nilotica

A. Nilotica pods were obtained from a nearby market in Hofuf, Saudi Arabia and thoroughly rinsed with tap and distilled water to eliminate dust and contaminants as part of the extraction procedure. A total of 10 g of A. Nilotica pods were boiled in distilled water for 30 min at 100 °C. Afterward, the extract was filtered and stored at 4 °C.

2.3. Synthesis of Activated Carbon

To reduce the amount of ash in the sample, the ground tamarind seeds (TS) were refluxed with a 1 M NaOH solution for one hour. The tamarind seeds were cleaned with distilled water after the basic solution was drained, and they were then dried for 24 h at 70 °C. Then, at an impregnation ratio (1/1, mass ratio of activating agent to dried tamarind seeds), the tamarind seeds were impregnated with 1 M H2SO4. The mixture was then heated for one hour at 600 °C in an oxygen-free furnace. As per existing literature, the chosen temperature of 600 °C was a component of an input series used to find out the best circumstances for biomass-based activated carbon synthesis [21,22]. Ag/TSAC was the name of the developed AC (Figure 1).

2.4. Synthesis of Ag/TS Activated Carbon Nanocomposite

Figure 1 demonstrates the steps involved in synthesizing Ag/TSAC nanocomposites. A 10 mL extract of A. Nilotica was added to 0.1 M silver nitrate solution (AgNO3, 100 mL). After adding the extract, the solution’s color changed to light brown, indicating that silver nanoparticles had been formed. In order to ensure optimal silver nanoparticle coating on activated carbon, 100 mL of as-prepared silver nanoparticles were mixed with 5 g of activated carbon and aggressively stirred for the whole night. Using distilled water, the Ag/TSAC nanocomposite was thoroughly washed. Following the drying process at 40 °C, it was calcined at 200 °C for 3 h.

2.5. Instrument Analysis

The samples’ surface functional groups were identified using Fourier transform infrared spectroscopy (Agilent Cary 630 FT-IR Spectrophotometer model, Santa Clara, CA, USA) at wavelengths between 4000 and 400 cm−1. Sample morphology was examined using scanning electron microscopy (FEI SEM model FEI, QUANTA FEG, 250, Yakima, WA, USA). The surface area of the TS & Ag/TSAC was obtained using surface area model Micromeritics ASAP 2020 (Micromeritics, Norcross, GA, USA) with nitrogen sorption at −196 °C. The total pore volume was estimated from a single point of adsorption. The sample was first degassed at 200 °C for 4 h. The materials underwent thermal gravimetric analyses (TGA) using a TG-DTG (Perkin Elmer, Shelton, CT, USA) heated at 10 C/min in a nitrogen atmosphere from 30 to 800 °C. The yield of AC from pyrolysis was 47.56%.
  A C   y i e l d   % = m a s s   o f   a c t i v a t e d   c a r b o n m a s s   o f   d r i e d   s a m p l e × 100

2.6. Experimental Procedures

MO adsorption was carried out under various circumstances on the nanocomposite adsorbent while being continuously stirred at 100 rpm. In a 50 mL Erlenmeyer flask, 30 mL of a 40 mg/L MO solution at pH 2 and 25 °C was used for batch testing. The study used HCl and NaOH to alter pH (2–11). A range of concentrations, from 10 to 90 mg/L, were evaluated. To assess the impact of nanocomposite on MO adsorption, several quantities were introduced to 20 mg/L initial MO concentration at pH 2 and 25 °C. Shimadzu’s UV–vis spectrophotometer was used to detect the maximum absorption of the MO solution at 464 nm after samples were collected and filtered using Whatman No. 1 paper. At pH 2, a kinetic study was conducted. Analyses of the MO concentrations were performed after 0, 2, 5, 10, 15, 20, 30, 40, 50, 60, 90, and 120 min. The experiment was run twice, and the average value was used. Equations (2) and (3) were used to get the MO removal % and the adsorption capacity.
%   R e m o v a l o f M O = C o C t C o × 100
A d s o r p t i o n   c a p a c i t y q e = C o C e V W , m g   o f   a d s o r b a t e / g   o f   a d s o r b e n t
where C o (mg/L) is the MO solution’s starting concentration and C t (mg/L) is the MO concentration at time t. W is the mass of the adsorben t (g), V is the volume of the MO solution (L), and C e (mg/L) is the equilibrium concentration of MO.

3. Results and Discussions

3.1. Characterization

3.1.1. FTIR Characterization

Figure 2 depicts the FTIR study of the feedstock and the Ag/TSAC nanocomposite that was created. The materials’ FTIR spectra are displayed in Table 1. The existence of a band applicable exclusively to hydroxyl, alkane, alkyne, alkene, esters, and ether groups at 3630, 2924, 2024, 1734, 1608, 1541, 1236, 1045, and 761 cm−1 has been found for tamarind seeds [23]. On the other hand, Figure 2 illustrates a band at 3400–2800 cm−1 for the Ag/TSAC nanocomposite sample, which indicates a reduction in relative intensity, mostly due to carboxyl group degradation. A peak around 1045 cm−1 disappeared, as a result of tamarind seeds surfaces that are cleaned of inorganic materials after acid treatment [23]. In contrast to the tamarind seeds, the nanocomposite sample (Figure 2) showed that the presence of specific aromatic C–H and carboxyl–carbonated was increased by the strong absorption band at 1473 cm−1 and 1205 cm−1. Published research indicates that the typical range of metal–oxygen stretching frequencies is 500–600 cm−1 [24]. Hence, the weak band seen at 599.26 cm−1 in Figure 1 is ascribed to the Ag–O vibration.

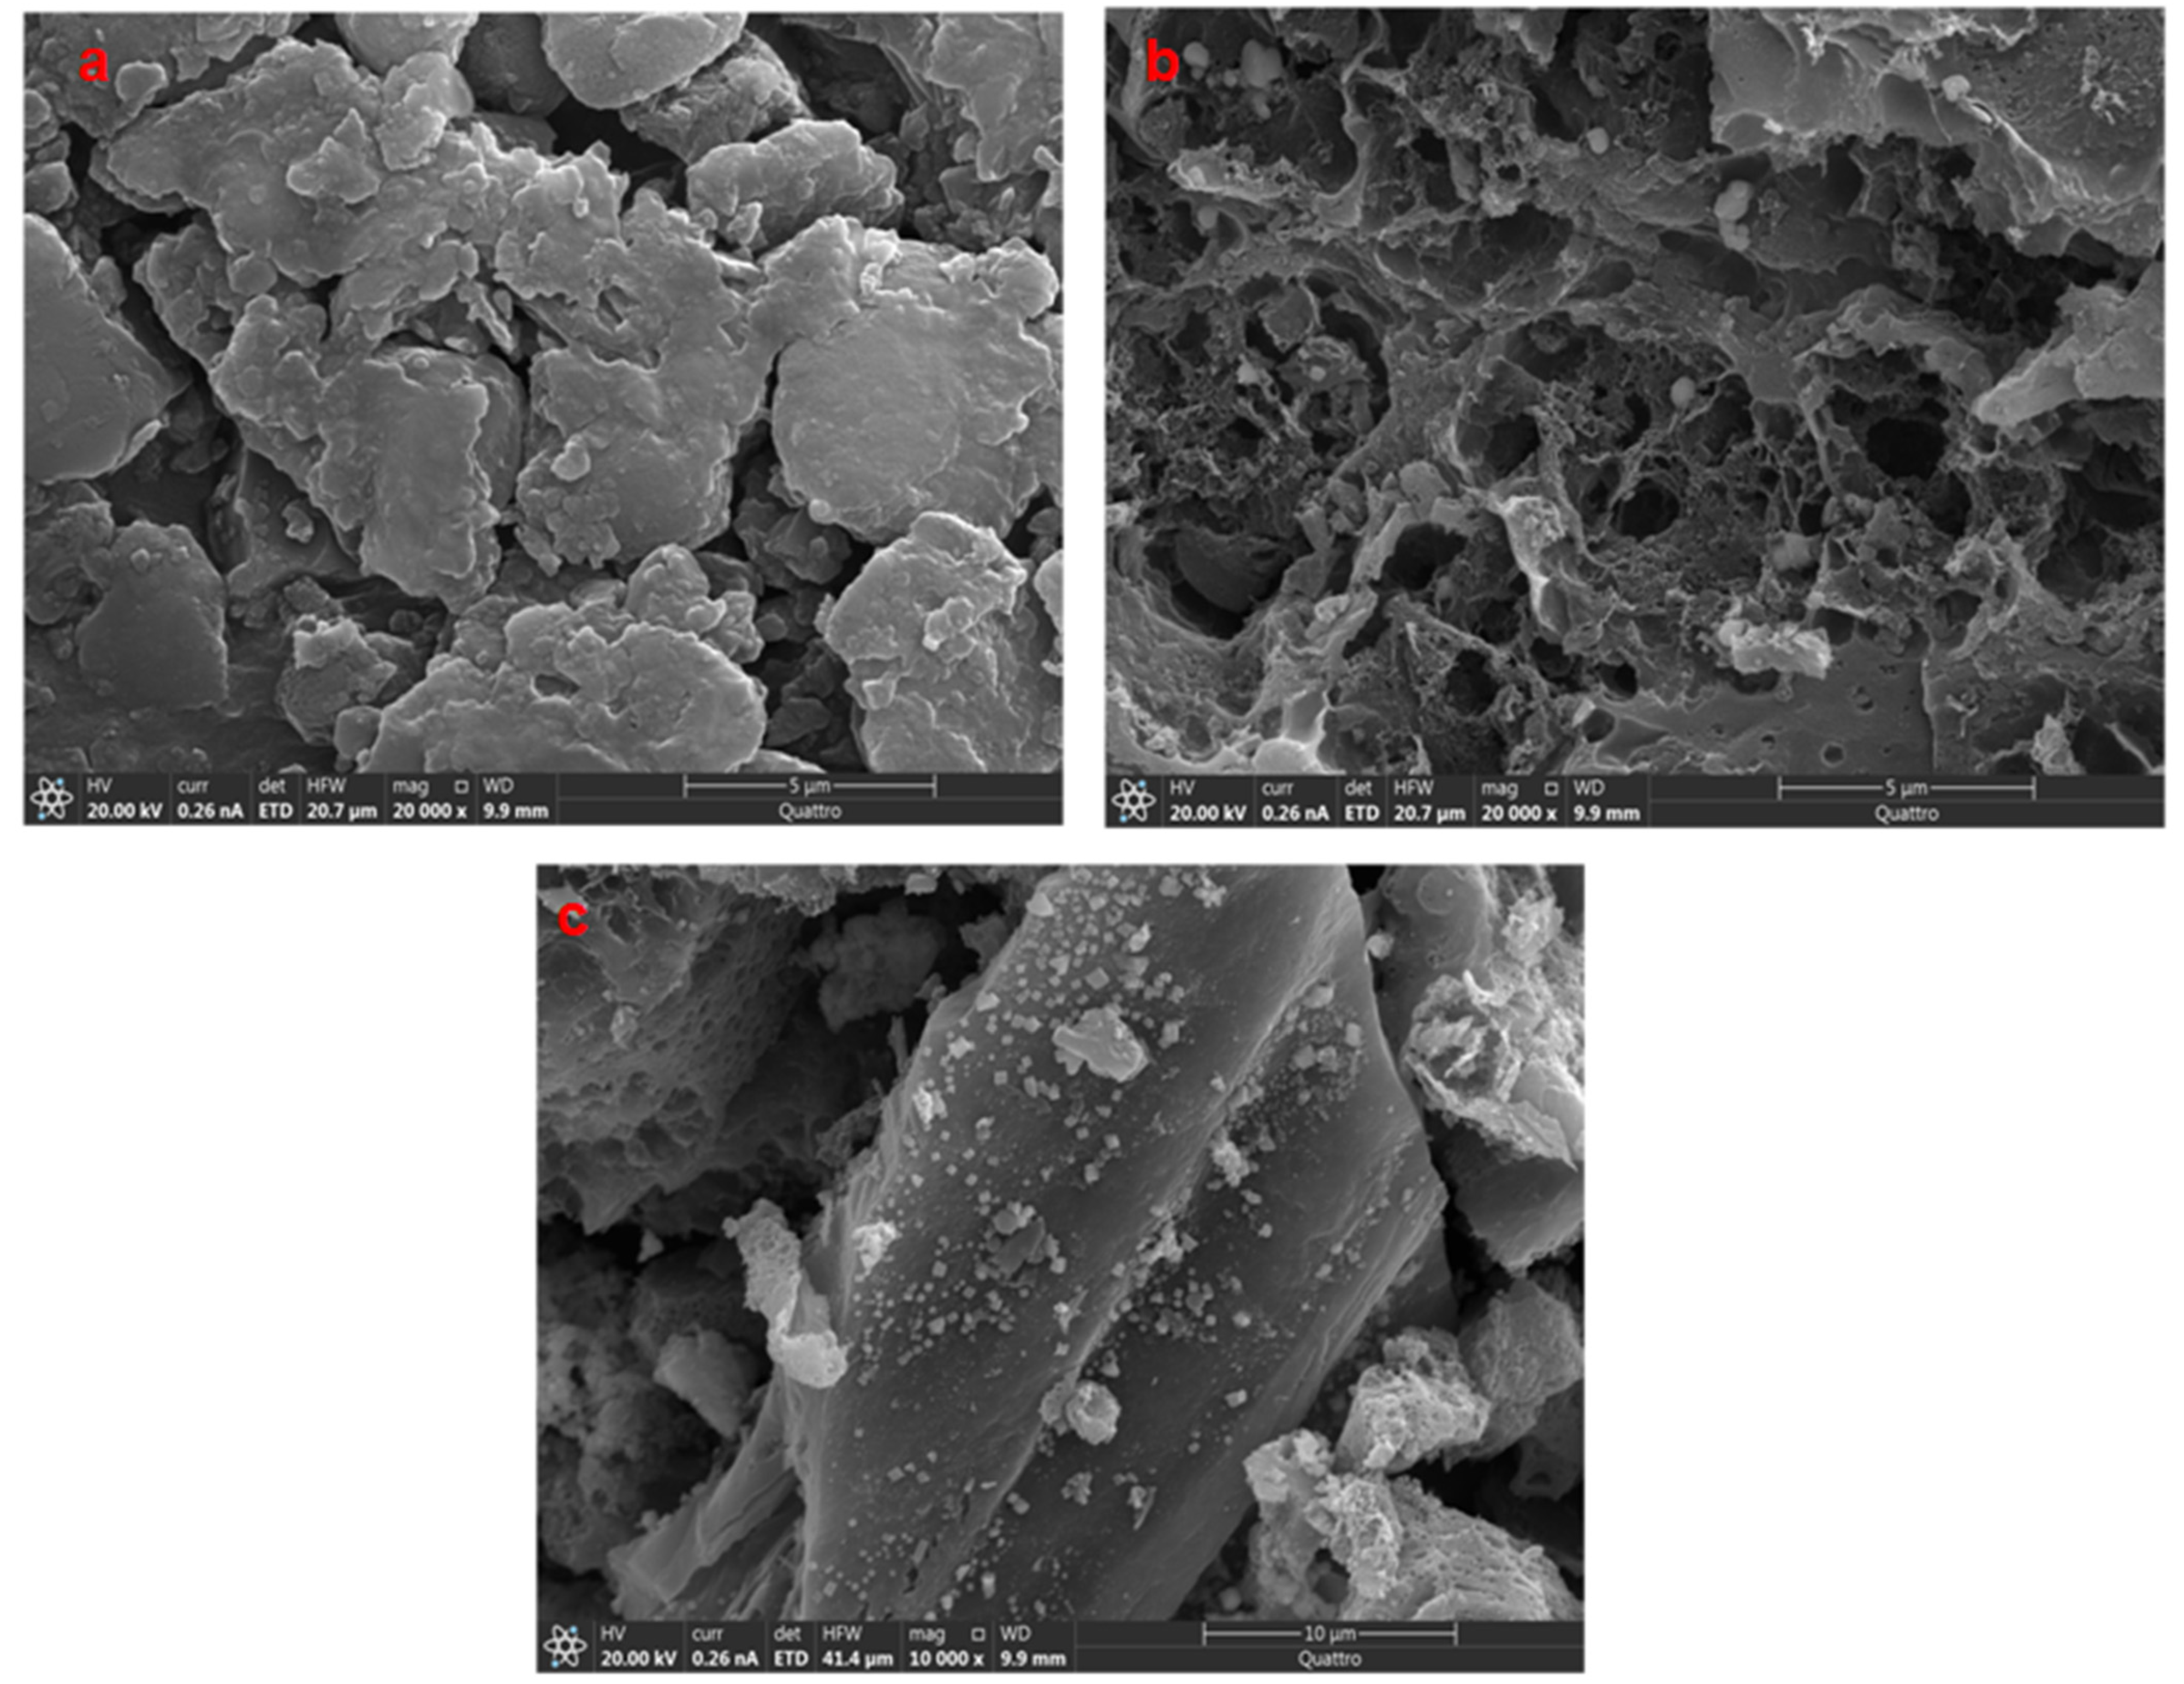
3.1.2. SEM Characterization

The morphological structure of the produced nanocomposite and raw material was examined by SEM analysis (Figure 3). Figure 3 illustrates the notable variations in surface topography between raw tamarind seeds (Figure 3a), and the Ag/TSAC nanocomposite (Figure 3b,c). The surface of the Ag/TSAC nanocomposite produced several pores, while the surface of the raw tamarind seeds had none at all. The AgNPs in AC were recognized as bright dots with good dispersion on the surface, which confirm that the incorporation process was successful, as shown in Figure 3c. This raises the prospect of a large adsorption surface area. Similar Ag/AC SEM patters were recorded by Eletta et al. [25]. These findings suggested that the Ag/TSAC nanocomposite, which had been treated with silver nitrate, had better physical properties. Additionally, it enhanced MO adsorption as well as active site accessibility throughout the adsorption process.

3.1.3. Surface Area Analysis
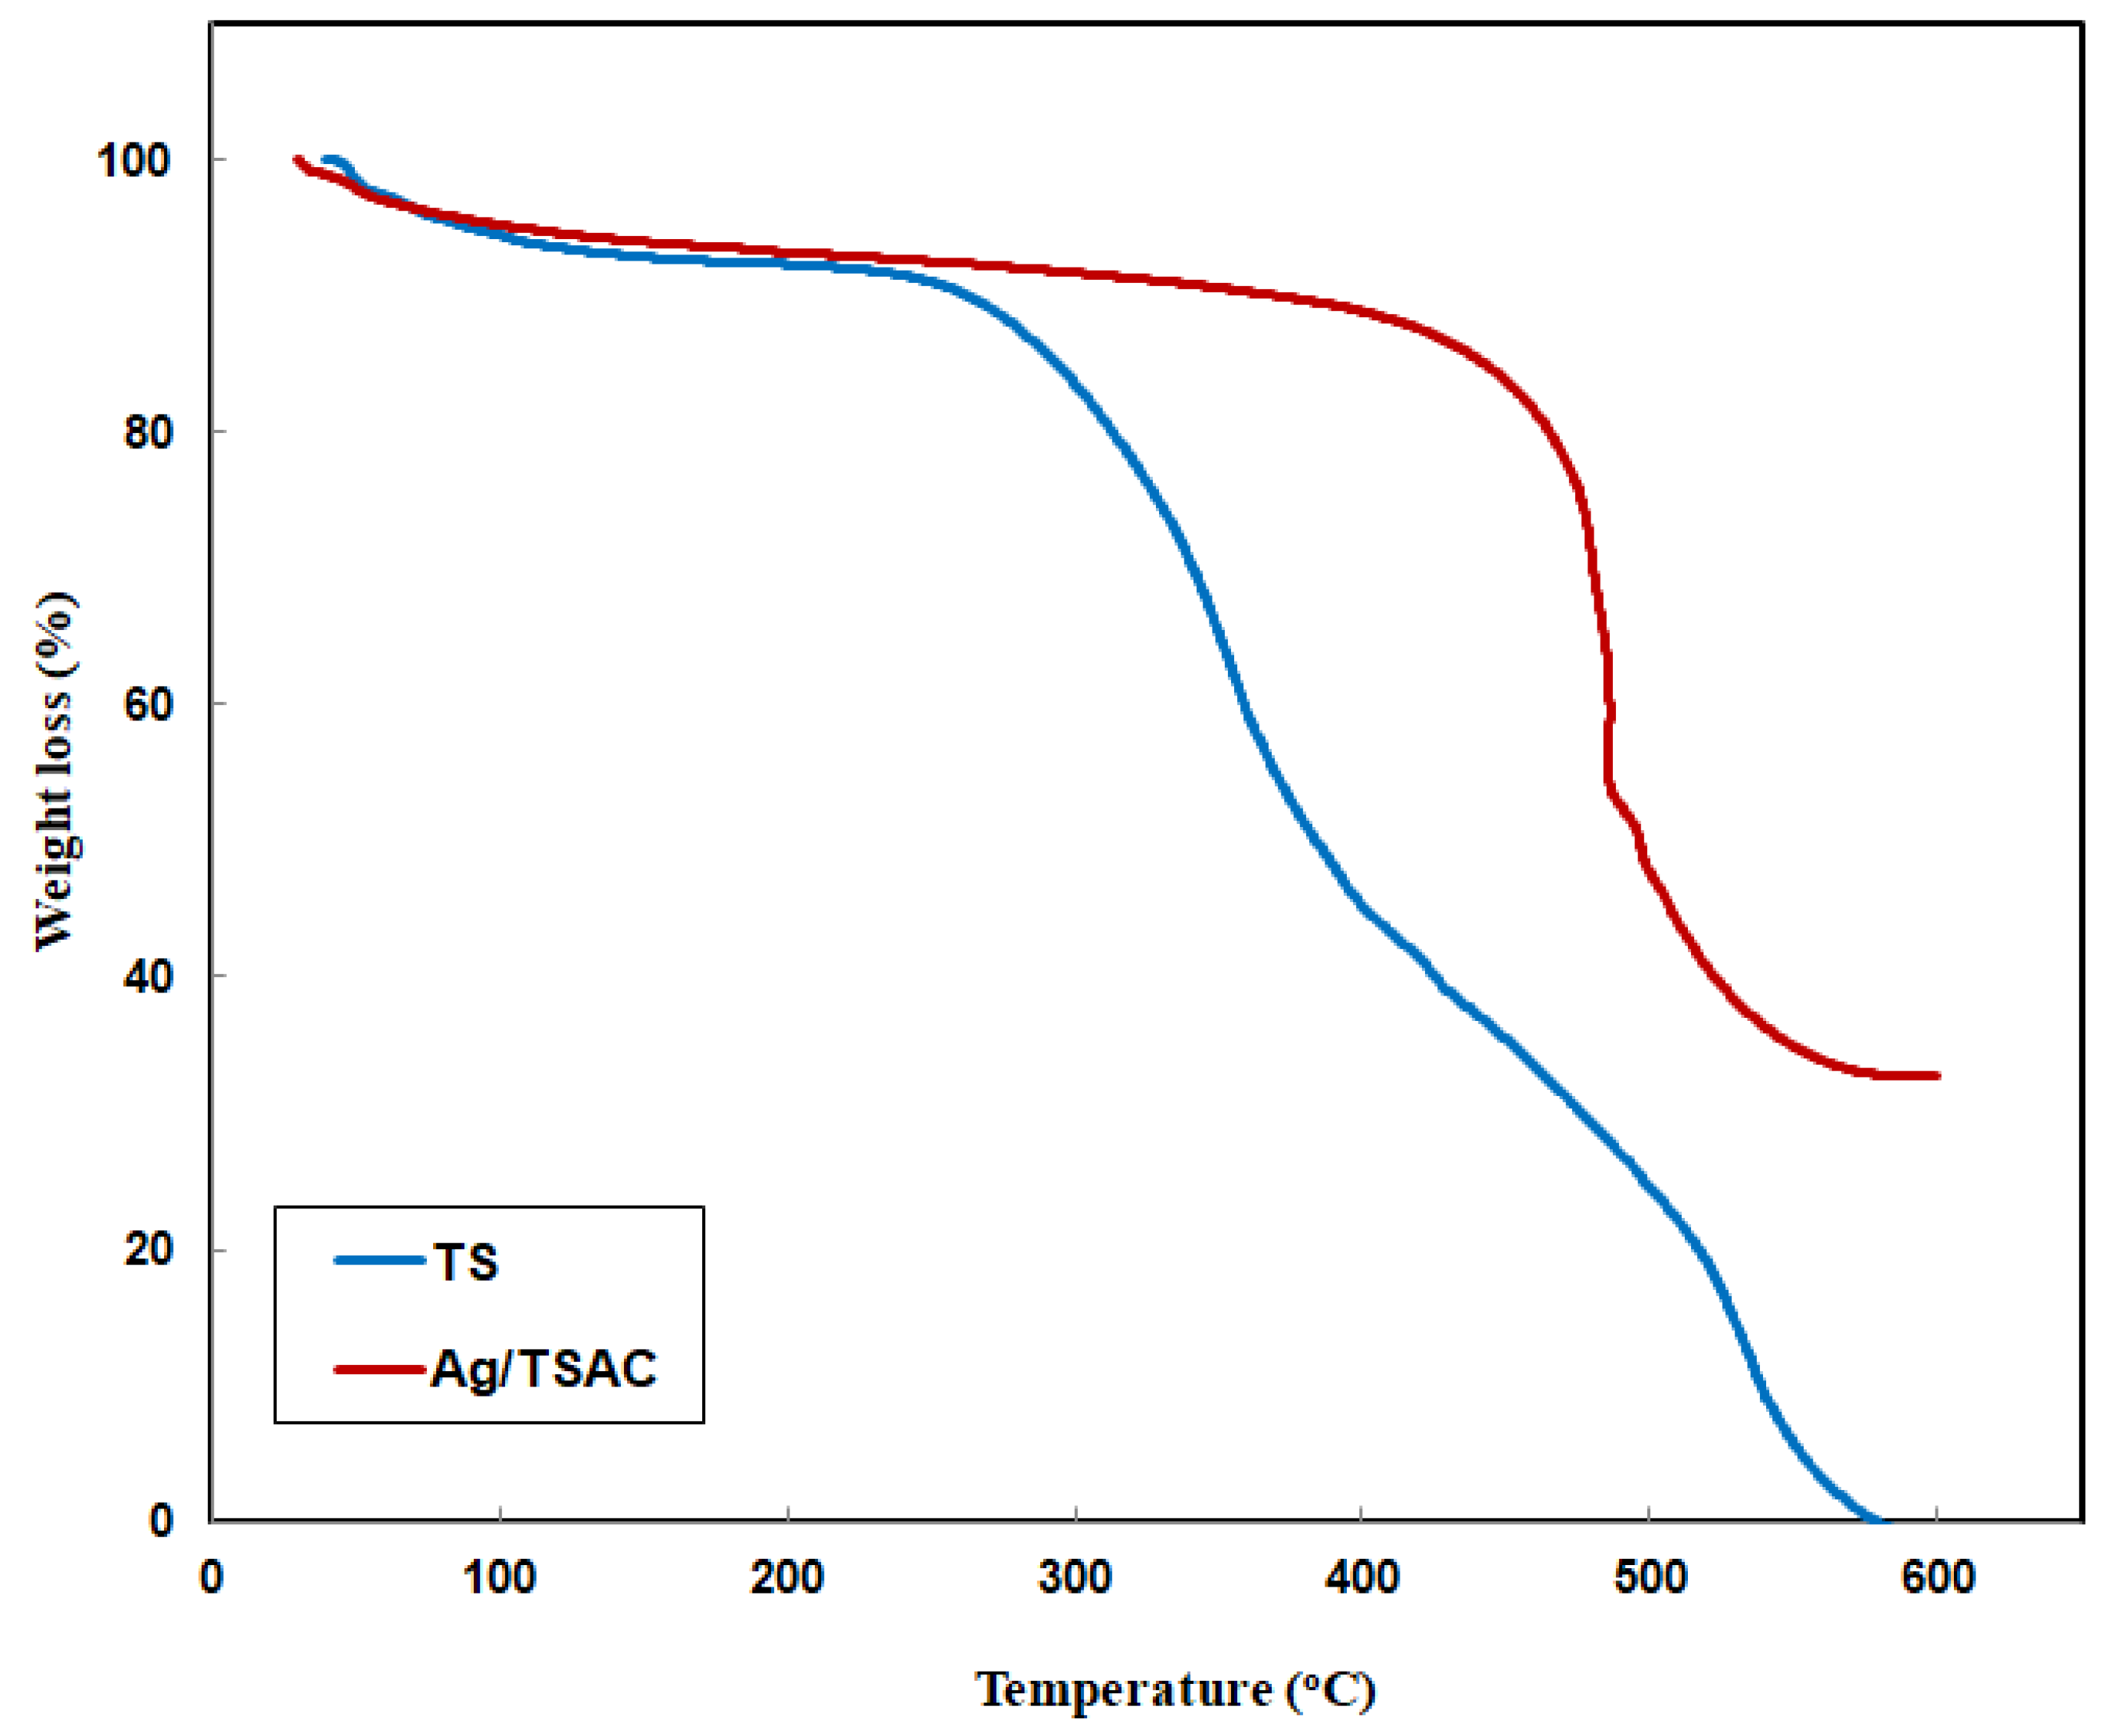
Table 2 lists the adsorbents’ textural characteristics in tabular form. It was demonstrated that using the Ag/TSAC nanocomposite instead of tamarind seeds caused the average pore width and surface area to rise significantly. Tamarind seed total pore volume increased from 0.0287 cm3/g to 0.1283 cm3/g for Ag/TSAC nanocomposite, whereas the surface area of Ag/TSAC is 47 times more than that of tamarind seeds. Furthermore, Table 2 displays the average pore size diameter for the Ag/TSAC nanocomposite and TS, which are 17.75 and 41.66 nm, respectively. This demonstrates the mesoporous structure of the material under study, which is consistent with the predominantly non-porous nature of the raw TS, as evidenced by SEM imaging showing a relatively smooth surface.

3.1.4. TGA Analysis

In a controlled environment, TGA calculates a sample’s weight change as a function of temperature. This is essential for figuring out the TS and Ag/TSAC nanocomposite thermal stability. As the temperature rose, the TS and Ag/TSAC TGA curves indicated a tendency for weight loss (Figure 4). In the first step from 38.00 °C to 195.29 °C, the TS weight decreased by 7.66% due to moisture adsorbed on the surface of biochar and functional groups [26,27]. It is possible that the 44.42% weight loss in the second stage, which took place between 195.29 °C and 390.82 °C, was due to the thermal breakdown of the cellulose and hemicellulose content in TS [28]. The third stage’s 46.6% weight loss from 390.82 °C to 570.10 °C suggests that cellulose and hemicellulose are still being broken down by pyrolysis mechanisms [27]. However, in the first stage of a two-step degradation of Ag/TSAC nanocomposite, the weight loss was reduced by 11.87% due to functional groups and moisture adsorbed on the surface [27]. Upon reaching 550 °C, the weight loss in the second stage was 54.74%. The results show that the main components of activated carbon produced from biomass are cellulose, hemicellulose, lignin, and polycyclic aromatic compounds. Hemicellulose may decompose at temperatures between 220 °C and 315 °C. Cellulose and lignin break down between 315 and 400 °C [24]. The polycyclic aromatic structures will be completely destroyed with further temperature increases [28]. These results provide valuable information about the AC’s suitability for high-temperature applications and its potential decomposition pathways. Our FTIR also confirmed this finding. With a 66.61% weight reduction in the Ag/TSAC nanocomposite, the FTIR data demonstrated that the structure of tamarind seeds changed during pyrolysis, as evidenced by the loss of several functional groups.

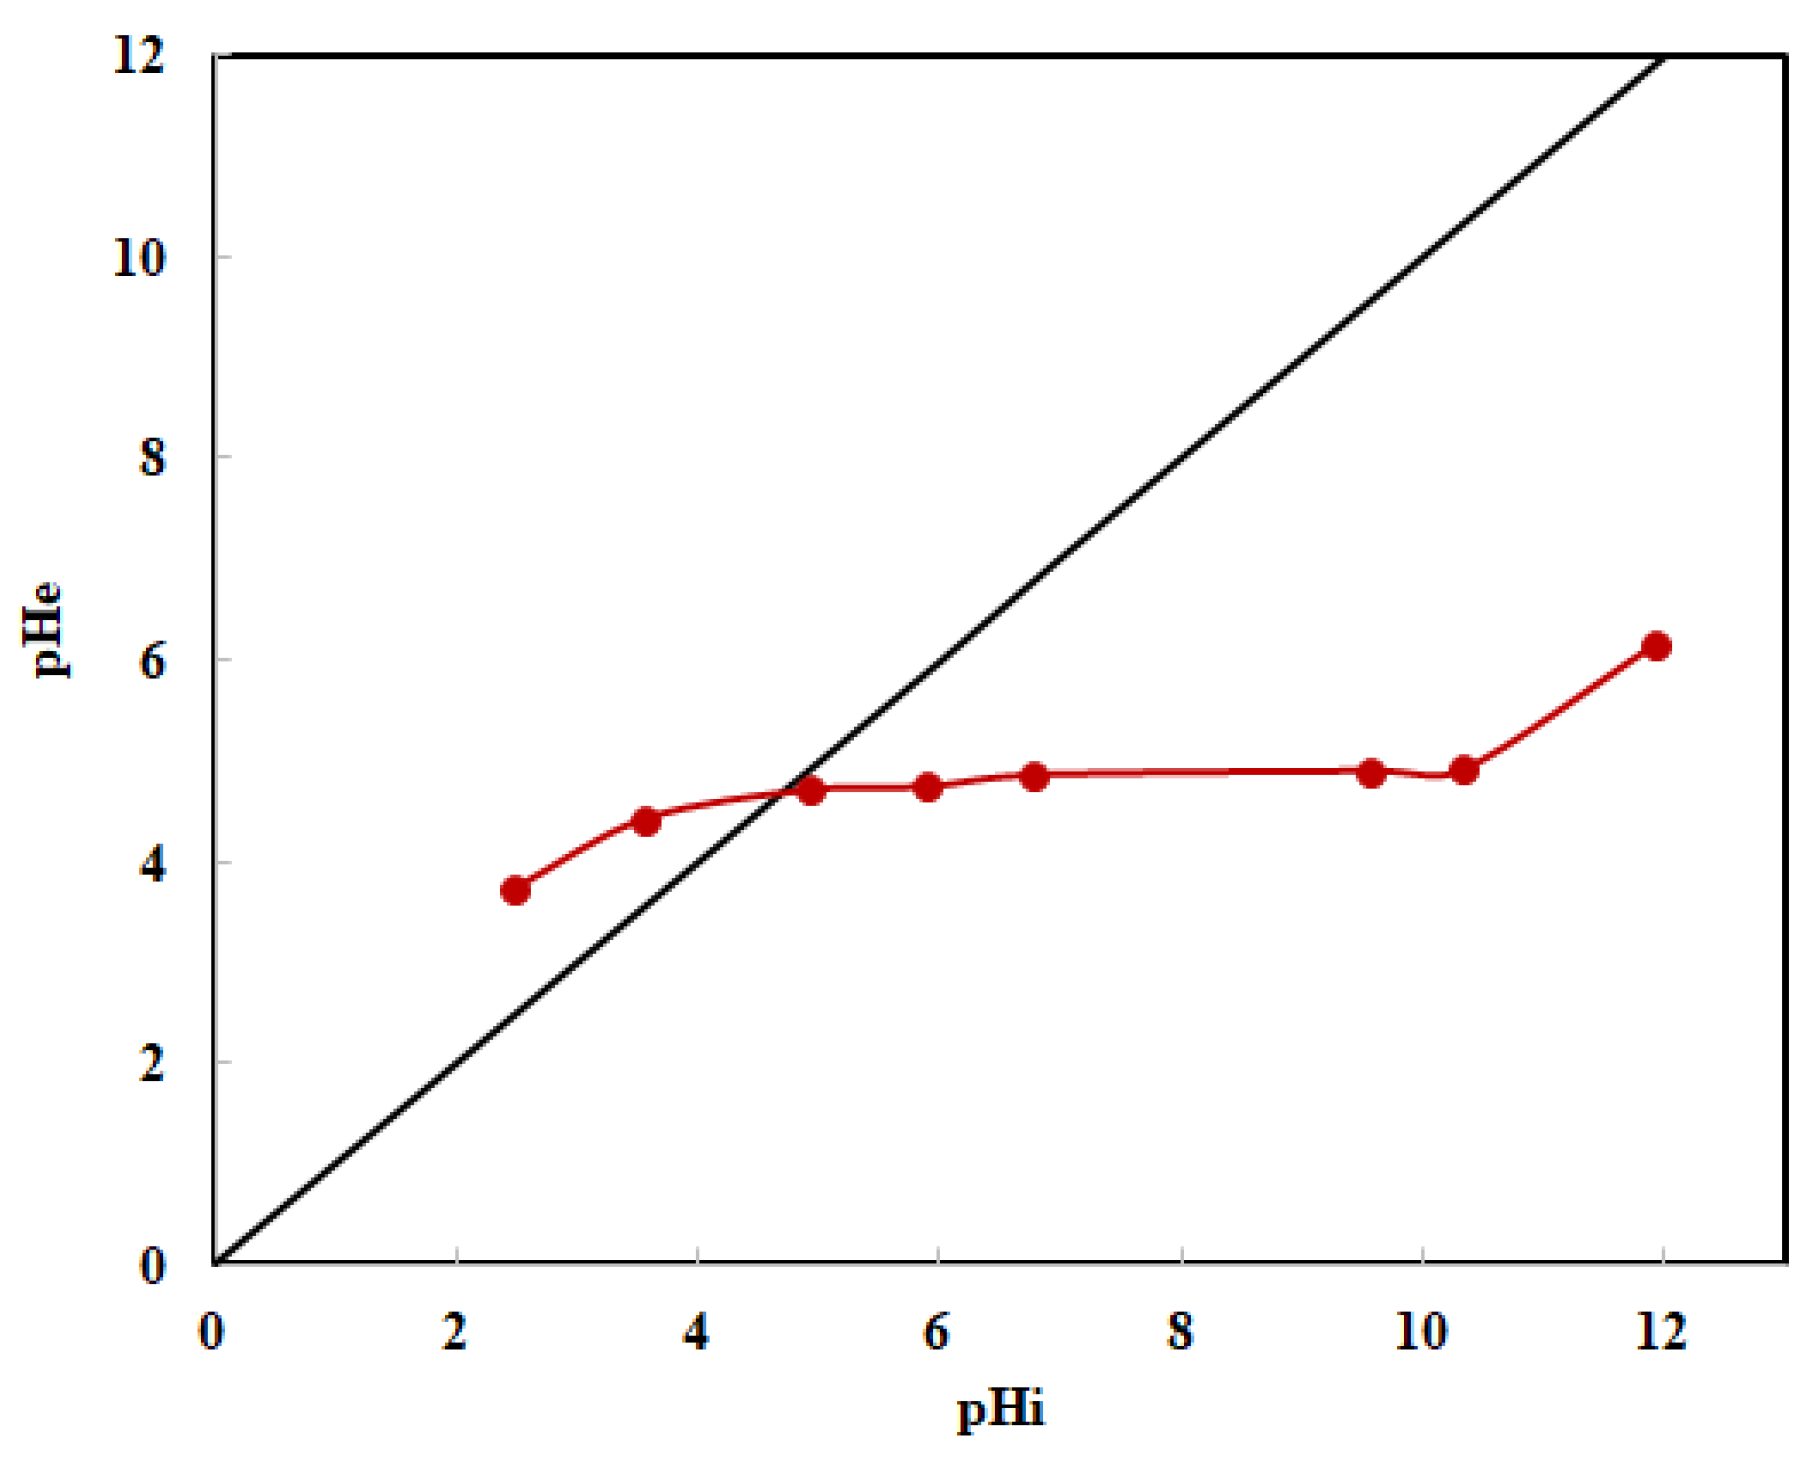
3.1.5. pH of Zero Charge Point (pHZC)

The pHzc (pH of zero charge point) of Ag/TSAC nanocomposite is influenced by the chemical and electronic characteristics of the functional groups present on its surface. After mixing with 0.1 g of Ag/TSAC nanocomposite, the initial pH (pHi) measurement for NaCl solution, as illustrated in Figure 5, varied from (2–11). According to Figure 5, the nanocomposite has a pHZC of about 4.7. This value indicates that this nanocomposite could serve as an effective adsorbent for MO removal if the solution’s pH were adjusted to below 4.7. If the solution’s pH value is below 4.7, the surface of the nanocomposite can become protonated and positively charged. Given that MO is an anionic dye, this will result in an attraction between them. As a result, it is anticipated that the nanocomposite will serve as an effective adsorbent for anions in solutions with a pH lower than 4.7.
Factors affecting MO dye removal using nanocomposite include dye molecular weight, charge, nancomposite charge, cation exchange capacity, and π-π interaction. Ag/TSAC nanocomposite may adsorb MO through electrostatic attraction/repulsion, with electron-rich or poor functional groups interacting with electron donors and accepters [29,30]. The electrostatic repulsion between the functional groups in the Ag/TSAC nanocomposite and the negatively charged MO could enhance the adsorption process due to H–bonding. Teixidó et al. [31] also confirmed the same results. It clearly indicates that the effect of ionic strength on the surface of the adsorption material is entirely dependent on pH. The efficiency of MO removal through adsorption using the Ag/TSAC nanocomposite depends on its pH zero charge point.

3.2. Adsorption Studies
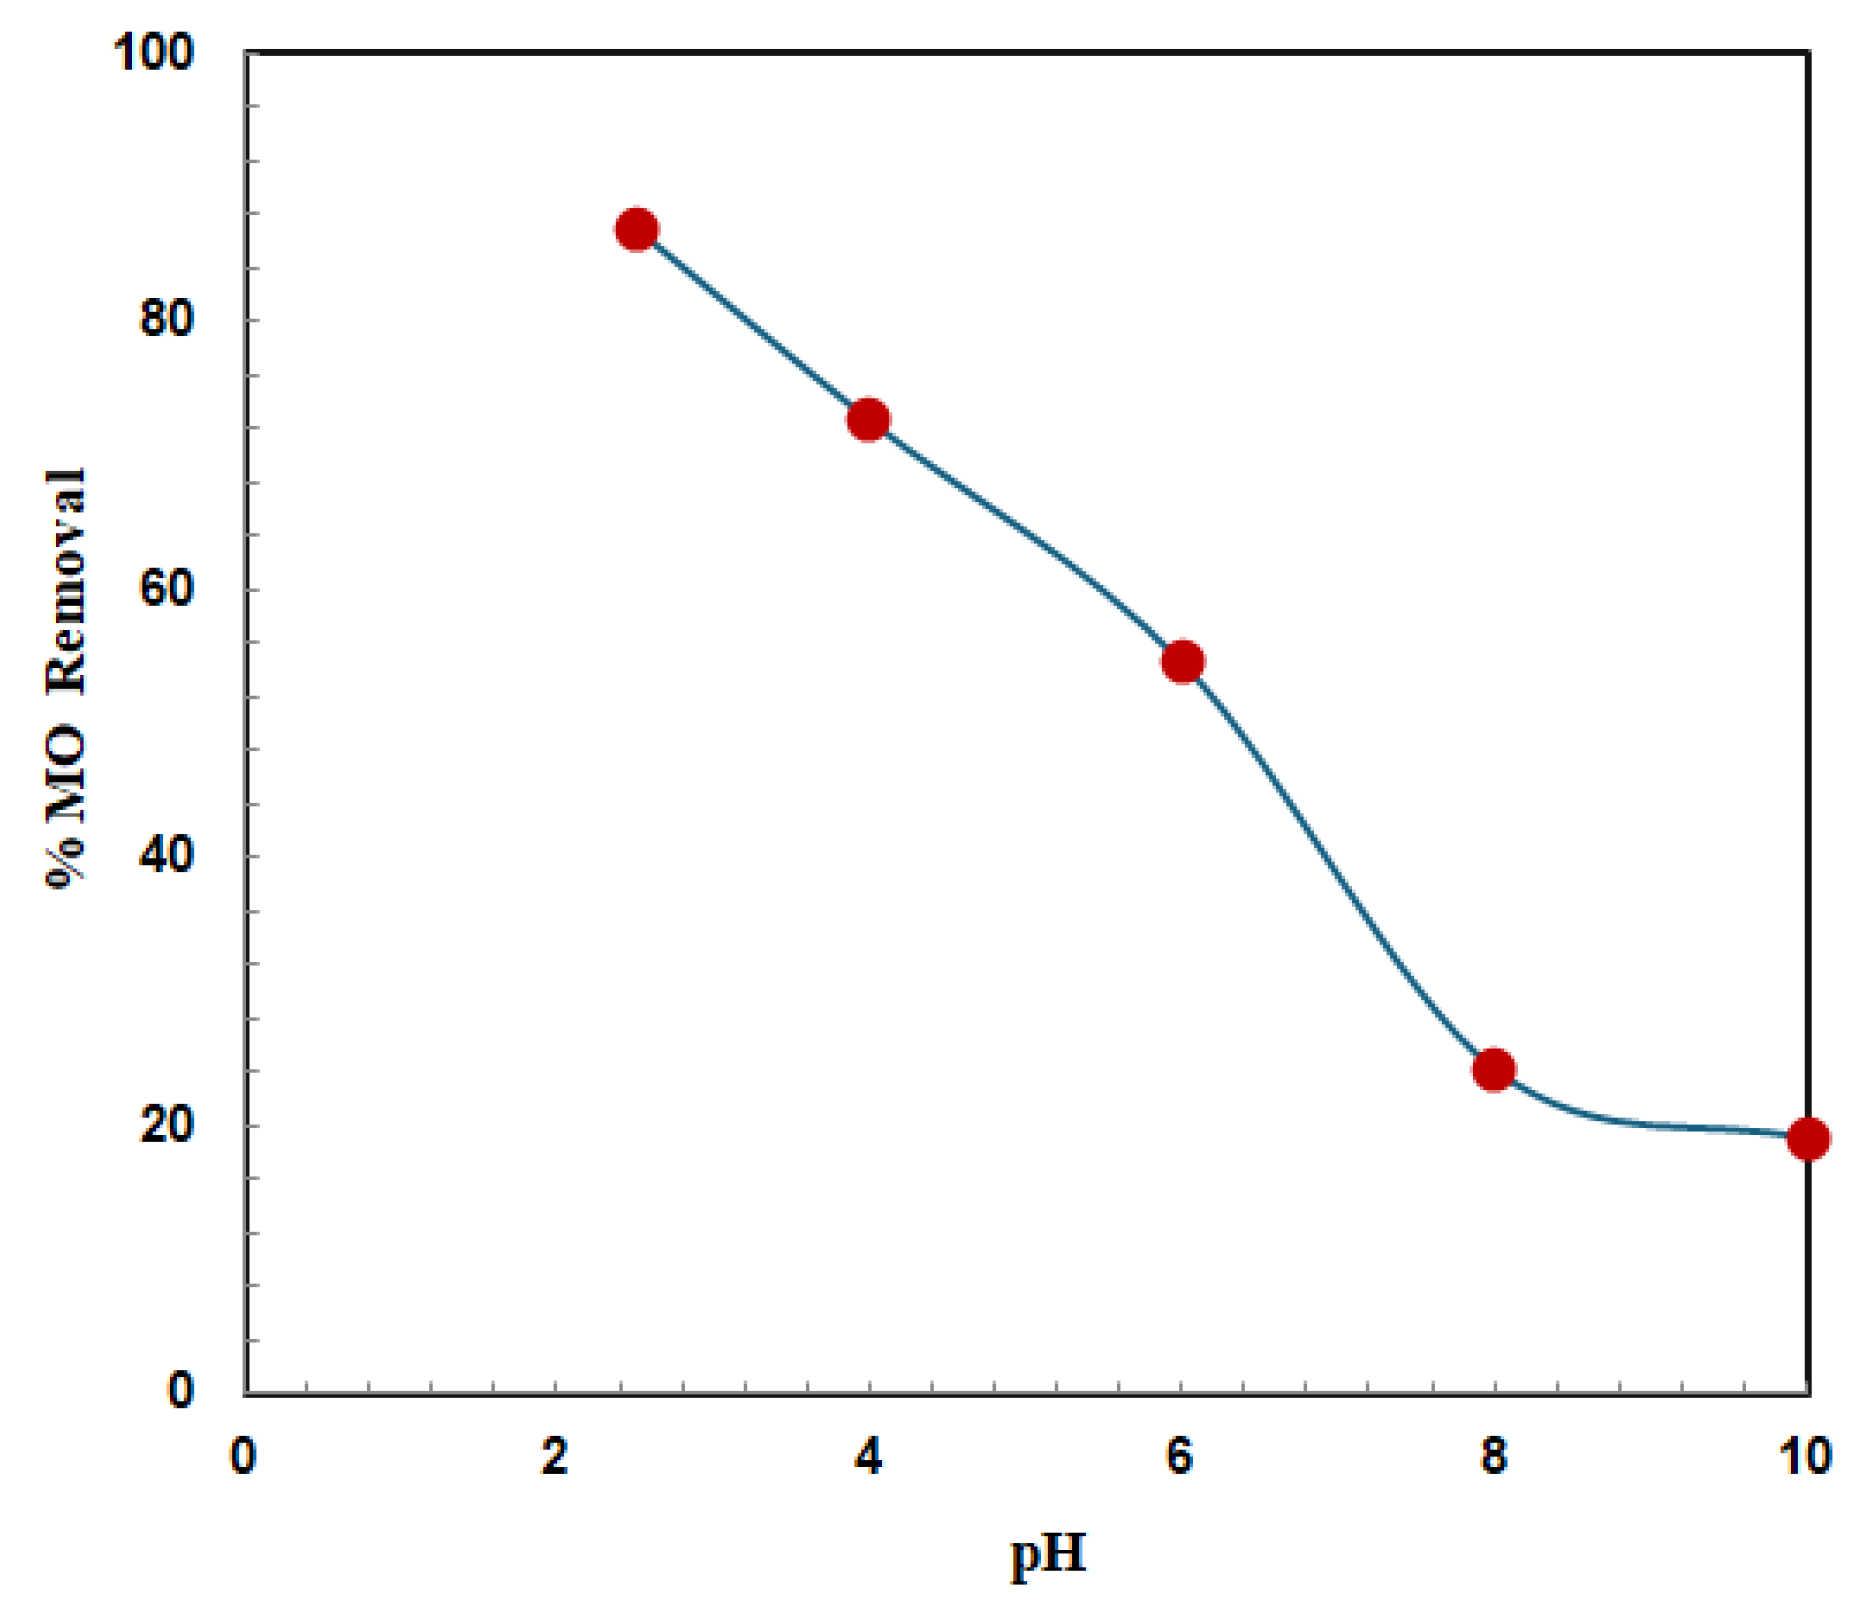
3.2.1. Effect of pH

The adsorption of methyl orange onto the Ag/TSAC nanocomposite is significantly influenced by the pH of the solution. Electrostatic interactions between the MO molecules and the nanocomposite surface charge affect the adsorption of MO onto the nanocomposite. To ascertain the elimination effectiveness as a function of the starting pH value, a fixed concentration of 35 mg/L was investigated throughout a pH range of 2.6 to 10. As seen in Figure 6. In acidic circumstances, the Ag/TSAC nanocomposite exhibited a greater removal efficiency. MO had a minimum removal efficiency of 19.12% at pH 10 and a maximum removal efficiency of 87.03 percent at pH 2. An ionic repulsion between the negatively charged Ag/TSAC nanocomposite surface and the anionic MO molecules prevents adsorption at higher pH levels [32]. The adsorption capacity of positively charged nanocomposite adsorbent surfaces is increased at low pH levels by the electrostatic interaction between them and negatively charged MO anions. Consequently, it may be concluded that pH 2 is optimal for MO adsorption. Similar results were obtained when MO was adsorbed on chitosan [33]. The constraints of the limited pH range in this study can be investigated, and strategies to expand it, such as surface modification or the application of pH buffers, can be proposed. It also emphasizes possible uses in circumstances where acid conditions are common, like industrial waste.

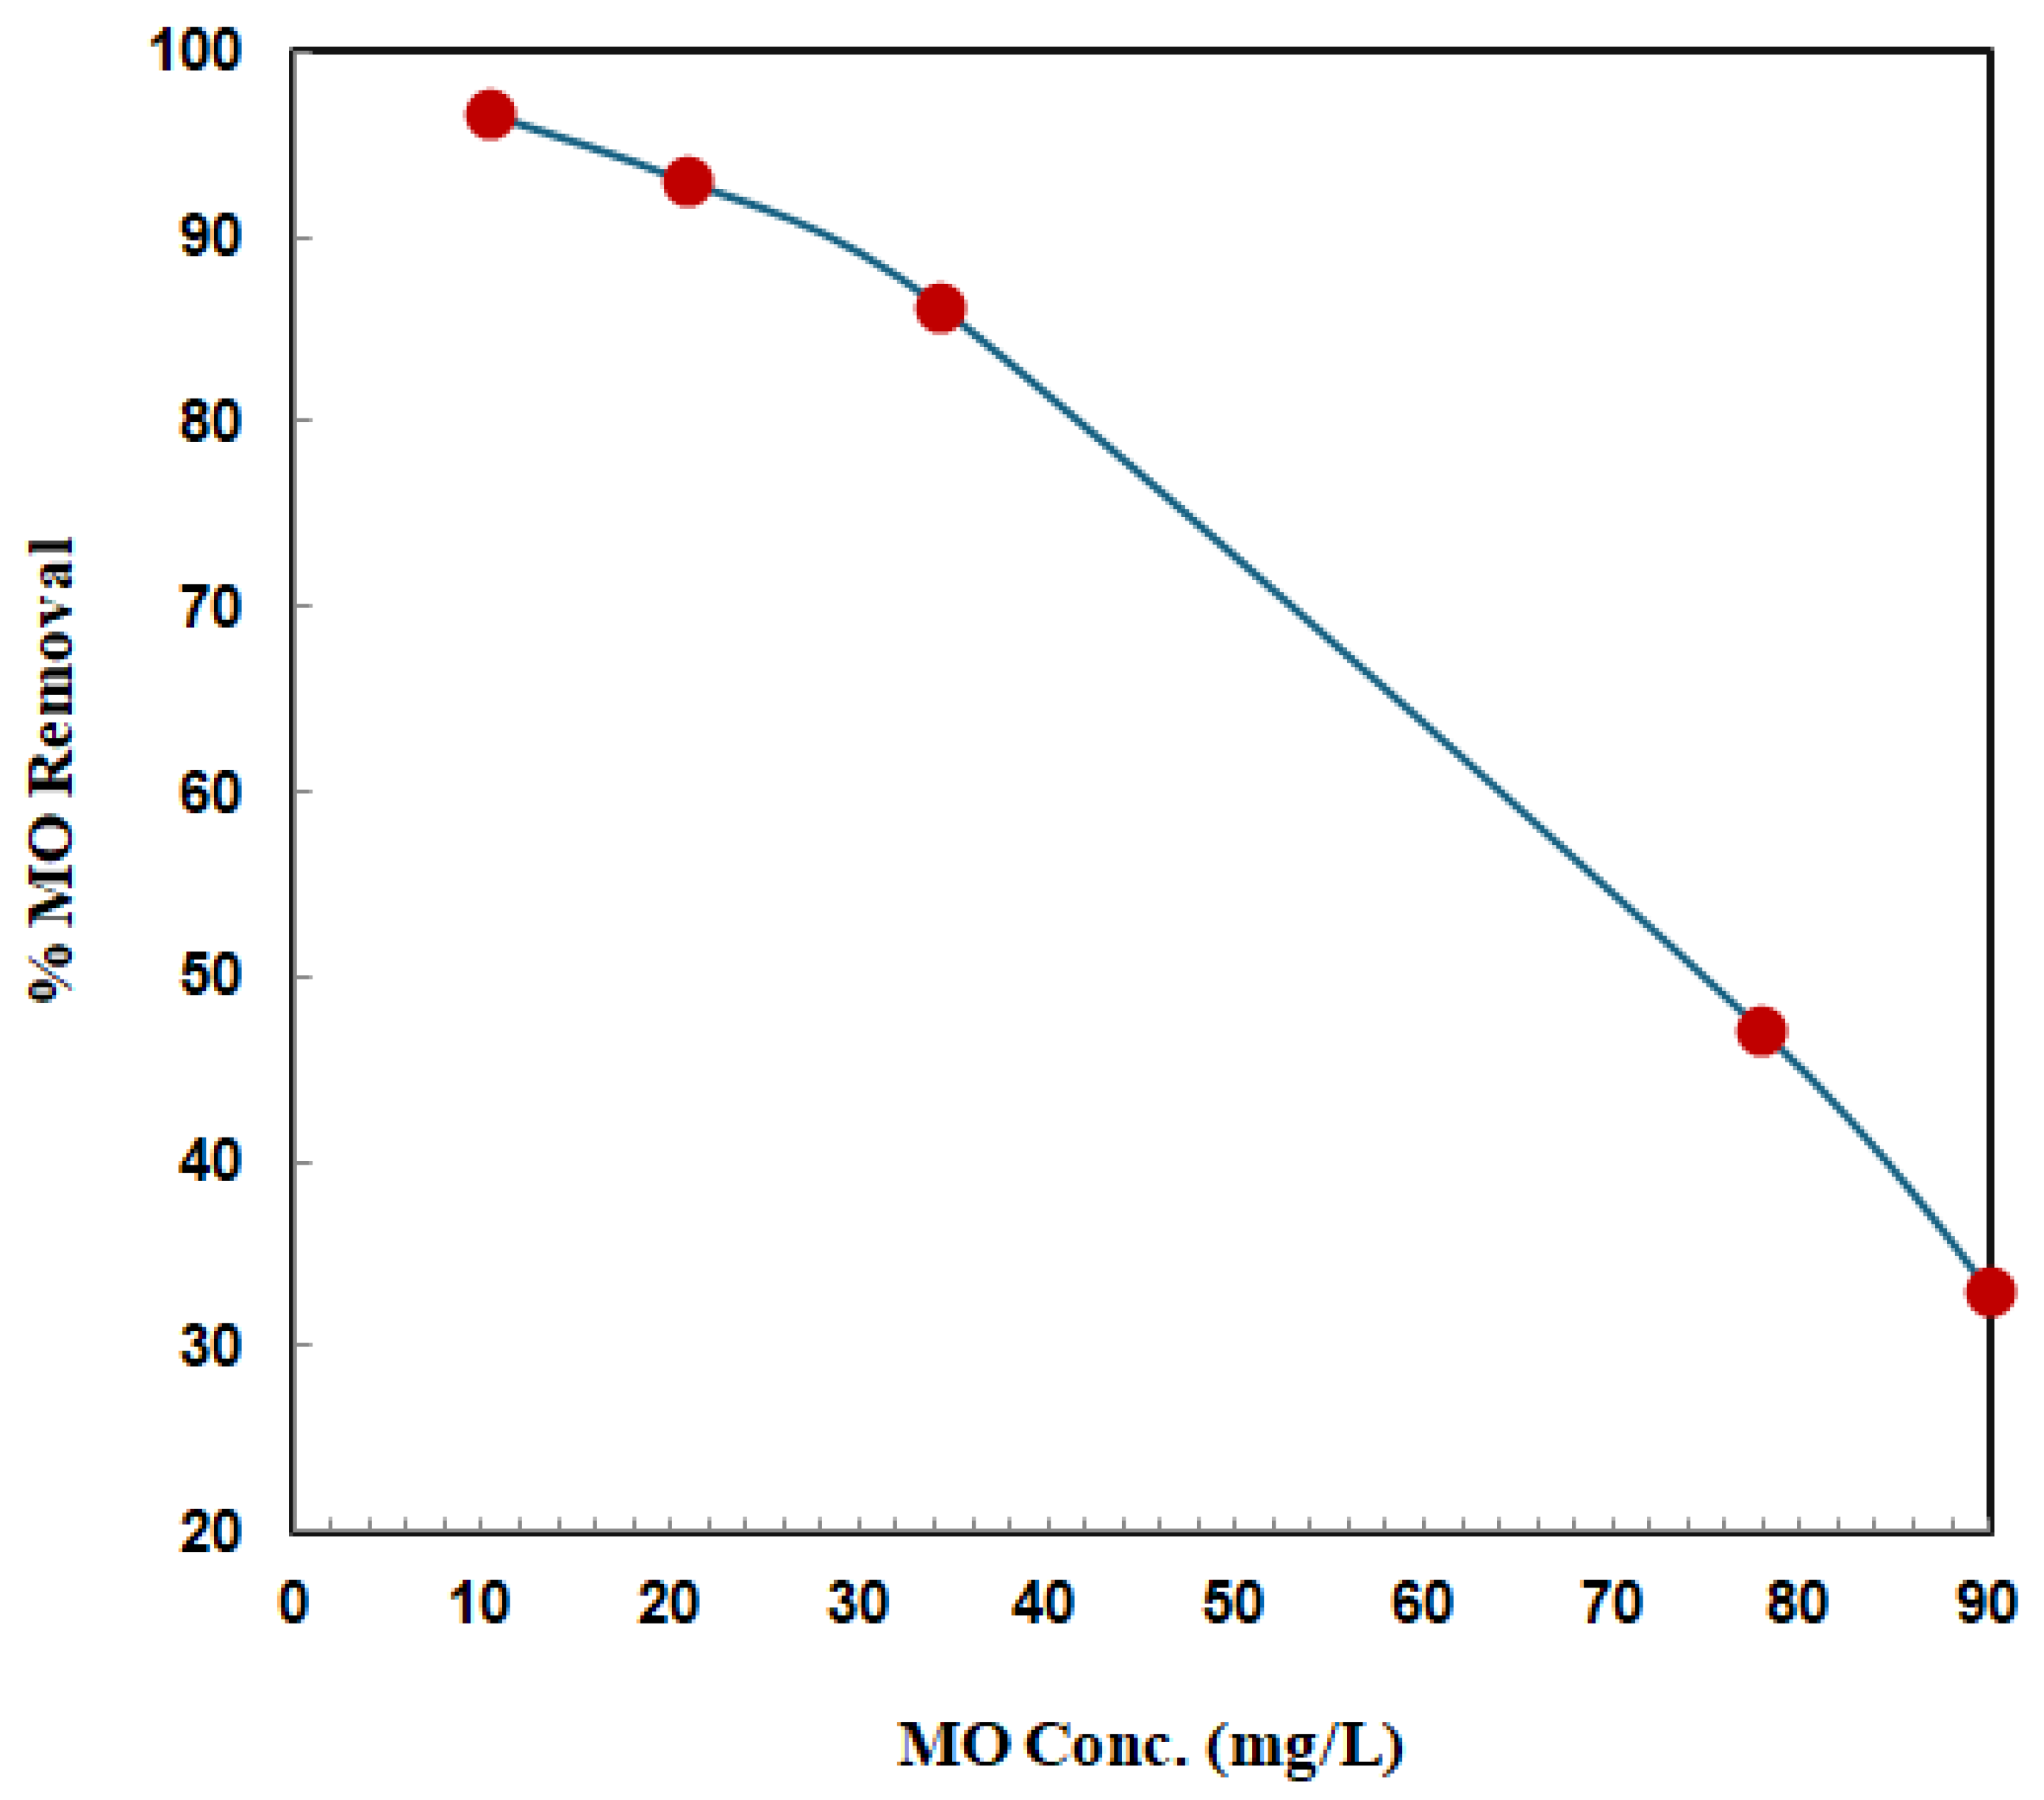
3.2.2. Effect of Initial MO Concentration

The effects of MO concentrations ranging from 10 to 90 mg/L at pH 2, 0.1 g of nancomposite, and 25 °C are displayed in Figure 7. It is evident from this figure that the starting concentration has a major impact on the adsorption of MO molecules. As the dye concentration increased from 10 mg/L to 90 mg/L, the removal efficiency dropped from 96.67% to 32.96%. This effect is caused by the Ag/TSAC nanocomposite’s surface adsorption sites being saturated at higher initial concentrations. Consequently, MO turns into an excess component and adsorption sites into the limiting element. At increasing Ci values, the Ag/TSAC nanocomposite surface’s ability to hold dye molecules diminishes, lowering remediation effectiveness even while the amount of active sites on the surface remains consistent [34]. Initial dye concentrations must be tuned for commercial use to guarantee practical removal rates and enhance adsorption effectiveness. Other studies observed similar findings [35,36].

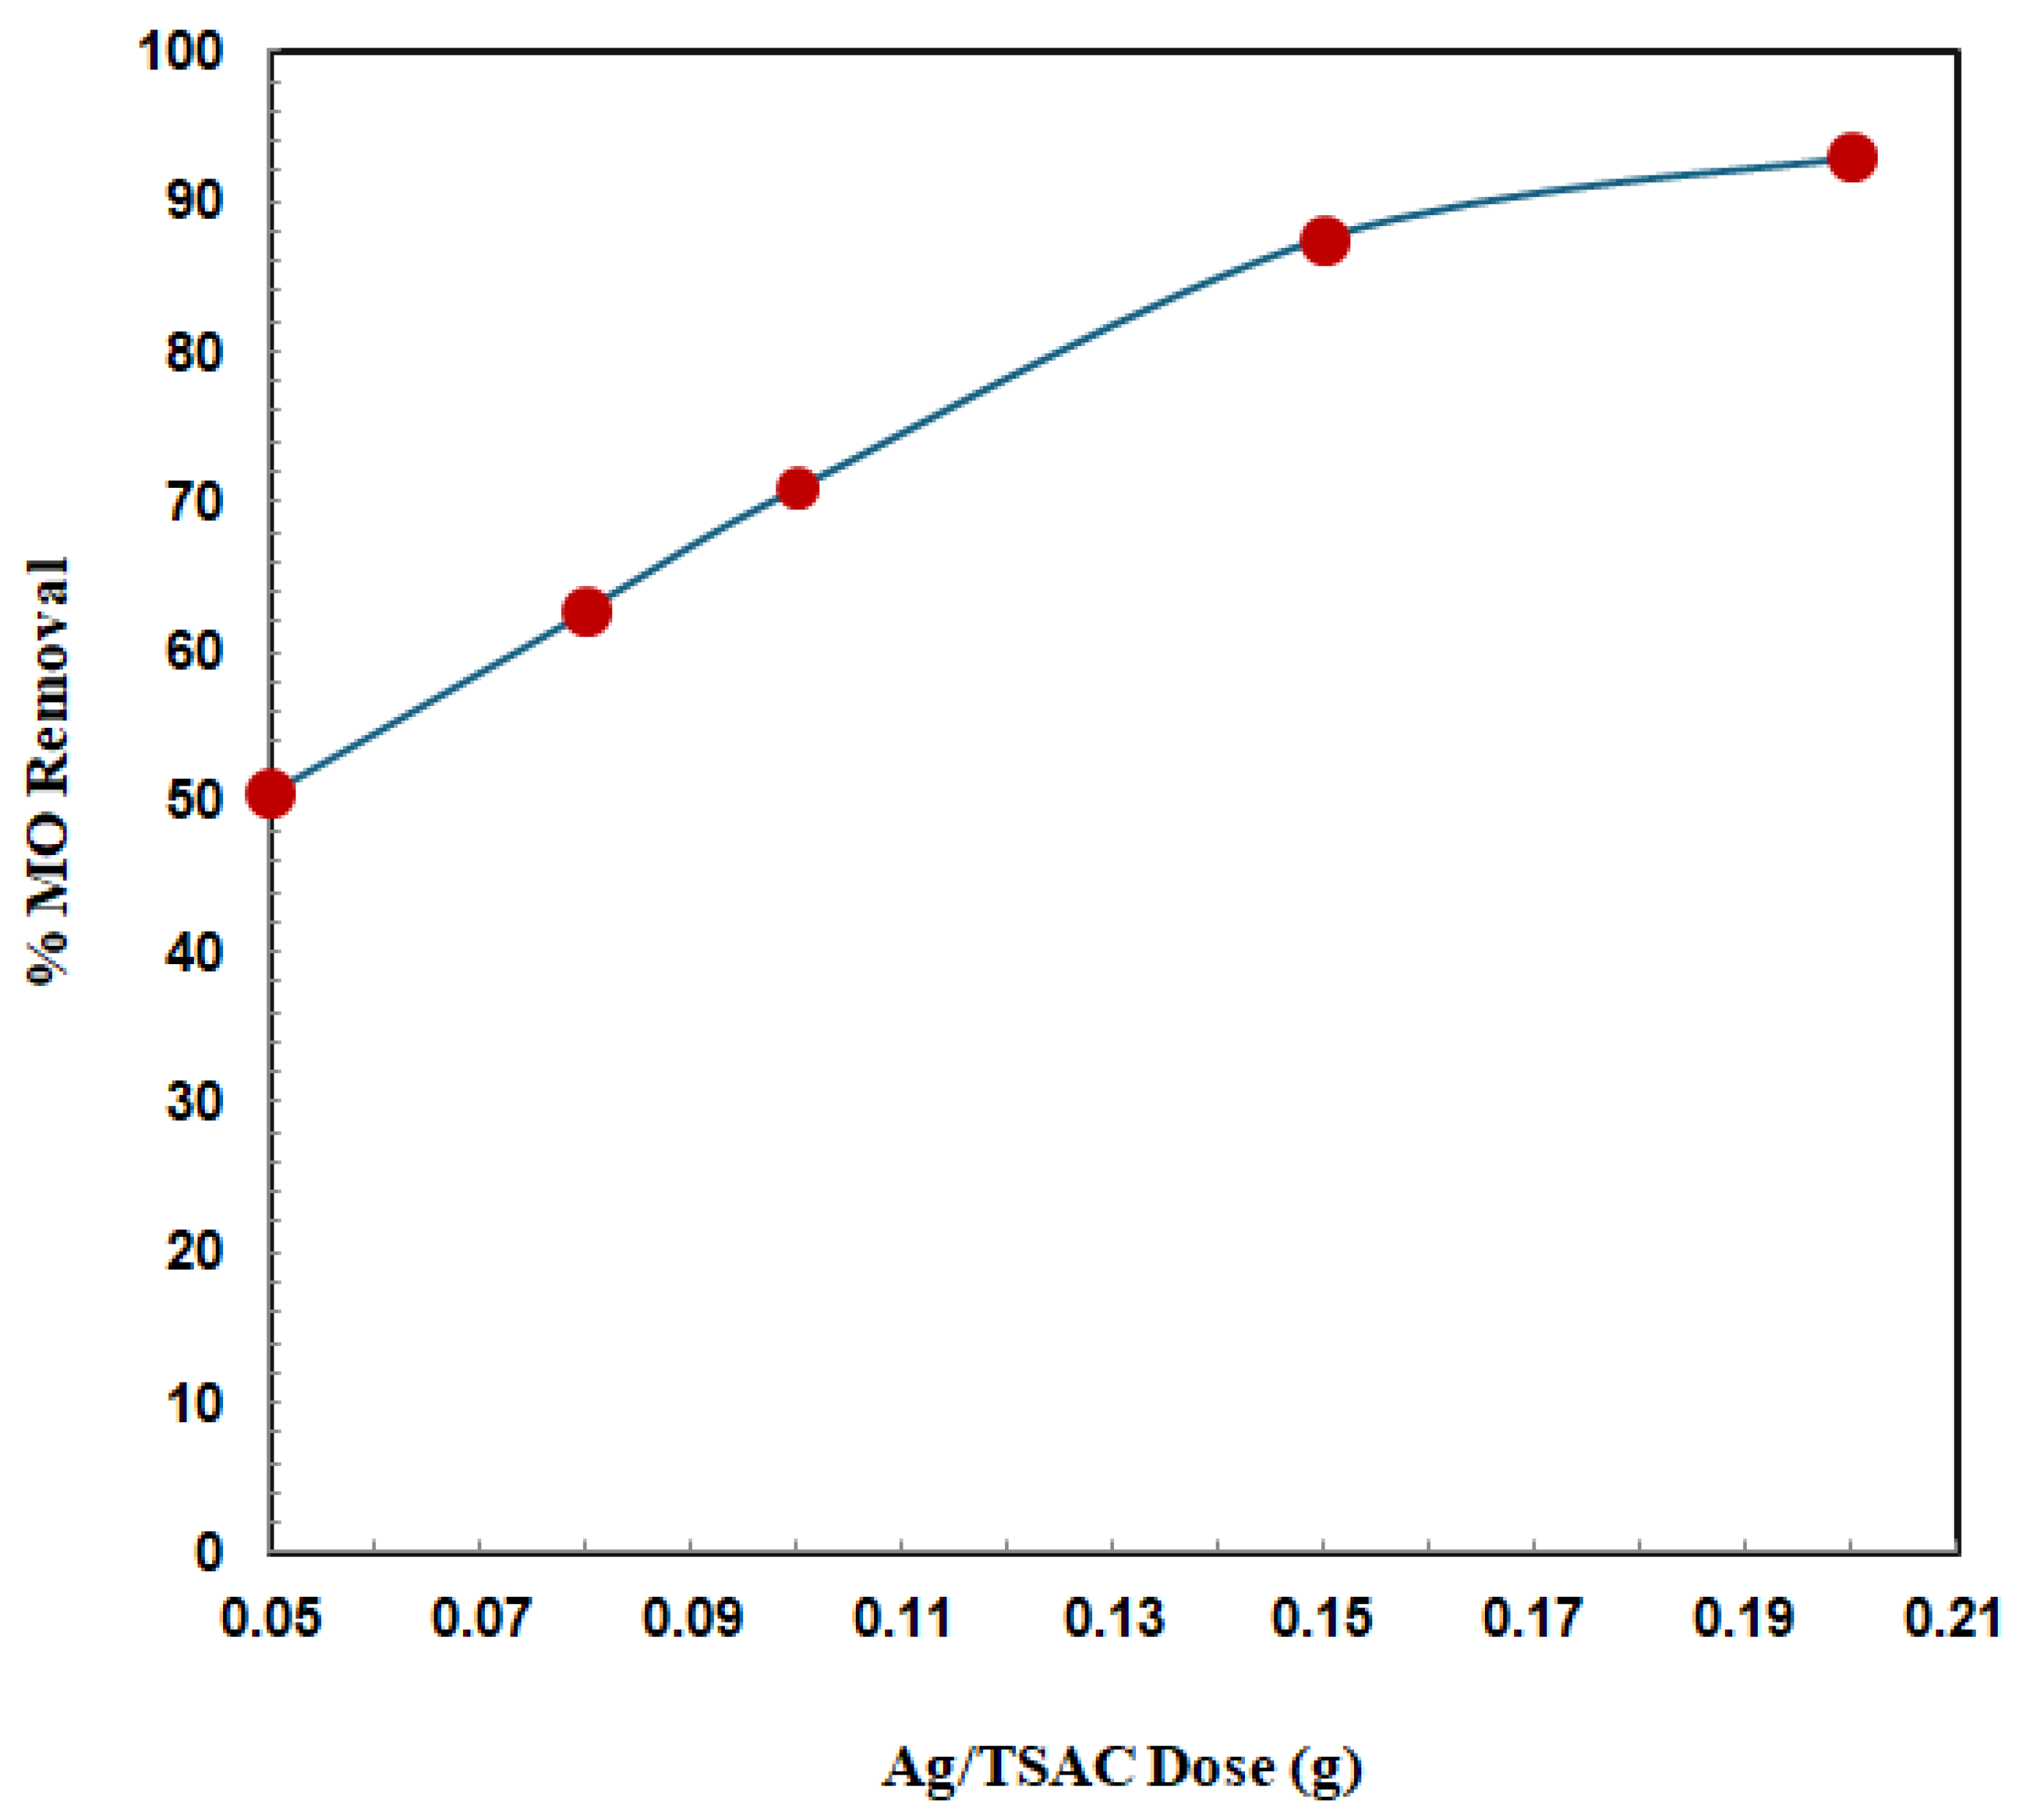
3.2.3. Effect of Adsorbent Dose

Adsorbent dosage was adjusted from 0.05 g to 0.2 g at pH 2 (Figure 8). It was found that when the adsorbent dosage was increased from 0.05 to 0.2 g, the removal clearly increased from 50.5% to 92.8% (Figure 8). The increase in removal efficiency might be due to the increase in total surface area for adsorption, providing more sites for adsorbate molecules to bind to, while the specific surface area of adsorbent remains constant. An increase in dosage of Ag/TSAC nanocomposite above 0.15 g almost did not significantly affect MO adsorption. The continuous elimination was brought on by the balance between the concentrations of MO in the solid and aqueous phases [37]. The result from this study is in agreement with the previous literature on the adsorption of MO on different adsorbents [38,39,40].

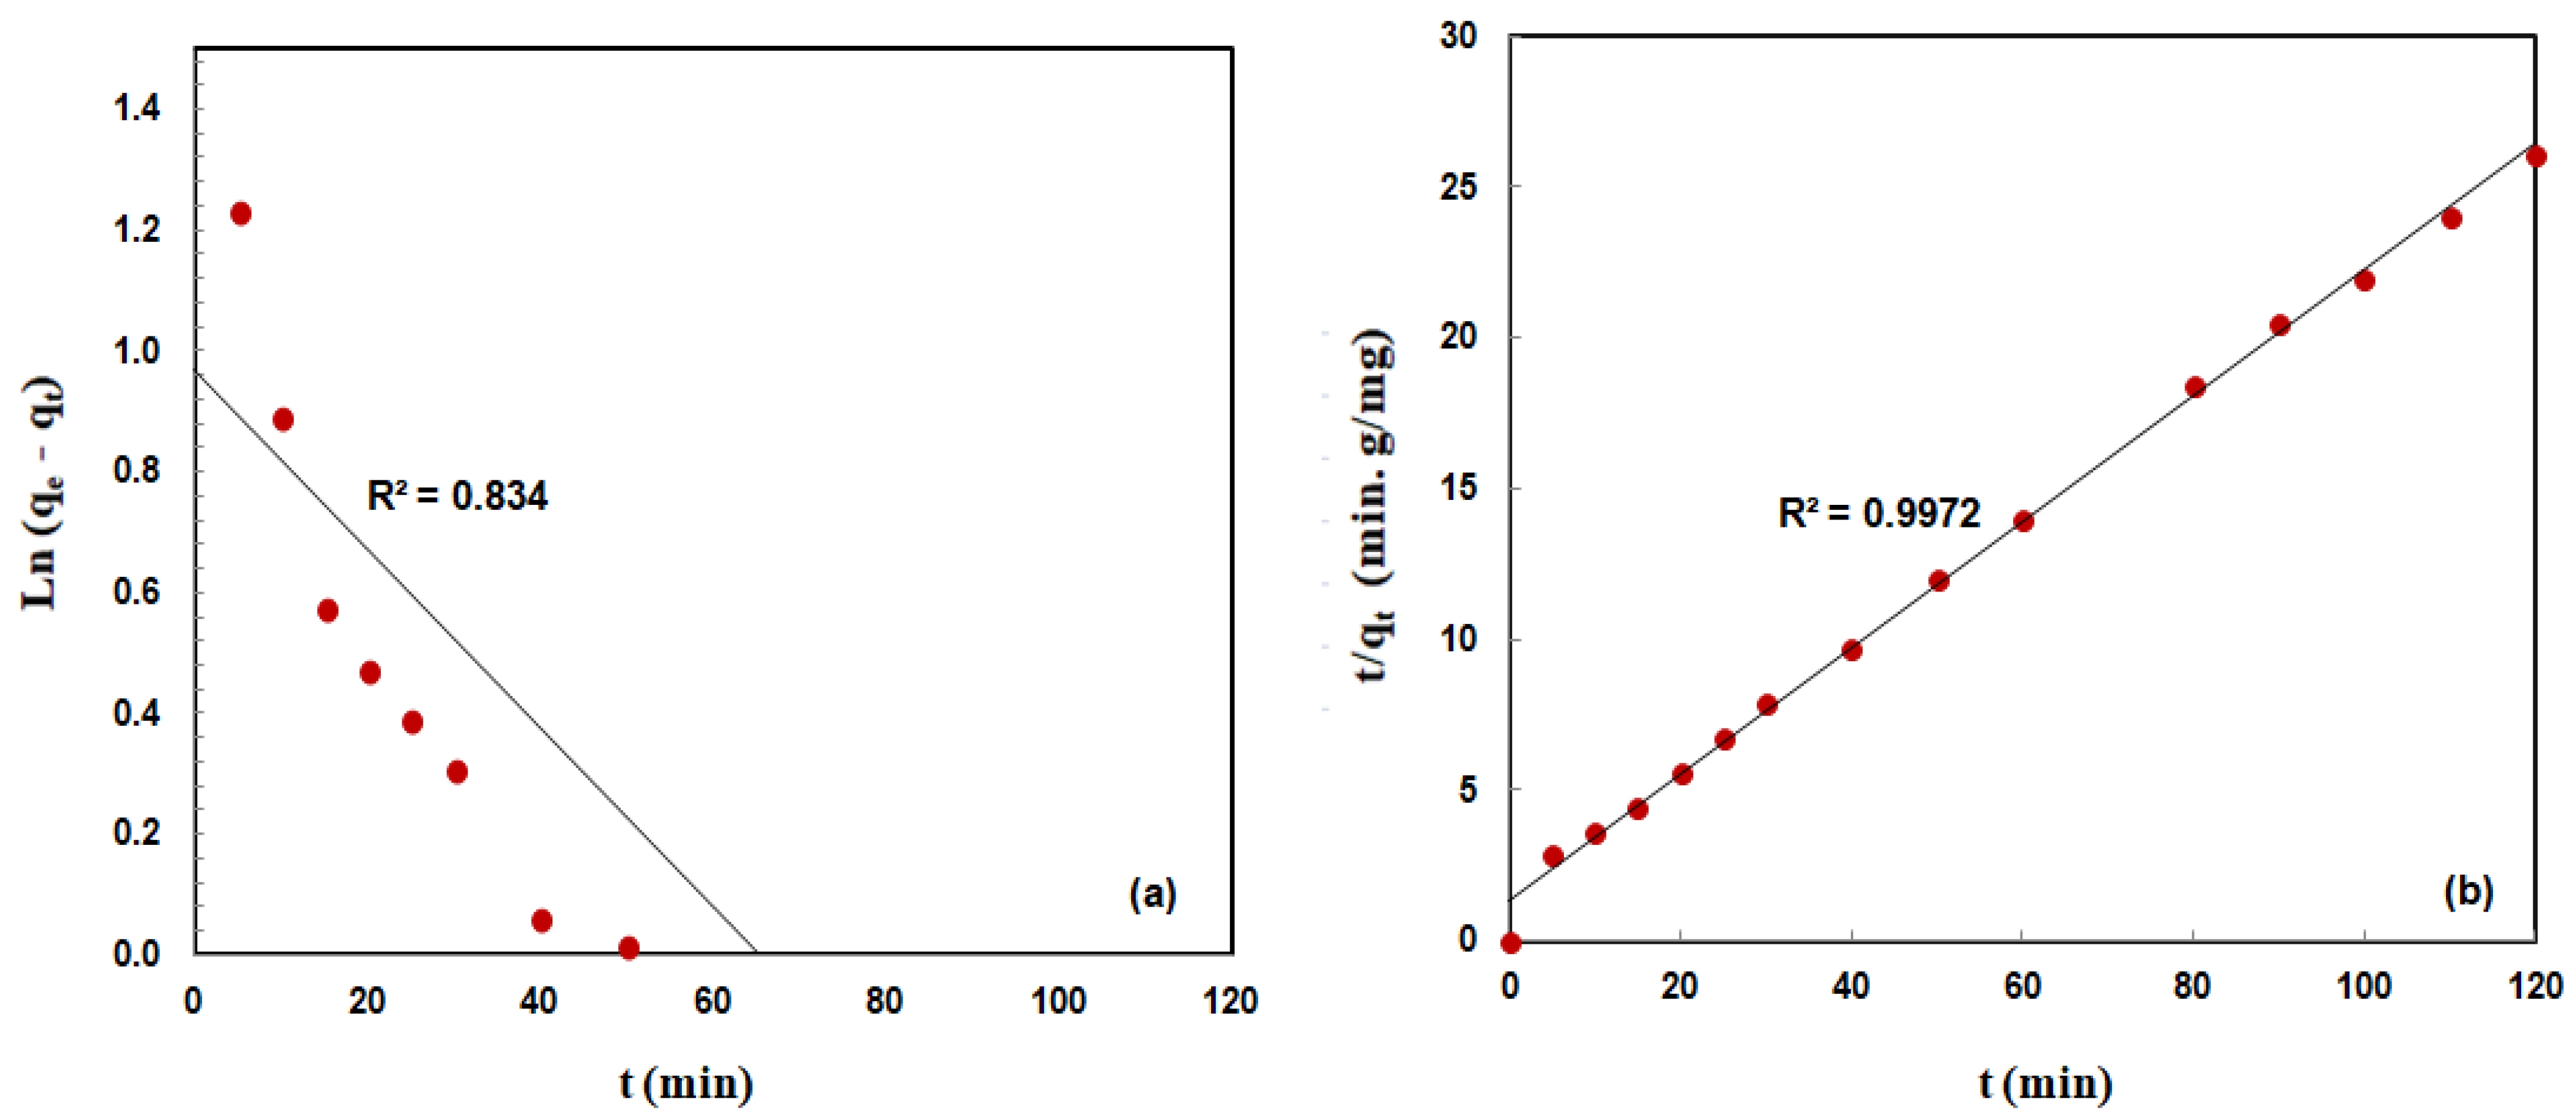
3.2.4. Adsorption Kinetics

MO adsorption on the Ag/TSAC nanocomposite was investigated using pseudo first-order and pseudo second-order kinetics [41]. An expression for a pseudo first-order equation is as follows:
ln q e q t = l n q e k 1 t  
The amounts of MO adsorbed (mg/g) at time t (min), at equilibrium, and as the adsorption constant (min−1) are denoted by Qt, qe, and k1.
The pseudo second-order model can be expressed as follows, as seen in Equation (5):
t q t = 1 k 2 q e 2 + 1 q e t
In this instance, the adsorption constant is k2 (g/mg min). Table 3 displays the computed values for k1 and k2. Figure 9 shows linear charts for first- and second-order kinetic models. Because of the graph’s great linearity and high correlation value (R2 = 0.9972), the pseudo second-order model is better suited to describe MO adsorption kinetics, as seen in Figure 9. This model suggests that chemical adsorption may be the rate-controlling stage [35]. Table 3 further reveals that theoretical qe values produced from pseudo first-order models do not match well to real values (qe,exp), although those derived from pseudo second-order models do. The results of this study on second-order kinetics are supported by several previous investigations [26,42,43].

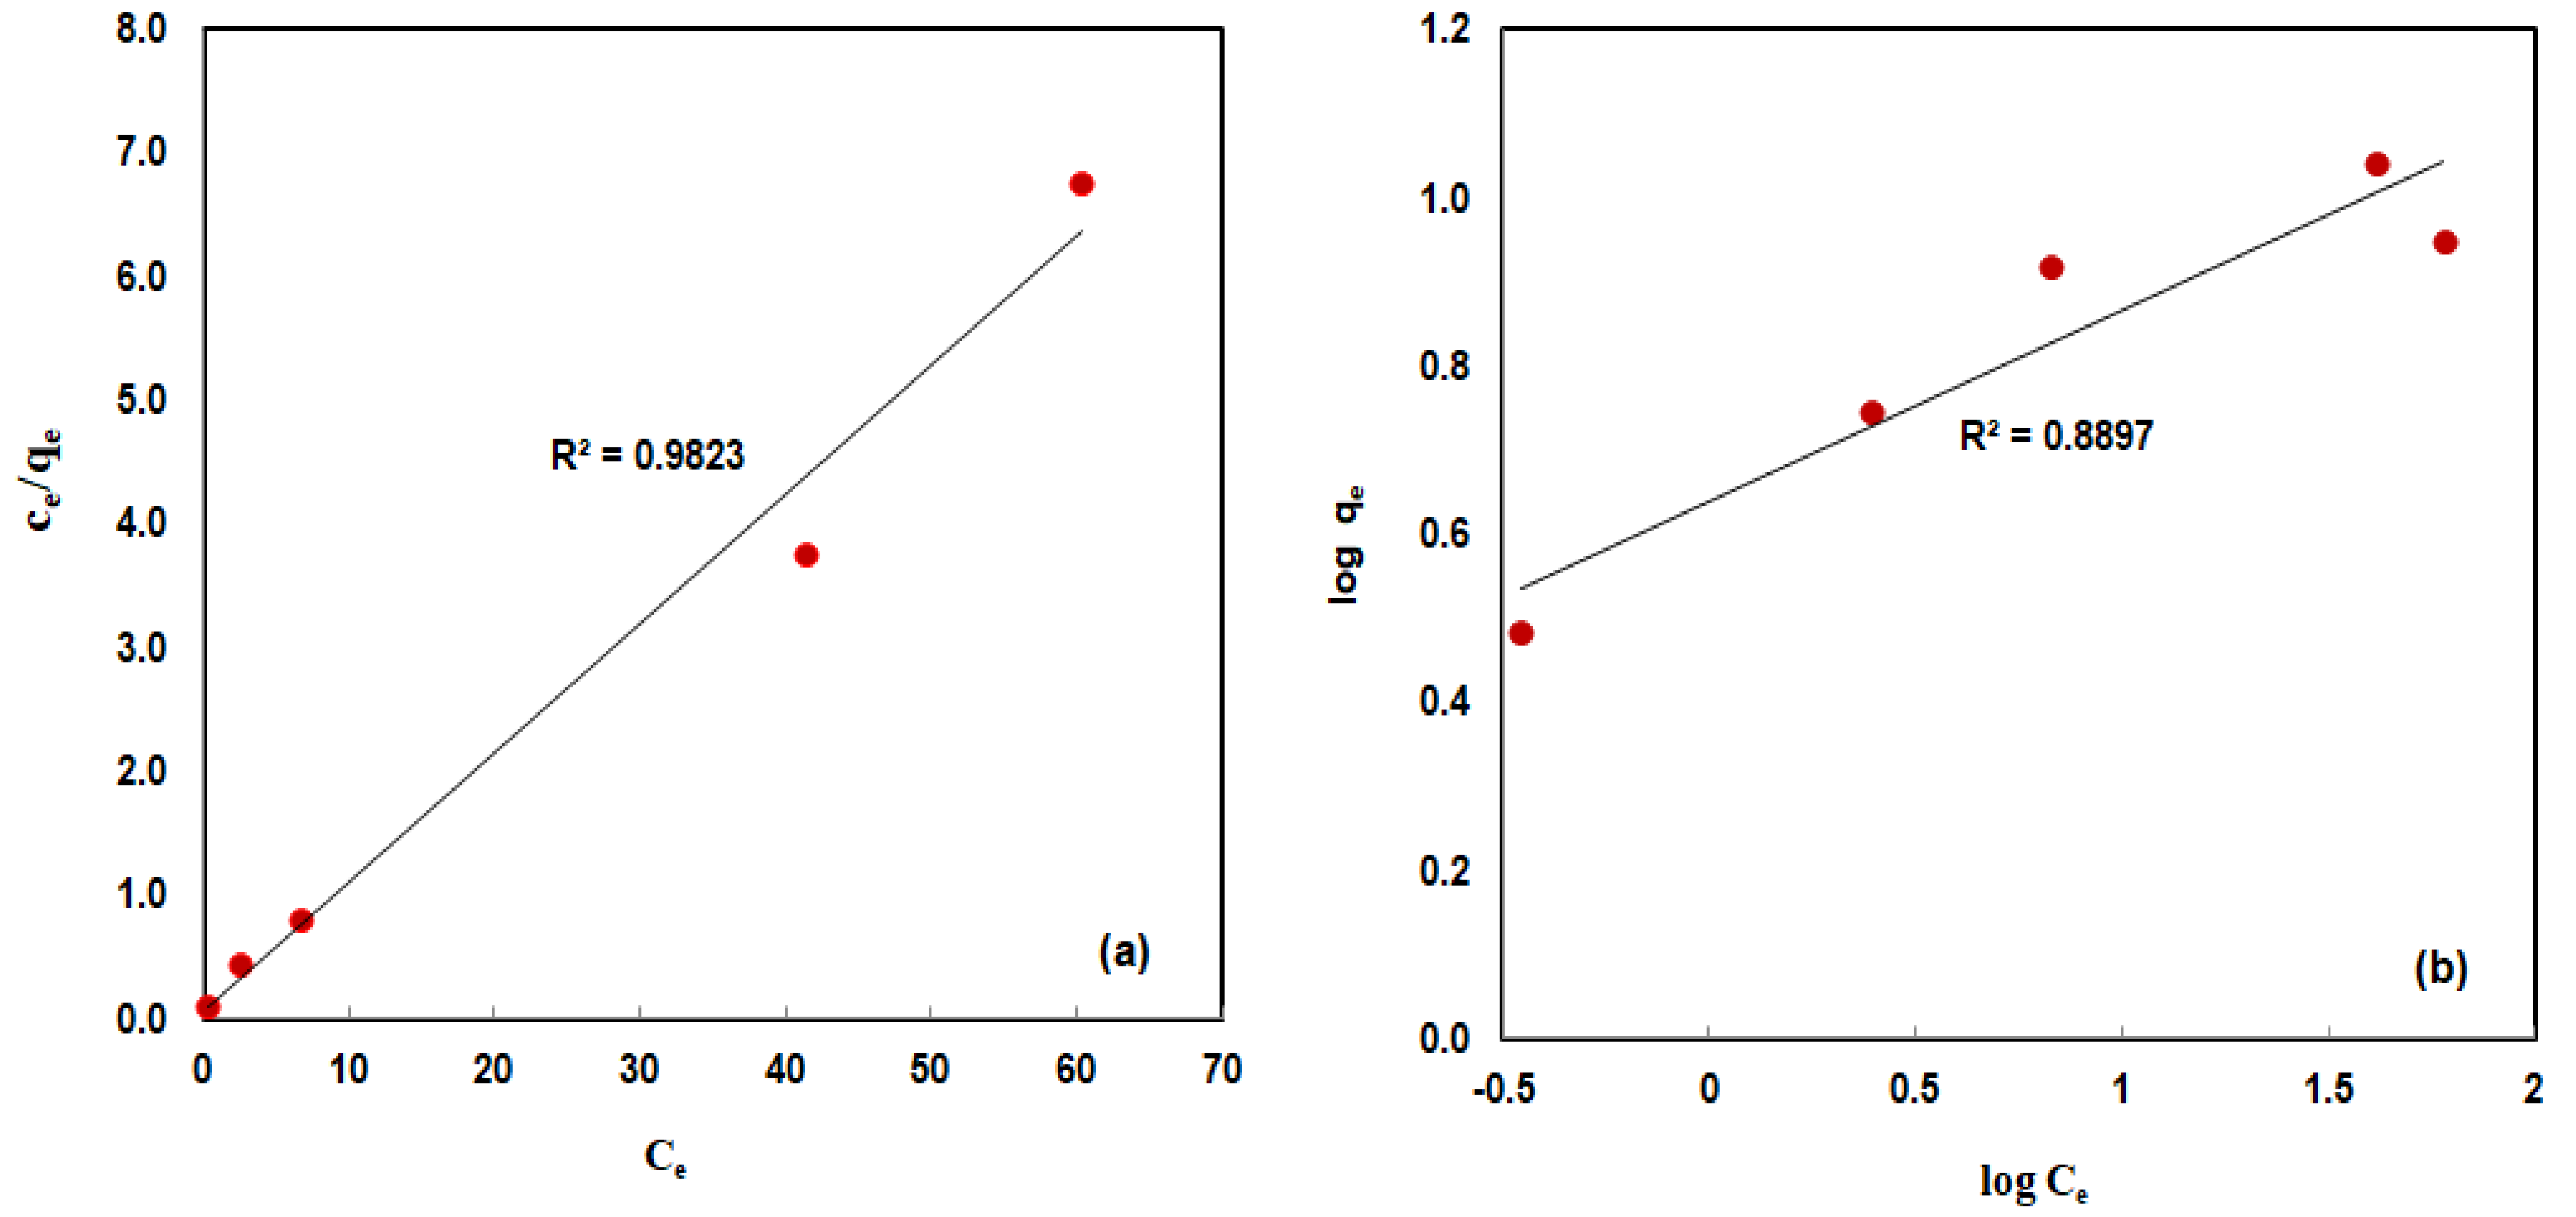
3.2.5. Isotherm Studies

Equilibrium studies explored the effect of initial MO concentration (10–90 mg/L) by shaking 0.1 g Ag/TSAC nanocomposite with different MO solutions for 24 h at 25 °C. The two isothermal equations used in this study to examine the adsorption data were the Langmuir and Freundlich isothermal equations [44]. Equations (6) and (7) provide linear equations for the Freundlich and Langmuir adsorption isotherms, respectively. The following is an expression for Langmuir’s linear expression:
  C e   q e = 1   Q m a x . b +   C e   Q m a x
where Ce is the equilibrium concentration (mg/L), qe is the quantity adsorbed at equilibrium (mg/g), and Qmax and b are Langmuir constants associated with the adsorption capacity and adsorption energy, respectively. Freundlich’s equation in its linear version states that 1/n and kF (mg/g (L/mg)1/n) are constants:
  L o g   ( q e ) =   L o g   ( K F ) + 1 n   L o g   ( C e )
The Langmuir and Freundlich models’ adsorption isotherm study plots and corresponding adsorption isotherm constant values are displayed in Figure 10 and Table 4, respectively. According to this study, favorable adsorption occurs for 1/n values less than unity [45], whereas Langmuir’s constants state that Qmax is 9.56 mg/g and b is 1.875 L/g (Table 4). As compared to Freundlich equation, The R2 value of the Langmuir equation is quite near to unity (0.9823), which describes a homogeneous system that forms monolayer [45].

3.2.6. Comparative Study of Ag/TSAC Nanocomposite with Various Adsorbents

Table 5 compares the maximum adsorption capacity (Qmax) of the Ag/TSAC nanocomposite with that of other adsorbents. A good adsorption capacity is observed for Ag/TSAC nanocomposite in comparison with other adsorbents.

4. Conclusions

This study successfully synthesized a silver nanoparticle (AgNP)-activated carbon nanocomposite and investigated its efficacy in methyl orange (MO) adsorption. The characterization of the nanocomposite confirmed the successful incorporation of AgNPs into the activated carbon matrix, resulting in a material with enhanced surface area and altered surface chemistry. TGA demonstrated good thermal stability of the nanocomposite. SEM imaging revealed a change in morphology of the nanocomposite compared to tamarind seeds, indicating successful AgNP integration. FTIR spectroscopy confirmed the existence of functional groups crucial for adsorption. The adsorption of MO on Ag/TSAC nanocomposite exhibits pseudo second-order kinetics, as indicated by kinetics studies, and the Langmuir model successfully represented the adsorption isotherm, revealing important details about the adsorption process and maximum adsorption capacity (9.56 mg/g). Enhanced adsorption capacity is ascribed to the synergistic impact of increased surface area and the presence of AgNPs, providing additional adsorption sites and potentially enhancing electrostatic interactions with the anionic MO dye. The study demonstrates the effectiveness of Ag/activated carbon nanocomposite as a sustainable, efficient nano-adsorbent for eliminating MO from aqueous solutions.

Author Contributions

Conceptualization S.D.; methodology and validation, S.D., N.A.M., H.A., J.A., and M.I.A.; investigation, and resources, S.D., N.A.M., H.A., J.A. and M.I.A.; formal analysis, S.D., N.A.M., H.A. and M.R.E.-A.; data curation, S.D. and M.R.E.-A.; writing—original draft preparation, S.D.; writing—review and editing, S.D.; project administration, and funding acquisition, S.D. All authors have read and agreed to the published version of the manuscript.

Funding

This work was supported by the Deanship of Scientific Research, Vice Presidency for Graduate Studies and Scientific Research, King Faisal University, Saudi Arabia [Grant No. KFU242400]. The authors extend their appreciation to Abdulmonem Alrashed Humanitarian Foundation [FSP-2-0022].

Data Availability Statement

Data will be made available on request.

Conflicts of Interest

The authors declare no conflict of interest.

References

  1. Badawi, A.K.; Elkodous, M.A.; Ali, G.A. Recent advances in dye and metal ion removal using efficient adsorbents and novel nano-based materials: An overview. RSC Adv. 2021, 11, 36528–36553. [Google Scholar] [CrossRef] [PubMed]
  2. Mittal, H.; Babu, R.; Dabbawala, A.A.; Alhassan, S.M. Low-Temperature Synthesis of Magnetic Carbonaceous Materials Coated with Nanosilica for Rapid Adsorption of Methylene Blue. ACS Omega 2020, 5, 6100–6112. [Google Scholar] [CrossRef]
  3. Jedla, M.R.; Koneru, B.; Franco, A.; Rangappa, D.; Banerjee, P. Recent Developments in Nanomaterials Based Adsorbents for Water Purification Techniques. Biointerface Res. Appl. Chem. 2022, 12, 5821–5835. [Google Scholar]
  4. Si, Y.; Li, J.; Cui, B.; Tang, D.; Yang, L.; Murugadoss, V.; Maganti, S.; Huang, M.; Guo, Z. Janus phenol–formaldehyde resin and periodic mesoporous organic silica nanoadsorbent for the removal of heavy metal ions and organic dyes from polluted water. Adv. Compos. Hybrid Mater. 2022, 5, 1180–1195. [Google Scholar] [CrossRef]
  5. Li, H.; Chen, X.; Shen, D.; Wu, F.; Pleixats, R.; Pan, J. Functionalized silica nanoparticles: Classification, synthetic approaches and recent advances in adsorption applications. Nanoscale 2021, 13, 15998–16016. [Google Scholar] [CrossRef]
  6. Hoijang, S.; Wangkarn, S.; Ieamviteevanich, P.; Pinitsoontorn, S.; Ananta, S.; Lee, T.R.; Srisombat, L. Silica-coated magnesium ferrite nanoadsorbent for selective removal of methylene blue. Colloids Surf. A Physicochem. Eng. Asp. 2020, 606, 125483. [Google Scholar] [CrossRef]
  7. Lu, F.; Astruc, D. Nanocatalysts and other nanomaterials for water remediation from organic pollutants. Coord. Chem. Rev. 2020, 408, 213180. [Google Scholar] [CrossRef]
  8. Rani, M.; Yadav, J.; Chaudhary, S.; Shanker, U. An updated review on synthetic approaches of green nanomaterials and their application for removal of water pollutants: Current challenges, assessment and future perspectives. J. Environ. Chem. Eng. 2021, 9, 106763. [Google Scholar]
  9. Bisaria, K.; Sinha, S.; Singh, R.; Iqbal, H.M. Recent advances in structural modifications of photo-catalysts for organic pollutants degradation—A comprehensive review. Chemosphere 2021, 284, 131263. [Google Scholar] [CrossRef]
  10. Hanoon, M.A.; Ahmed, M.J. Adsorption of Methyl Orange from Wastewater by using Biochar. Iraqi J. Chem. Pet. Eng. 2019, 20, 23–29. [Google Scholar] [CrossRef]
  11. Gallo-Cordova, A.; Lemus, J.; Palomares, F.; Morales, M.; Mazarío, E. Superparamagnetic nanosorbent for water purification: Assessment of the adsorptive removal of lead and methyl orange from aqueous solutions. Sci. Total. Environ. 2020, 711, 134644. [Google Scholar] [CrossRef] [PubMed]
  12. Haque, M.; Haque, A.; Mosharaf, K.; Marcus, P.K. Decolorization, degradation and detoxification of carcinogenic sulfonated azo dye methyl orange by newly developed biofilm consortia. Saudi J. Biol. Sci. 2021, 28, 793–804. [Google Scholar] [CrossRef] [PubMed]
  13. Liu, Y.; Xiang, Y.; Xu, H.; Li, H. The reuse of nano-TiO2 under different concentration of CO32– using coagulation process and its photocatalytic ability in treatment of methyl orange. Sep. Purif. Technol. 2022, 282, 120152. [Google Scholar] [CrossRef]
  14. Aljuaid, A.; Almehmadi, M.; Alsaiari, A.A.; Allahyani, M.; Abdulaziz, O.; Alsharif, A.; Alsaiari, J.A.; Saih, M.; Alotaibi, R.T.; Khan, I. g-C3N4 Based Photocatalyst for the Efficient Photodegradation of Toxic Methyl Orange Dye: Recent Modifications and Future Perspectives. Molecules 2023, 28, 3199. [Google Scholar] [CrossRef]
  15. Pirsaheb, M.; Hossaini, H.; Nasseri, S.; Azizi, N.; Shahmoradi, B.; Khosravi, T. Optimization of photocatalytic degradation of methyl orange using immobilized scoria-Ni/TiO2 nanoparticles. J. Nanostructure Chem. 2020, 10, 143–159. [Google Scholar] [CrossRef]
  16. Takele, T.; Angassa, K.; Abewaa, M.; Kebede, A.M.; Tessema, I. Adsorption of methylene blue from textile industrial wastewater using activated carbon developed from H3PO4-activated khat stem waste. Biomass Convers. Biorefinery 2025, 15, 4085–4108. [Google Scholar] [CrossRef]
  17. Sharma, H.; Rana, N.; Sarwan, J.; Bose, J.; Devi, M.; Chugh, R. Nano-material for waste water treatment. Mater. Today Proc. 2023, in press. [Google Scholar] [CrossRef]
  18. Vats, S.; Srivastava, S.; Maurya, N.; Saxena, S.; Mudgil, B.; Yadav, S.; Chandra, R. Advances in dye contamination: Health hazards, biodegradation, and bioremediation. In Biological Approaches to Controlling Pollutants; Woodhead Publishing: Sawston, UK, 2022; pp. 139–162. [Google Scholar]
  19. Ghadiri, M.; Hallajzadeh, J.; Akhghari, Z.; Nikkhah, E.; Othman, H.O. Green synthesis and antibacterial effects of silver nanoparticles on novel activated carbon. Iran J. Chem. Chem. Eng. 2023, 42, 3198–3205. [Google Scholar]
  20. Taha, A.; Daffalla, S. Biochar Derived from Palm Waste Supported Greenly Synthesized MnO2 Nanoparticles as a Novel Adsorbent for Wastewater Treatment. Catalysts 2023, 13, 451. [Google Scholar] [CrossRef]
  21. Jitjamnong, J.; Thunyaratchatanon, C.; Luengnaruemitchai, A.; Kongrit, N.; Kasetsomboon, N.; Sopajarn, A.; Chuaykarn, N.; Khantikulanon, N. Response surface optimization of biodiesel synthesis over a novel biochar-based heterogeneous catalyst from cultivated (Musa sapientum) banana peels. Biomass Convers. Biorefinery 2020, 11, 2795–2811. [Google Scholar] [CrossRef]
  22. Amin, M.T.; Alazba, A.A.; Shafiq, M. Removal of Copper and Lead using Banana Biochar in Batch Adsorption Systems: Isotherms and Kinetic Studies. Arab. J. Sci. Eng. 2017, 43, 5711–5722. [Google Scholar] [CrossRef]
  23. Singh, B.; Camps-Arbestain, M.; Lehmann, J. (Eds.) Biochar: A Guide to Analytical Methods; Csiro Publishing: Clayton, Australia, 2017. [Google Scholar]
  24. Shume, W.M.; Murthy, H.C.A.; Zereffa, E.A. A Review on Synthesis and Characterization of Ag2O Nanoparticles for Photocatalytic Applications. J. Chem. 2020, 2020, 5039479. [Google Scholar] [CrossRef]
  25. Eletta, O.A.; Tijani, I.O.; Ighalo, J.O. Adsorption of Pb (II) and phenol from wastewater using silver nitrate modified activated carbon from groundnut (Arachis hypogaea L.) shells. West Indian J. Eng. 2020, 43, 26–35. [Google Scholar]
  26. Alvez-Tovar, B.; Scalize, P.S.; Angiolillo-Rodríguez, G.; Albuquerque, A.; Ebang, M.N.; de Oliveira, T.F. Agro-Industrial Waste Upcycling into Activated Carbons: A Sustainable Approach for Dye Removal and Wastewater Treatment. Sustainability 2025, 17, 2036. [Google Scholar] [CrossRef]
  27. Urgel, J.J.; Briones, J.M.; Diaz, E.B., Jr.; Dimaculangan, K.M.; Rangel, K.L.; Lopez, E.C. Removal of diesel oil from water using biochar derived from waste banana peels as adsorbent. Carbon Res. 2024, 3, 13. [Google Scholar] [CrossRef]
  28. Balavairavan, B.; Saravanakumar, S.S. Characterization of Ecofriendly Poly (Vinyl Alcohol) and Green Banana Peel Filler (GBPF) Reinforced Bio-Films. J. Polym. Environ. 2021, 29, 2756–2771. [Google Scholar] [CrossRef]
  29. Keiluweit, M.; Nico, P.S.; Johnson, M.G.; Kleber, M. Dynamic Molecular Structure of Plant Biomass-Derived Black Carbon (Biochar). Environ. Sci. Technol. 2010, 44, 1247–1253. [Google Scholar] [CrossRef]
  30. Sun, K.; Keiluweit, M.; Kleber, M.; Pan, Z.; Xing, B. Sorption of fluorinated herbicides to plant biomass-derived biochars as a function of molecular structure. Bioresour. Technol. 2011, 102, 9897–9903. [Google Scholar] [CrossRef]
  31. Teixidó, M.; Pignatello, J.J.; Beltrán, J.L.; Granados, M.; Peccia, J. Speciation of the Ionizable Antibiotic Sulfamethazine on Black Carbon (Biochar). Environ. Sci. Technol. 2011, 45, 10020–10027. [Google Scholar] [CrossRef]
  32. Hameed, B.; Ahmad, A.; Aziz, N. Isotherms, kinetics and thermodynamics of acid dye adsorption on activated palm ash. Chem. Eng. J. 2007, 133, 195–203. [Google Scholar] [CrossRef]
  33. Tapan Kumar, S. Adsorption of methyl orange onto chitosan from aqueous solution. J. Water Resour. Prot. 2010, 2, 2969. [Google Scholar]
  34. Zhang, L.; Tu, L.-Y.; Liang, Y.; Chen, Q.; Li, Z.-S.; Li, C.-H.; Wang, Z.-H.; Li, W. Coconut-based activated carbon fibers for efficient adsorption of various organic dyes. RSC Adv. 2018, 8, 42280–42291. [Google Scholar] [CrossRef]
  35. Vijayakumar, G.; Dharmendirakumar, M.; Renganathan, S.; Sivanesan, S.; Baskar, G.; Elango, K.P. Removal of Congo Red from Aqueous Solutions by Perlite. Clean–Soil Air, Water 2009, 37, 355–364. [Google Scholar] [CrossRef]
  36. Popoola, T.J.; Okoronkwo, A.E.; Oluwasina, O.O.; Adebayo, M.A. Preparation, characterization, and application of a homemade graphene for the removal of Congo red from aqueous solutions. Environ. Sci. Pollut. Res. 2021, 28, 52174–52187. [Google Scholar] [CrossRef] [PubMed]
  37. Zhang, L.; Hu, P.; Wang, J.; Liu, Q.; Huang, R. Adsorption of methyl orange (MO) by Zr (IV)-immobilized cross-linked chitosan/bentonite composite. Int. J. Biol. Macromol. 2015, 81, 818–827. [Google Scholar] [CrossRef]
  38. Hambisa, A.A.; Regasa, M.B.; Ejigu, H.G.; Senbeto, C.B. Adsorption studies of methyl orange dye removal from aqueous solution using Anchote peel-based agricultural waste adsorbent. Appl. Water Sci. 2023, 13, 24. [Google Scholar] [CrossRef]
  39. Conde, M.A.; Liwaire, C.L.; Tchakounte, A.N.; Ntinkam, A.S.; Nzugue, D.L.; Kede, C.M. Removal of methyl orange (MO) by chitosan modified by zero valent iron. Int. J. Eng. Res. Technol. 2020, 9, 1542–1549. [Google Scholar]
  40. Wu, L.; Liu, X.; Lv, G.; Zhu, R.; Tian, L.; Liu, M.; Li, Y.; Rao, W.; Liu, T.; Liao, L. Study on the adsorption properties of methyl orange by natural one-dimensional nano-mineral materials with different structures. Sci. Rep. 2021, 11, 10640. [Google Scholar] [CrossRef]
  41. Zhang, B.; Wu, Y.; Cha, L. Removal of methyl orange dye using activated biochar derived from pomelo peel wastes: Performance, isotherm, and kinetic studies. J. Dispers. Sci. Technol. 2020, 41, 125–136. [Google Scholar] [CrossRef]
  42. Bekhoukh, A.; Moulefera, I.; Zeggai, F.Z.; Benyoucef, A.; Bachari, K. Anionic Methyl Orange Removal from Aqueous Solutions by Activated Carbon Reinforced Conducting Polyaniline as Adsorbent: Synthesis, Characterization, Adsorption Behavior, Regeneration and Kinetics Study. J. Polym. Environ. 2022, 30, 886–895. [Google Scholar] [CrossRef]
  43. Hussain, S.; Kamran, M.; Khan, S.A.; Shaheen, K.; Shah, Z.; Suo, H.; Khan, Q.; Shah, A.B.; Rehman, W.U.; Al-Ghamdi, Y.O.; et al. Adsorption, kinetics and thermodynamics studies of methyl orange dye sequestration through chitosan composites films. Int. J. Biol. Macromol. 2021, 168, 383–394. [Google Scholar] [CrossRef] [PubMed]
  44. Annadurai, G.; Juang, R.; Lee, D. Use of cellulose-based wastes for adsorption of dyes from aqueous solutions. J. Hazard. Mater. 2002, 92, 263–274. [Google Scholar] [CrossRef] [PubMed]
  45. Saadi, R.; Saadi, Z.; Fazaeli, R.; Fard, N.E. Monolayer and multilayer adsorption isotherm models for sorption from aqueous media. Korean J. Chem. Eng. 2015, 32, 787–799. [Google Scholar] [CrossRef]
  46. Janani, V.A.; Gokul, D.; Dhivya, N.; Nesarani, A.; Mukilan, K.; Kumar, A.S.; Kumar, M.V. Optimization Studies on Methyl Orange (MO) Dye Adsorption using Activated Carbon Nanoadsorbent of Ocimum basilicum Linn Leaves. J. Nanomater. 2023, 2023, 7969512. [Google Scholar]
  47. Ghosh, G.C.; Chakraborty, T.K.; Zaman, S.; Nahar, M.N.; Kabir, A.H. Removal of methyl orange dye from aqueous solution by a low-cost activated carbon prepared from mahagoni (Swietenia mahagoni) Bark. Pollution 2020, 6, 171–184. [Google Scholar]
  48. Matthew, E.; Roshelle, G.M. Simultaneous adsorption of acidic and basic dyes onto magnetized polypeptidylated-hemoglobin composites. Sep. Purif. Technol. 2021, 255, 117701. [Google Scholar]
  49. Tran, B.L.; Chin, H.-Y.; Chang, B.K.; Chiang, A.S. Dye adsorption in ZIF-8: The importance of external surface area. Microporous Mesoporous Mater. 2019, 277, 149–153. [Google Scholar] [CrossRef]
  50. Alhaji, N.; Nathiya, D.; Kaviyarasu, K.; Meshram, M.; Ayeshamariam, A. A comparative study of structural and photocatalytic mechanism of AgGaO2 nanocomposites for equilibrium and kinetics evaluation of adsorption parameters. Surf. Interfaces 2019, 17, 100375. [Google Scholar] [CrossRef]
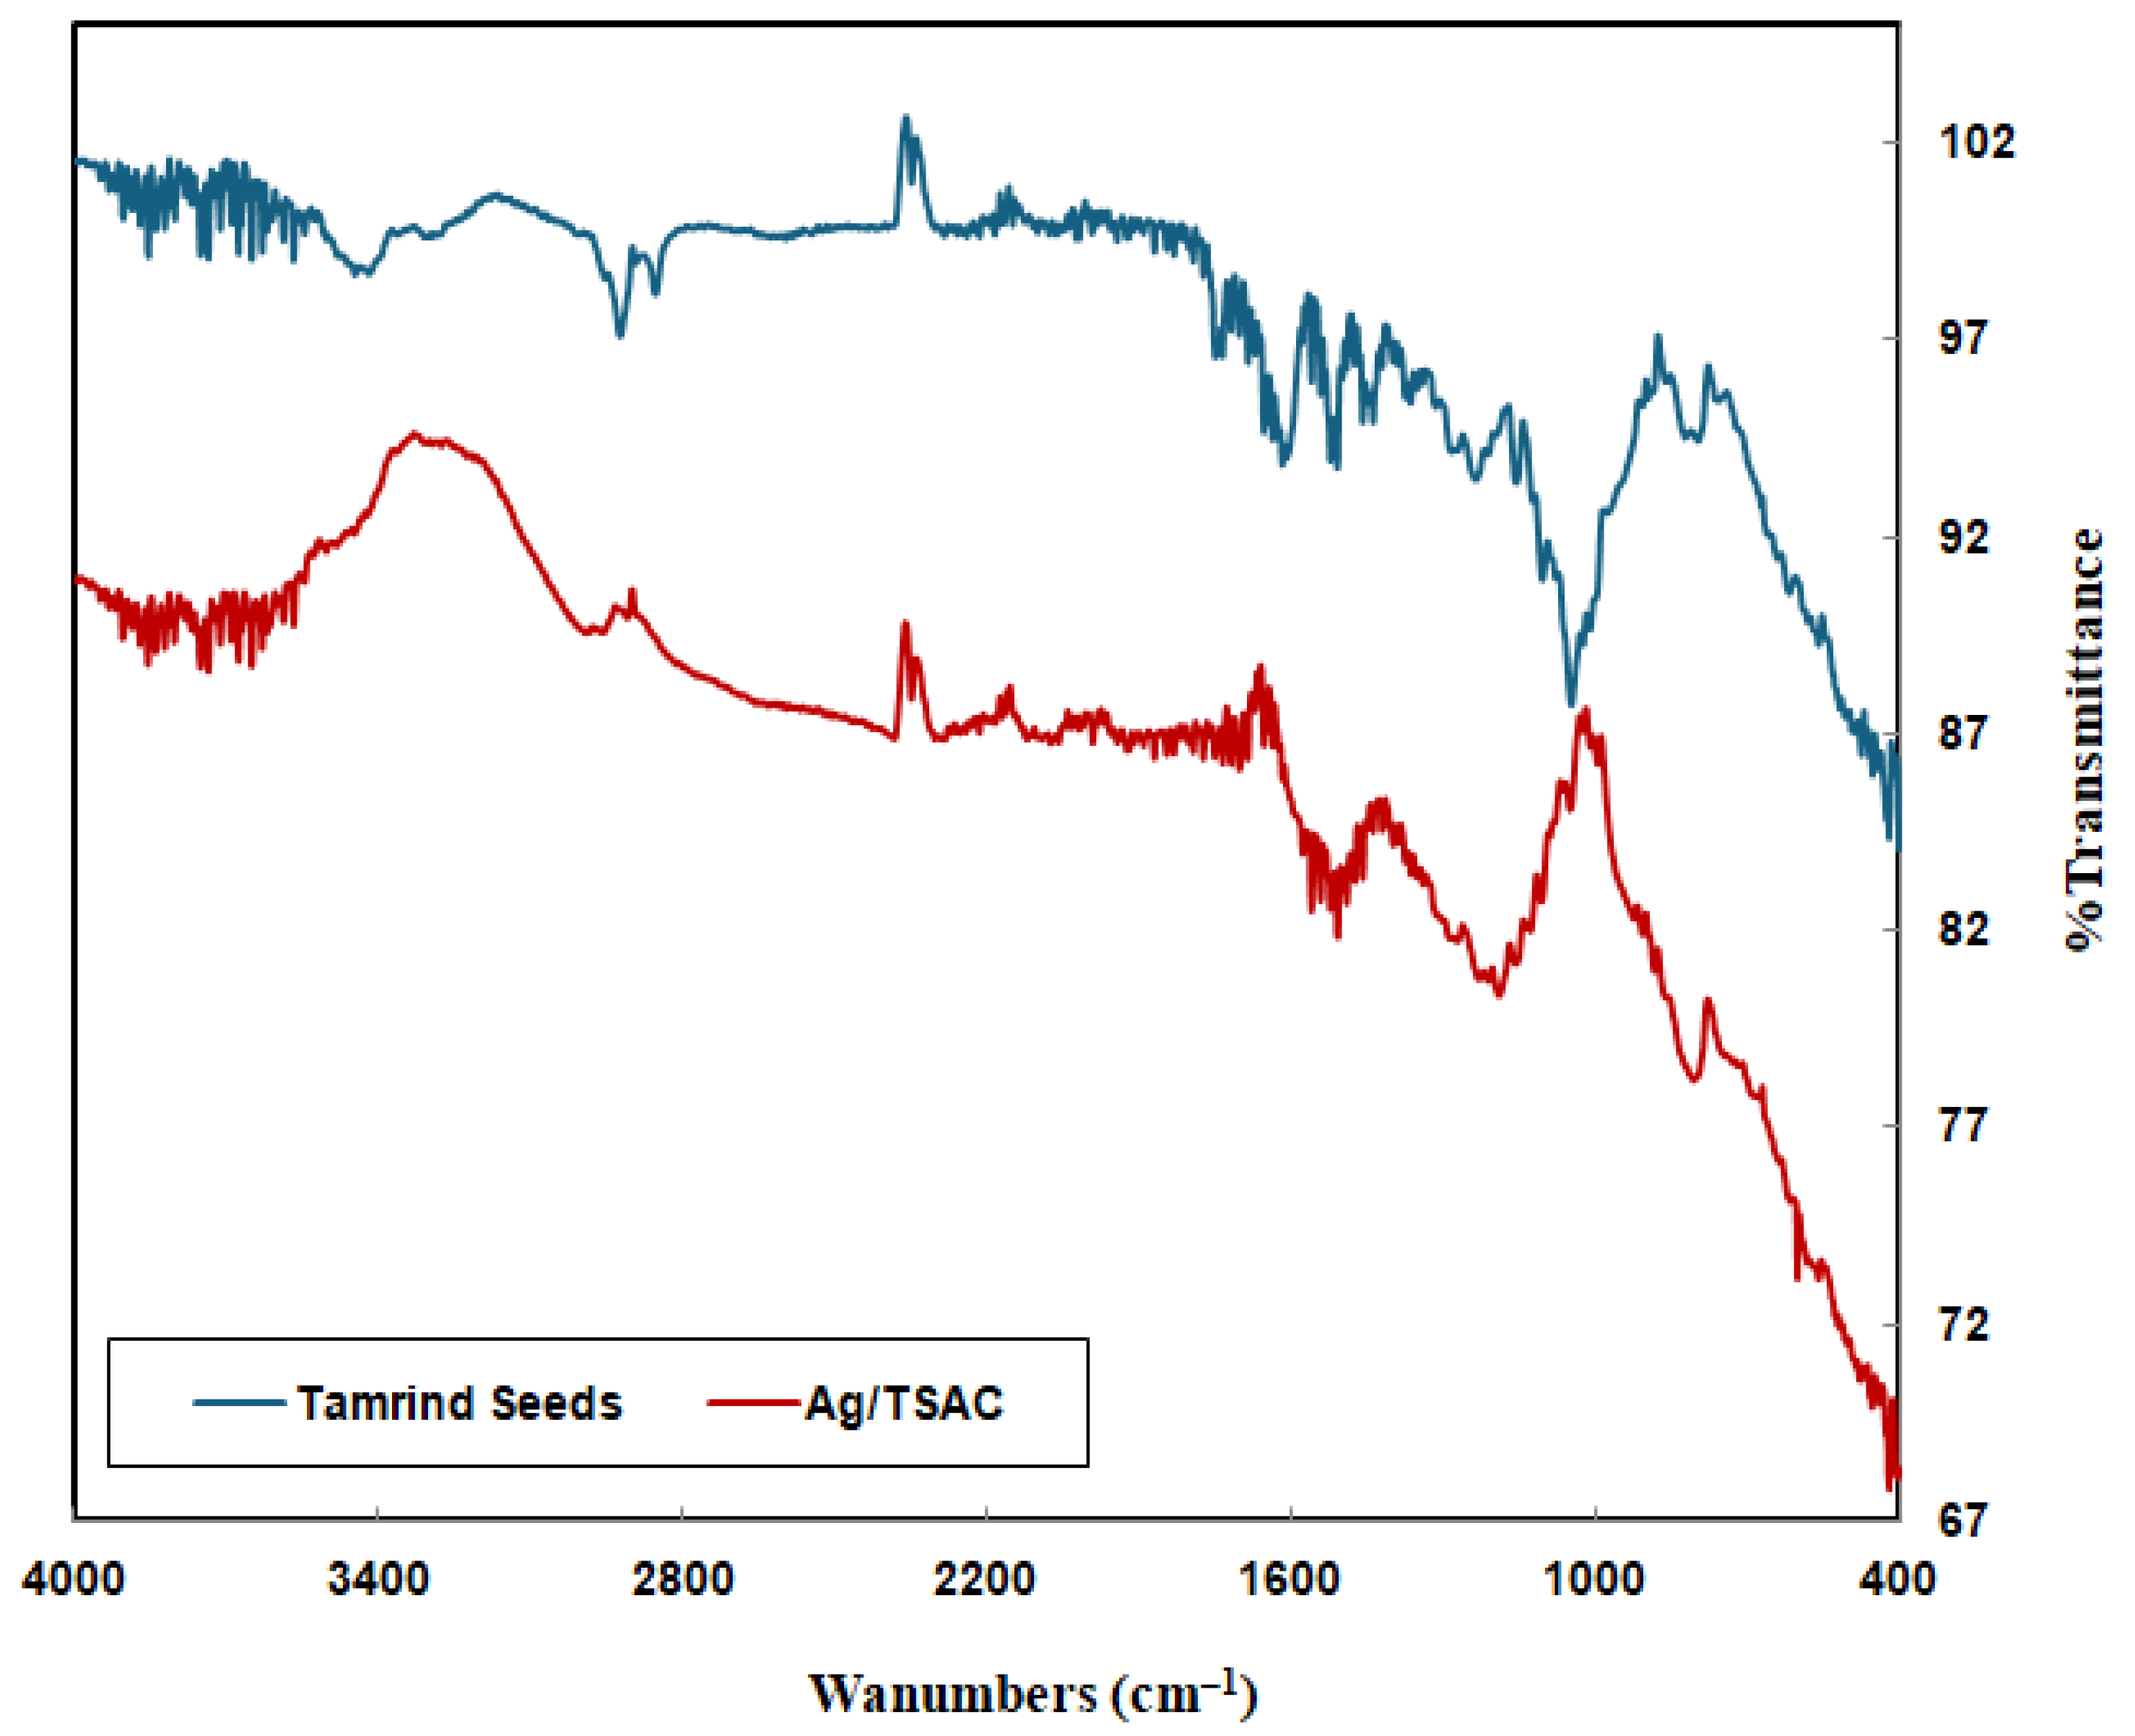
Figure 1. Synthesize Ag/TSAC nanocomposite.
Carbon 11 00027 g001
Figure 2. FTIR spectra of TS, and Ag/TSAC.
Carbon 11 00027 g002
Figure 3. SEM images of (a) TS, and (b,c) Ag/TSAC nanocomposite.
Carbon 11 00027 g003
Figure 4. TGA curves of TS, and Ag/TSAC.
Carbon 11 00027 g004
Figure 5. Effect of pHi on pHe for a 20 mL solution of 0.1 M NaCl containing 0.1 g of Ag/TSAC nanocomposite.
Carbon 11 00027 g005
Figure 6. Effect of pH on MO adsorption.
Carbon 11 00027 g006
Figure 7. Effect of initial MO concentration.
Carbon 11 00027 g007
Figure 8. Effect of Ag/TSAC nanocomposite dose.
Carbon 11 00027 g008
Figure 9. Adsorption kinetic models of MO onto Ag/TSAC nanocomposite: (a) pseudo first-order, and (b) pseudo second-order (adsorbent dosage: 0.1 g; pH 3; contact time: 0–120 min; MO Con. 40 mg/L).
Carbon 11 00027 g009
Figure 10. (a) Langmuir, and (b) Freundlich isotherm plots for adsorption of MO onto Ag/TSAC nanocomposite (adsorbent dosage: 0.1 g; at pH 3; dye concentration: 10–80 mg/L).
Carbon 11 00027 g010
Table 1. Functional groups on the Ag/TSAC nanocomposite and TS by FTIR.
ReferenceWavenumber (cm−1)Functional Groups
Ag/TSAC TS
3600–34003630.03-O–H stretching of carboxylic and alcohol
3000–28002852.72, 2924.092991.34C–H stretching of alkane
2260–21002024.512048.9C=C stretching of alkyne
1740–17301734.011749.44C–O Stretching
1650–16001608.631635.06C=C stretching of alkene
1600–15001541.121506.41C=C aromatic ring vibrations from lignin
1480–1410-1473.62C–H bending
1300–10001045.54, 1236.371205.51C–O Stretching of ether, ester
1000–675761.88788.88C=C–H bending
600–500-599.26metal–oxygen stretching
Table 2. Pore textural characteristics of TS, and Ag/TSAC nanocomposite.
SampleBET Surface Area
(m2/g)
Total Pore Volume a
(cm3/g)
Average Pore Diameter b
(nm)
Tamarind seeds1.170.028741.66
Ag/TSAC54.920.128317.75
a Single point adsorption total pore volume; b Adsorption average pore width (4 V/A by BET).
Table 3. Rate constants for kinetic models.
Initial MO
Con. (mg/L)
Pseudo First-Order ModelPseudo Second-Order Modelqe,exp (mg/g)
k1 (min−1)qe (mg/g)R2k2 (g/mg min)qe (mg/g)R2
400.01482.630.8340.0324.790.99725.16
Table 4. Isotherm models parameters.
T (°C)Langmuir IsothermFreundlich Isotherm
25b (L/mg)Qmax (mg/g)R21/nKF (mg/g (L/mg) 1/n)R2
1.8759.560.9820.22651.690.8897
Table 5. Maximum adsorption capacity values for MO dyes absorbed by various adsorbents.
Adsorbent.Qmax (mg/g)Reference
Activated carbon nanoadsorbent derived from Ocimum basilicum Linn leaves1.54 [46]
Activated carbon prepared from mahagoni bark6.071[47]
Fe2O3/polypeptidylated hemoglobin15.20[48]
Surfactant-added ZIF-810.10[49]
AgGaO2 nanocomposites11.39[50]
Ag/TSAC nanocomposite9.56This study
Disclaimer/Publisher’s Note: The statements, opinions and data contained in all publications are solely those of the individual author(s) and contributor(s) and not of MDPI and/or the editor(s). MDPI and/or the editor(s) disclaim responsibility for any injury to people or property resulting from any ideas, methods, instructions or products referred to in the content.

