Article

Optimizing Graphene Oxide Film Quality: The Role of Solvent and Deposition Technique

by
Grazia Giuseppina Politano
Department of Environmental Engineering, University of Calabria, 87036 Rende, CS, Italy
Submission received: 20 August 2024 / Revised: 30 September 2024 / Accepted: 8 October 2024 / Published: 10 October 2024
(This article belongs to the Topic Application of Graphene-Based Materials, 2nd Edition)

Abstract

:
Graphene oxide (GO) is a promising material due to its high mechanical strength, electrical conductivity, and optical transparency, making it suitable for applications like optoelectronics and energy storage. This study focuses on a simplified method of depositing and characterizing GO films via drop casting, particularly using isopropanol and water as solvents, and compares the results with reference samples of graphene produced by chemical vapor deposition (CVD) and GO films deposited by electrophoretic deposition (EPD). The optical properties of these films were analyzed using Variable Angle Spectroscopic Ellipsometry (VASE). The study revealed that GO films prepared with isopropanol exhibited a lower refractive index compared to those using water. Therefore, the research highlighted the significance of solvent choice and deposition method on the overall film quality. This work provides insights into optimizing GO film properties through careful solvent selection, contributing to the broader understanding and application of GO in advanced technologies.

Graphical Abstract

1. Introduction

Graphene oxide (GO) [1] has emerged as a key material in the field of materials science [2], owing to its exceptional properties such as high mechanical strength, electrical conductivity, and optical transparency [3]. These features position GO as an ideal candidate for numerous advanced applications [2], including optoelectronics, energy storage, transparent conductive films (TCFs), and membrane applications [4,5]. Consequently, there has been extensive research into the synthesis, deposition, and characterization of GO thin films to optimize their performance for these applications [6]. The author has also contributed significantly to this field, with several published studies on GO films [7].
Among the various techniques used for characterizing the optical properties of GO thin films, Variable Angle Spectroscopic Ellipsometry (VASE) [8] stands out due to its precision and ability to provide comprehensive data.
This study shifts the focus to a more accessible yet effective method of depositing GO films—drop casting [9]—while maintaining reference standards through the study of graphene produced by Chemical Vapor Deposition (CVD) [10] and GO films deposited by electrophoretic deposition (EPD) [11]. The decision to compare these methods by VASE arises from the need to understand the practical and performance trade-offs between a simple, widely accessible technique like drop casting and more advanced methods such as EPD and CVD.
Despite its ease of use, the drop casting method for GO films has not been thoroughly explored, particularly in terms of its impact on the optical properties of the films when characterized using VASE. Additionally, isopropanol and water were selected as solvents for the drop casting process due to their different evaporation rates and interactions with GO, which will have significant impacts on film formation. This comparison aims to thoroughly examine how solvent choice and deposition methods impact the final film quality, addressing a significant gap in the existing literature. By exploring these factors, the study intends to deepen the understanding of GO films and expand their potential applications across various technological fields.

2. Experimental Methods

A monolayer of graphene was purchased from Graphenea on 300 nm SiO2 (San Sebastián, Spain) to establish a reliable reference for the optical characterization of GO films. This graphene monolayer was produced by CVD on a copper catalyst and subsequently transferred to a SiO2/Si substrate. The physical and electrical properties of this reference film included a transparency greater than 97%, a coverage exceeding 95%, a theoretical thickness of 0.345 nm, and a sheet resistance of 450 ± 40 Ohms per square for a 1 cm × 1 cm area.
Ellipsometric measurements were conducted on all samples, including the graphene monolayer, to obtain their optical constants. The ellipsometric angles, denoted as
ψ and Δ, were measured using a J.A. Woollam M2000 F (Woollam Co., Lincoln, NE, USA) rotating compensator ellipsometer (RCE) over the wavelength range of 250 nm to 1000 nm. These measurements were carried out at varying angles of incidence between 60 and 70 degrees, in increments of 5 degrees. The optical constants n and k of graphene, as well as those of the other samples, were derived from multiple measurements taken at these different angles, rather than a single fixed incidence, allowing for more reliable modeling results.
The thickness of all samples, including the graphene layer, was estimated through optical modeling using the VASE model. The ellipsometric spectra were analyzed by modeling each sample as a stack of layers, with each layer characterized by its thickness, complex refractive index, and composition. These parameters were determined by fitting the experimental data using the Levenberg–Marquardt algorithm [12].
The mathematical model used in this study, implemented via the WVASE32® software (version 3.690) [13], employs a collection of Lorentz oscillators [8] to represent the optical behavior of the material. The complex dielectric function ε is expressed as
h v = ε 1 + i ε 2 = ε + k A k E k 2 h v 2 i B k h v
In the Lorentz model, E is the energy of the incident photons, ε is the real part of the dielectric function when E , A k is the strength expressed in e V 2 , B k is the broadening in e V , and E k is the central energy of the k-th oscillator. A k also represents the percentage contribution of oscillator k to the whole system. In this model, unknown parameters of film thickness and Lorentz parameters for GO are defined as fitting variables. The thickness of all other reference samples was GO films made by electrophoretic deposition (EPD) [14]. EPD is a two-step process where charged particles in a liquid are moved towards an electrode by applying an electric field, followed by the deposition of these particles on the electrode. EPD was only applicable to electrically conductive substrates such as copper, nickel, aluminum, stainless steel, and titanium.
The cathode used in this experiment was platinum and the anode was titanium sputtered using DC magnetron sputtering with a power of 100 W.
GO concentrations of 0.25 mg/mL were used, with a direct current (DC) voltage of 10 V applied for deposition times ranging from 1 to 10 min. The optimal deposition time was found to be between 1 and 2 min, as longer deposition times led to randomly stacked GO sheets. Ellipsometry was performed on the EPD samples in the wavelength range of 250–1000 nm.
The drop casting method [15] produced noteworthy results in the preparation of GO thin films. In this method, glass surfaces were used as substrates. To enhance the hydrophilicity of the glass, the slides were immersed in a “Piranha solution”, which typically consists of a 3:1 mixture of concentrated sulfuric acid and 30% hydrogen peroxide. After treatment with the Piranha solution for a day, the glass substrates were thoroughly dried using argon gas. GO multilayer films were then prepared by pipetting the GO solution onto the treated glass substrates and heating them at 80 °C until the film achieved a relatively homogeneous appearance, spreading uniformly across the surface. Several concentrations of GO solutions, ranging from 0.017 mg/mL to 0.5 mg/mL, were tested in different solvents, including water and isopropanol. The concentration of 0.1 mg/mL was chosen for reporting because, at this concentration, the resulting GO films were the most uniform. A significant challenge encountered during this process was the exfoliation of GO in high boiling point solvents, which posed difficulties in the deposition of individual flakes. The slow evaporation rate of these solvents allowed sufficient time for GO flakes to aggregate, leading to non-uniform films.
To mitigate this challenge, the exfoliation of GO at relatively high concentrations in low boiling point solvents, such as isopropanol (boiling point: 82.6 °C), was investigated. These solvents facilitated more effective exfoliation and deposition, reducing the aggregation of GO flakes and resulting in more uniform films. Dynamic Light Scattering (DLS) measurements were performed to further characterize the size distribution of the GO particles. The results indicated an average particle size distribution ranging between 500 and 700 nm, as shown in Figure S1 (Supplementary Materials). This analysis supports the discussion by providing insights into the particle dimensions, which influence the uniformity and deposition quality of the GO films. Additionally, the energy band gap of GO films was calculated from the transmittance spectra, with representative results presented in Figure S2 (Supplementary Materials). These calculations provide critical information about the optical properties of GO films in different solvents (water and isopropanol).

3. Results and Discussion

3.1. CVD Graphene Samples

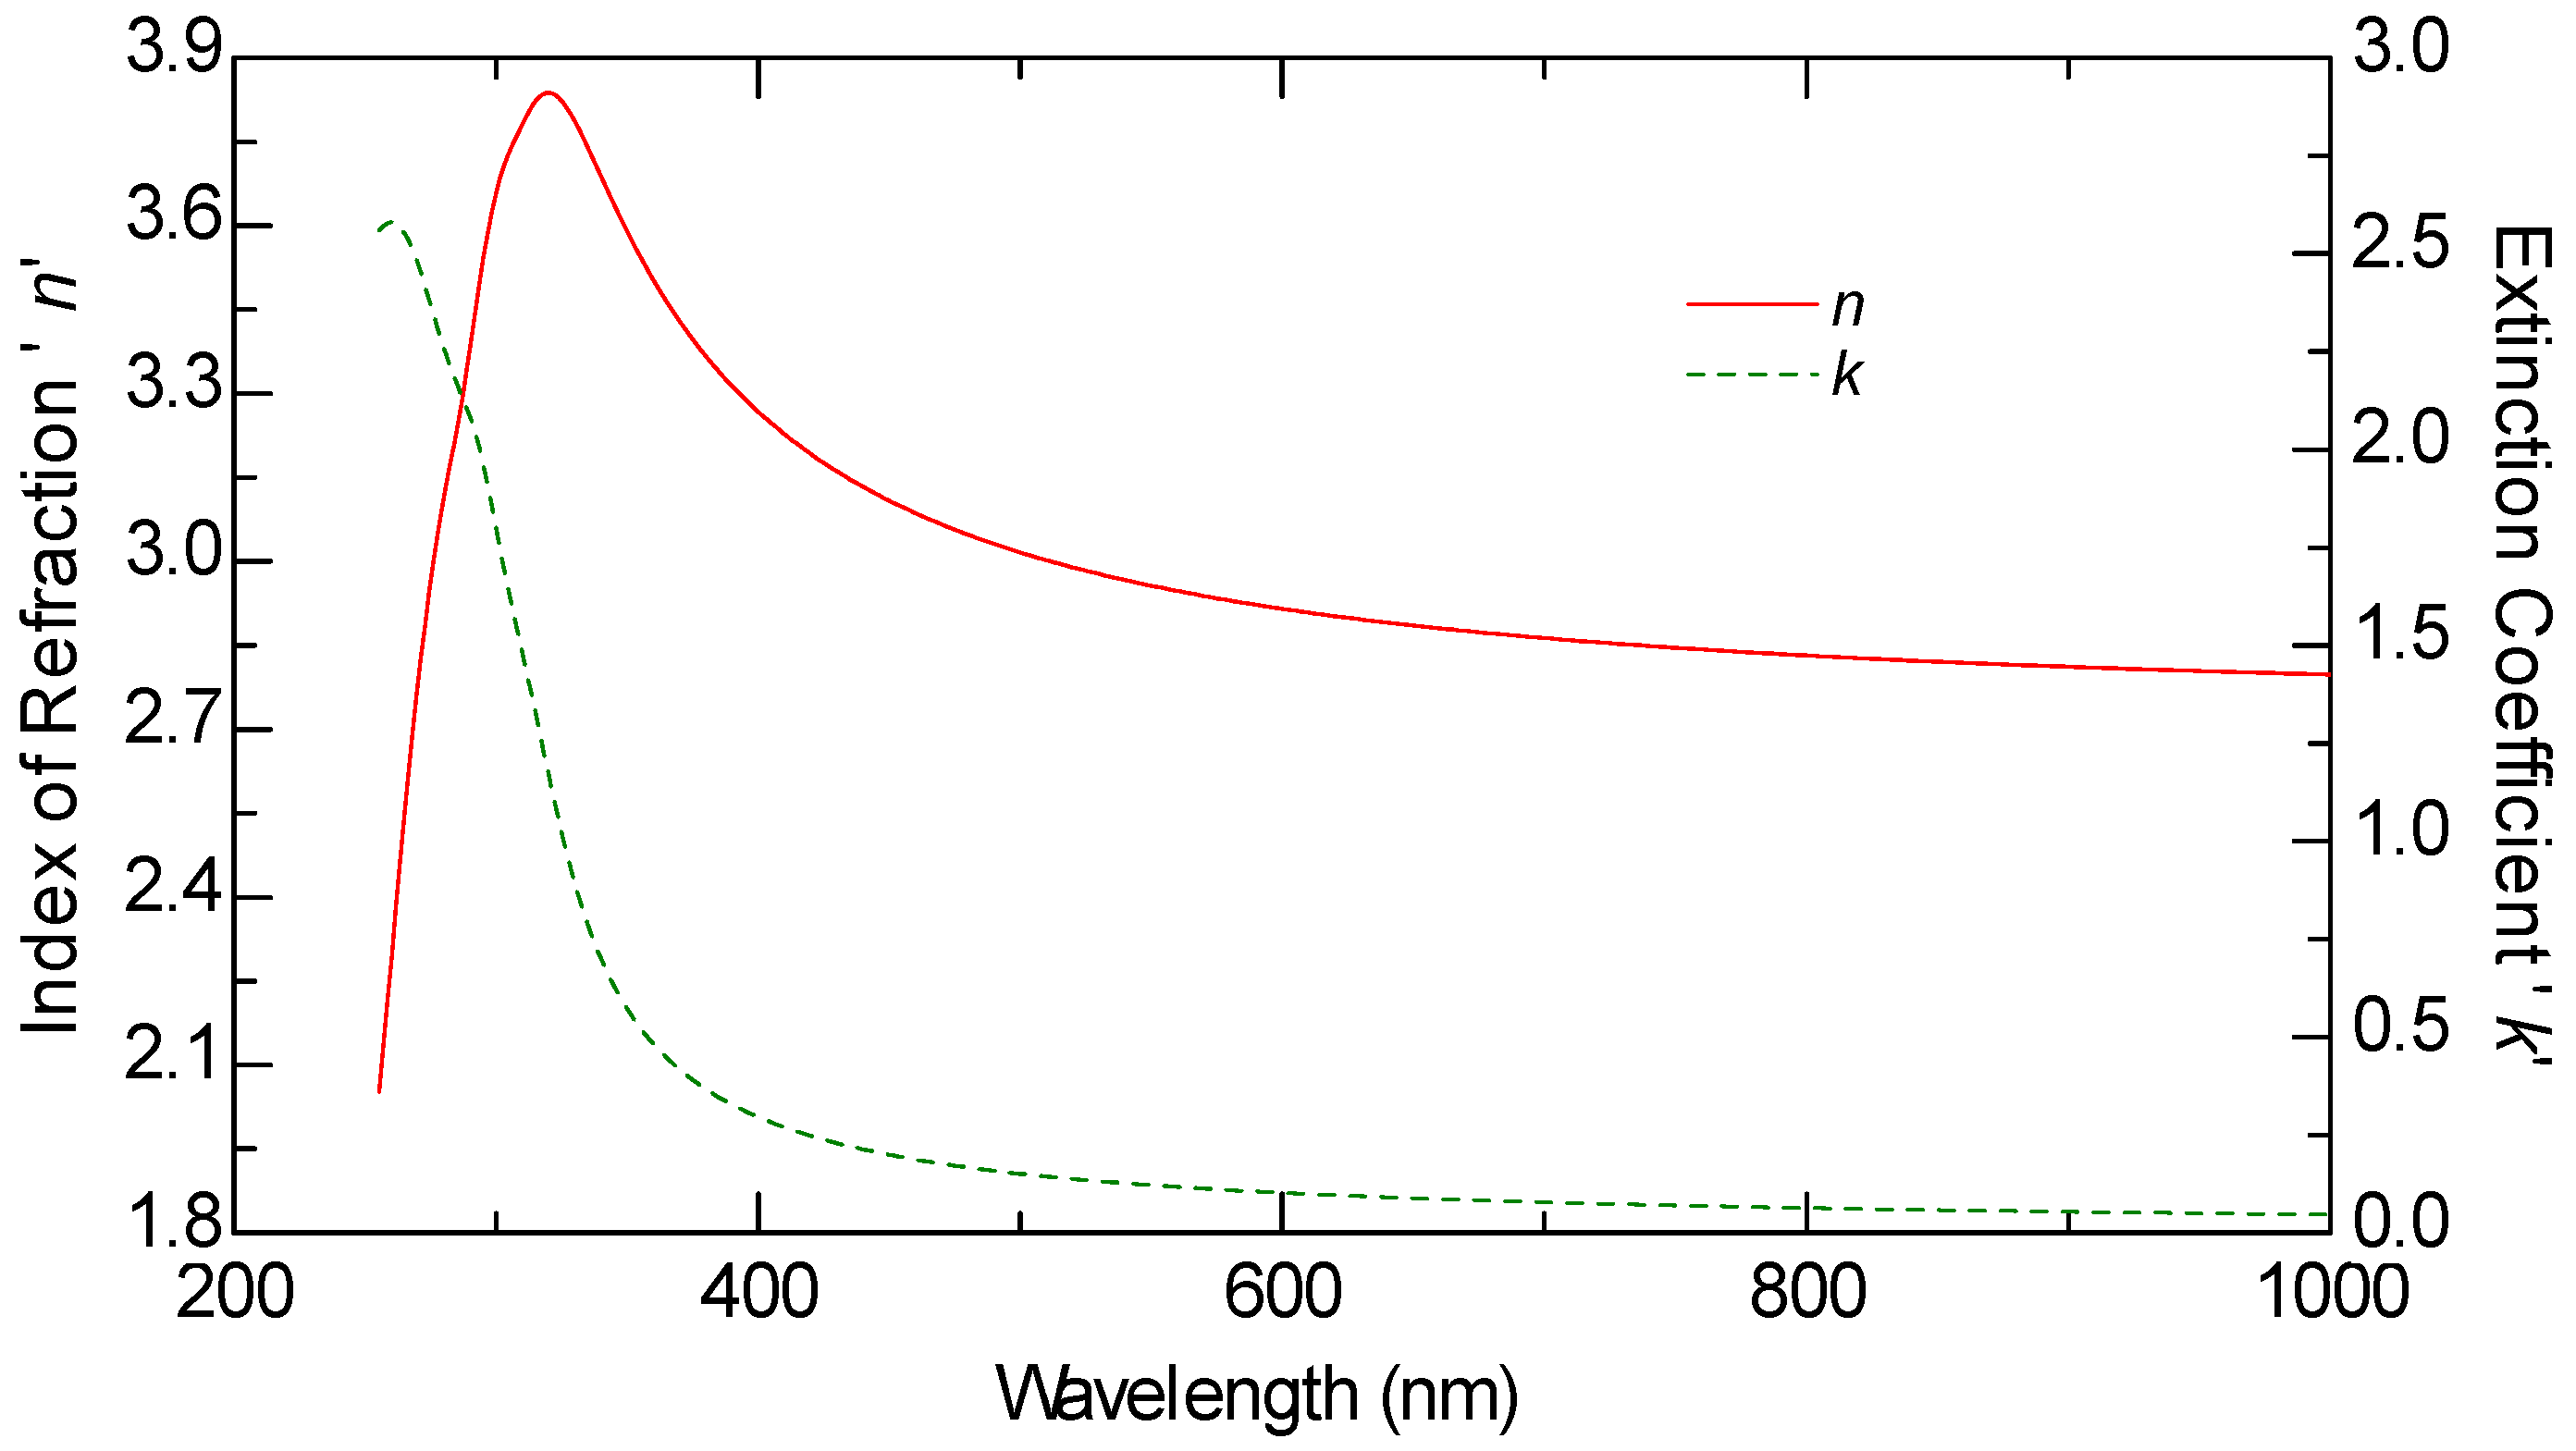
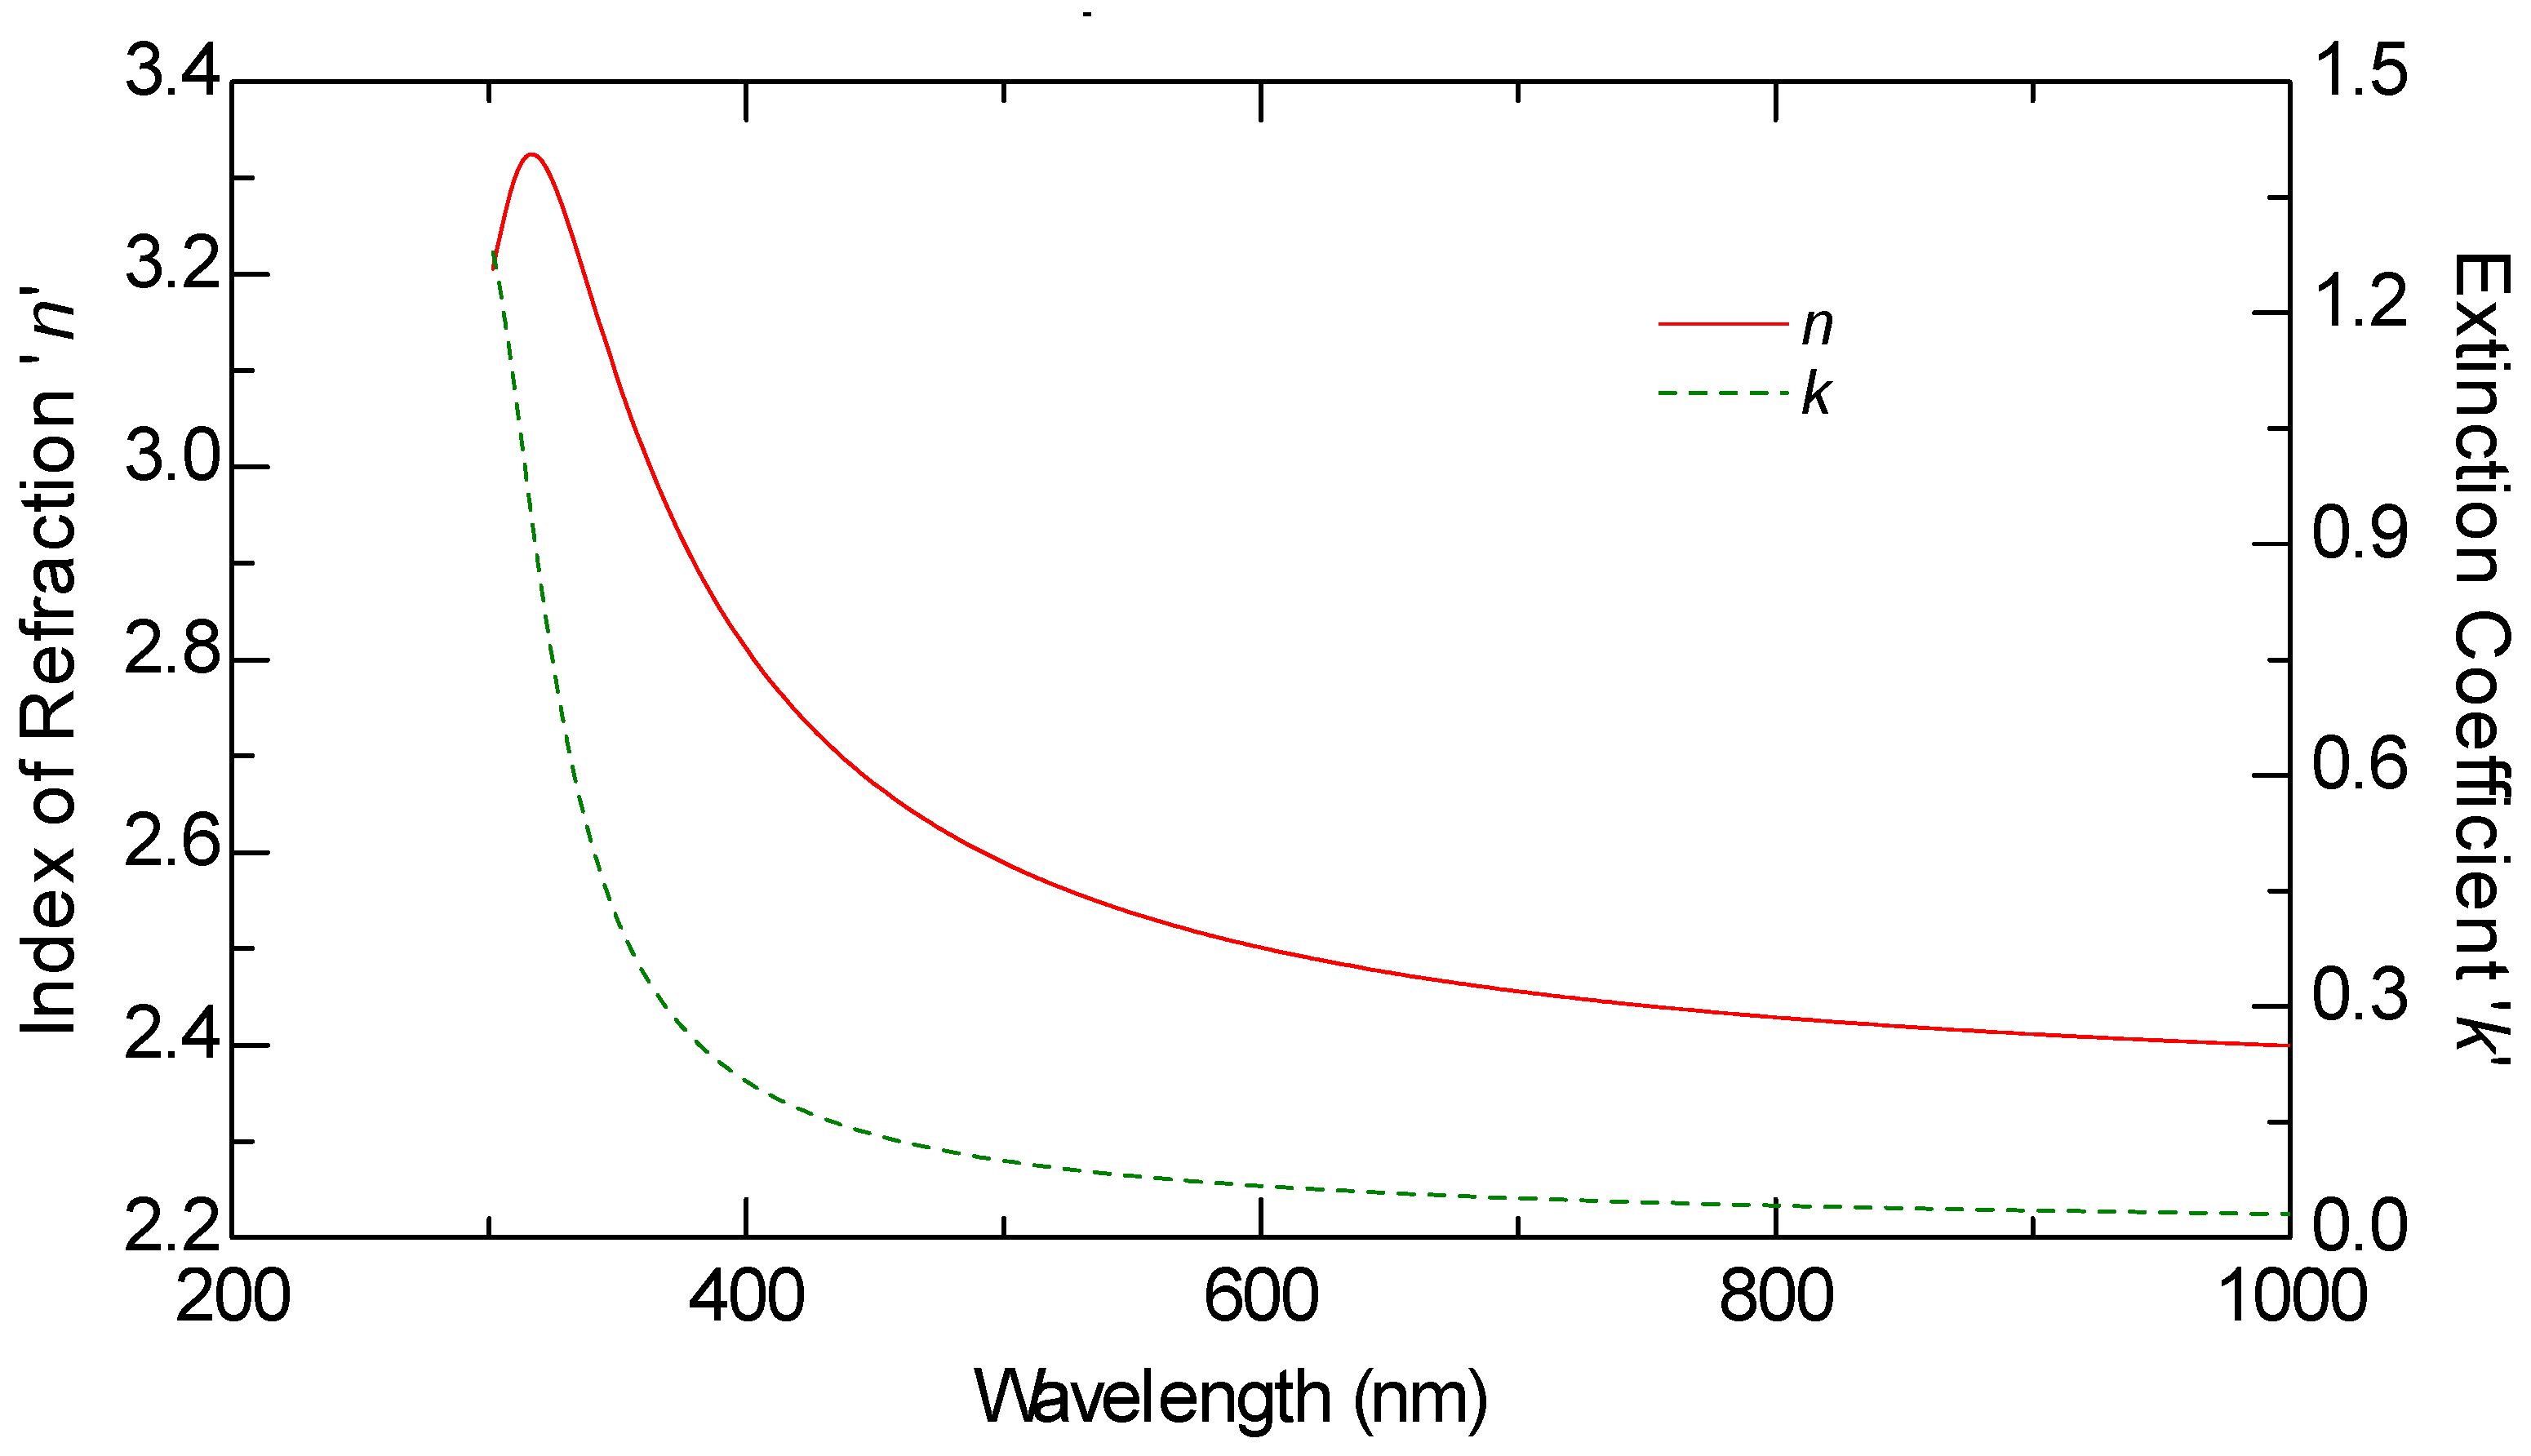
The optical constants of the CVD graphene samples were extracted by fitting the experimental data to the model. In Figure 1, Table 1 and Table 2, the estimated n and k, the scheme of the model, and the Lorentz parameters of the CVD graphene sample are reported.
As observed in Table 2, the graphene model was developed using two Lorentz oscillators and two Drude oscillators [16]. The Lorentz oscillators accounted for the van Hove singularity [17] while the Drude model described the behavior of quasi-free electrons in the near-infrared (NIR) region. The presence of the van Hove singularity resulted in a pronounced peak in the extinction coefficient around 4.7 eV with a k value of 2.78 (Figure 1). The position of the extinction coefficient’s maximum at 4.7 eV was found to be consistent with values reported in the literature [17], further confirming the reliability of the model. This peak is associated with a van Hove singularity in graphene’s density of states, which is a critical feature in understanding the material’s optical properties. Additionally, the height of the extinction peak was in close agreement with studies that accounted for the presence of transfer residues [18]. However, variations in the position, height, and symmetry of the UV extinction peak were observed, which were attributed to differences in substrate characteristics. These differences could be explained by the excitonic response at the van Hove singularity, which is influenced by the competition between electron–electron (e-e) and electron–hole (e-h) interactions.

3.2. EPD Graphene Oxide Films

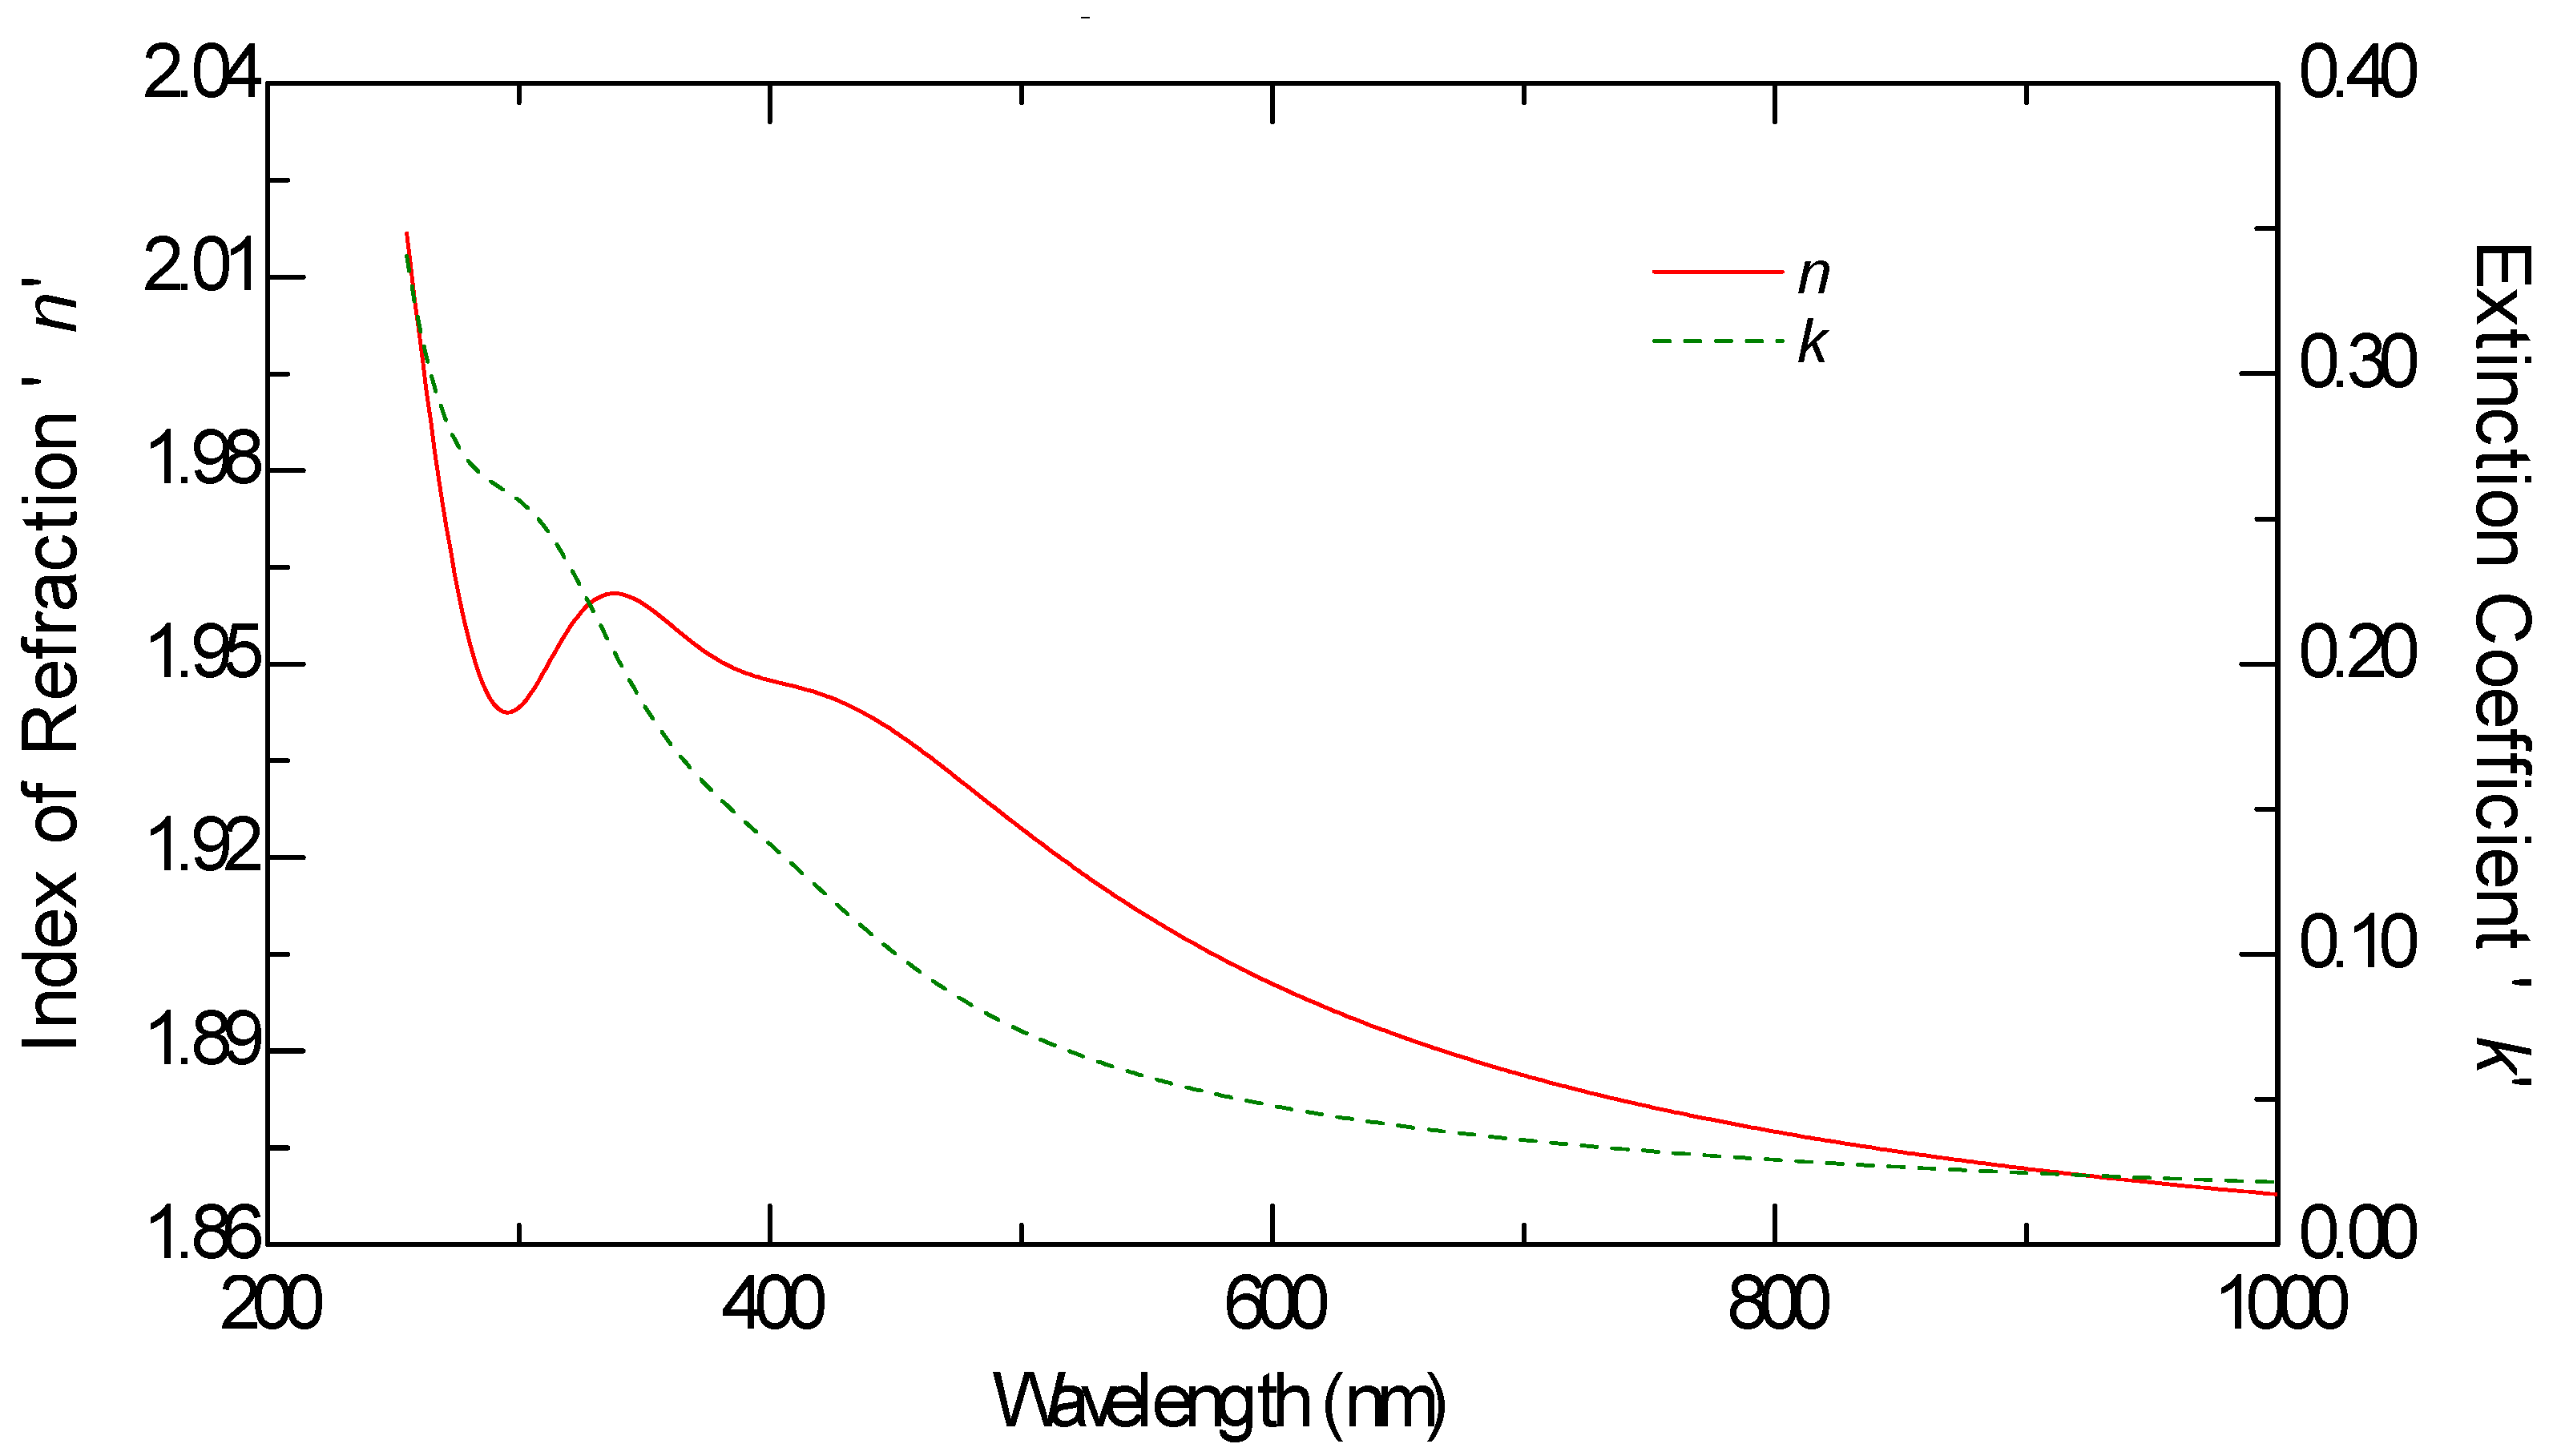
The estimated dispersion laws of GO films made by EPD were modeled using Lorentz oscillators. In Figure 2, Table 3 and Table 4, the estimated n and k, the scheme of the model, and the Lorentz optical parameters for the GO sample deposited at 0.25 mg/mL and 1 min of deposition are reported.
The results in Table 4 indicate the presence of the excitonic effect and π* plasmon peaks at 4.7–5.1 eV [19]. In Figure 3, Table 5 and Table 6, the estimated n and k, the model, and the Lorentz optical parameters for EPD GO samples after the annealing treatment at 400 °C for 1 h are reported.
After annealing the sample at 400 °C, a red shift in the absorption peak from 5.1 (Table 4) to 4.6 eV was observed (Table 5), confirming the reduction of GO and the transition from sp3 to sp2 hybridization [20]. The effect of the annealing is studied by Raman characterization on EPD GO samples (Ref. [11]).

3.3. Drop Casting Methods

The following analysis focuses on films obtained by drop casting a 0.1 mg/mL solution of GO in water and isopropanol on glass substrates. The energy band gap calculations for the GO solutions in water and isopropanol, along with the detailed methodology and results, are provided in the Supplementary Information.
The annealing process at 400 °C was not feasible for effective analysis, as it did not result in homogeneous films. This contrasts with techniques like dip coating [21], which typically yield more uniform films suitable for ellipsometric measurements even at 400 °C. At higher temperatures, the solvent’s rapid evaporation shortens the time available for GO flakes to align properly. This can result in uneven packing and poor film uniformity.
Glass substrates were modeled by VASE using the Cauchy dispersion law [22] in conjunction with the Urbach [22] law to accurately characterize the absorbing properties.
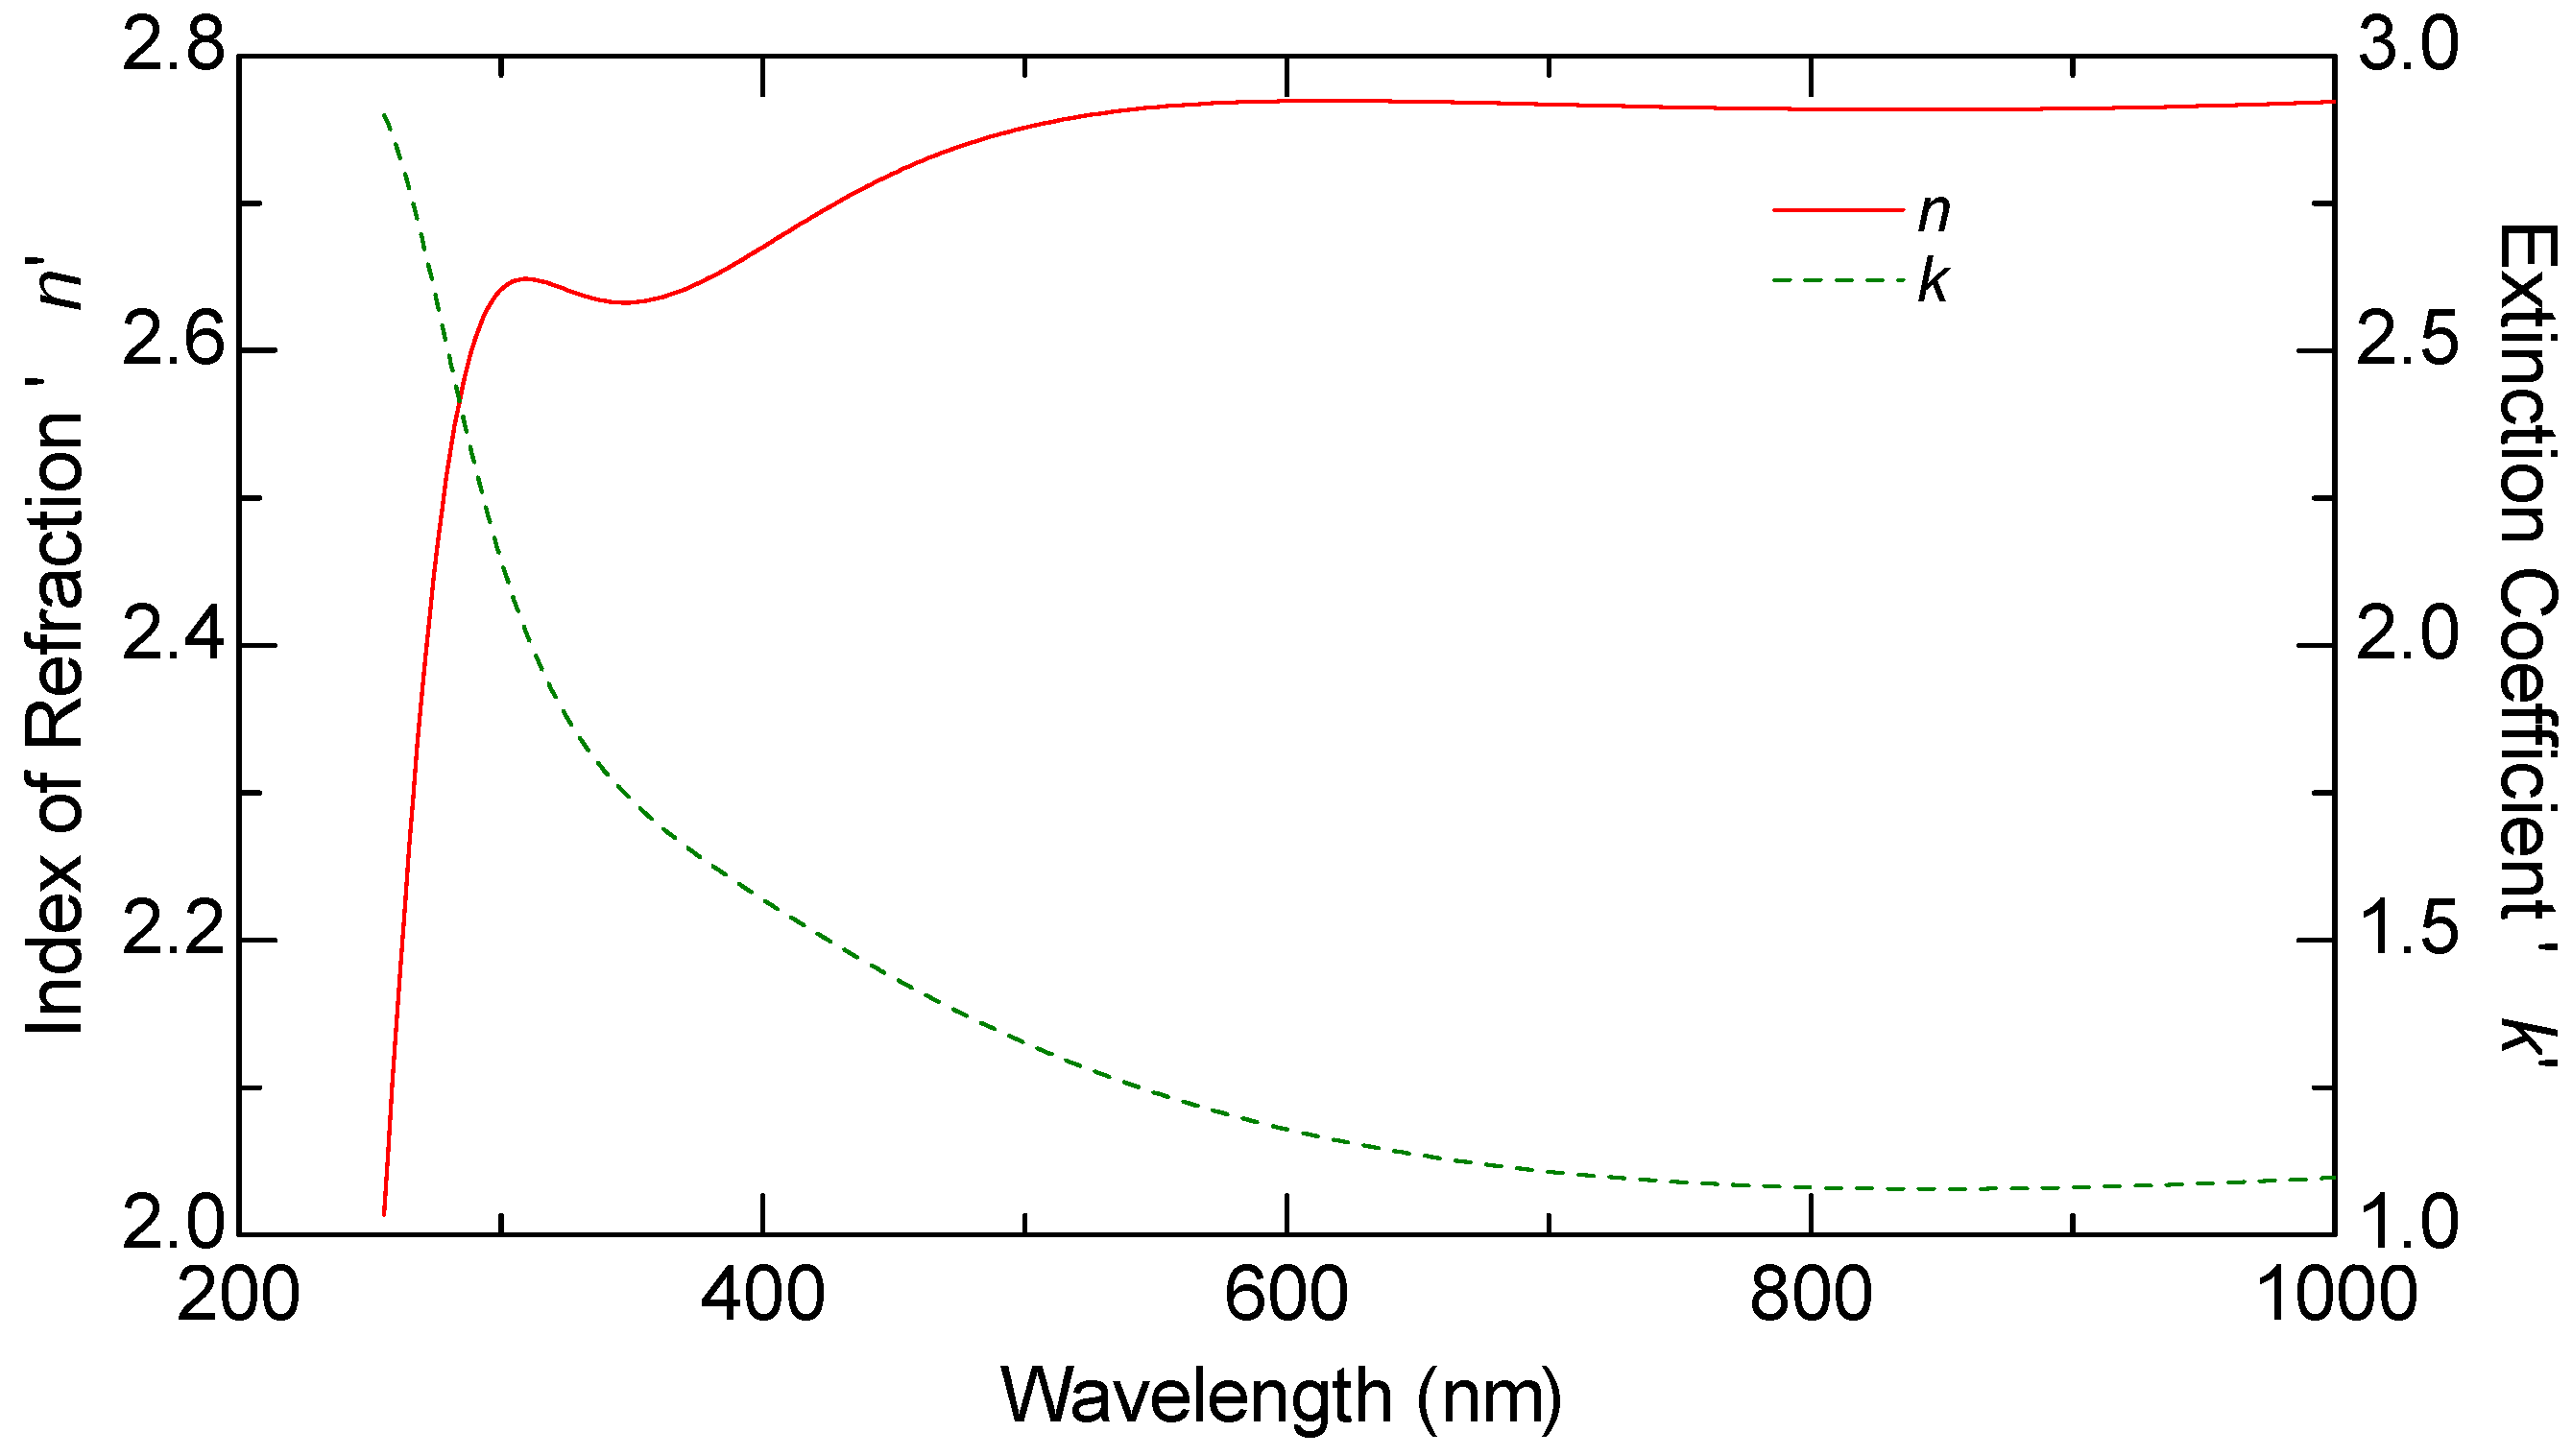
In Figure 4, Table 6 and Table 7, the estimated n and k, the scheme of the model, and the Lorentz optical parameters for drop-casted GO sample at a concentration of 0.1 mg/mL in water are reported.
The analysis (Table 7) identified the oscillator at 5.1 eV corresponds to the low-energy plasma excitations of the electrons in GO. The other two oscillators, at 3.1 eV and 4.031 eV, are associated with different coverage levels of mixed hydroxyl groups and oxygen atoms [20].
The variations in the Lorentz oscillator parameters reflect the different interactions and structural configurations that occur within the GO layers when water is present.
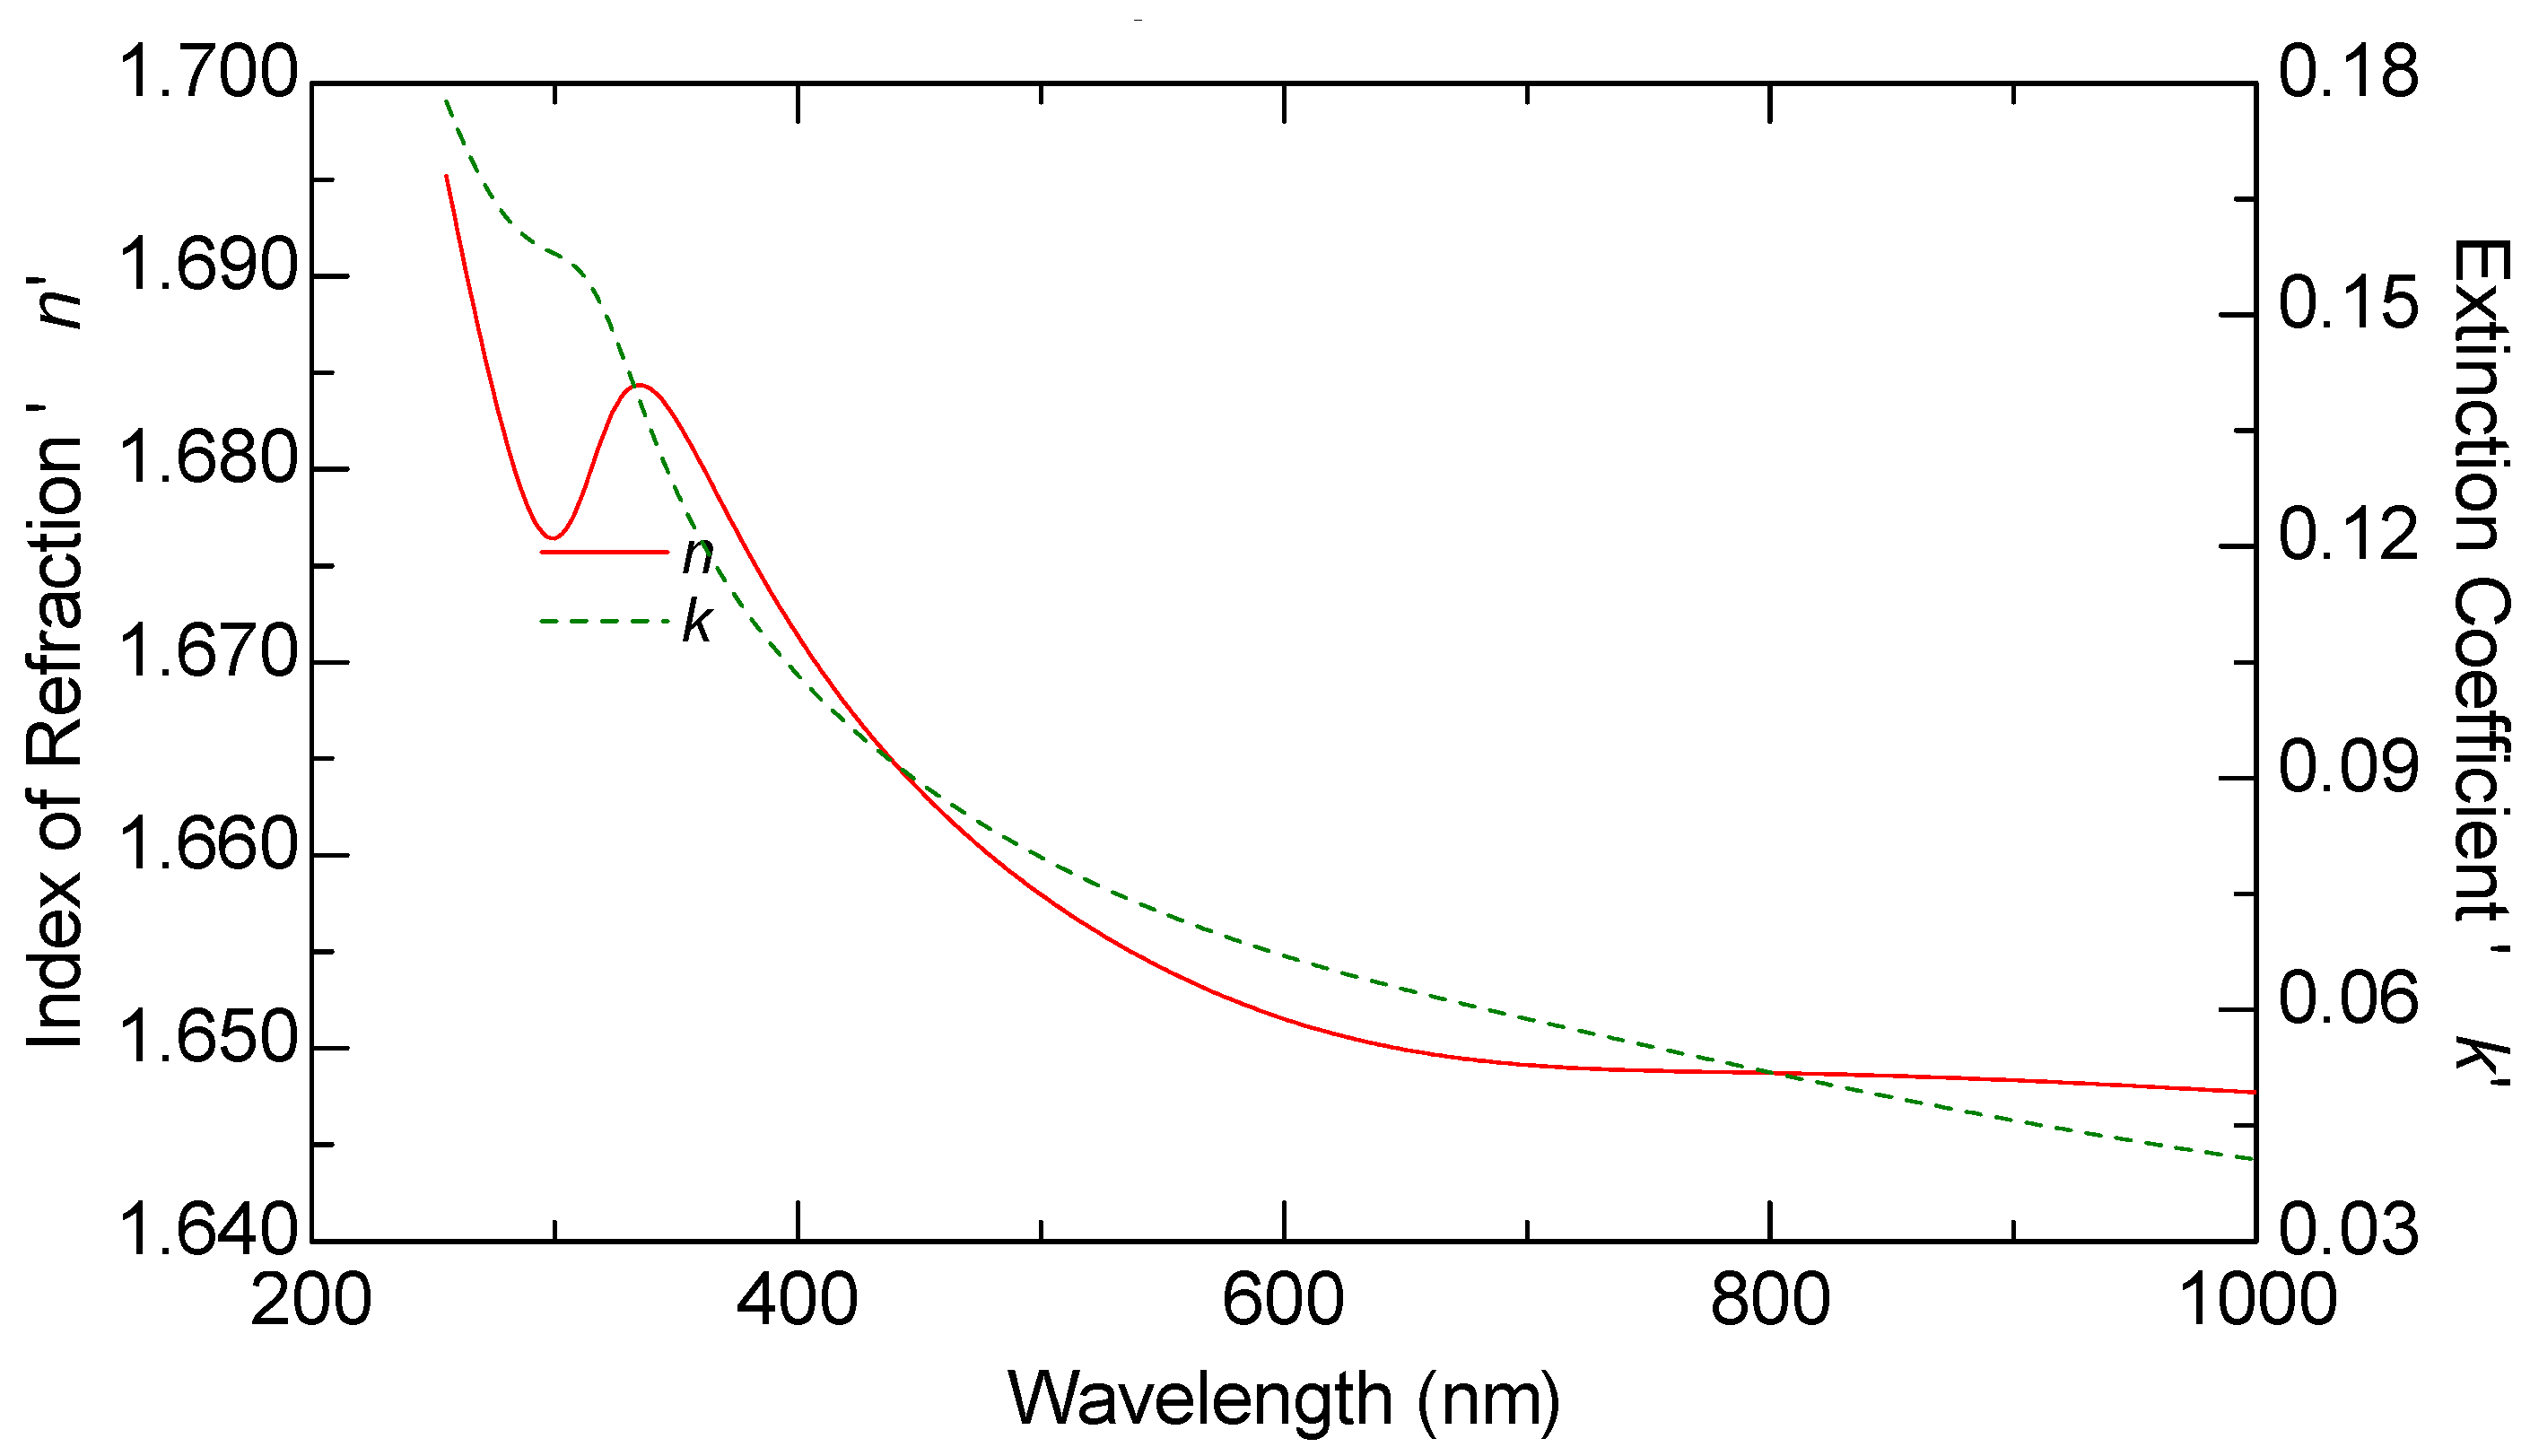
In Figure 5, Table 8 and Table 9, the estimated n and k, the model, and the Lorentz optical parameters for the drop-casted GO sample at a concentration of 0.1 mg/mL in isopropanol are reported.
In Figure 5, the lower refractive index suggests that the GO film in isopropanol may be less dense compared to GO films in water (Figure 4). This could be due to the interaction of isopropanol with GO, possibly leading to a less tightly packed film structure. Moreover, isopropanol might leave residual solvent molecules trapped within the film, which could reduce the film’s overall refractive index.
In conclusion, CVD-produced graphene [23] exhibited the highest uniformity in optical properties, establishing it as the benchmark for film quality. This was closely followed by GO films deposited through electrophoretic deposition (EPD) [11] after annealing, which also demonstrated consistent optical constants. In contrast, the drop casting method demonstrated significant variability in film uniformity at high temperatures, where maintaining consistency proved challenging. Additionally, the optical properties of the films were found to vary depending on the solvent used, highlighting the sensitivity of this method to both temperature and solvent choice.
Water, being a polar solvent, interacts strongly with the oxygen-containing functional groups present on the GO surface (such as hydroxyl, epoxy, and carboxyl groups). These interactions can lead to the formation of hydrogen bonds between the water molecules and the GO flakes. As water evaporates slowly due to its relatively high boiling point (100 °C), the GO flakes have more time to move, align, and form a continuous, uniform film. However, the slow evaporation also increases the risk of solvent trapping, where residual water molecules become trapped between the layers of GO. This trapped water can affect the film’s optical properties, potentially leading to higher refractive indices and non-uniformity in thickness. Isopropanol, on the other hand, is less polar than water and has a lower boiling point (82.6 °C), which leads to faster evaporation. The weaker interactions between isopropanol and the GO flakes result in less hydrogen bonding and a quicker aggregation of GO sheets as the solvent evaporates. This rapid evaporation can be advantageous in terms of reducing the processing time; however, it also means that the GO flakes have less time to rearrange and form a uniform film. Consequently, films cast from isopropanol are often less dense and may exhibit lower refractive indices compared to those cast from water. Additionally, the quick evaporation can lead to uneven packing of the GO flakes, resulting in films with varying thicknesses and possible surface roughness. The rapid drying process may also trap air pockets within the film, further contributing to the non-uniformity and affecting the optical properties negatively.
Despite these challenges, drop casting remains a straightforward technique for depositing GO films, particularly advantageous when a quick and simple deposition process is required.

4. Conclusions

This study provides a comparative optical analysis of graphene oxide (GO) films prepared through drop casting, with reference samples of GO films deposited by electrophoretic deposition (EPD) and graphene produced by chemical vapor deposition (CVD). The analysis using Variable Angle Spectroscopic Ellipsometry (VASE) highlighted significant differences in the uniformity and optical properties of the films, largely influenced by the deposition method and solvent choice.
CVD graphene exhibited the highest uniformity in optical properties, setting the standard for film quality. GO films prepared via EPD, particularly after annealing, also demonstrated consistent optical characteristics, closely aligning with the quality seen in CVD graphene. In contrast, GO films produced through drop casting displayed greater variability in uniformity, which was notably dependent on the solvent used. Lower boiling point solvents, such as isopropanol, resulted in films with lower refractive indices, suggesting a less dense structure compared to films created using water-based solutions. The lower refractive index in GO films cast from isopropanol films can be advantageous in certain applications because it allows for greater optical transparency, which is particularly important in devices where minimizing light reflection is critical. For example, in anti-reflective coatings or transparent conductive films (TCFs), a lower refractive index reduces the mismatch between the film and air, thereby minimizing light reflection and enhancing the transmission of light through the material.
The non-uniformity observed in drop-cast films at elevated temperatures can be attributed to the rapid evaporation of solvents like isopropanol and water, which reduces the time available for GO flakes to self-assemble into a uniform layer. At higher temperatures, this process is further accelerated, leading to the formation of films with varying thicknesses and densities. The solvent choice therefore plays a crucial role here; isopropanol, with its lower boiling point, evaporates more quickly than water, leading to less time for the flakes to align properly, which may result in a less dense film structure.
Water, with its higher boiling point, allows for a slower evaporation process, which can improve uniformity but also introduces the risk of solvent trapping if the temperature is not sufficiently high to drive off all residual water.
The findings presented here highlight the importance of optimizing both the solvent and the deposition technique to achieve the desired GO film quality.
While drop casting is a simple and accessible technique, its application in large-scale production requires careful consideration, especially at higher temperatures. Future studies could investigate how to scale up this process without compromising GO film quality, potentially by integrating automated deposition systems or by combining drop casting with other deposition methods to achieve better control over film thickness and uniformity at elevated temperatures.
Supplementary Materials

The following supporting information can be downloaded at https://www.mdpi.com/article/10.3390/c10040090/s1, Figure S1: Particle size distribution determined through DLS at angle 90°; Figure S2: Energy band gap calculation of the solution of GO in water 0.5 mg/mL; Figure S3: Energy band gap calculation of the solution of GO in isopropanol 0.1 mg/mL.

Funding

This research received no external funding.

Data Availability Statement

The data are contained inside the manuscript and the Supplementary Materials.

Conflicts of Interest

The author declares no conflicts of interest.

References

  1. Dreyer, D.R.; Park, S.; Bielawski, C.W.; Ruoff, R.S. The chemistry of graphene oxide. Chem. Soc. Rev. 2010, 39, 228–240. [Google Scholar] [CrossRef] [PubMed]
  2. Mirzapour, M.; Robert, M.; Benmokrane, B. In Situ Processing to Achieve High-Performance Epoxy Nanocomposites with Low Graphene Oxide Loading. C 2024, 10, 52. [Google Scholar] [CrossRef]
  3. Pei, S.; Cheng, H.-M. The reduction of graphene oxide. Carbon 2012, 50, 3210–3228. [Google Scholar] [CrossRef]
  4. Zheng, Q.; Li, Z.; Yang, J.; Kim, J.-K. Graphene oxide-based transparent conductive films. Prog. Mater. Sci. 2014, 64, 200–247. [Google Scholar] [CrossRef]
  5. Chumakova, N.; Kokorin, A. Graphene Oxide Membranes—Synthesis, Properties, and Applications. Membranes 2023, 13, 771. [Google Scholar] [CrossRef] [PubMed]
  6. Hidalgo, R.S.; López-Díaz, D.; Velázquez, M.M. Graphene Oxide Thin Films: Influence of Chemical Structure and Deposition Methodology. Langmuir 2015, 31, 2697–2705. [Google Scholar] [CrossRef] [PubMed]
  7. Politano, G.G.; Versace, C. Recent Advances in the Raman Investigation of Structural and Optical Properties of Graphene and Other Two-Dimensional Materials. Crystals 2023, 13, 1357. [Google Scholar] [CrossRef]
  8. Woollam, J.A.; Johs, B.D.; Herzinger, C.M.; Hilfiker, J.N.; Synowicki, R.A.; Bungay, C.L. Overview of variable-angle spectroscopic ellipsometry (VASE): I. Basic theory and typical applications. In Proceedings of the SPIE’s International Symposium on Optical Science, Engineering, and Instrumentation, Denver, CO, USA, 18–23 July 1999; Volume 10294. [Google Scholar]
  9. Kaliyaraj Selva Kumar, A.; Zhang, Y.; Li, D.; Compton, R.G. A mini-review: How reliable is the drop casting technique? Electrochem. Commun. 2020, 121, 106867. [Google Scholar] [CrossRef]
  10. Reina, A.; Jia, X.; Ho, J.; Nezich, D.; Son, H.; Bulovic, V.; Dresselhaus, M.S.; Kong, J. Large area, few-layer graphene films on arbitrary substrates by chemical vapor deposition. Nano Lett. 2009, 9, 30. [Google Scholar] [CrossRef] [PubMed]
  11. Politano, G.G.; Versace, C.; Vena, C.; Castriota, M.; Ciuchi, F.; Fasanella, A.; Desiderio, G.; Cazzanelli, E. Physical investigation of electrophoretically deposited graphene oxide and reduced graphene oxide thin films. J. Appl. Phys. 2016, 120, 195307. [Google Scholar] [CrossRef]
  12. Moré, J.J. The Levenberg-Marquardt Algorithm: Implementation and Theory BT—Numerical Analysis; Watson, G.A., Ed.; Springer: Berlin/Heidelberg, Germany, 1978; pp. 105–116. [Google Scholar]
  13. J.A. Woollam Co. WVASE Manual “Guide to Using WVASE32”; J.A. Woollam Co.: Tokyo, Japan, 2010. [Google Scholar]
  14. Verde, M.; Peiteado, M.; Caballero, A.C.; Villegas, M.; Ferrari, B. Electrophoretic Deposition of Transparent ZnO Thin Films from Highly Stabilized Colloidal Suspensions. J. Colloid Interface Sci. 2012, 373, 27–33. [Google Scholar] [CrossRef] [PubMed]
  15. Yunus, Y.; Mahadzir, N.A.; Mohamed Ansari, M.N.; Tg Abd Aziz, T.H.; Mohd Afdzaluddin, A.; Anwar, H.; Wang, M.; Ismail, A.G. Review of the Common Deposition Methods of Thin-Film Pentacene, Its Derivatives, and Their Performance. Polymers 2022, 14, 1112. [Google Scholar] [CrossRef] [PubMed]
  16. Woollam, J.A.; Snyder, P.G. Fundamentals and applications of variable angle spectroscopic ellipsometry. Mater. Sci. Eng. B 1990, 5, 279–283. [Google Scholar] [CrossRef]
  17. Kravets, V.G.; Grigorenko, A.N.; Nair, R.R.; Blake, P.; Anissimova, S.; Novoselov, K.S.; Geim, A.K. Spectroscopic ellipsometry of graphene and an exciton-shifted van Hove peak in absorption. Phys. Rev. B 2010, 81, 155413. [Google Scholar] [CrossRef]
  18. Jung, I.; Vaupel, M.; Pelton, M.; Piner, R.; Dikin, D.A.; Stankovich, S.; An, J.; Ruoff, R.S. Characterization of Thermally Reduced Graphene Oxide by Imaging Ellipsometry. J. Phys. Chem. C 2008, 112, 8499–8506. [Google Scholar] [CrossRef]
  19. Stetefeld, J.; McKenna, S.A.; Patel, T.R. Dynamic light scattering: A practical guide and applications in biomedical sciences. Biophys. Rev. 2016, 8, 409–427. [Google Scholar] [CrossRef] [PubMed]
  20. Shen, Y.; Yang, S.; Zhou, P.; Sun, Q.; Wang, P.; Wan, L.; Li, J.; Chen, L.; Wang, X.; Ding, S.; et al. Evolution of the band-gap and optical properties of graphene oxide with controllable reduction level. Carbon 2013, 62, 157–164. [Google Scholar] [CrossRef]
  21. Politano, G.G.; Versace, C. Variable Angle Spectroscopic Ellipsometry Characterization of Graphene Oxide in Methanol Films. Crystals 2022, 12, 696. [Google Scholar] [CrossRef]
  22. Woollam, J.A.; Snyder, P.G.; Rost, M.C. Variable angle spectroscopic ellipsometry: A non-destructive characterization technique for ultrathin and multilayer materials. Thin Solid Films 1988, 166, 317–323. [Google Scholar] [CrossRef]
  23. Ochoa-Martinez, E.; Gabas, M.; Barrutia, L.; Pesquera, A.; Centeno, A.; Palanco, S.; Zurutuza, A.; Algora, C. Determination of a refractive index and an extinction coefficient of standard production of CVD-graphene. Nanoscale 2015, 7, 1491–1500. [Google Scholar] [CrossRef] [PubMed]
Figure 1. Estimated n and k for CVD graphene sample.
Carbon 10 00090 g001
Figure 2. Estimated n and k for EPD-deposited sample of GO at concentration 0.25 mg/mL, time of deposition 1 min.
Carbon 10 00090 g002
Figure 3. Estimated n and k for EPD GO sample after the annealing treatment at 400 °C for 1 h.
Carbon 10 00090 g003
Figure 4. Estimated n and k for drop-casted sample of GO at concentration 0.1 mg/mL in water.
Carbon 10 00090 g004
Figure 5. Estimated n and k of GO in isopropanol films (0.1 mg/mL).
Carbon 10 00090 g005
Table 1. Model of CVD graphene sample.
MaterialThickness
2 Graphene0.345 nm
1 SiO2309.371 nm
0 Si1 mm
Table 2. Lorentz optical parameters for CVD graphene sample.
eAk (eV2)Bk (eV2)Ek (eV)
0.02881.67613.1560
90.7813.9843.994
0.69825.9660
23.3540.8194.425
Table 3. Model for EPD sample of GO at concentration 0.25 mg/mL, deposition time 1 min.
MaterialThickness
1 GO7
0 Ti1 mm
Table 4. Lorentz optical parameters for EPD sample of GO at concentration 0.25 mg/mL, time of deposition 1 min.
eAk (eV2)Bk (eV2)Ek (eV)
2.67113.2190.6824.087
37.1870.7204.7
10.0361.0095.1
Table 5. Lorentz optical parameters for EPD GO sample after the annealing treatment at 400 °C for 1 h.
eAk (eV2)Bk (eV2)Ek (eV)
3.7077.39710.5263.972
4.97180.3864.204
64.9501.1204.600
Table 6. Model for drop-casted sample of GO at concentration 0.1 mg/mL in water.
MaterialThickness
1 GO4.740 nm
0 glass1 mm
Table 7. Lorentz optical parameters for drop-casted GO sample at concentration 0.1 mg/mL in water.
eAk (eV2)Bk (eV2)Ek (eV)
2.38928.4121.4995.1
0.55261.1723.119
2.6471.3814.031
Table 8. Model for drop-casted samples of GO in isopropanol films (0.1 mg/mL).
MaterialThickness
1 GO4.351 nm
0 glass1 mm
Table 9. Lorentz optical parameters for drop-casted GO sample at concentration 0.1 mg/mL in isopropanol.
eAk (eV2)Bk (eV2)Ek (eV)
0.4720.0301.1191.719
0.2390.8263.935
Disclaimer/Publisher’s Note: The statements, opinions and data contained in all publications are solely those of the individual author(s) and contributor(s) and not of MDPI and/or the editor(s). MDPI and/or the editor(s) disclaim responsibility for any injury to people or property resulting from any ideas, methods, instructions or products referred to in the content.