Article

Enhanced Antibacterial Activity of Carbon Dots: A Hybrid Approach with Levofloxacin, Curcumin, and Tea Polyphenols

1
School of Chemistry and Chemical Engineering, Anhui University, 111 Jiulong Road, Hefei 230601, China
2
School of Materials Science and Engineering, Anhui University, 111 Jiulong Road, Hefei 230601, China
*
Author to whom correspondence should be addressed.
Submission received: 15 June 2024 / Revised: 23 August 2024 / Accepted: 12 September 2024 / Published: 15 September 2024
(This article belongs to the Special Issue Carbon Nanohybrids for Biomedical Applications)

Abstract

:
Bacterial infections and their increasing resistance to antibiotics pose a significant challenge in medical treatment. This study presents the synthesis and characterization of novel carbon dots (CDs) using levofloxacin (Lf), curcumin (Cur), and tea polyphenols (TP) through a facile hydrothermal method. The synthesized curcumin-tea polyphenol@carbon dots (Cur-TP@CDs) and levofloxacin-tea polyphenol@carbon dots (Lf-TP@CDs) were characterized using transmission electron microscopy (TEM), Fourier transform infrared spectroscopy (FT-IR), X-ray diffraction (XRD), X-ray photoelectron spectroscopy (XPS), and Raman spectroscopy, confirming their unique structural and chemical properties. Cur-TP@CDs exhibited an average particle size of 1.32 nanometers (nm), while Lf-TP@CDs averaged 1.58 nm. Both types demonstrated significant antibacterial activity, with Lf-TP@CDs showing superior effectiveness against Staphylococcus aureus (S. aureus) and Escherichia coli (E. coli) in broth dilution and disc diffusion assays. Biofilm inhibition assays revealed a significant reduction in biofilm formation at higher concentrations. The ultraviolet-visible (UV-vis) and photoluminescence (PL) spectral analyses indicated efficient photon emission, and electron paramagnetic resonance (EPR) analysis showed increased singlet oxygen generation, enhancing bactericidal effects. Live and dead bacterial staining followed by scanning electron microscopy (SEM) analysis confirmed dose-dependent bacterial cell damage and morphological deformities. These findings suggest that Cur-TP@CDs and Lf-TP@CDs are promising antibacterial agents, potentially offering a novel approach to combat antibiotic-resistant bacterial infections.

Graphical Abstract

1. Introduction

Antibiotic resistance was discovered over 50 years ago, and by the late 1950s, most S. aureus isolates had developed resistance to penicillin. However, the severity of antibiotic resistance was not fully recognized until the 1960s when it became a major global issue, prompting the development of new drugs like vancomycin and methicillin. Despite these advancements, bacteria continued to evolve strategies to evade these drugs, exacerbating the problem of antibiotic resistance [1,2]. While new scientific research offers more effective solutions, the need for high dosages and frequencies of chemical agents like antimicrobials often results in harmful side effects and increased antibiotic resistance [3,4]. Carbon dots (CDs) have emerged as promising alternatives to traditional antibiotics due to their superior performance and adaptability. CDs possess unique properties such as small size, optical characteristics, biocompatibility, low toxicity, and ease of modification, making them suitable for a wide range of biomedical applications, including bioimaging, photothermal therapy, drug delivery, biosensors, cancer treatment, and antibacterial therapy [5,6,7].
Researchers have explored various methods to create drug-based CDs using bioactive compounds from natural medicines and clinical drugs, such as levofloxacin, ibuprofen, ampicillin, and others, to enhance the efficacy of treating bacterial infections [4]. In 2016, Wu and colleagues developed quaternized CDs with antibacterial and bacterial differentiation properties, which preferentially attach to Gram-positive bacteria and exhibit high stability and minimal cytotoxicity [8]. Kang and his team used cigarette smoke as a carbon precursor to produce CDs that demonstrated strong bactericidal action against multiple bacterial strains, including antibiotic-resistant E. coli and S. aureus [9]. Yan et al. created TiO2-decorated CQDs that generate free radicals, achieving over 90% antibacterial effectiveness by breaking down bacterial cell membranes [10]. Similarly, Kang’s team developed curcumin-based CDs with exceptional antibacterial and antibiofilm activity, highlighting the potential of curcumin for various health applications [11]. Miao et al. synthesized ciprofloxacin CDs (CCDs) and Cu-doped CDs (Cu-CCDs), which exhibited water solubility, fluorescence sensitivity, biocompatibility, and antibacterial properties. Cu-CCDs were particularly effective in damaging bacterial cell membranes and inhibiting growth [4]. Liang et al. produced functional F-CDs from levofloxacin hydrochloride, demonstrating significant antibacterial properties against both gram-positive and gram-negative bacteria by inducing reactive oxygen species and disrupting cell membranes [12]. Wu et al. synthesized levofloxacin-based carbon dots (LCDs) using a one-pot hydrothermal process, showcasing improved antibacterial activity and low drug resistance, with enhanced therapeutic impact in animal-infected models [13]. Levofloxacin alone is not very effective at forming the carbon core necessary for CD synthesis, as reported in our research group studies [14]. Similarly, while curcumin has been utilized by many researchers for the preparation of CDs, it is often combined with other carbon sources or stabilizing agents to enhance its efficacy for various applications like bio-imaging, PDT, and antibacterial studies. This combination helps enhance the structural and functional properties of the resulting CDs [10,15,16]. Tea polyphenols, in particular, help stabilize the structure during the formation process, thereby improving the overall properties and stability of the resulting carbon dots [17,18].
Given the urgent need for alternatives to traditional antibiotics, this paper explores the development and application of novel-type CDs. In this study, we prepared CDs through hydrothermal synthesis using bioactive compounds such as levofloxacin, curcumin, and tea polyphenols as precursors. This innovative approach not only enhances the antibacterial efficacy against resistant strains but also introduces a novel and multi-functional antibacterial agent. By integrating natural and clinical compounds, this work paves the way for safer and more effective alternatives to traditional antibiotics. These compounds were chosen for their known therapeutic properties: levofloxacin as a broad-spectrum antibiotic, curcumin as a natural anti-inflammatory agent, and tea polyphenols as strong antioxidants. The goal is to enhance their antibacterial efficacy by synthesizing CDs with potent antimicrobial capabilities, potentially combating antibiotic-resistant bacteria. This study aims to develop a novel, safer, and more efficient antibacterial agent by leveraging the combined action of levofloxacin, curcumin, and tea polyphenols.

2. Materials and Methods

2.1. Materials

The chemicals and biological reagents used in this study were purchased directly from commercial vendors without any additional purification. The tea polyphenols were purchased from Zhongshan Huazhong Food Additives Co., Ltd. based in Zhongshan, China. 5,5-dimethyl-1-pyrroline N-oxide (DMPO), 4-Amino-2,2,6,6-tetramethylpiperidine (TEMP), and Levofloxacin were purchased from Shanghai Aladdin Industrial Corporation. Curcumin was purchased from Macklin (Shanghai, China). The 4% paraformaldehyde was purchased from Beijing Labgic Technology Co., Ltd. (Beijing, China). Crystal Violet Staining Solution and live and dead bacteria assay kits were ordered from Beyotime Biotechnology (Shanghai, China). Luria broth (LB) agar media was purchased from Sangon Biotech (Shanghai) Co., Ltd. (Shanghai, China).

2.2. Methods

2.2.1. Synthesis of Cur-TP@CDs and Lf-TP@CDs

The Cur-TP@CDs and Lf-TP@CDs were synthesized using a hydrothermal method. The precursors were weighed with a molar ratio of (1:1) and deionized water was added to a glass beaker, shaken, and sonicated. The solution was transferred to an autoclave and heated at 180 °C in a muffle furnace for 12 h. The color changed from colorless to pale yellow and dark yellow. Residues were dissolved in water, and the supernatants were filtered. The solution was dialyzed in ultra-pure water for 2 days, then frozen and lyophilized. The powder samples were stored in a cool, air-tight container for further use [19].

2.2.2. Characterization

The morphological information of the samples was obtained by transmission electron microscopy (TEM) JEM-F200. Further analysis was conducted using X-ray photoelectron spectroscopy (XPS). A SCALEB250xi spectrometer and an Al Kα (1486.6 eV) monochromatic X-ray source were used. Fourier transform infrared spectroscopy (FT-IR) was performed on a Vertex80 + Hyperion2000 FT-IR spectrometer. Powder X-ray diffraction (XRD) was also conducted on a PRO diffractometer with Cu Ka radiation on XPert. Raman spectra were recorded with a NEXUS-870 spectrometer equipped with a 532 nm laser line. Evaluation of the O2 generated by the samples using TEMP (2,2,6,6-Tetramethylpiperidine-1-oxyl) probes and electron spin resonance (ESR) EMX nano, BRUKER at room temperature. Ultraviolet-visible (UV-Vis) spectra were obtained using a UV-1800PC spectrophotometer from Shanghai Meipuda Instrument Co., Ltd. (Shanghai, China). Absolute quantum yields (QY) were obtained using a HORIBA system in the calibration sphere. Photoluminescence (PL) emission spectra were measured using a Hitachi F-7000 fluorescence spectrophotometer. Zeta potential was checked through Zetasizer Nano ZS. Live and dead bacteria images were taken by confocal laser scanning microscope (CLSM FV1000+IX81). The bacterial morphology information was obtained by the Scanning Electron Microscope (SEM) model (Zeiss Sigma-500).

2.2.3. Bacterial Culture Preparation

To prepare the Luria broth (LB) agar, we poured it into Petri plates, which solidified at room temperature. In total, 20 µL of E. coli and S. aureus were spread on the surface of the agar plate and put into the incubator at 37 °C for 24 h. On a subsequent day, colonies were picked and placed into 5 mL of LB liquid media, and then this was again incubated overnight. After 24 h, the bacterial solution was then diluted 10-fold (5 × 10⁵ CFU/mL), and the optical density (600 nm) OD600 was determined [20].

2.2.4. Broth Dilution Method

The antibacterial effect of both Cur-TP@CDs and Lf-TP@CDs was tested against E. coli and S. aureus, using the Clinical Laboratory Standard Institute (CLSI) broth microdilution method. Minimal inhibitory concentration (MIC) determinations were carried out by adding different concentrations of Cur-TP@CDs and Lf-TP@CDs (1.5 mg/mL, 1 mg/mL, 0.5 mg/mL, 0.25 mg/mL, and 0.125 mg/mL) to 96-well plates containing bacterial suspensions and incubating them at 37 °C for 24 h. The OD600 was measured before and after incubation through a microplate reader. The MIC represents the concentration where bacterial growth becomes no longer visible. The tests were repeated three times to receive reliable results [21,22].

2.2.5. Disc Diffusion Method

The disc diffusion method was employed to assess the antibacterial activity of Cur-TP@CDs and Lf-TP@CDs, using ampicillin as a control. A bacterial culture was diluted and added to LB agar plates. Various concentrations of the tested compounds were pipetted onto the discs. The plates were incubated at 37 °C for 24 h, after which the inhibitory zones were measured and compared to the antibiotic control. This procedure enabled the visualization of the antibacterial activity of the tested carbon dots and the control [23,24].

2.2.6. Biofilm Inhibition Assay

The ability of Cur-TP@CDs and Lf-TP@CDs to inhibit in vitro biofilm formation was evaluated. The test samples were serially diluted and introduced into microtiter plates containing equal concentrations of bacterial suspensions. The plates were incubated for two days to allow adequate biofilm growth. After incubation, the plates were washed to remove planktonic cells and then treated with crystal violet to stain the biofilm. After dissolving the dye, the optical density was measured with a microplate reader at 597 nm. Biofilm inhibition rates were calculated by comparing the results with control results [25].

2.2.7. Live and Dead Bacteria Assay

The study involved creating a bacterial culture by incubating a single E. coli and S. aureus colony in LB broth overnight at 37 °C. A bacterial suspension was prepared by adding Cur-TP@CDs and Lf-TP@CDs to the suspension and incubating it at 37 °C for 24 h. The suspension was centrifuged at 3000 rpm for 5 min, washed three times with sterile water, and stained with Calcein AM (green) and PI (red) for 30 min. The bacteria were then incubated in the dark for 30 min. The images were taken using a confocal laser scanning microscope (CLSM), the Olympus FV1000 +IX81, with emission values of 488 nm for green and 594 nm for red color filters. Multiple fields of view were used to ensure representative samples [26].

2.2.8. Morphology Study of Bacteria by SEM

The morphology of the bacteria after treatment with Lf-TP@CDs and Cur-TP@CDs was studied using the SEM. The bacteria were treated first with a 2.5% glutaraldehyde solution overnight. They were then dehydrated stepwise using 30%, 50%, 70%, 80%, 90%, and pure ethanol. The obtained solution was dissolved in absolute ethanol to prepare the samples for SEM measurements [27].

3. Results and Discussion

3.1. Characterization of Lf-TP@CDs and Cur-TP@CDs

The carbon dots samples were synthesized through a hydrothermal method using levofloxacin, curcumin, and tea polyphenol as a precursor in distilled water at 180 °C for 12 h (Figure 1a). TEM analysis of both carbon dot samples was carried out. The synthesized carbon-dot powders were dispersed in ethanol and a drop of the suspension was placed on a carbon-coated copper grid. The grid was then dried at room temperature before analysis [28,29]. The insets illustrate high-resolution TEM images, (Figure 1b,c) which indicate lattice fringes of 0.19 nm and fringes of 0.21 nm, respectively, which suggests that both samples contained crystalline structures. The histograms presented there show the distribution of the particle size of the synthesized CDs. According to the results, Cur-TP@CDs have an average size of 1.32 nm, while Lf-TP@CDs have an average size of 1.58 nm, proving that Lf-TP@CDs are formed in a bigger size than Cur-TP@CDs. The particle size reported for LCDs is 7.00 ± 0.25 nm, which is notably larger compared to the particle size of the Lf-TP@CDs in my study, which is 1.58 nm. The smaller size of Lf-TP@CDs may offer superior surface area-to-volume ratios, potentially leading to enhanced reactivity and functionalization efficiency. This difference underscores the effectiveness of the synthesis method used for Lf-TP@CDs, which has successfully produced more finely tuned nanoparticles, making them potentially more suitable for applications where precise control over particle size is crucial [13].
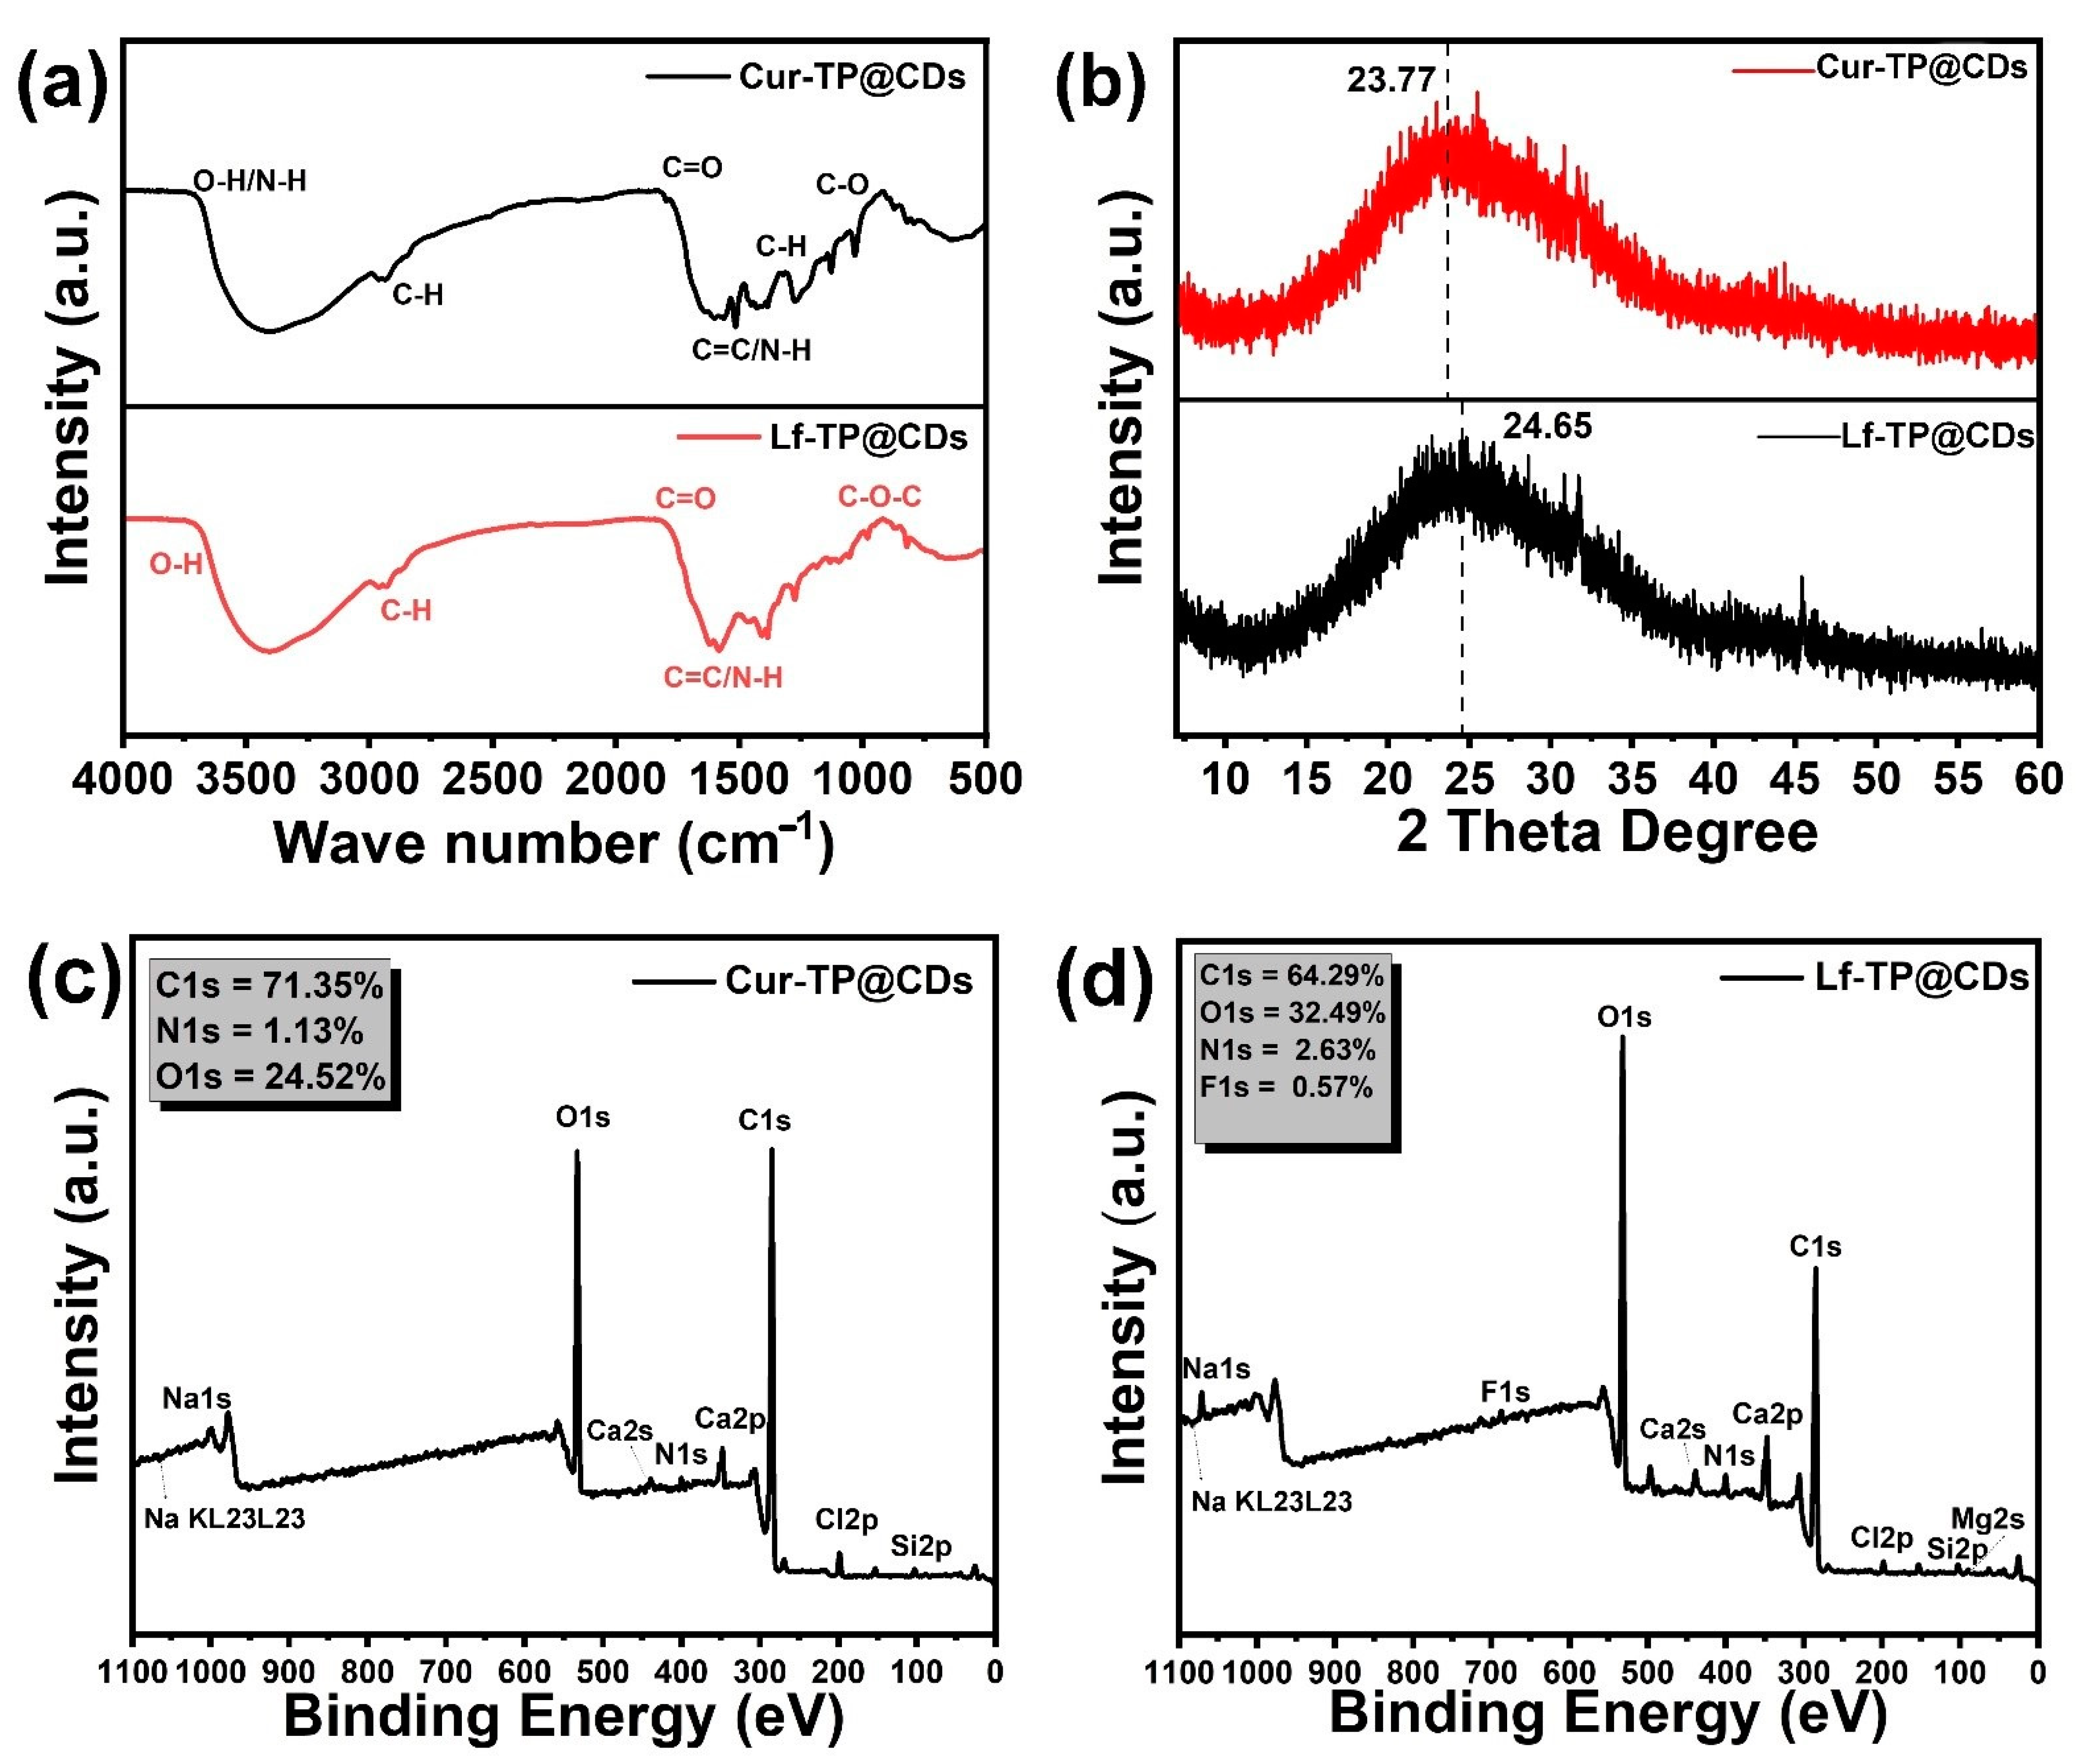
Figure 2a shows the FT-IR transmittance spectra of Cur-TP@CDs and Lf-TP@CDs, within the frequency range between 500 to 4000 cm⁻1. The broad major peak due to stretching frequency vibration in the range of 3400–3200 cm⁻1 corresponding to O-H/N-H and the peak in the range of 2850 to 2920 cm⁻1 due to stretching frequency in C-H in the methylene group are observed in both samples. The curve of Lf-TP@CDs has a significant peak around 1650 cm⁻1 representing C=O stretching vibration which is weaker for Cur-TP@CDs. Moreover, the manifestations of the absorption bands between 1500 and 1600 cm−1 for C=C/N-H stretching in both spectra also appear very evidently. Sub peaks in the range below 1000 cm⁻1 correspond to the stretching and bending of some of their carbon-oxygen–carbon chemical characteristics between the samples [30,31]. FT-IR analysis implies a similarity in the chemical constitution and atom linking of Cur-TP@CDs and Lf-TP@CDs. This similarity is reflected in the FT-IR spectra, where the peaks corresponding to O-H/N-H, C=O, and C-H stretching vibrations are present in both Lf-TP@CDs and Cur-TP@CDs. The observed similarity can be attributed to the comparable chemical environments created by the incorporation of tea polyphenols in both types of CDs. Tea polyphenols, being rich in hydroxyl and other functional groups, likely dominate the surface chemistry of the CDs, leading to similar FT-IR spectral features. Additionally, the process of CD formation tends to result in the introduction of common functional groups such as hydroxyl, carbonyl, and amine groups, further contributing to the spectral similarities—Figure 2b shows the comparison of XRD diffraction patterns of Lf-TP@CDs and Cur-TP@CDs derived from different sources. In both the samples, the broad peaks in the 23.77 and 24.77 degrees 2θ range represent that the materials are amorphous or have a nanocrystalline structure with very small crystallites therein, which is typical for CDs [32,33]. The view of the broad peaks also symbolizes a short-range order within the material, which is another characteristic disorder of CD structures. In the Lf-TP@CDs spectrum, a higher peak intensity is observed compared to the Cur-TP@CDs, which could imply a full graphitization or larger average size of crystalline domains in the Lf-TP@CDs compared to the Cur-TP@CDs. The increased broadening due to lattice distortions or partly smaller particle sizes, contained in the Cur-TP@CD structure, is the reason for the more pronounced peak broadening effect. The XPS analysis of Cur-TP@CDs (Figure 2c) and Lf-TP@CDs (Figure 2d) provides a comprehensive insight into the surface chemistry and elemental composition of these carbon dots. For Cur-TP@CDs, the survey spectrum (Figure 2c) reveals C1s, N1s, and O1s peaks at binding energies around 284 eV, 400 eV, and 532 eV, with atomic percentages of 71.35% for C1s, 1.13% for N1s, and 24.52% for O1s, along with trace amounts of Ca, Si, Na, and Cl. The high-resolution C1s spectra display (Figure S1) peaks at 284.6 eV (C-C/C=C), 286.1 eV (C-N/C-O), and 288.5 eV (C=O/C=N), while the O1s spectra (Figure S2) show peaks at 531.5 eV (C=O) and 533.2 eV (C-O). The N1s spectra (Figure S3) indicate the presence of graphitic nitrogen at around 398.5 eV and pyrrolic nitrogen at around 400 eV. Additionally, the presence of Ca2p, Ca2s, Si2p, Na1s, Na KL23L23, and Cl2p peaks is observed at binding energies of approximately 350 eV, 440 eV, 150 eV, 1070 eV, 1072 eV, and 200 eV, respectively [17]. Similarly, the XPS analysis of Lf-TP@CDs (Figure 2d) shows the presence of C1s, N1s, O1s, and an additional F1s peak at 687 eV, with atomic percentages of 64.29% for C1s, 32.49% for O1s, 2.63% for N1s, and 0.57% for F1s. The high-resolution C1s spectrum (Figure S4) reveals various chemical states of carbon, including aliphatic/aromatic carbon (C-C/C=C) at around 284.8 eV, carbon bonded to oxygen or nitrogen (C-N/C-O) at around 286.5 eV, and carbon in carbonyl or nitrile groups (C=O/C=N) at around 288.5 eV. The O1s spectrum (Figure S5) indicates the presence of carbonyl oxygen (C=O) at around 531.5 eV and alcohol/ether oxygen (C-O) at around 533 eV. The N1s spectrum (Figure S6) shows peaks corresponding to pyridinic nitrogen at around 398.5 eV, graphitic nitrogen at around 400 eV, and pyrrolic nitrogen at around 401 eV. Notably, the F1s peak is at a very low intensity, indicating it is at the detection limit. The Lf-TP@CDs spectrum also reveals Ca2p, Ca2s Mg2p, Na1s, Na KL23L23, Si2p, and Cl2p peaks at binding energies around 350 eV, 440 eV, 50 eV, 1070 eV, 1072 eV, 150 eV, and 200 eV, respectively [17]. These findings support the successful incorporation of levofloxacin and tea polyphenols in the carbon dots, as well as the presence of functional groups likely contributing to the antibacterial activity of the materials. Additionally, previously observed unidentified peaks in TP-CDs XPS spectra, possibly originating from raw tea polyphenols, may explain some of the unlabeled peaks in the Lf-TP@CDs spectra, indicating potential contributions from the precursor materials used in the synthesis.
The Raman spectral analysis deals with the structural differences of the synthesized Cur-TP@CDs and Lf-TP@CDs as shown in Figure S7a and b, respectively. These spectra show that the D band ID and G band IG are dominant, which is characteristic of carboncotaining substances. The defects and disorders in the carbon structure are related to the D band, while the G band is related to the in-plane vibrations of typical carbon atoms in the graphene sheets. The ID/IG ratio is an essential factor for understanding the structural disorder of the carbon dots. The ID/IG ratio of Cur-TP@CDs is 0.8990, which clearly shows a lower number of defects and a more ordered structure. On the other hand, Lf-TP@CDs possess a higher ID/IG ratio of 1.019, which implies a higher degree of disorder and defects. The higher ID/IG suggests that the defects induced in the preparation of Lf-TP@CDs are greater than in the Cur-TP@CDs, which may influence the physical and chemical properties of the CDs [17,33].

3.2. Optical Properties of Cur-TP@CDs and Lf-TP@CDs

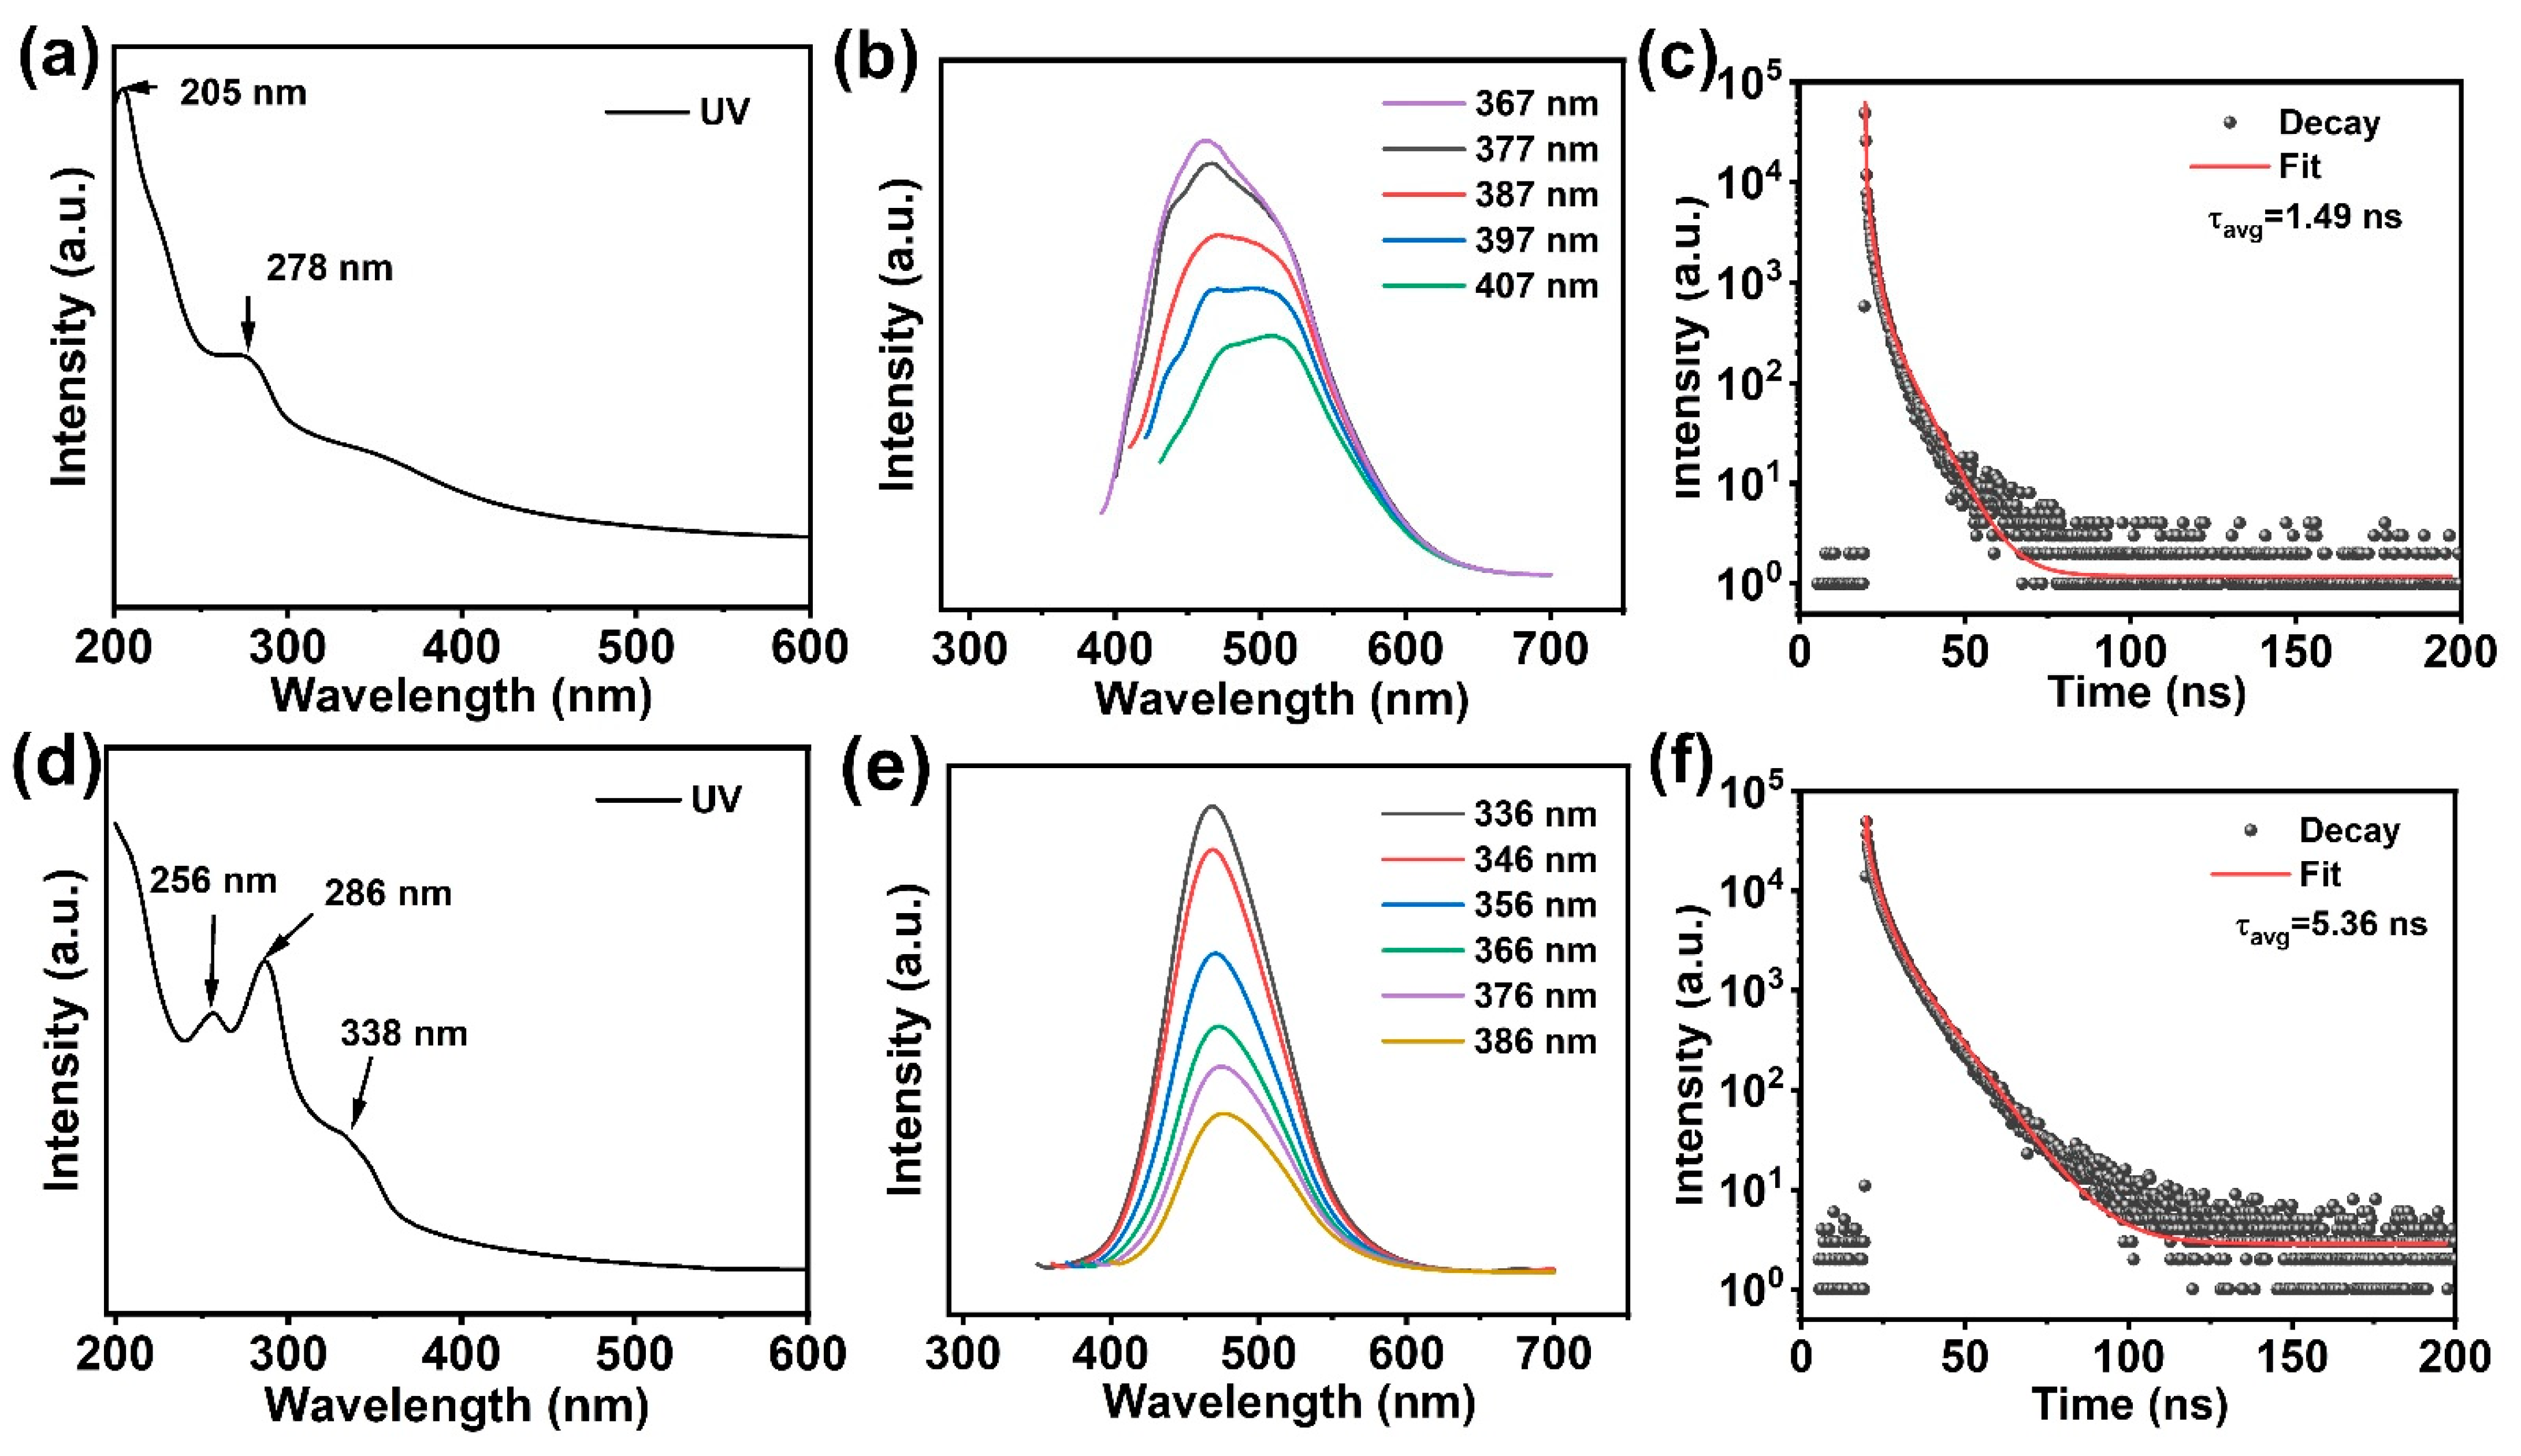
The optical properties of Cur-TP@CDs and Lf-TP@CDs demonstrate notable differences and similarities [34]. Cur-TP@CDs exhibit distinct UV-vis absorption peaks at 205 nm and 278 nm (Figure 3a), attributed to π-π* and n-π* transitions, indicating strong electronic interactions within the curcumin and tea polyphenol structure. The photoluminescence (PL) spectra (Figure 3b) reveal a dependency on the excitation wavelength, with emission peaks shifting from 367 nm to 407 nm, with the most prominent emission occurring at 367 nm, indicating a blue emission. This variability suggests multiple emissive states due to surface passivation by curcumin and tea polyphenols, enhancing the photoluminescent properties. In contrast, Lf-TP@CDs exhibit UV-vis absorption bands at 238 nm, 256 nm, and 286 nm (Figure 3d), indicating the presence of multiple electronic transitions, likely due to the interaction of levofloxacin and tea polyphenols with the carbon dots. The PL spectra of Lf-TP@CDs (Figure 3e) display a significant shift in emission peaks from 336 nm to 386 nm, with the dominant emission at 346 nm, also corresponding to a blue emission. The variation in emission peaks suggests that surface modification with levofloxacin and tea polyphenols plays a crucial role in tuning the emission properties. [35,36]. The lifetime decay analysis of both Cur-TP@CDs and Lf-TP@CDs, as illustrated in (Figure 3c,f), provides additional insight into their photoluminescent behavior. Cur-TP@CDs exhibit a decay curve that fits well to an average lifetime of 1.49 ns, while Lf-TP@CDs have a significantly longer average lifetime of 5.36 ns. The shorter lifetime of Cur-TP@CDs implies rapid recombination of charge carriers, leading to quicker relaxation processes and less stable emission over time. In contrast, the longer lifetime observed for Lf-TP@CDs suggests more efficient surface passivation, leading to more stable emissive states and slower recombination of charge carriers. Both Cur-TP@CDs and Lf-TP@CDs exhibit strong blue emissions; however, Lf-TP@CDs demonstrate a broader range of UV-vis absorption peaks and a longer average lifetime, indicating more stable and efficient photoluminescence due to enhanced surface passivation. The comparative lifetime decay results emphasize that Lf-TP@CDs possess more favorable photoluminescent characteristics, likely attributable to the more effective interaction of levofloxacin and tea polyphenols with the carbon dot surface [36].
Cur-TP@CDs and Lf-TP@CDs (Figures S8 and S9) have high quantum yields with values of 1.01 and 1.07, respectively, which indicates effective photon emission upon light absorption. A slightly higher quantum yield indicates that Lf-TP@CDs perform better at converting absorbed photons to emitted photons. Both samples showed minimal absolute and relative errors, demonstrating the accuracy and reliability of the measurements [17]. The zeta potential of Cur-TP@CDs and Lf-TP@CDs was measured against Lf, TP, and Cur raw materials as control samples (Figure S10). The results showed that the zeta potential values for the raw materials were as follows: Cur at −0.138 mV, Lf at −0.318 mV, and TP at −0.088 mV. In contrast, the functionalized particles, Cur-TP@CDs and Lf-TP@CDs, displayed significantly lower zeta potentials of −17.2 mV and −19.6 mV, respectively. These considerably low zeta potential values in the Cur-TP@CDs and Lf-TP@CDs samples, compared to the controls, indicate a promising role in enhancing their antibacterial activity. This enhancement can be attributed to the increased interaction with the negatively charged surface of bacterial cells, leading to improved adherence and penetration of cell membranes. This action may compromise the structure of the bacterial cell membranes and enhance the antibacterial function [8]. Moreover, the observed increase in the negative zeta potential means that these colloids are mutually repulsive and will remain well dispersed and active for a longer time, which can improve their ability to prevent bacterial adhesion and biofilm development. Therefore, the functionalization of these particles using CDs and other additives effectively boosts their potential to become potent antibacterial agents. Compared to the control samples (Lf, TP, Cur), the Cur-TP@CDs and Lf-TP@CDs show a notable shift towards more negative values, highlighting the enhanced stability and antibacterial properties of the functionalized particles.

3.3. ROS Production of Cur-TP@CDs and Lf-TP@CDs

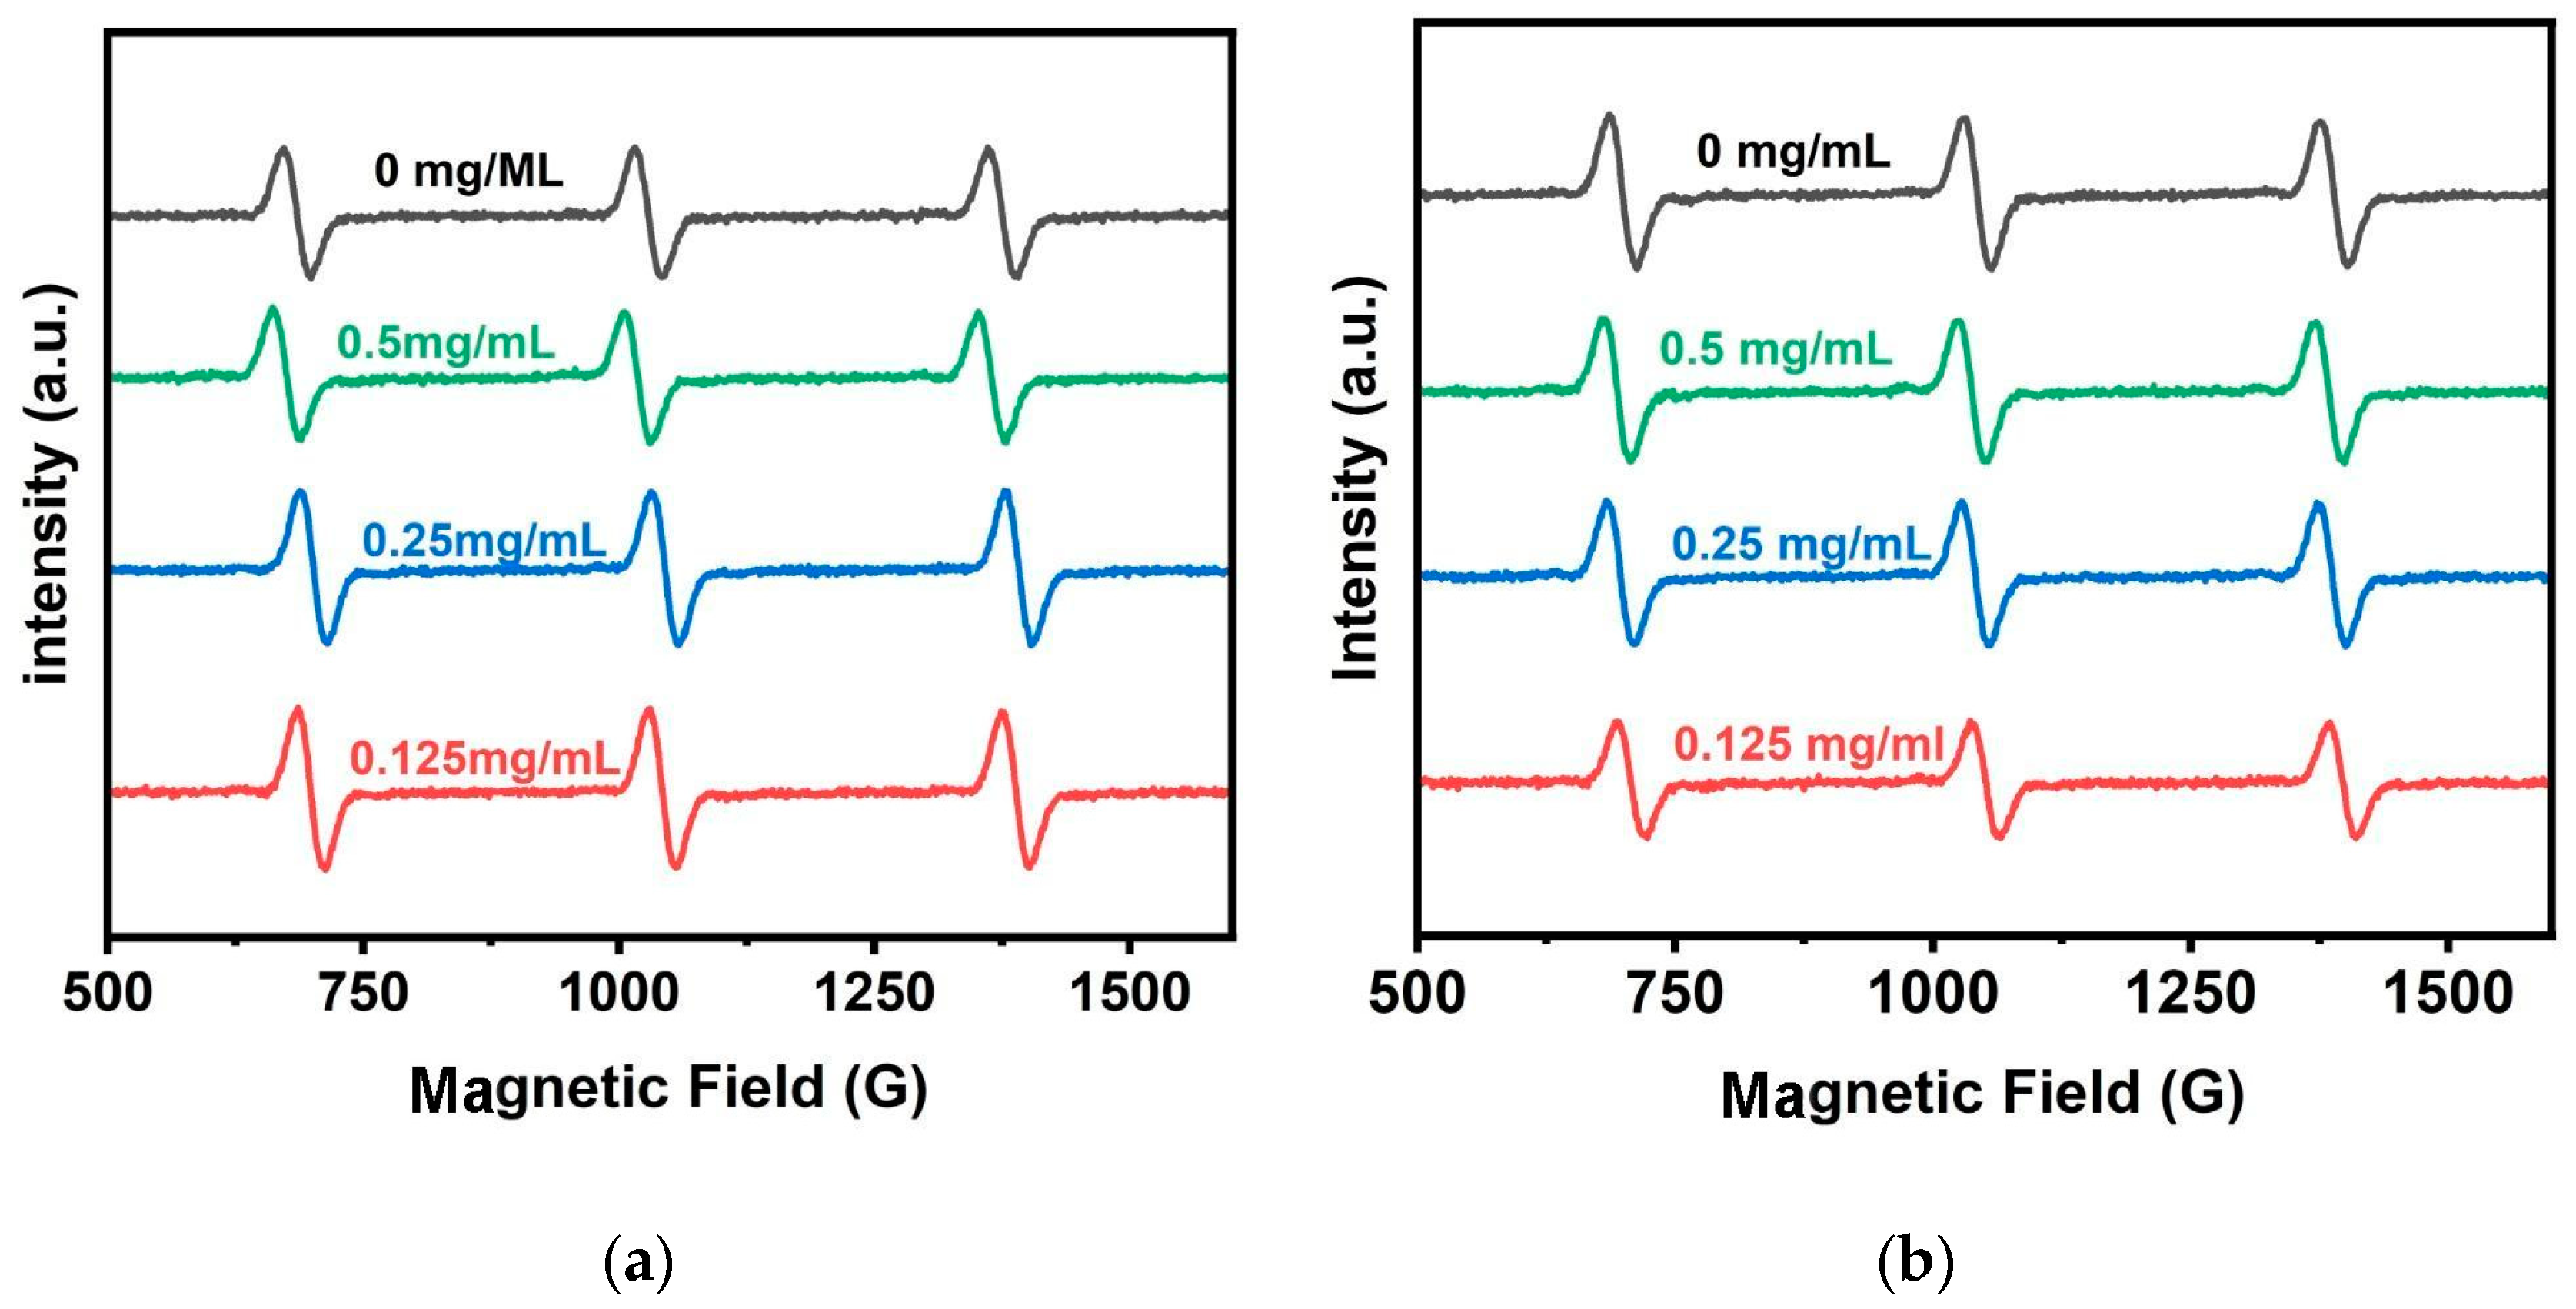
The ESR spectra (Figure 4a,b) for Lf-TP@CDs and Cur-TP@CDs show the intensity of ESR signals for samples at various concentrations: 0 mg/mL, 0.5 mg/mL, 0.25 mg/mL, and 0.125 mg/mL [37]. In total, 100 µL of sample from each concentration was taken and 10 µL of TEMP spin trapping agent was added to the sample tube for the experiment [35]. In the case of Cur-TP@CDs (Figure 4a) the relative ESR signal intensities of singlet oxygen (1O2) are approximately −1.134, −1.192, −1.123, and −1.241 a.u. and in (Figure 4b) Lf-TP@CDs, the relative signal intensities are approximately −1.155, −1.115, −1.070, and −1.038 a.u. for the respective concentrations. Despite the variation in concentration, all the relative ESR signal intensities have no obvious change, indicating that both carbon dot samples are not generating significant levels of 1O2. In the meantime, we have utilized DEMPO 5-(Diethoxyphosphoryl)-5-methyl-1-pyrroline-N-oxide as a trapping agent to detect the presence of hydroxyl or superoxide anions [38]. However, the ESR signals did not provide clear or conclusive evidence for the production of these reactive oxygen species (ROSs). The lack of distinctive peaks across all tested concentrations suggests that both CD samples do not produce detectable amounts of ROSs. In summary, while levofloxacin and curcumin are known for their antibiotic properties, the lack of ROS production observed in the ESR spectra suggests that their antibacterial effects may be due to other mechanisms of action. These compounds could be exerting their antibacterial effects through pathways that do not involve the generation of ROSs. Specifically, levofloxacin and curcumin might target bacterial DNA and RNA [39], disrupting vital cellular processes and leading to bacterial cell death. Thus, the antibacterial effects of these compounds could be attributed to their interactions with bacterial genetic material rather than ROS production.

3.4. Antibacterial Mechanism of Cur-TP@CDs and Lf-TP@CDs

3.4.1. Broth Dilution Assay

The survival rates of S. aureus (Figure 5a) and E. coli (Figure 5b) at various concentrations of Lf-TP@CDs and Cur-TP@CDs are illustrated. For S. aureus (Figure 5a), the concentration of Lf-TP@CDs increases from 0 to 1.5 mg/mL, and it was found that at higher concentrations, Lf-TP@CDs significantly diminish the survival of bacteria more than Cur-TP@CDs (Figure 5b). Both bacterial strains exhibit high survival rates at lower concentrations; however, at 0.5 mg/mL, Lf-TP@CDs are particularly effective against E. coli. In the case of S. aureus, Lf-TP@CDs result in very low survival rates at higher concentrations, whereas Cur-TP@CDs lead to higher survival rates, indicating that E. coli is not as sensitive to low concentrations of Cur-TP@CDs. The sensitivity of the E. coli strains to Lf-TP@CDs is higher compared to S. aureus. This is indicative of the differences in their bacterial structures. S. aureus, a Gram-positive bacterium, has a relatively thick peptidoglycan layer but lacks an outer membrane, making it more sensitive to factors that compromise cell wall integrity. In contrast, E. coli is Gram-negative, with a thinner peptidoglycan layer and an outer membrane that provides an additional layer of resistance. These structural differences account for the varying susceptibilities, with Lf-TP@CDs being particularly effective against the cell wall of Gram-positive strains like S. aureus [4,40,41].

3.4.2. Disc Diffusion Assay

The antibacterial activity of Cur-TP@CDs (Figure S11) and Lf-TP@CDs (Figure S12) was explored through disc diffusion assays against S. aureus and E. coli [23,24]. The assays were conducted using ampicillin as the positive control and sterile distilled water as the negative control. The results showed no significant inhibition at 0.125 mg/mL for S. aureus, but a slight inhibition zone appeared at 0.25 mg/mL, which became more prominent at 0.5 mg/mL. The inhibition zones significantly increased at 1 mg/mL and reached a maximum of 1.5 mg/mL. The largest zone of inhibition was 20.90 mm at 1.5 mg/mL. For E. coli, no significant inhibition was observed at 0.125 mg/mL, but a slight inhibition zone appeared at 0.25 mg/mL, which became more pronounced at 0.5 mg/mL. The highest concentration showed the largest zone of inhibition at 20.90 mm. The results suggest that both Cur-TP@CDs and Lf-TP@CDs exhibit concentration-dependent antibacterial activity against both S. aureus. Lf-TP@CDs showed slightly higher efficacy compared to Cur-TP@CDs, particularly at higher concentrations.

3.4.3. Biofilm Inhibition Evaluation

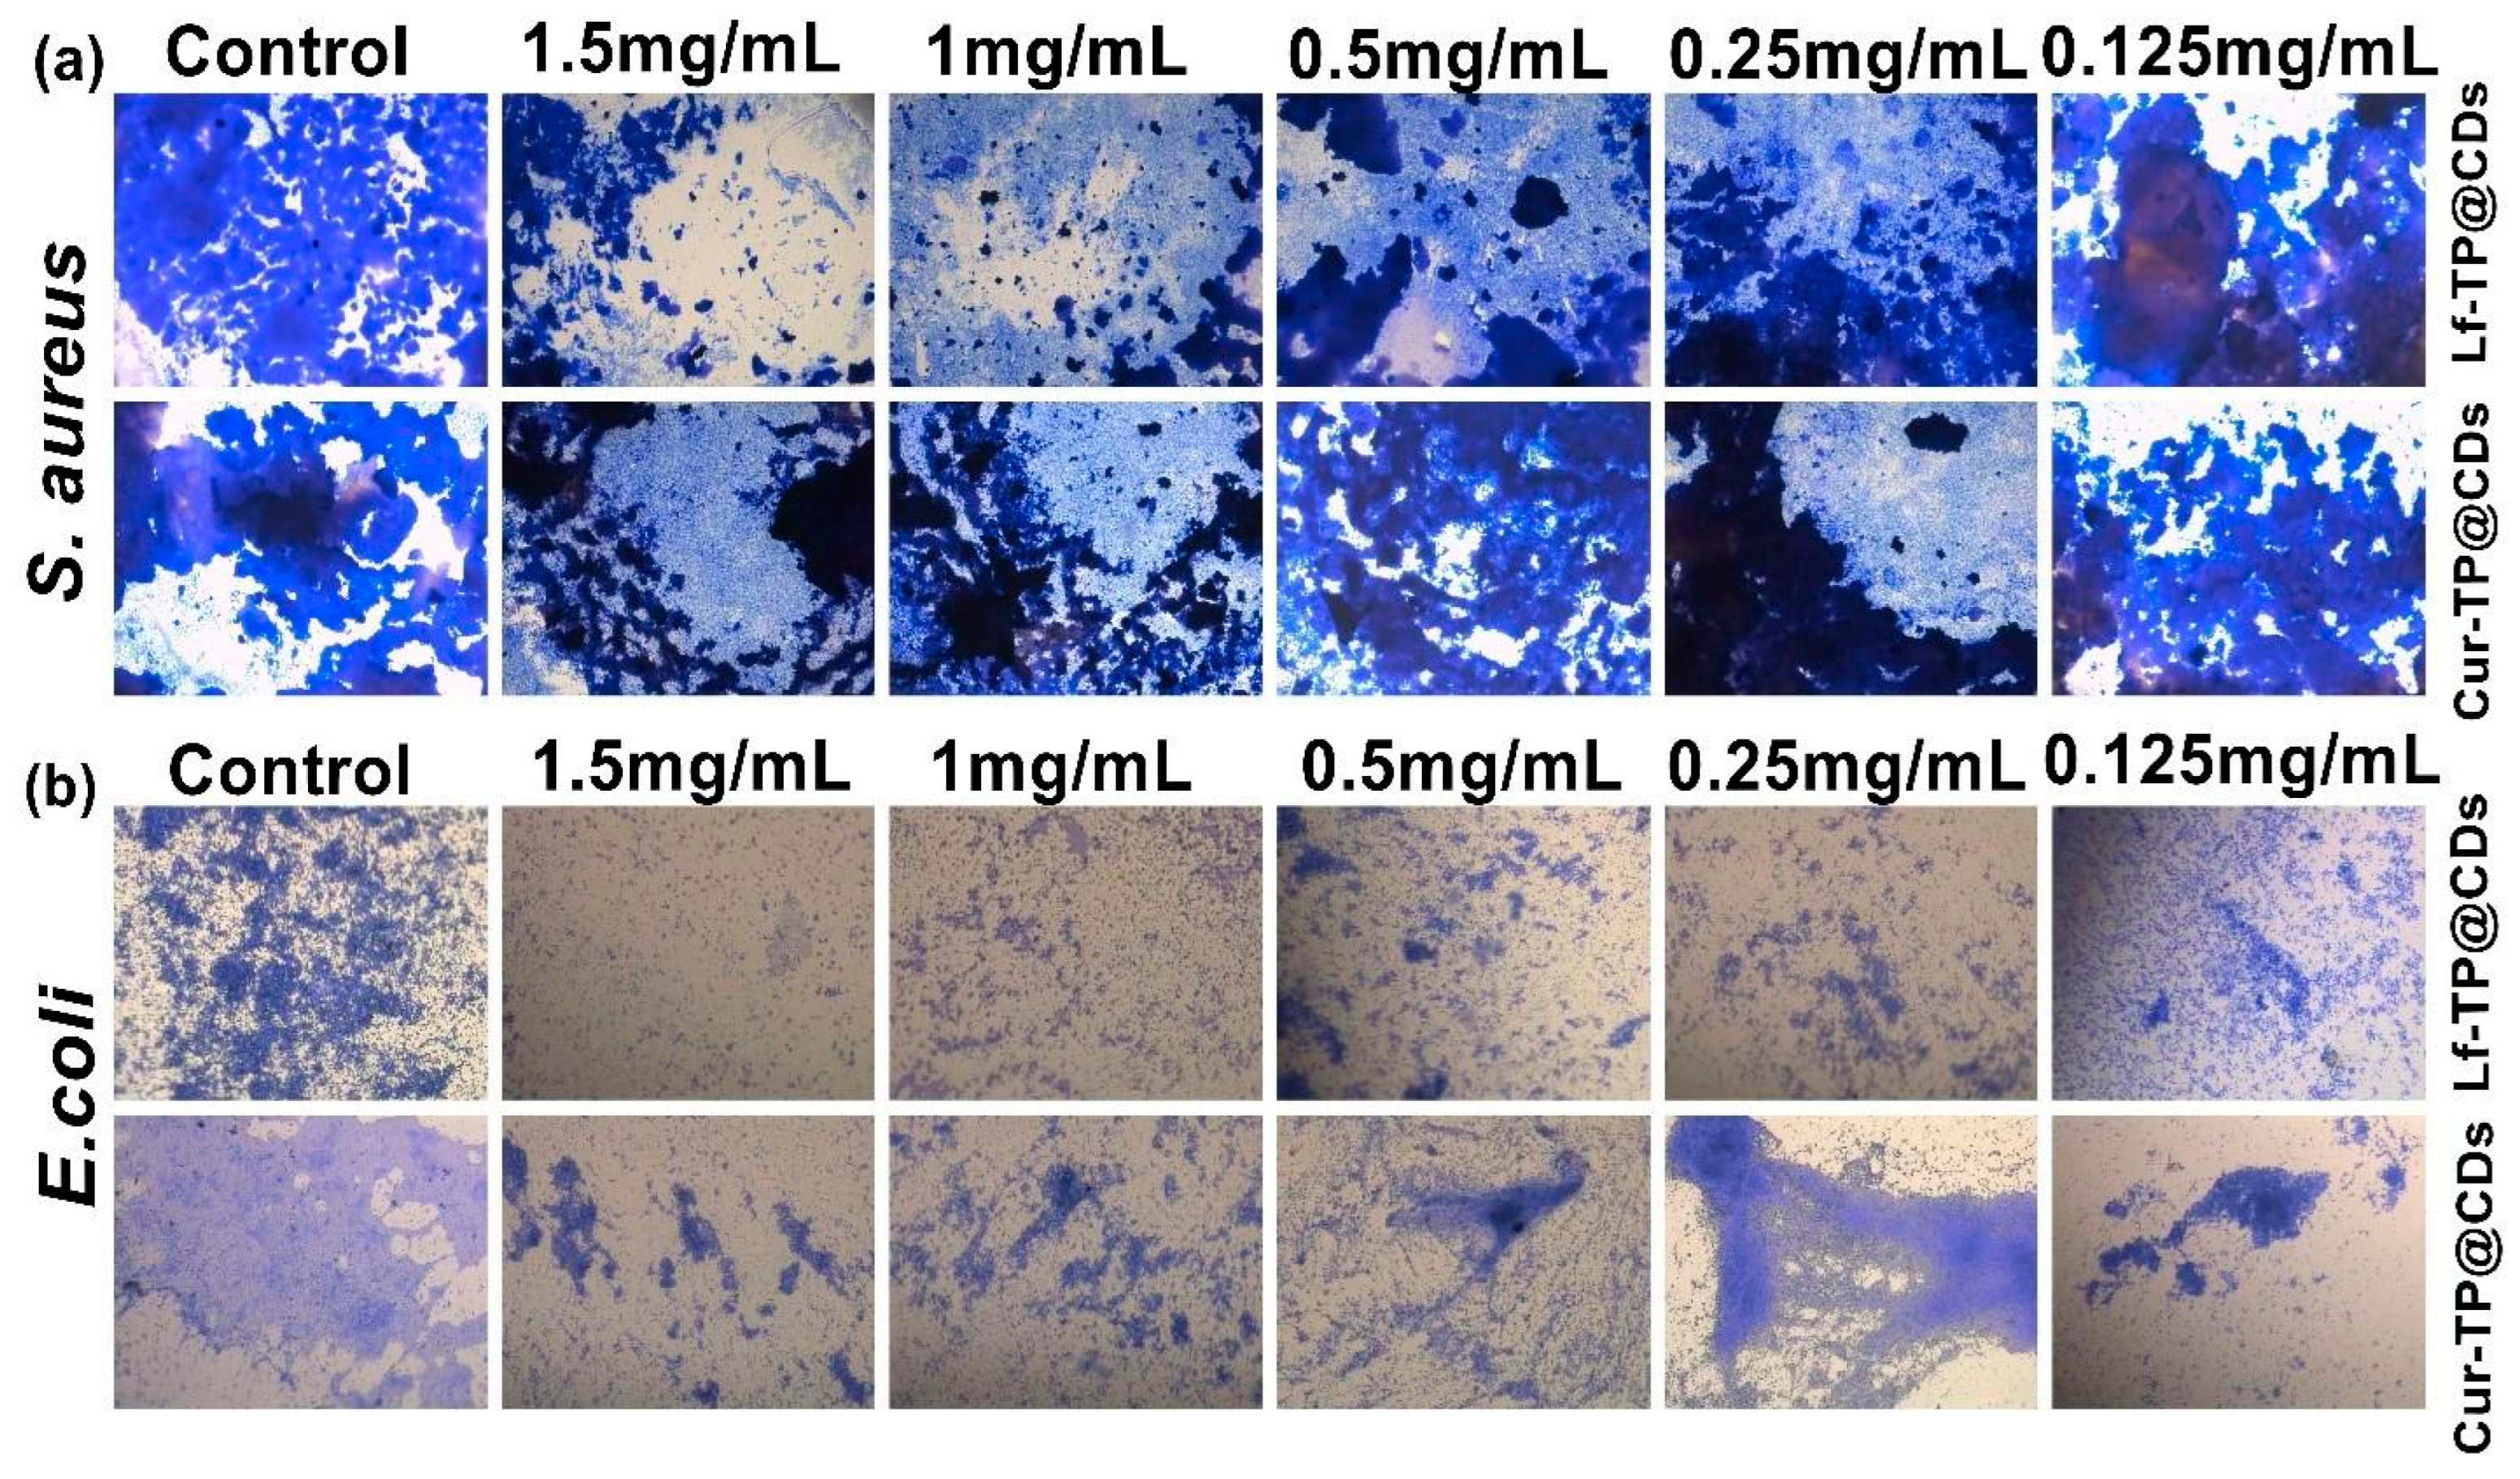
Figure 6a,b represents the effect of different concentrations (1.5 mg/mL, 1 mg/mL, 0.5 mg/mL, 0.25 mg/mL, and 0.125 mg/mL) of Lf-TP@CDs and Cur-TP@CDs on the biofilm formation of the selected bacterial species, S. aureus and E. coli. In the control samples, a significant biofilm layer was formed by the crystal violet staining [42]. It was observed that with the increase in the concentration of CDs, the biofilm formation was decreased for both types of bacteria. Specifically, Cur-TP@CDs showed a greater reduction of S. aureus growth than Lf-TP@CDs due to lesser blue staining at higher concentrations. In E. coli, both the developed CDs had potent biofilm inhibition, however, the potent inhibition of biofilm formation is depicted at higher concentrations. The synthesized CD samples have the potential to prevent biofilm formation by interfering with bacterial cell attachment and biofilm matrix production.

3.4.4. Live and Dead Bacterial Staining

The antibacterial effects of Cur-TP@CDs and Lf-TP@CDs against S. aureus and E. coli were evaluated using fluorescence-based assays. Live and dead bacteria fluoresced in brightfield (BF) and merged fluorescence (combined green and red) [26]. Cur-TP@CDs showed (Figure S13) a high proportion of live bacteria at 0.125 mg/mL, while Lf-TP@CDs showed (Figure S14) high green fluorescence with some red spots. At higher concentrations, the green fluorescence gradually decreased while the red fluorescence increased, which indicated more and more dead bacteria. The control group had a high green fluorescence and thus contained mostly live bacteria. Cur-TP@CDs and Lf-TP@CDs performed dose-dependent antibacterial effects against S. aureus, where higher concentrations caused fewer live bacteria (lower numbers) and more dead bacteria (higher numbers). Both the samples showed (Figures S15 and S16) a dose-dependent antibacterial effect against E. coli, with decreased bacterial density in the BF images with higher concentrations. Also, both the CD samples showed increasing antibacterial efficacy with higher concentrations, with a decreasing live cell count, an increasing dead cell count, and a reduction in overall bacterial density in BF images.

3.4.5. SEM Analysis

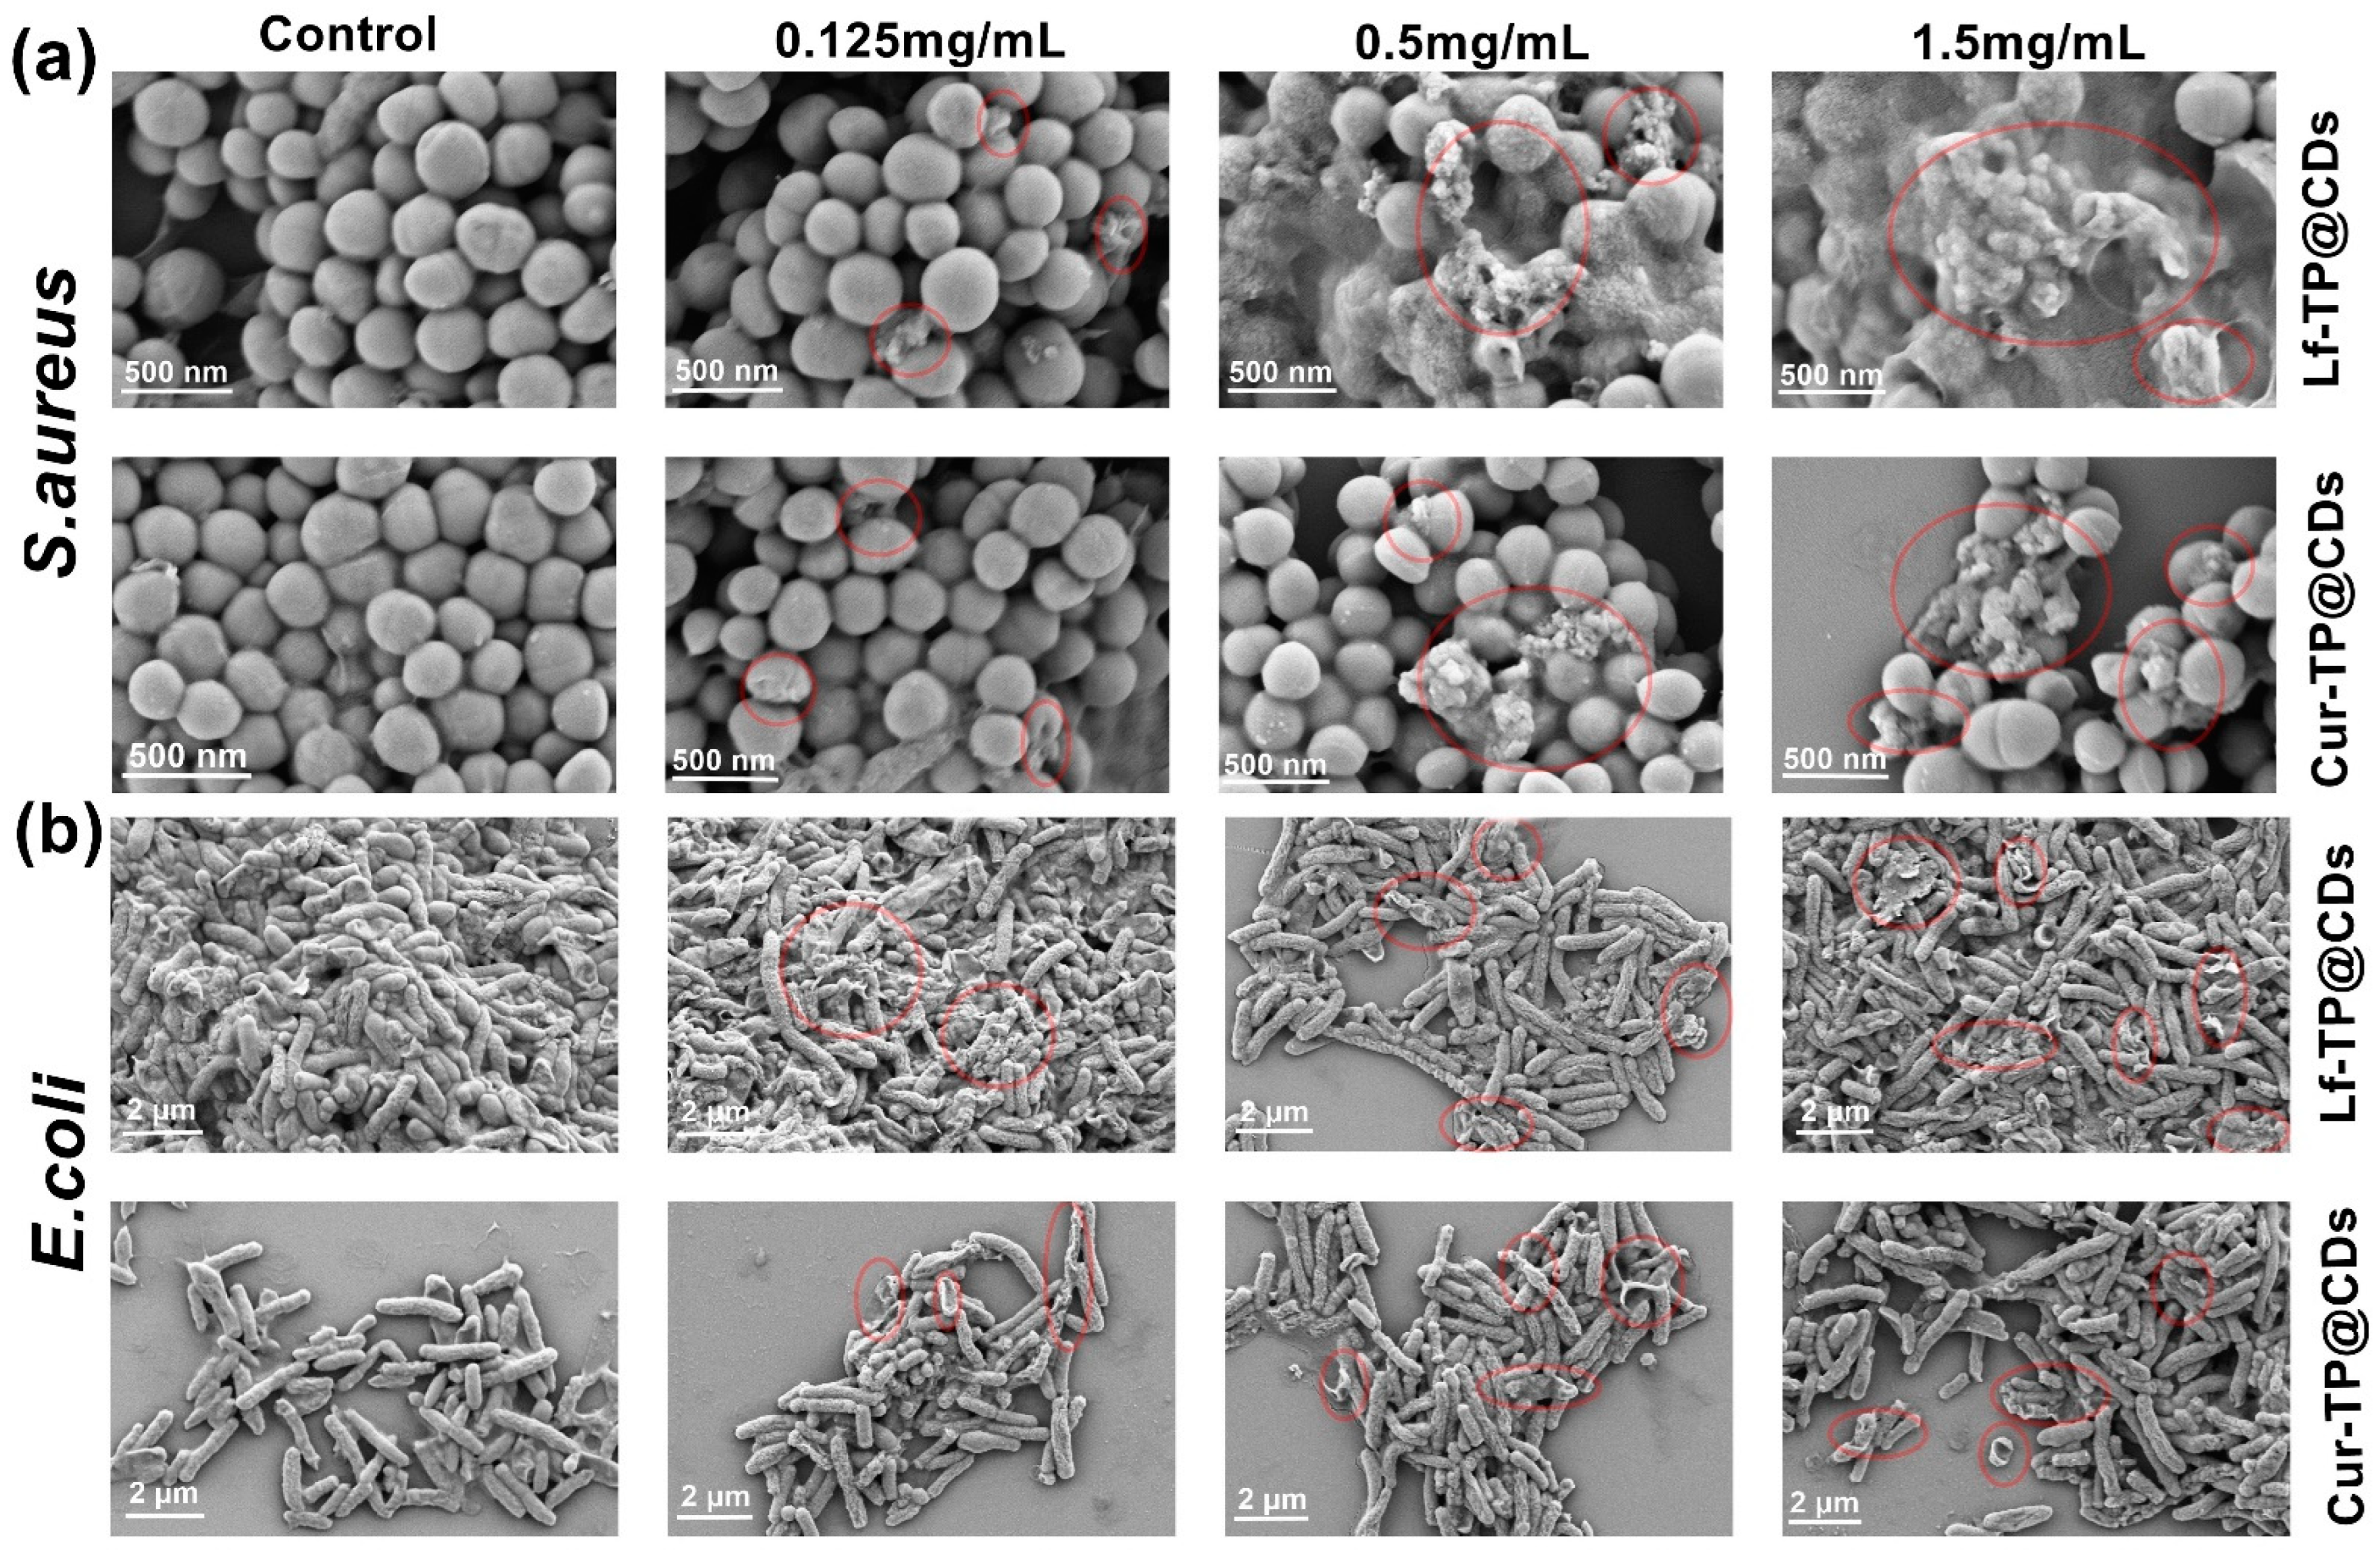
The SEM images (Figure 7) demonstrated that the concentrations of Cur-TP@CDs and Lf-TP@CDs affect the bacterial strains (S. aureus and E. coli). In the control samples, the bacterial morphology is unchanged, where S. aureus forms spherical clusters and E. coli forms rod-shaped cells. Increasing the concentration of CDs leads to considerable morphological changes. For S. aureus, at a higher concentration of carbon dots, there were significant changes in cell wall morphology as seen by aggregation and rounding up, which represents cell lysis as depicted by the red circles. Similarly, at higher concentrations, E. coli also exhibits extreme morphological changes, which include the formation of large clumps and a discernible rupture of the cell wall. These effects are more noticeable at a concentration of 1.5 mg/mL, and it is apparent that the developed CDs have a dose-dependent antibacterial activity [43].
Unlike prior research by Wu et al. [13] which focused solely on levofloxacin-based CDs with significant antibacterial activity but limited structural stability, our present work incorporates tea polyphenols and curcumin to achieve a more robust and multifunctional antibacterial agent. This approach not only leverages the broad-spectrum antibiotic properties of levofloxacin but also enhances the stability and bioavailability of the CDs through the inclusion of tea polyphenols, which are rich in functional groups and antioxidants. Furthermore, while studies like Miao et al. [4] developed ciprofloxacin-based CDs with notable antibacterial properties, they did not explore the potential benefits of combining multiple bioactive compounds. This present study also addresses this gap by demonstrating that integrating curcumin, known for its anti-inflammatory and antibacterial properties, with levofloxacin and tea polyphenols provides an enhanced antibacterial effect, particularly against antibiotic-resistant strains. This multifaceted approach improves antibacterial efficacy and offers a novel method for stabilizing CDs and overcoming the limitations of using single agents.

4. Conclusions

In this study, we have successfully synthesized CDs using levofloxacin, curcumin, and tea polyphenols through a facile hydrothermal method. The structural, optical, and antibacterial properties of the developed CDs were thoroughly characterized. Both CDs (Cur-TP@CDs and Lf-TP@CDs) demonstrated notable antibacterial activity against the selected pathogenic bacterial strains (S. aureus and E. coli), with Lf-TP@CDs showing particularly potent effects. Survival rate assays indicated that Lf-TP@CDs significantly reduced the survival rates of both bacterial strains more effectively than Cur-TP@CDs, highlighting their potential in combating bacterial resistance and infections. The concentration-dependent antibacterial activity, confirmed by the disc diffusion assay, revealed larger inhibition zones at higher concentrations of CDs. While levofloxacin and curcumin are recognized for their antibiotic properties, the absence of ROS production observed in the ESR spectra suggests alternative mechanisms for their antibacterial effects. Biofilm inhibition assays showed that both types of CDs effectively prevent biofilm formation by disrupting bacterial cell attachment and the production of the biofilm matrix, addressing biofilm-related resistance. Fluorescence-based assays demonstrated increased bacterial cell death with higher concentrations of CDs, further justifying their antibacterial efficacy. The combination of tea polyphenols, levofloxacin, and curcumin for the synthesis of CDs presents a novel and synergistic approach to enhancing antibacterial efficacy. This research presents a significant and novel contribution to the field of antibacterial agents. The innovative combination of tea polyphenols, levofloxacin, and curcumin in CD synthesis offers a more effective and stable antibacterial agent with enhanced capabilities against resistant bacteria.

Supplementary Materials

The following supporting information can be downloaded at: https://www.mdpi.com/article/10.3390/c10030084/s1, Figure S1: XPS C1s spectrum of Cur-TP@CDs; Figure S2: XPS O1s spectrum of Cur-TP@CDs; Figure S3: XPS N1s spectrum of Cur-TP@CDs; Figure S4: XPS C1s spectrum of Lf-TP@CDs; Figure S5: XPS O1s spectrum of Lf-TP@CDs; Figure S6: XPS N1s spectrum of Lf-TP@CDs; Figure S7: (a) Raman spectra of Cur-TP@CDs (b) Raman spectra of Lf-TP@CDs; Figure S8: Absolute quantum yield of Cur-TP@CDs; Figure S9: Absolute quantum yield of Lf-TP@CDs; Figure S10: Zeta potential measurements of Lf, TP, Cur, Cur-TP@CDs and Lf-TP@CDs; Figure S11: Antibacterial activity of Cur-TP@CDs and Lf-TP@CDs against S. aureus; Figure S12: Antibacterial activity of Cur-TP@CDs and Lf-TP@CDs against E.Coli; Figure S13: Live/Dead Bacterial Viability Assay of Cur-TP@CDs against S. aureus; Figure S14: Live/Dead Bacterial Viability Assay of Lf-TP@CDs against S. aureus; Figure S15: Live/Dead Bacterial Viability Assay of Cur-TP@CDs against E. coli; Figure S16. Live/Dead Bacterial Viability Assay of Lf-TP@CDs against E. coli.

Author Contributions

Conceptualization, Data curation, Methodology, and Writing—original draft, K.A.; Investigation, K.A., H.Z. and W.Q.; Formal Analysis, H.Z.; Validation, M.W.; Funding acquisition, Project administration, and Supervision, H.B.; Writing—review and editing, Z.L. and H.B. All authors have read and agreed to the published version of the manuscript.

Funding

This work was financially supported by the National Natural Science Foundations of China (grant nos. 52172033). We gratefully acknowledge the financial support from the National Key R&D Program of China (Grant No. 2021YFA1600202).

Data Availability Statement

Data used in this work are available upon a reasonable request to the corresponding authors.

Acknowledgments

The authors acknowledge the support of the Key Laboratory of Structure and Functional Regulation of Hybrid Materials of the Ministry of Education, Anhui University, China. The authors also acknowledge the support of the Key Laboratory of Environment Friendly Polymer Materials of Anhui Province, Anhui University, China. The authors would like to thank Jia Rong Wang and Junfeng Wang at High Magnetic Field Laboratory, Hefei Institutes of Physical Science, Chinese Academy of Sciences, P. R. China for their kind help in bacteria incubation. The authors also like to thank Jingmin Wang at the School of Life Sciences, Anhui University, P. R. China for technical and experimental help.

Conflicts of Interest

The authors declare no conflicts of interest.

References

  1. Mancuso, G.; Midiri, A.; Gerace, E.; Biondo, C. Bacterial antibiotic resistance: The most critical pathogens. Pathogens 2021, 10, 1310. [Google Scholar] [CrossRef] [PubMed]
  2. Wu, Y.; Li, C.; van der Mei, H.C.; Busscher, H.J.; Ren, Y. Carbon quantum dots derived from different carbon sources for antibacterial applications. Antibiotics 2021, 10, 623. [Google Scholar] [CrossRef] [PubMed]
  3. Deusenbery, C.; Wang, Y.; Shukla, A. Recent innovations in bacterial infection detection and treatment. ACS Infect. Dis. 2021, 7, 695–720. [Google Scholar] [CrossRef] [PubMed]
  4. Miao, H.; Wang, P.; Cong, Y.; Dong, W.; Li, L. Preparation of ciprofloxacin-based carbon dots with high antibacterial activity. Int. J. Mol. Sci. 2023, 24, 6814. [Google Scholar] [CrossRef] [PubMed]
  5. Sharma, A.; Saini, A.K.; Kumar, N.; Tejwan, N.; Singh, T.A.; Thakur, V.K.; Das, J. Methods of preparation of metal-doped and hybrid tungsten oxide nanoparticles for anticancer, antibacterial, and biosensing applications. Surf. Interfaces 2022, 28, 101641. [Google Scholar] [CrossRef]
  6. Avcu, E.; Bastan, F.E.; Guney, M.; Avcu, Y.Y.; Rehman, M.A.U.; Boccaccini, A.R. Biodegradable polymer matrix composites containing graphene-related materials for antibacterial applications: A critical review. Acta Biomater. 2022, 151, 1–44. [Google Scholar] [CrossRef]
  7. Lin, F.; Wang, Z.; Wu, F.-G. Carbon dots for killing microorganisms: An update since 2019. Pharmaceuticals 2022, 15, 1236. [Google Scholar] [CrossRef]
  8. Yang, J.; Zhang, X.; Ma, Y.-H.; Gao, G.; Chen, X.; Jia, H.-R.; Li, Y.-H.; Chen, Z.; Wu, F.-G. Carbon dot-based platform for simultaneous bacterial distinguishment and antibacterial applications. ACS Appl. Mater. Interfaces 2016, 8, 32170–32181. [Google Scholar] [CrossRef]
  9. Song, Y.; Lu, F.; Li, H.; Wang, H.; Zhang, M.; Liu, Y.; Kang, Z. Degradable carbon dots from cigarette smoking with broad-spectrum antimicrobial activities against drug-resistant bacteria. ACS Appl. Bio Mater. 2018, 1, 1871–1879. [Google Scholar] [CrossRef]
  10. Yan, Y.; Kuang, W.; Shi, L.; Ye, X.; Yang, Y.; Xie, X.; Shi, Q.; Tan, S. Carbon quantum dot-decorated TiO2 for fast and sustainable antibacterial properties under visible-light. J. Alloys Compd. 2019, 777, 234–243. [Google Scholar] [CrossRef]
  11. Lu, F.; Wang, Y.; Li, Z.; Zhang, J.; Wang, Y.; Liu, H.; Wu, W. Water-solvable carbon dots derived from curcumin and citric acid with enhanced broad-spectrum antibacterial and antibiofilm activity. Mater. Today Commun. 2021, 26, 102000. [Google Scholar] [CrossRef]
  12. Liang, J.; Li, W.; Chen, J.; Huang, X.; Liu, Y.; Zhang, X.; Shu, W.; Lei, B.; Zhang, H. Antibacterial activity and synergistic mechanism of carbon dots against Gram-positive and-negative bacteria. ACS Appl. Bio Mater. 2021, 4, 6937–6945. [Google Scholar] [CrossRef] [PubMed]
  13. Wu, L.-N.; Yang, Y.-J.; Huang, L.-X.; Zhong, Y.; Chen, Y.; Gao, Y.-R.; Lin, L.-Q.; Lei, Y.; Liu, A.-L. Levofloxacin-based carbon dots to enhance antibacterial activities and combat antibiotic resistance. Carbon 2022, 186, 452–464. [Google Scholar] [CrossRef]
  14. Jiang, L.; Zhang, Q.; Li, Z.; Zhao, Y.; Wang, J.; Zhang, Y.; Liu, J.; Wang, Y.; Hu, X. RNA-Targeting Carbon Dots for Live-Cell Imaging of Granule Dynamics. Adv. Mater. 2023, 35, 2210776. [Google Scholar] [CrossRef] [PubMed]
  15. Sadaqat, M.H.; Mohabati Mobarez, A.; Nikkhah, M. Curcumin Carbon Dots Inhibit Biofilm Formation and Expression of esp and gelE Genes of Enterococcus faecium. Microb. Pathog. 2022, 173, 105860. [Google Scholar] [CrossRef]
  16. Serag, E.; Helal, M.; El Nemr, A. Curcumin Loaded onto Folic Acid Carbon Dots as a Potent Drug Delivery System for Antibacterial and Anticancer Applications. J. Cluster Sci. 2024, 35, 519–532. [Google Scholar] [CrossRef]
  17. Yang, Y.; Ding, H.; Li, Z.; Tedesco, A.C.; Bi, H. Carbon dots derived from tea polyphenols as photosensitizers for photodynamic therapy. Molecules 2022, 27, 8627. [Google Scholar] [CrossRef]
  18. Su, R.; Chen, Z.; Zhang, J.; Wu, S.; Wang, Y.; Wang, Z.; Xie, S.; Li, D.; Sun, Y.; Jia, X.; et al. Orange-red to NIR emissive carbon dots for antimicrobial, bioimaging and bacteria diagnosis. J. Mater. Chem. B 2022, 10, 1250–1264. [Google Scholar] [CrossRef]
  19. Prathap, N.; Balla, P.; Shivakumar, M.S.; Periyasami, G.; Karuppiah, P.; Ramasamy, K.; Venkatesan, S. Prosopis juliflora hydrothermal synthesis of high fluorescent carbon dots and its antibacterial and bioimaging applications. Sci. Rep. 2023, 13, 9676. [Google Scholar] [CrossRef]
  20. Dop, R.A.; Neill, D.R.; Hasell, T. Sulfur-polymer nanoparticles: Preparation and antibacterial activity. ACS Appl. Mater. Interfaces 2023, 15, 20822–20832. [Google Scholar] [CrossRef]
  21. Lazou, T.P.; Chaintoutis, S.C. Comparison of disk diffusion and broth microdilution methods for antimicrobial susceptibility testing of Campylobacter isolates of meat origin. J. Microbiol. Methods 2023, 204, 106649. [Google Scholar] [CrossRef] [PubMed]
  22. Chaure, A.; Houdkova, M.; Antih, J.; Urbanova, K.; Doskocil, I.; Naik, M.L.; Patel, K.S.; Kokoska, L. Validation of Broth Macrodilution Volatilization Method for Testing of Essential Oils in Liquid and Vapor Phase: Chemical Composition, Cytotoxicity, and Antibacterial Effect of Indian Medicinal Plants against Pneumonia-Causing Pathogens. Molecules 2023, 28, 4625. [Google Scholar] [CrossRef] [PubMed]
  23. Bourhou, C.; Benouda, H.; Bellaouchi, R.; Merzouki, M.; Fraj, E.; Harit, T.; Challioui, A.; Asehraou, A.; Touzani, R.; Ozdemir, I. Synthesis of novel tetrazolic derivatives and evaluation of their antimicrobial activity. J. Mol. Struct. 2023, 1278, 134913. [Google Scholar] [CrossRef]
  24. Mohammed, A.M.; Hassan, K.T.; Hassan, O.M. Assessment of antimicrobial activity of chitosan/silver nanoparticles hydrogel and cryogel microspheres. Int. J. Biol. Macromol. 2023, 233, 123580. [Google Scholar] [CrossRef] [PubMed]
  25. Arslan, E.; Coşkun, M.K.; Çobanoğlu, Ş.; Aslan, M.H.; Yazıcı, A. Effects of four antibiotics on Pseudomonas aeruginosa motility, biofilm formation, and biofilm-specific antibiotic resistance genes expression. Diagn. Microbiol. Infect. Dis. 2023, 106, 115931. [Google Scholar] [CrossRef]
  26. Xiao, S.; Cao, C.; Ming, T.; Cao, Y.; Yu, Z.; Gan, N. Simultaneous and rapid screening of live and dead E. coli O157 with three signal outputs: An all-in-one biosensor using phage-apoferritin@ CuO2 signal tags on MXenes-modified electrode platform. J. Hazard. Mater. 2023, 458, 131875. [Google Scholar] [CrossRef]
  27. Hisada, A.; Matsumoto, E.; Hirano, R.; Konomi, M.; Bou Khalil, J.Y.; Raoult, D.; Ominami, Y. Detection of antimicrobial impact on gram-negative bacterial cell envelope based on single-cell imaging by scanning electron microscopy. Sci. Rep. 2023, 13, 11258. [Google Scholar] [CrossRef]
  28. Liu, H.; Lv, X.; Qian, J.; Li, H.; Qian, Y.; Wang, X.; Meng, X.; Lin, W.; Wang, H. Graphitic carbon nitride quantum dots embedded in carbon nanosheets for near-infrared imaging-guided combined photo-chemotherapy. ACS Nano 2020, 14, 13304–13315. [Google Scholar] [CrossRef]
  29. Lan, M.; Zhao, S.; Zhang, Z.; Yan, L.; Guo, L.; Niu, G.; Zhang, J.; Zhao, J.; Zhang, H.; Wang, P. Two-photon-excited near-infrared emissive carbon dots as multifunctional agents for fluorescence imaging and photothermal therapy. Nano Res. 2017, 10, 3113–3123. [Google Scholar] [CrossRef]
  30. Chugh, R.; Kaur, G. A novel facile synthesis of carbon dots-silver nanocomposite (CDs–Ag NCs) as potent antibacterial agent. Chem. Pap. 2023, 77, 5751–5761. [Google Scholar] [CrossRef]
  31. Sinelnik, A.D.; Rybin, M.V.; Gets, D.S.; Khubezhov, S.A.; Zelenkov, L.E.; Makarov, S.V.; Shishkin, I.I. Ultra-broadband photoluminescent carbon dots synthesized by laser-induced thermal shock. Laser Photon. Rev. 2023, 17, 2200295. [Google Scholar] [CrossRef]
  32. Wang, S.; Ma, M.; Liang, Q.; Wu, X.; Abbas, K.; Zhu, J.; Xu, Q.; Tedesco, A.C.; Bi, H. Single-atom manganese anchored on carbon dots for promoting mitochondrial targeting and photodynamic effect in cancer treatment. ACS Appl. Nano Mater. 2022, 5, 6679–6690. [Google Scholar] [CrossRef]
  33. Wu, X.; Xu, M.; Wang, S.; Abbas, K.; Huang, X.; Zhang, R.; Tedesco, A.C.; Bi, H. F, N-Doped carbon dots as efficient type I photosensitizers for photodynamic therapy. Dalton Trans. 2022, 51, 2296–2303. [Google Scholar] [CrossRef] [PubMed]
  34. Wen, F.; Li, P.; Meng, H.; Yan, H.; Huang, X.; Cui, H.; Su, W. Nitrogen-doped carbon dots/curcumin nanocomposite for combined photodynamic/photothermal dual-mode antibacterial therapy. Photodiagn. Photodyn. Ther. 2022, 39, 103033. [Google Scholar] [CrossRef] [PubMed]
  35. Ye, Z.; Li, G.; Lei, J.; Liu, M.; Jin, Y.; Li, B. One-step and one-precursor hydrothermal synthesis of carbon dots with superior antibacterial activity. ACS Appl. Bio Mater. 2020, 3, 7095–7102. [Google Scholar] [CrossRef] [PubMed]
  36. Yuan, G.; Lv, C.; Liang, J.; Zhong, X.; Li, Y.; He, J.; Zhao, A.; Li, L.; Shao, Y.; Zhang, X. Molecular engineering of efficient singlet oxygen generators with near-infrared AIE features for mitochondrial targeted photodynamic therapy. Adv. Funct. Mater. 2021, 31, 2104026. [Google Scholar] [CrossRef]
  37. Tavakkoli Yaraki, M.; Wu, M.; Middha, E.; Wu, W.; Daqiqeh Rezaei, S.; Liu, B.; Tan, Y.N. Gold nanostars-AIE theranostic nanodots with enhanced fluorescence and photosensitization towards effective image-guided photodynamic therapy. Nano-Micro Lett. 2021, 13, 58. [Google Scholar] [CrossRef]
  38. Liang, Q.; Yu, F.; Cai, H.; Wu, X.; Ma, M.; Li, Z.; Tedesco, A.C.; Zhu, J.; Xu, Q.; Bi, H. Photo-activated autophagy-associated tumour cell death by lysosome impairment based on manganese-doped graphene quantum dots. J. Mater. Chem. B 2023, 11, 2466–2477. [Google Scholar] [CrossRef]
  39. Jiang, L.; Zhang, L.; Wu, T.; Huang, M.; Zheng, Y.; Chen, H.; Chen, S.; Chen, H.; Tian, J.; Yu, Q. Meticulously designed carbon dots as photo-triggered RNA-destroyer for evoking pyroptosis. Bioconjug. Chem. 2023, 34, 1387–1397. [Google Scholar] [CrossRef]
  40. Green, K.J.; Dods, K.; Hammer, K.A. Development and validation of a new microplate assay that utilises optical density to quantify the antibacterial activity of honeys including Jarrah, Marri and Manuka. PLoS ONE 2020, 15, e0243246. [Google Scholar] [CrossRef]
  41. Gauba, A.; Rahman, K.M. Evaluation of antibiotic resistance mechanisms in gram-negative bacteria. Antibiotics 2023, 12, 1590. [Google Scholar] [CrossRef] [PubMed]
  42. Elmehbad, N.Y.; Mohamed, N.A.; Abd El-Ghany, N.A.; Abdel-Aziz, M.M. Reinforcement of the antimicrobial activity and biofilm inhibition of novel chitosan-based hydrogels utilizing zinc oxide nanoparticles. Int. J. Biol. Macromol. 2023, 246, 125582. [Google Scholar] [CrossRef] [PubMed]
  43. Jiang, G.; Fan, J.; Wan, Y.; Li, J.; Pi, F. Enhanced photocatalytic and antimicrobial activities of carbon-dots nanozymes modulated with P-doping. Chem. Eng. J. 2024, 480, 148216. [Google Scholar] [CrossRef]
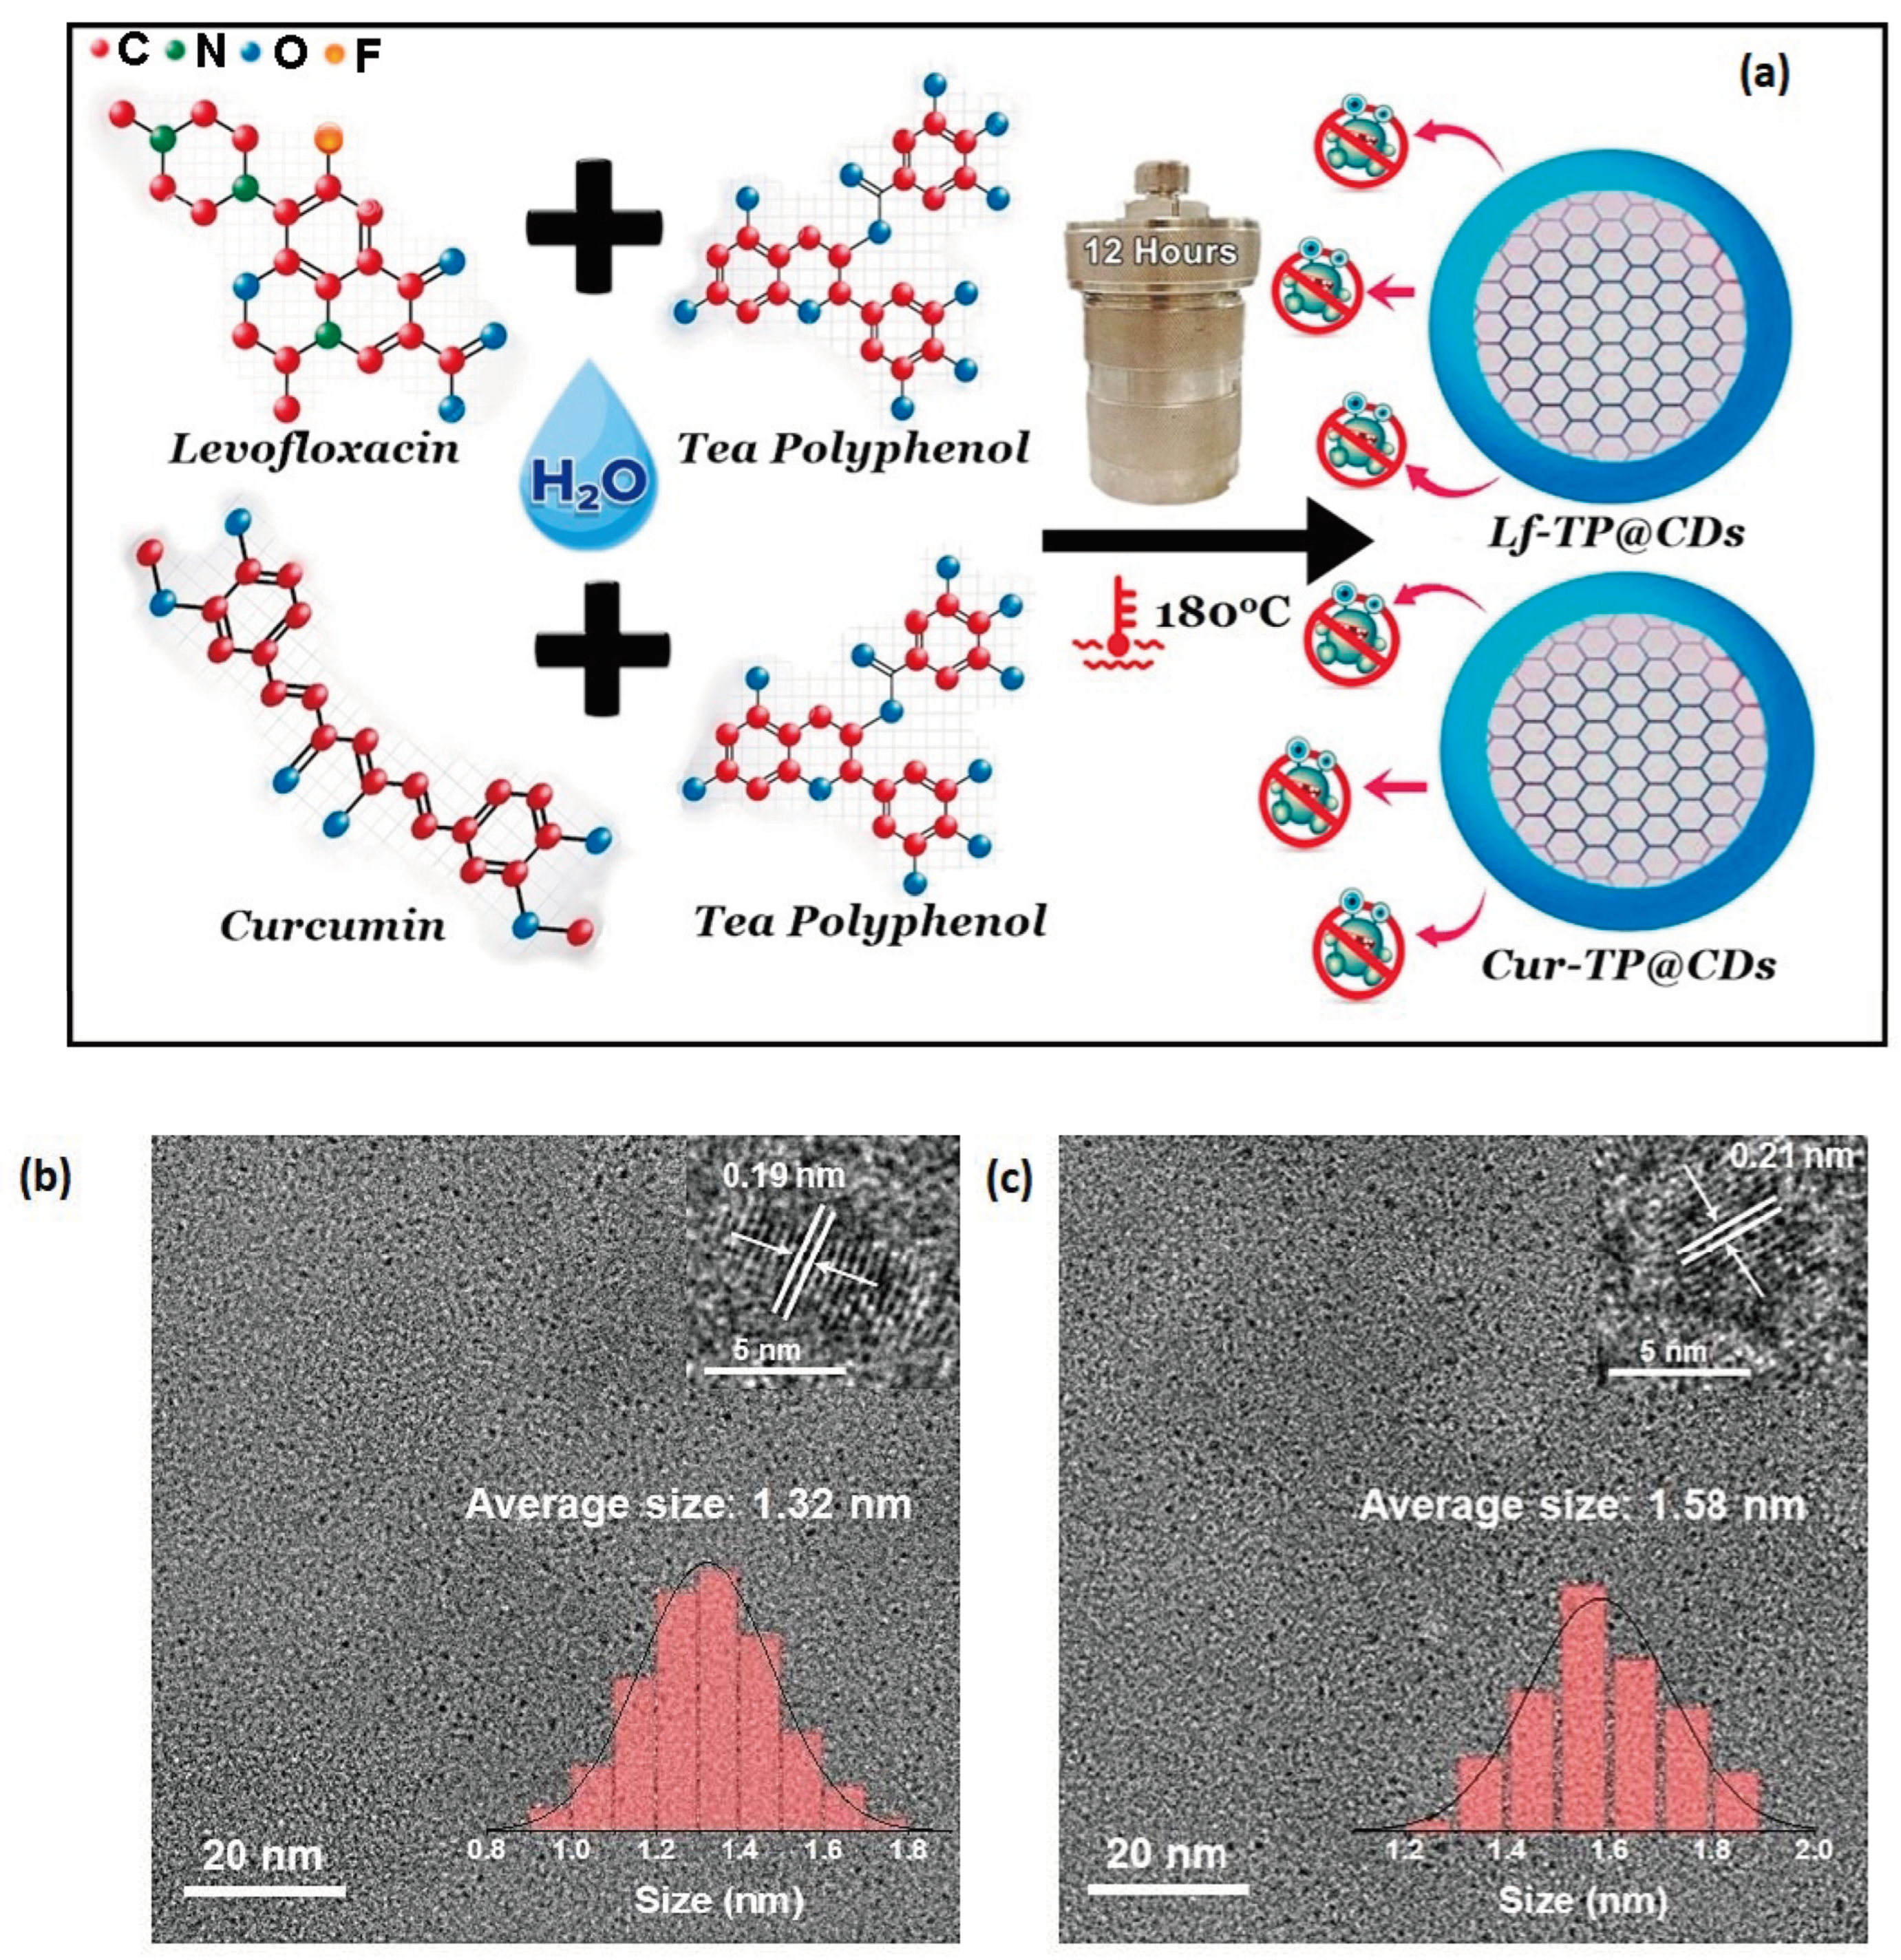
Figure 1. (a) Schematic illustration of antibacterial CD synthesis from levofloxacin, curcumin, and tea polyphenols through hydrothermal method. Typical TEM images (inset: HRTEM image) and the corresponding particle size distribution histogram of (b) Cur-TP@CDs and (c) Lf-TP@CDs.
Carbon 10 00084 g001
Figure 2. (a) FT–IR spectra of Cur-TP@CDs and Lf-TP@CDs. (b) XRD patterns of Cur-TP@CDs and Lf-TP@CDs. (c) XPS full-survey spectrum of Cur-TP@CDs, indicating the presence and proportion of carbon (C) nitrogen (N), and oxygen (O) with peaks corresponding to C1s, N1s, and O1s, reflecting the surface chemical composition and states. (d) XPS survey spectrum of LF-TP@CDs, showing the elemental composition with peaks corresponding to carbon (C1s), oxygen (O1s), nitrogen (N1s), and fluorine (F1s). The F1s peak is present but at a very low intensity, indicating that fluorine is at the detection limit.
Carbon 10 00084 g002
Figure 3. (a) UV-vis absorption spectrum of Cur-TP@CDs. (b) Photoluminescence (PL) emission spectra of Cur-TP@CDs at different excitation wavelengths. (c) Time-resolved fluorescence decay profile of Cur-TP@CDs. (d) UV-vis absorption spectrum of Lf-TP@CDs. (e) PL emission spectra of Lf-TP@CDs at different excitation wavelengths. (f) Time-resolved fluorescence decay profile of Lf-TP@CDs.
Carbon 10 00084 g003
Figure 4. EPR analysis of 1O2 generation of (a) Cur-TP@CDs at concentrations of 0 mg/mL, 0.125 mg/mL, 0.25 mg/mL, and 0.5 mg/mL and (b) Lf-TP@CDs at concentrations of 0 mg/mL, 0.125 mg/mL, 0.25 mg/mL, and 0.5 mg/mL by using TEMP as a 1O2 trapper.
Carbon 10 00084 g004
Figure 5. (a) Survival rates of S. aureus treated with different concentrations of Lf-TP@CDs and Cur-TP@CDs. (b) Survival rates of E. coli treated with different concentrations of Lf-TP@CDs and Cur-TP@CDs.
Carbon 10 00084 g005
Figure 6. Biofilm inhibition of Lf-TP@CDs and Cur-TP@CDs by (a) S. aureus and (b) E. coli.
Carbon 10 00084 g006
Figure 7. (a) SEM images of S. aureus treated with different concentrations of Lf-TP@CDs and Cur-TP@CDs. (b) SEM images of E. coli treated with different concentrations of Lf-TP@CDs and Cur-TP@CDs.
Carbon 10 00084 g007
Disclaimer/Publisher’s Note: The statements, opinions and data contained in all publications are solely those of the individual author(s) and contributor(s) and not of MDPI and/or the editor(s). MDPI and/or the editor(s) disclaim responsibility for any injury to people or property resulting from any ideas, methods, instructions or products referred to in the content.