Article

On a Composite Obtained by Thermolysis of Cu-Doped Glycine

by
Pedro Chamorro-Posada
1,
Roberto C. Dante
2,
Jesús Martín-Gil
3,
Denisse G. Dante
2,
Alma Cioci
2,4,
José Vázquez-Cabo
5,
Óscar Rubiños-López
5,
Irene Mediavilla-Martínez
6 and
Pablo Martín-Ramos
3,*
1
Departamento de Teoría de la Señal y Comunicaciones e IT, Universidad de Valladolid, ETSI Telecomunicación, Paseo Belén 15, 47011 Valladolid, Spain
2
R&D Department, 2Dto3D S.r.l.s., Via Revalanca 5, San Firmino, 12036 Revello, Italy
3
Advanced Materials Laboratory, ETSIIAA, Universidad de Valladolid, Avda. Madrid 44, 34004 Palencia, Spain
4
Dipartimento di Chimica, Università di Torino, Via Pietro Giuria, 7, 10125 Torino, Italy
5
Departamento de Teoría de la Señal y Comunicaciones, Universidad de Vigo, ETSE Telecomunicación, Lagoas Marcosende, 36310 Vigo, Spain
6
Escuela de Ingenierías Industriales, Universidad de Valladolid, Paseo Prado de la Magdalena 3-5, 47011 Valladolid, Spain
*
Author to whom correspondence should be addressed.
Submission received: 29 February 2024 / Revised: 20 May 2024 / Accepted: 24 May 2024 / Published: 26 May 2024
(This article belongs to the Section Carbon Materials and Carbon Allotropes)

Abstract

:
Metal-doped carbonaceous materials have garnered significant attention in recent years due to their versatile applications in various fields, including catalysis, energy storage, environmental remediation, electronics, and sensors, as well as reinforcement. This study investigates the synthesis and characterization of a composite material featuring a carbonaceous matrix doped with copper, focusing on the thermolysis of glycine as a precursor. The synthesis methodology involved utilizing glycine and copper acetate monohydrate in varying ratios, with the mixture subjected to heating in ceramic crucibles at temperatures ranging from 450 to 550 °C, with pyrolysis yields over the 5 to 39% interval. The pristine and Cu-doped samples obtained at 500 °C underwent characterization using a diverse array of techniques, including scanning and transmission electron microscopies, multi-elemental analysis by energy dispersive X-ray spectroscopy, CHNS elemental analysis, X-ray photoelectron spectroscopy, X-ray powder diffraction, infrared and Raman spectroscopies, ultraviolet-visible spectroscopy, and terahertz time-domain spectroscopy, along with conductivity measurements. Under optimized conditions, copper (at 6.5%) was present primarily in the free metallic form, accompanied by traces of tenorite (CuO) and cuprite (Cu2O). The carbonaceous matrix exhibited a 6:1 ratio of graphitic carbon to a carbon-nitrogen compound with the formula C2H2N2O2, such as isomers of diazetidinedione, according to multi-elemental analysis results. Conductivity measurements disclosed a significant increase in conductivity compared to the product of glycine thermolysis, showcasing the enhanced electrical properties of the new composite. Additionally, terahertz measurements showed the potential of the material as a broadband absorber for the fabrication of terahertz devices and provided compelling evidence of a significant improvement in radiation absorption upon copper doping. In conclusion, this research sheds light on the promising properties of copper-doped carbonaceous composites obtained by glycine pyrolysis, offering insights into their potential applications in emerging technological domains.

1. Introduction

Research on composites featuring a carbonaceous matrix and copper as a reinforcing element has garnered significant attention. Several reviews on copper/graphite composites [1], copper/graphene composites [2], and their corresponding preparation methods [3] have been published. Scientific journal articles within this field extensively cover composite materials designed for applications in the electrical, thermal, structural, mechanical, and renewable energy domains. These applications encompass sliding electrical contacts, conductive wires and cables for power transmission and electronics, heat sinks and spreaders, thermal management systems in aerospace and aviation, components of brake disks, pantograph strips for high-speed railways, lightweight and high-strength aerospace and automotive industry components, sports equipment, conductive components of solar cells, and electrodes and conductive components of energy storage systems. Additionally, these materials find application in wall surface shields for future fusion devices [4,5,6,7,8,9,10,11,12].
Similarly, the integration of copper components into carbon-nitride (CNx) architectures offers exciting prospects for advancing sustainable technologies centered upon renewable feedstock utilization and green chemistry principles [13].
Using amino acids as starting materials for the preparation of CNx or carbonaceous materials presents several compelling rationales grounded in their characteristic properties and practical merits [14,15,16]. These include their functional diversity (ranging from carboxyl (–COOH), primary amine (–NH2), secondary amine (–NHR), aromatic rings, sulfur moieties, etc.), availability from many natural sources without posing severe ecological threats (thus aligning with ‘green’ manufacturing practices), and facile accessibility (with consistent availability and affordability and simple purification methods facilitating rapid scale-up efforts needed for commercial ventures).
The thermal decomposition of amino acids, including glycine [17,18,19], has been studied to understand their thermal stability and the products formed during decomposition. These studies have shown that amino acids can decompose into various products, including water, cyclic compounds, and residues containing peptide bonds, which are stable at temperatures above 180 °C [20].
In particular, glycine, one of the simplest amino acids found in nature, has garnered significant attention in materials science due to its unique properties and versatility as a precursor for various materials, including nitrogen-doped ordered mesoporous carbons [16,21]. This interest is partly due to glycine’s simple structure, high solubility in water, and its role as a building block for proteins, making it an ideal candidate for synthesizing complex materials through thermal treatment or polymerization processes. Its simplicity (composed merely of a backbone connected to a single hydrogen atom) facilitates easier manipulation and predictable outcomes during synthesis procedures, allowing for the formation of linear peptides through thermal polymerization, even under conditions that are not typically favorable for such reactions [22]. Moreover, during heat treatment, glycine displays distinctive characteristics, such as being able to participate in decarbonylation and cyclodehydration reactions, ultimately contributing to the generation of heterocycles relevant to CNx materials. Additionally, glycine behaves as a bidentate ligand for many metal ions, allowing easy integration of transition elements such as, copper into emerging networks. Last but not least, glycine brings forth flexibility stemming from its capability to exist either neutrally charged or ionized (zwitterionic state); hence, it could potentially interact effectively with various target surfaces.
Considering these attributes collectively, employing glycine as a foundation for constructing novel CNx materials holds promise for achieving innovative designs and tunable physicochemical properties beneficial for future advancements in optoelectronics, sensors, and environmentally friendly devices. Consequently, in this paper, we investigate a novel composite produced utilizing glycine and copper (II) acetate. The aim of the study is to provide a characterization of the pyrolysis products through a diverse range of techniques, along with electrical conductivity and radiation absorption in the terahertz band measurements. This broader scope aims to explore additional potential applications for this new material.
The importance of these explorations becomes evident when one considers the opening of the terahertz spectral region [23] to diverse applications such as material characterization, identification, telecommunications, medical diagnosis imaging, security screening, or industrial testing. This requires the development of materials with specific properties tailored for terahertz radiation systems. Specifically, terahertz absorbers play a pivotal role in creating electromagnetic radiation shields, thermal sources, detectors, filters, attenuators, and radar absorption materials [24].

2. Materials and Methods

2.1. Synthesis

In the synthesis method employed here, mixtures of glycine (as the primary component) and copper (II) acetate (as a minor component) were blended in varying proportions, ranging from 0.5% to 10% in copper (II) acetate (equivalent to Cu percentages between 0.16% and 3.17% in the initial mixture). Specifically, the process was initiated by doping glycine [molecular weight (MW): 75.07 g/mol, linear formula: NH2NCH2COOH] with different quantities of copper diacetate monohydrate [MW: 199.65 g/mol, formula: Cu(CH3COO)2·H2O]. The mixture was homogenized in an agate mortar until the glycine exhibited a uniform blue color indicative of even dispersion of the copper complex. Subsequently, the mixture was transferred to an alumina crucible with a lid and heated in a static air atmosphere within a Eurotherm (Worthing, UK) high-temperature furnace capable of reaching up to 1100 °C.
The furnace temperature was programmed to rise from 50 °C to 200 °C, and upon reaching this temperature, it continued to increase at a rate of 10 °C per minute until one of the three selected maximum temperatures (450, 500, or 550 °C) was achieved. The temperature was then maintained for 50 minutes in an isothermal manner. Following this, the furnace was cooled down to 50 °C at a rate of 10 °C per minute. The thermolysis process led to the loss of water and ammonia, accompanied by an increase in the copper percentage, which was determined experimentally.

2.2. Characterization
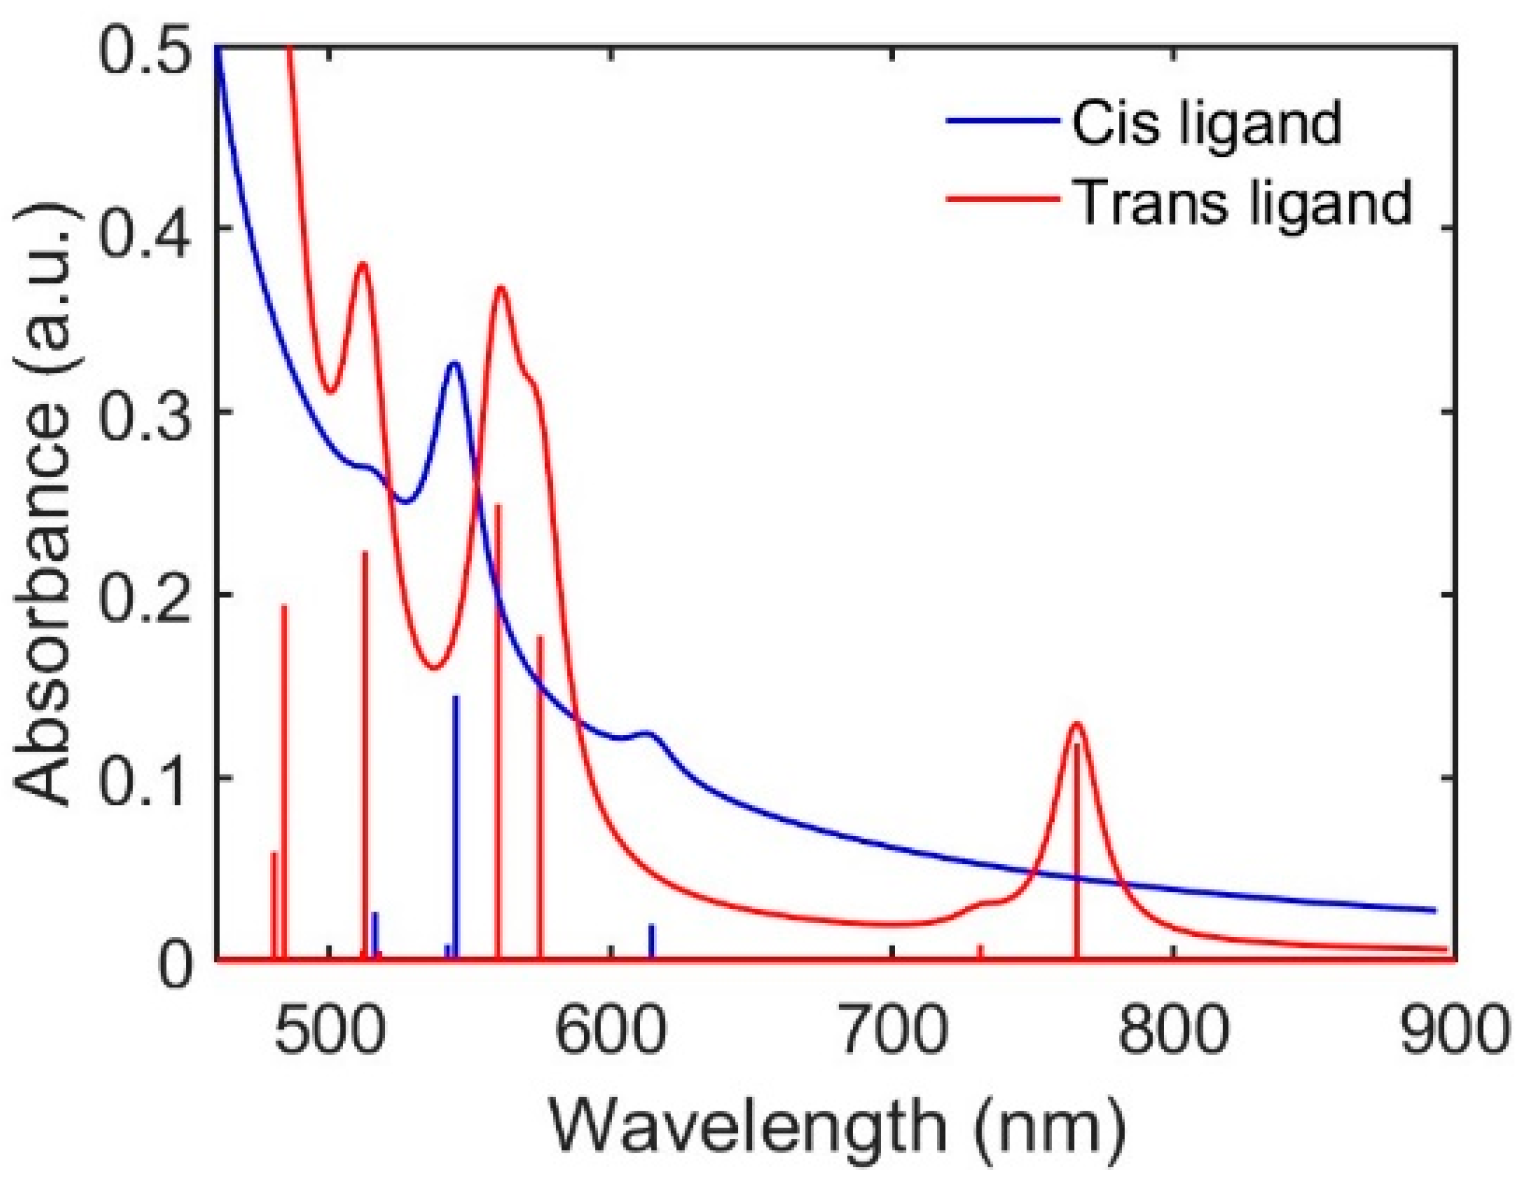
Transmission electron microscopy (TEM) images were obtained using a JEM-1010 (JEOL, Tokyo, Japan) operating at 100 KeV. Scanning transmission electron microscopy (STEM) images were also obtained using a JEM-2010F (JEOL) operating at 200 KeV in both BF (bright-field) and HAADF (high-angle annular dark-field) modes, for small angles (<0–10 mrad) and great angles (>50 mrad). HAADF gives a contrast in Z so that the brightest parts allow the presence of metallic elements (such as Cu, a component with high Z) to be discriminated against.
For both field emission scanning electron microscopy (FESEM) images and energy-dispersive X-ray spectroscopy (EDS) analyses, a JSM-6700F microscope (JEOL), incorporating a cold cathode field emission (FE) gun, and ultra-high vacuum have been used.
Elemental analysis (CHNS) characterization was conducted using a Carlo-Erba EA-1108 microanalyzer (Thermo Fisher Scientific, Waltham, MA, USA), with sulfamethazine and sulfanilamide standards intercalated between samples.
The chemical composition and chemical environment of the samples were examined by X-ray photoelectron spectroscopy (XPS) surface measurements acquiring C1s, O1s, N1, Cu2p, CuLMN, and survey spectra. The analysis was conducted employing a Thermo Fisher Scientific NEXSA instrument featuring aluminum Kα monochromatized radiation at a 1486.6 eV X-ray source. Due to the non-conductive nature of the samples, an electron flood gun was employed to minimize surface charging. Neutralization of the surface charge was achieved using both a low-energy flood gun (with electrons in the range of 0 to 14 eV) and a low-energy Ar ion gun. XPS measurements utilized monochromatic Al-Kα radiation (hυ = 1486.6 eV), with photoelectrons collected from a take-off angle of 90° relative to the sample surface. The measurements were conducted in constant analyzer energy mode (CAE), employing a 100 eV pass energy for survey spectra and a 20 eV pass energy for high-resolution spectra. The survey scan number was 5, and for high-resolution spectra, 20 scans were conducted. Charge referencing was accomplished by setting the lower binding energy C1s photo peak at 284.80 eV, corresponding to the C1s hydrocarbon peak [25]. Surface elemental composition was determined using standard Scofield photoemission cross-sections. Regarding additional experimental details, the samples were prepared by pressing the sample powder onto double-sided conductive tape, which was then attached to the instrument’s metal holder. The operator selected the largest X-ray spot at 400 μm. The residual vacuum in the analysis chamber was maintained at around 3 × 10⁻⁹ mbar. Data analysis and quantification were executed using Avantage software version 6.5.1 from the manufacturer (Thermo Fisher Scientific). Intensity calculations were based on the area under peaks, obtained after background subtraction. The employed background was the ‘smart background’, derived from the ‘Shirley background’, with an additional constraint ensuring that the background did not surpass the actual data intensity at any point in the region. The experimental curves were fitted using a combination of Lorentzian-Gaussian lines in variable proportions. The library used was SCOFIELD, employing the TPP-2M method for attenuation length. Sensitivity factors utilized for calculating elemental atomic percentages are detailed in Table 1.
X-ray powder diffraction (XRPD) patterns were obtained using a Bruker (Billerica, MA, USA) D8 DISCOVER A25 diffractometer in reflection mode (Bragg-Brentano geometry) with a 3 kW generator, 2.2 kW type FFF Cu-ceramic tube, and LynxEye Detector operating at 40 kV and 30 mA. CuKα (λ = 1.54 Å) radiation and crystalline silicon powder (NIST SRM 640F) served as a standard under the operational conditions of 30 mA, 40 kV, and 2θ = 5–70°. Rietveld analysis was conducted using FullProf v.5.10 [26].
Infrared spectra were collected employing a Nicolet iS50 Fourier-transform infrared (FTIR) spectrometer (Thermo Fisher Scientific), equipped with a diamond-attenuated total reflection (ATR) module. The spectral measurement conditions included room temperature, a range of 400–4000 cm−1, 0.5 cm−1 spectral resolution, and the addition of 64 scans. Ten spectra were collected from each subsample in powder form, with no significant differences observed among them.
Raman spectra were acquired using a LabRAM SOLEIL spectrometer (Horiba, Kyoto, Japan) equipped with a Symphony CCD detector. The exciting beam was generated by a solid-state laser (λ = 532 nm), maintaining a nominal laser power of 1 mW on the sample and an approximate irradiance of 100 kW·cm−2. Acquisition parameters included a 10 s acquisition time, 6 accumulations, and a spectral split aperture at 200 μm, ensuring a spectral resolution better than 1 cm−1. Calibration was performed using the ν(Si–Si) Raman mode at 520.7 cm−1 of crystalline silicon from a bare (001) wafer.
Ultraviolet-visible spectroscopy (UV–Vis) diffuse reflectance spectra in powder form were recorded using an Agilent (Santa Clara, CA, USA) Cary 100 UV-Vis spectrophotometer equipped with an integrating sphere. The intensity unit of spectra reported is F(R), i.e., the Schuster-Kubelka-Munk formula, which provides values related to absorbance as obtained in transmission. The bandgaps were determined by the Tauc plot using F(R) [27].
Conductivity measurements. Samples obtained from the thermal treatment of pristine glycine and Cu-doped glycine (Gly-Cu 3.17% 500 °C sample) were thoroughly milled in an agate mortar. For the AC electrical characterization of each sample, 50 mg of the fine powder was placed in a cylindrical PLA receptacle of 0.5 mm height and 10 mm diameter with a 24 mm diameter round electrode in an FR4 PCB at its base and gently pressed with a spatula. The sample holder was then terminated with another identical electrode. Both electrodes had external electrical connections. The AC impedance of the prepared samples was measured in the range between 100 Hz and 6 kHz using an HM8118 HAMEG (Hameg Instruments, Barcelona, Spain) programmable LCR bridge equipped with Kelvin probes.
Terahertz time-domain spectroscopy (THz-TDS) measurements. A Menlo Tera K15 (Menlo Systems GmbH, Martinsried, Germany) spectrometer with a 1560 nm fiber laser generating ultrashort pulses (90 fs, 100 MHz repetition rate) was used for the analysis. The nitrogen-purged environment minimized water vapor interference. Ten measurements per sample/reference improved the signal-to-noise ratio. Material parameters were retrieved from time-domain photocurrent traces after applying established processing techniques [28] to account for sample thickness and reflections. Further experimental details are available in [28,29].

2.3. Computations

Ground state geometries were calculated using the PM6 Hamiltonian [30] implemented in MOPAC 2016. The electronic spectra calculations were based on these geometries using the intermediate neglect of differential overlap/spectroscopic (INDO/S) configuration interaction with the singles (CIS) method [31,32] implemented in the ORCA software package [33].

3. Results

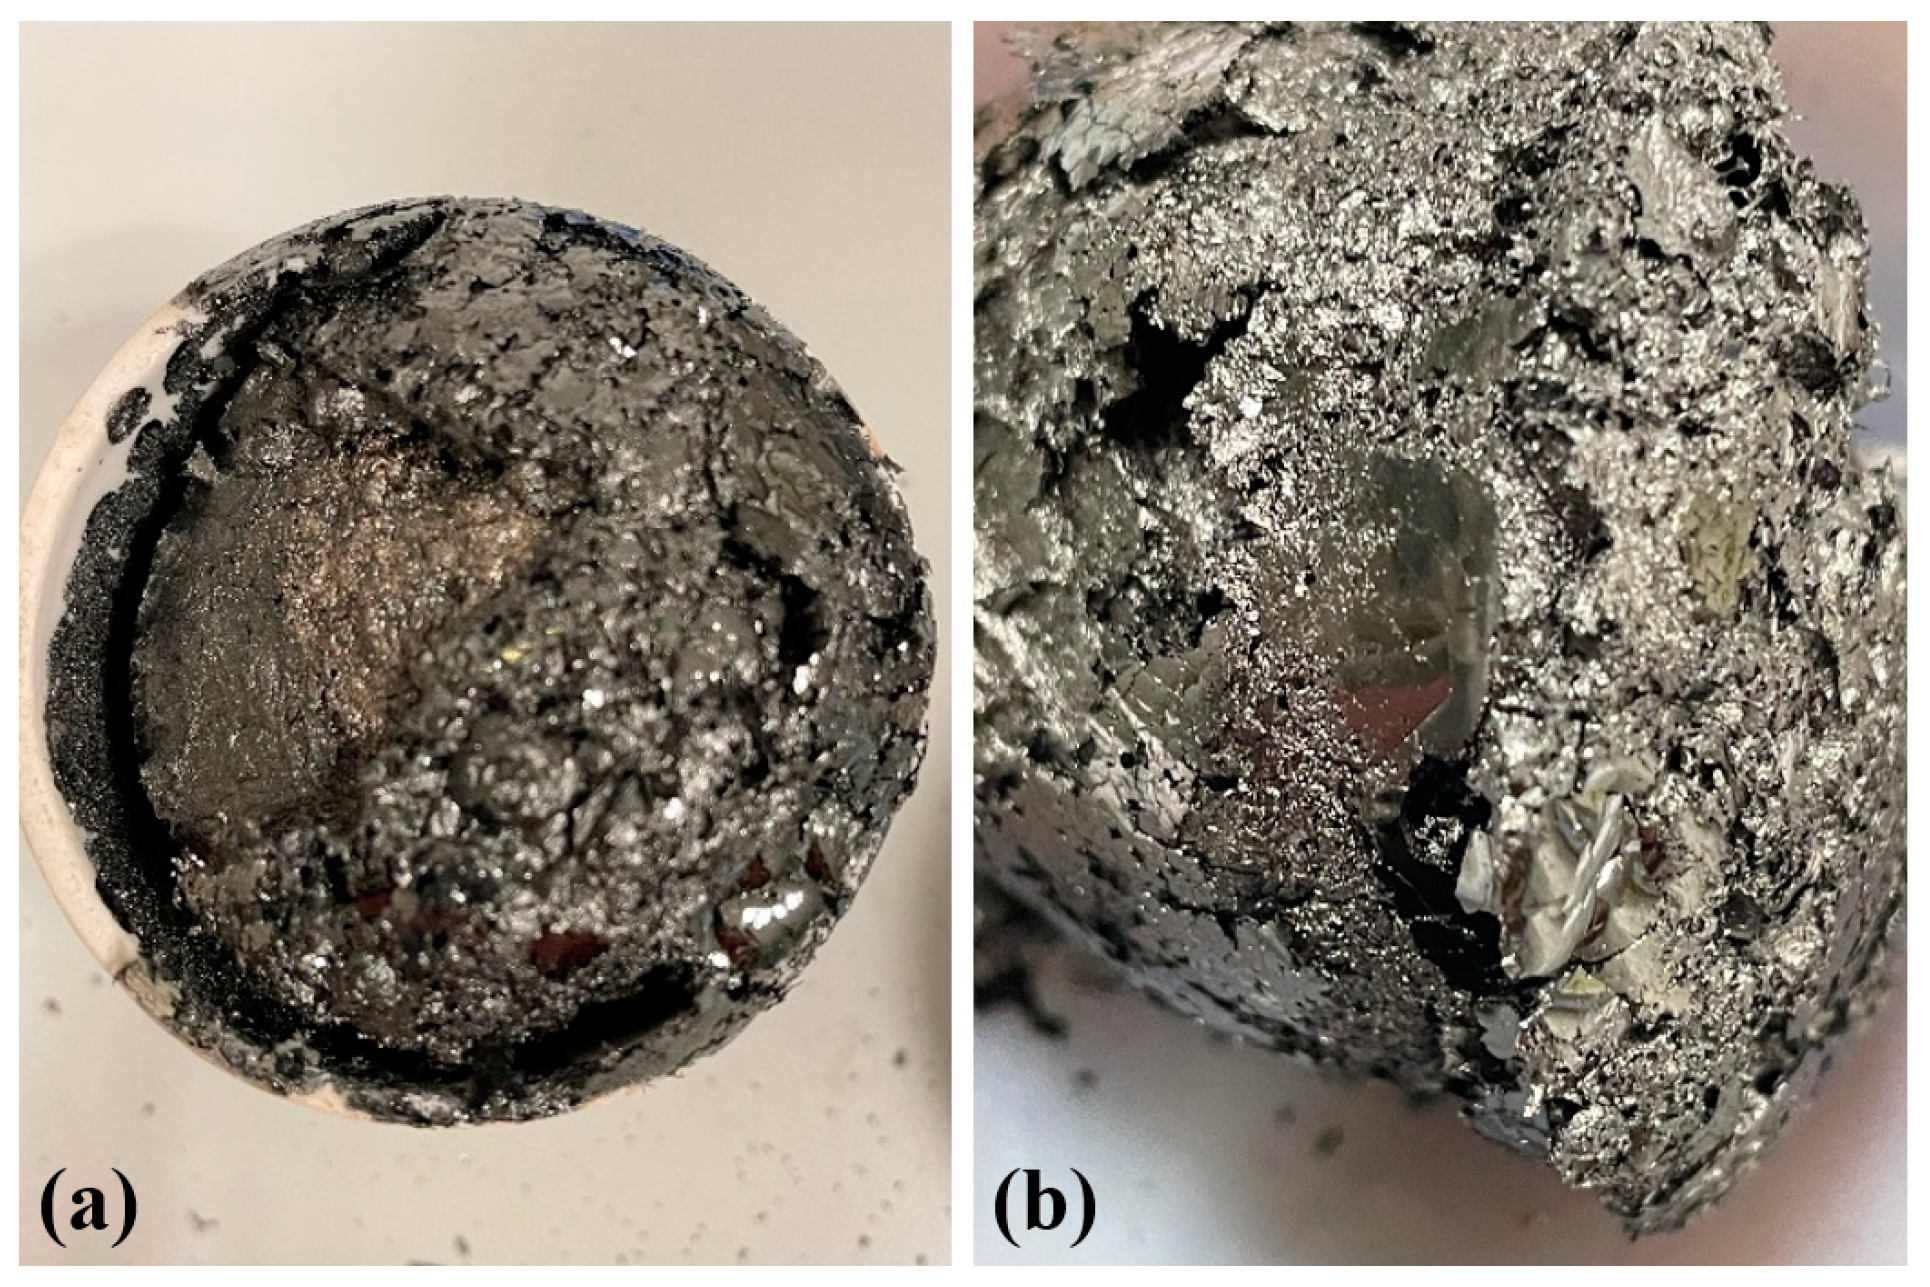
3.1. Pyrolysis Yields

The formation of the composite varied in yields depending on the Cu-doping level of glycine (Table 2). Since a noticeable yield decrease was observed upon increasing the temperature to 550 °C, the characterization primarily focused on the thermolysis products formed at 500 °C with the highest Cu-doping (Figure 1). However, the thermolysis products obtained at the three temperatures (and for the lowest Cu-doping) were studied using some techniques, namely FTIR, Raman, and UV-Vis spectroscopies, in a preliminary screening to assess temperature-related changes in their properties.

3.2. Morphological Characterization by TEM and STEM

A TEM micrograph of the composite is displayed in Figure 2a. Figure 2b showcases a magnified STEM image (scale 10 nm), in which sheets stacking with an interplanar spacing of 2.59 Å may be observed, compatible with the presence of CuO nanoparticles dispersed in the carbonaceous matrix, as discussed below.

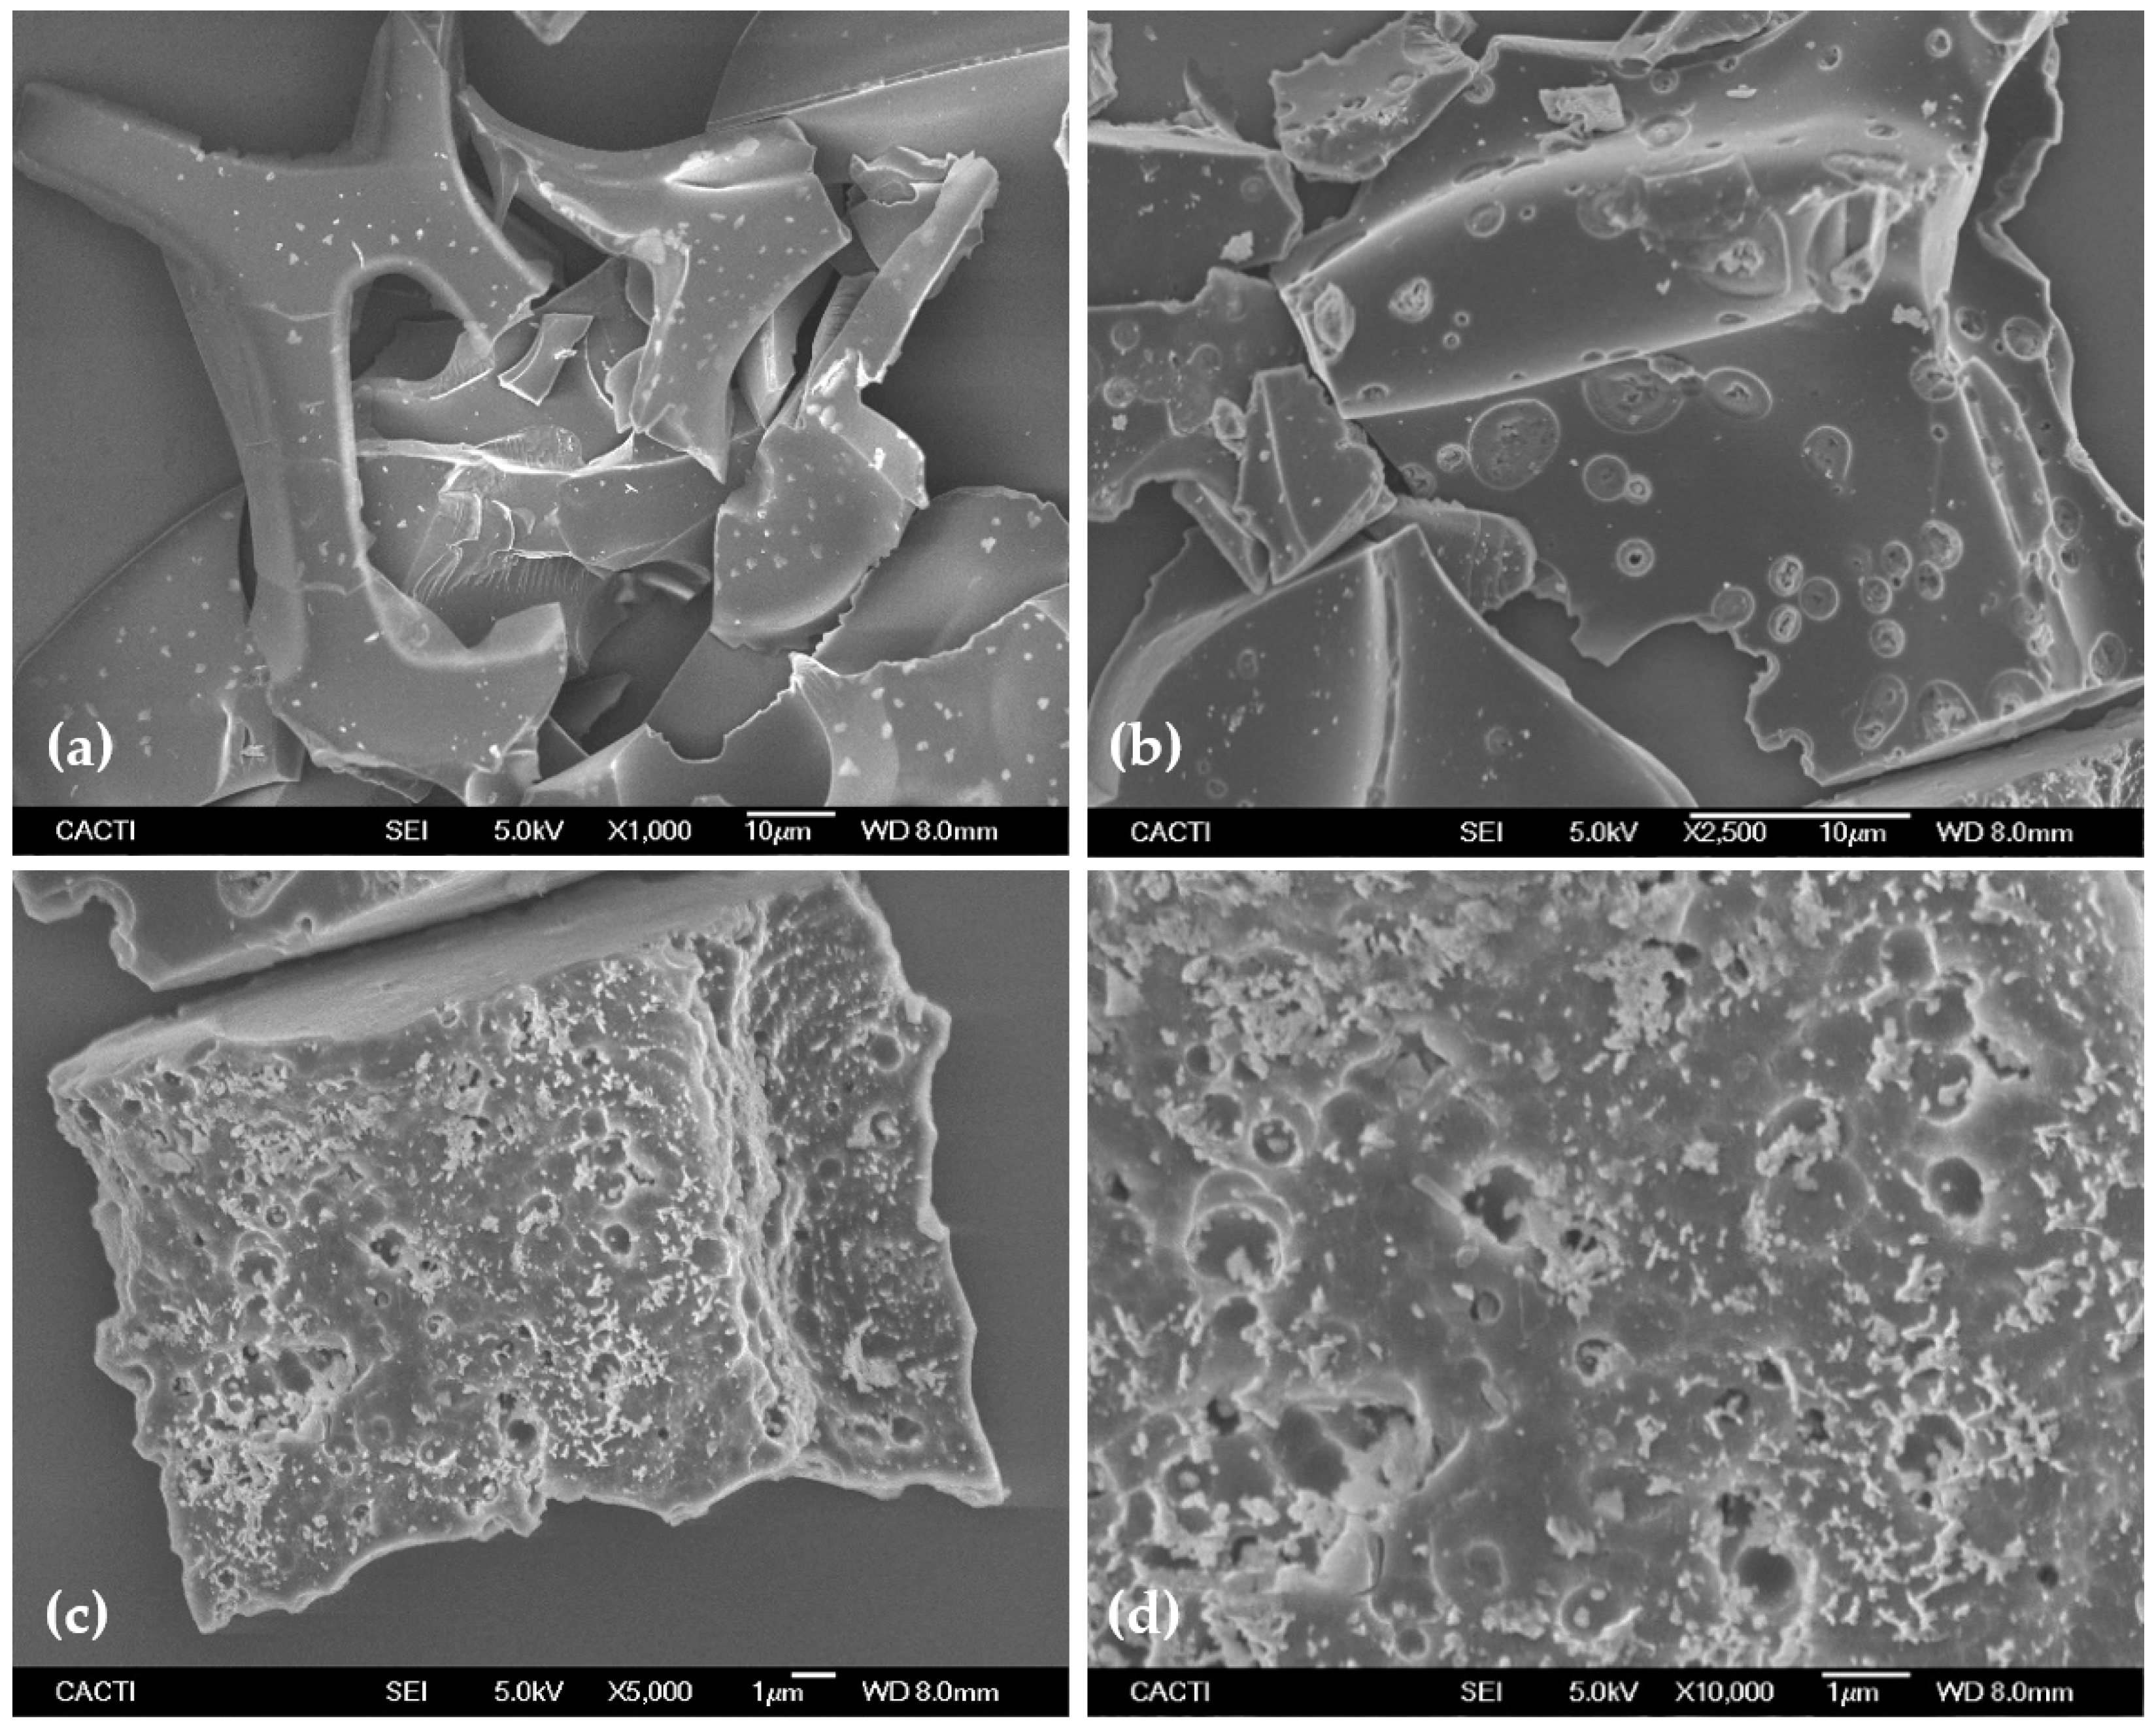
3.3. Morphological Characterization by FESEM

The FESEM micrographs (Figure 3) facilitate the description of the new material as a composite with a homogeneous matrix, wherein the doping agent (copper) is dispersed and its particles are housed in vacuole-type formations. Particle size analysis in ImageJ [34] for non-aggregated particles resulted in an average diameter of 37 ± 9 nm.

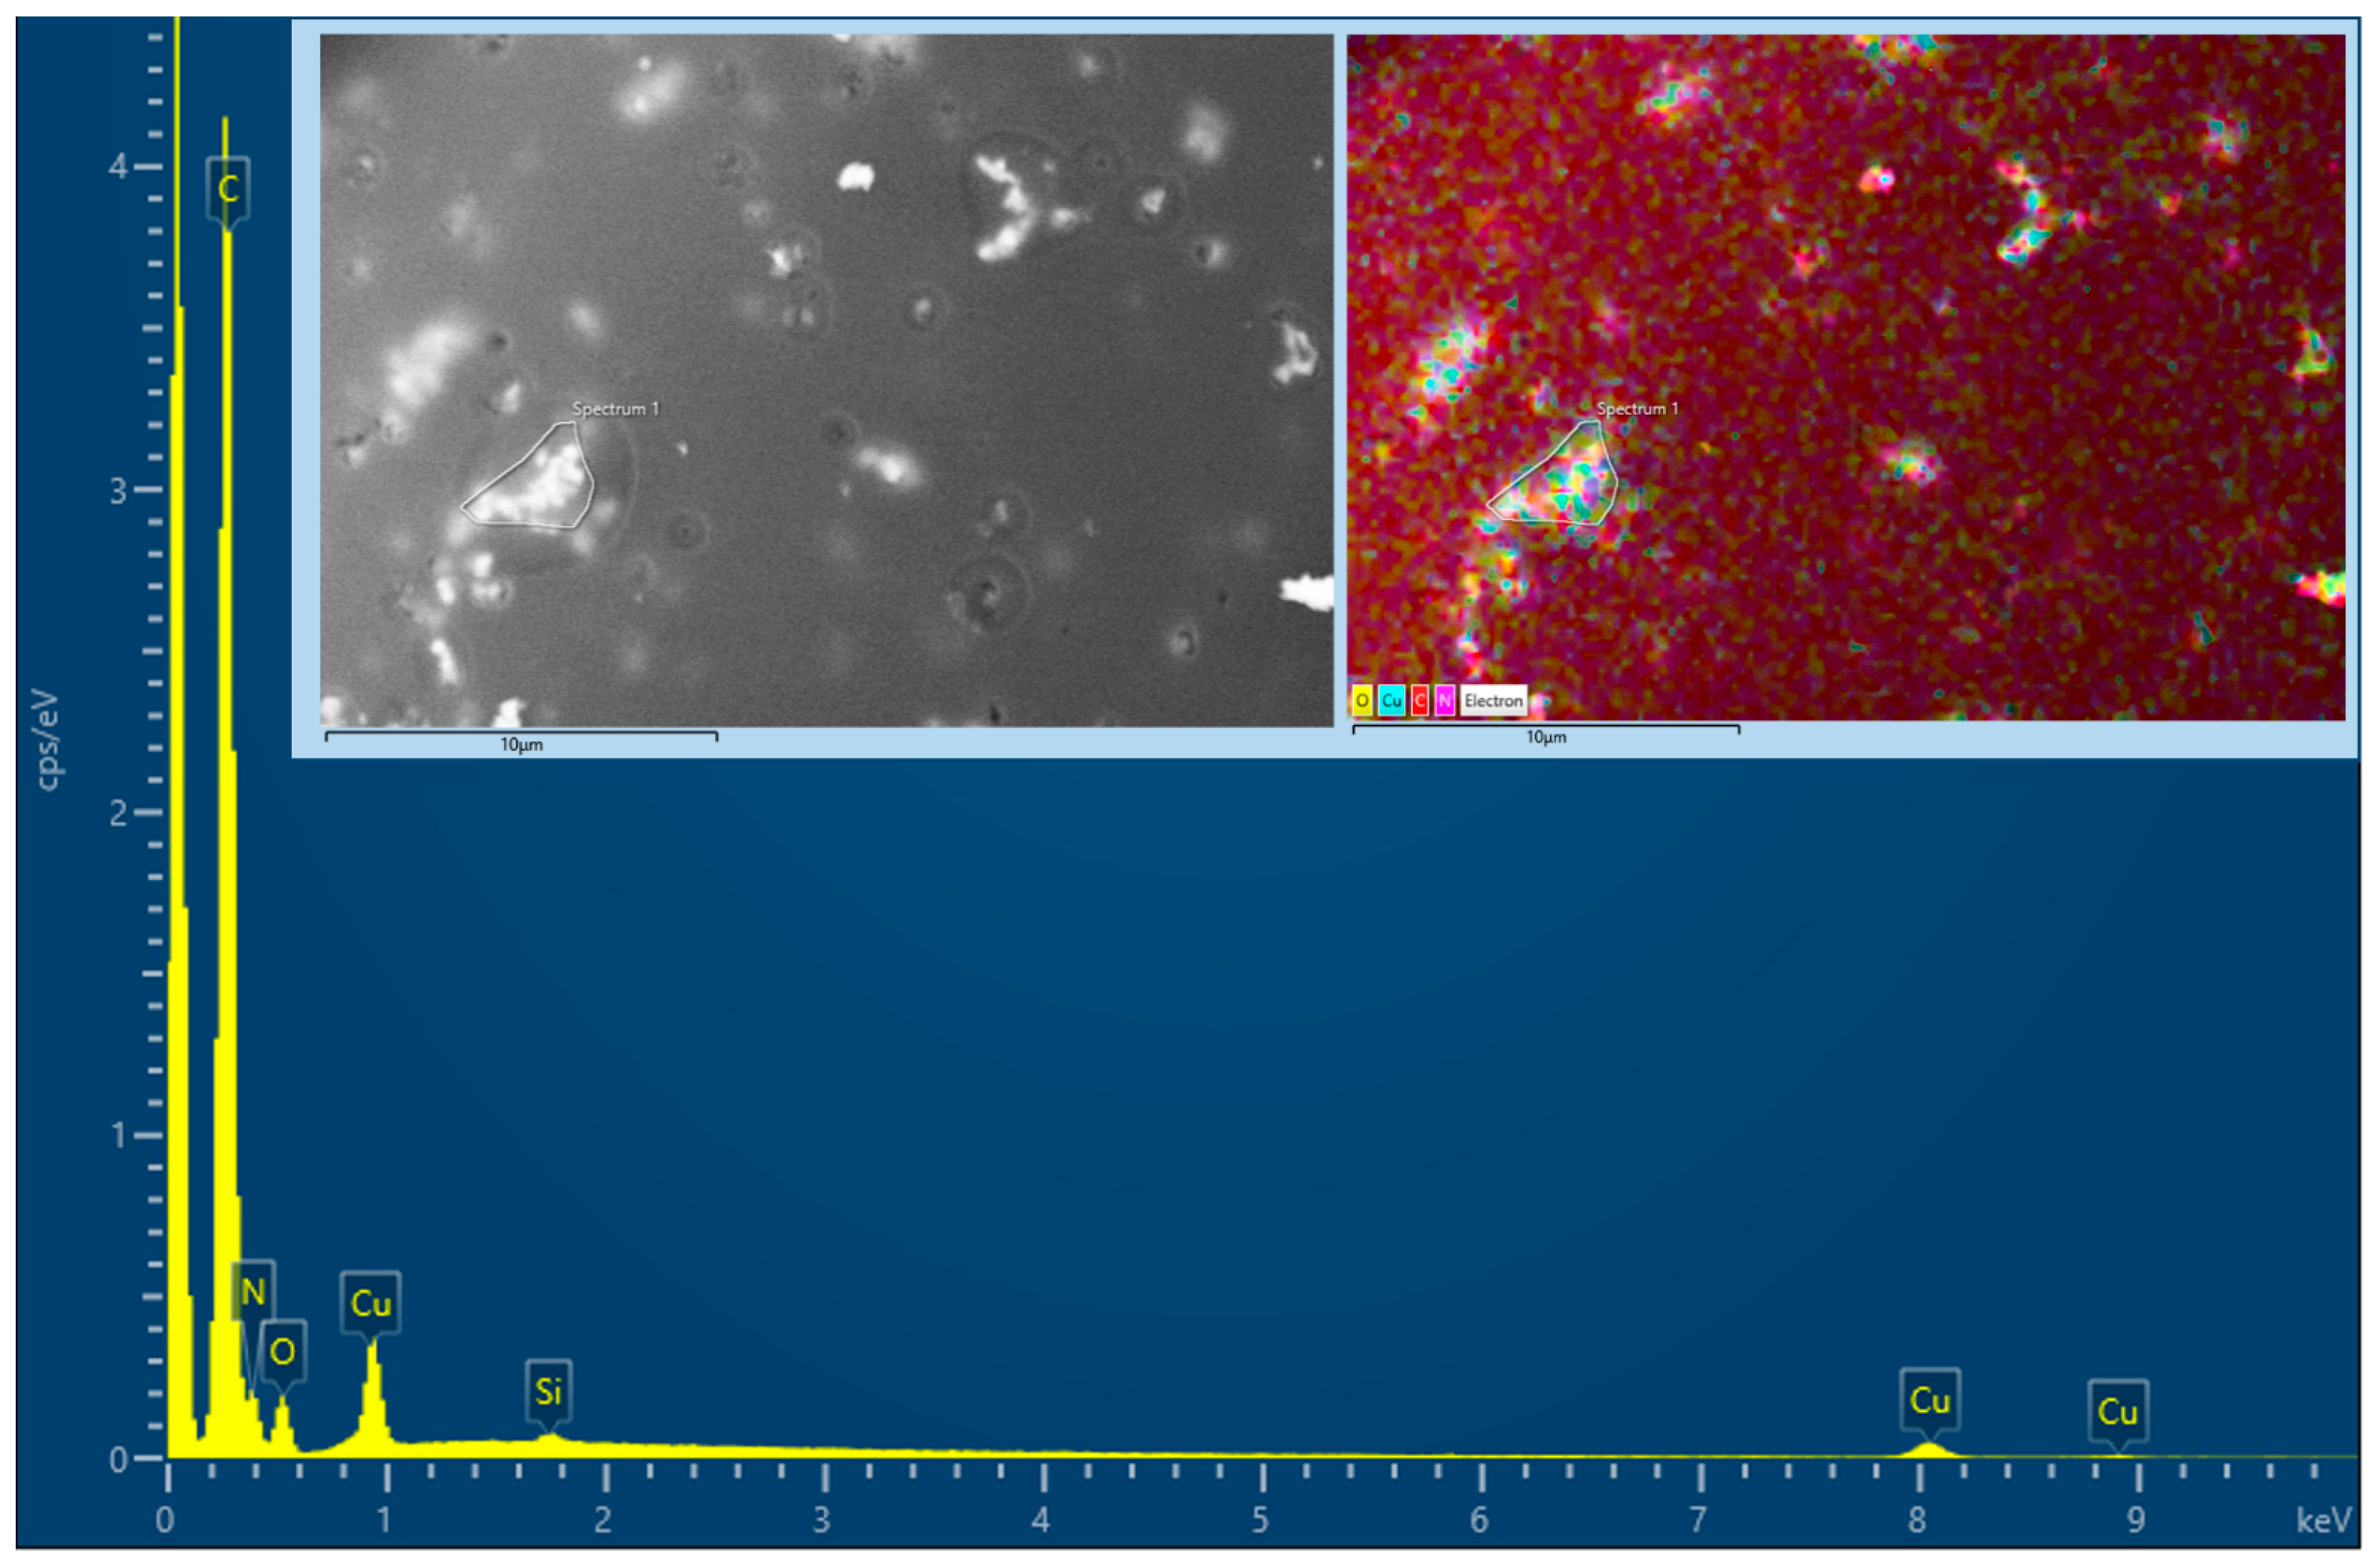
3.4. Multielemental Analysis by EDS

The multi-elemental composition of the pristine glycine and Cu-doped thermolysates (i.e., thermolysis products) obtained at 500 °C was determined at three randomly selected sites each (Table 3).
The empirical formula deduced from the EDS results (Table 3), identified as C12HxN5O, suggests a hypothesis that the thermolysate of pristine glycine (C2H5NO2) is a 6:1 mixture of carbon and a carbo-nitrogenated species with the formula C6H7N5O:
6(C2H5NO2) → 10H2O + NH3 + CO + 6C + C6H7N5O
This scenario is reminiscent of the purine bases 1-methylguanine or N-hydroxy-9-methyladenine (Figure 4).
Alternatively, another probable scenario involves a 9:1 mixture of C and the species C3H5N5O:
6(C2H5NO2) → 11H2O + NH3 + 9C + C3H5N5O
This case corresponds to ammeline or 2,4,6-triamino-1,3,5-triazin-1-ium-3-olate, also known as 2,4-diamino-6-hydroxy-1,3,5-triazine or 4,6-diamino-1,3,5-triazin-2(1H)-one. Ammeline is a dehydration product of melamine, obtainable through the heat treatment of glycine (Figure 4).
Nevertheless, according to the bibliography [20], the most likely possibility is the formation of 1,3-diazetidine-2,4-dione and 1,2-diazetidine-3,4-dione isomers (Figure 4), which involves a 6:1 mixture of C and the aforementioned chemical species with the formula C2H2N2O2:
4(C2H5NO2) → 6H2O + 2NH3 + 6C + C2H2N2O2
Regarding the new copper/carbon composite prepared by thermolysis at 500 °C, the EDS results (Figure 5) guide us to consider that their empirical formula, C50CuN17O5, would correspond to a mixture of copper, graphenic/graphitic carbon, and a diazetidinedione.
Copper, constituting approximately 6.5% in percentage, exists in the composite in a free metallic form, accompanied by traces of tenorite (CuO), as discussed in Section 3.6 below. The carbo-nitrogenated species C2H2N2O2 is postulated as a potential product of the thermal decomposition of either glycine (C2H5NO2) (see above) or copper (II)glycinate (C4H8CuN2O4) formed through the reaction of glycine and copper acetate.
11C4H8CuN2O4 → 22H2O + 10NH3 + H2 + Cu + 10CuO + 32C + 6C2H2N2O2

3.5. CHNS Characterization

The CHNS characterization results for the thermolysis product obtained from pristine glycine at 500 °C exhibited the following composition (in wt%): 61.13 ± 0.16% C, 2.39 ± 0.11% H, 22.09 ± 0.11% N, <0.30% S, and 14.09% O (calculated by difference). In the case of the Gly-Cu 3.17% sample thermolyzed at 500 °C, the composition was 54.27 ± 0.13% C, 2.29 ± 0.09% H, 20.19 ± 0.07% N, <30% S, and approximately 16.45% O (determined by difference, assuming a 6.5% Cu content from the EDS analysis).
The respective C/H, C/N, and C/O ratios (after conversion of wt% results to at%) were 2.13, 3.23, and 5.78 for the pristine glycine thermolysis product at 500 °C, and 1.97, 3.14, and 4.40 for the Gly-Cu 3.17% sample thermolyzed at 500 °C. Considering the C/H ratio (or the H/C ratio, 0.47 and 0.51 for Gly 500 °C and Gly-Cu 3.17% 500 °C, respectively) as an indicator of the degree of aromatization, the differences between the organic matrices of the two samples would not be substantial. This conclusion is based on the premise that the hydrogen contents involved in the calculation are within the standard error of the content measurement (±0.11%).

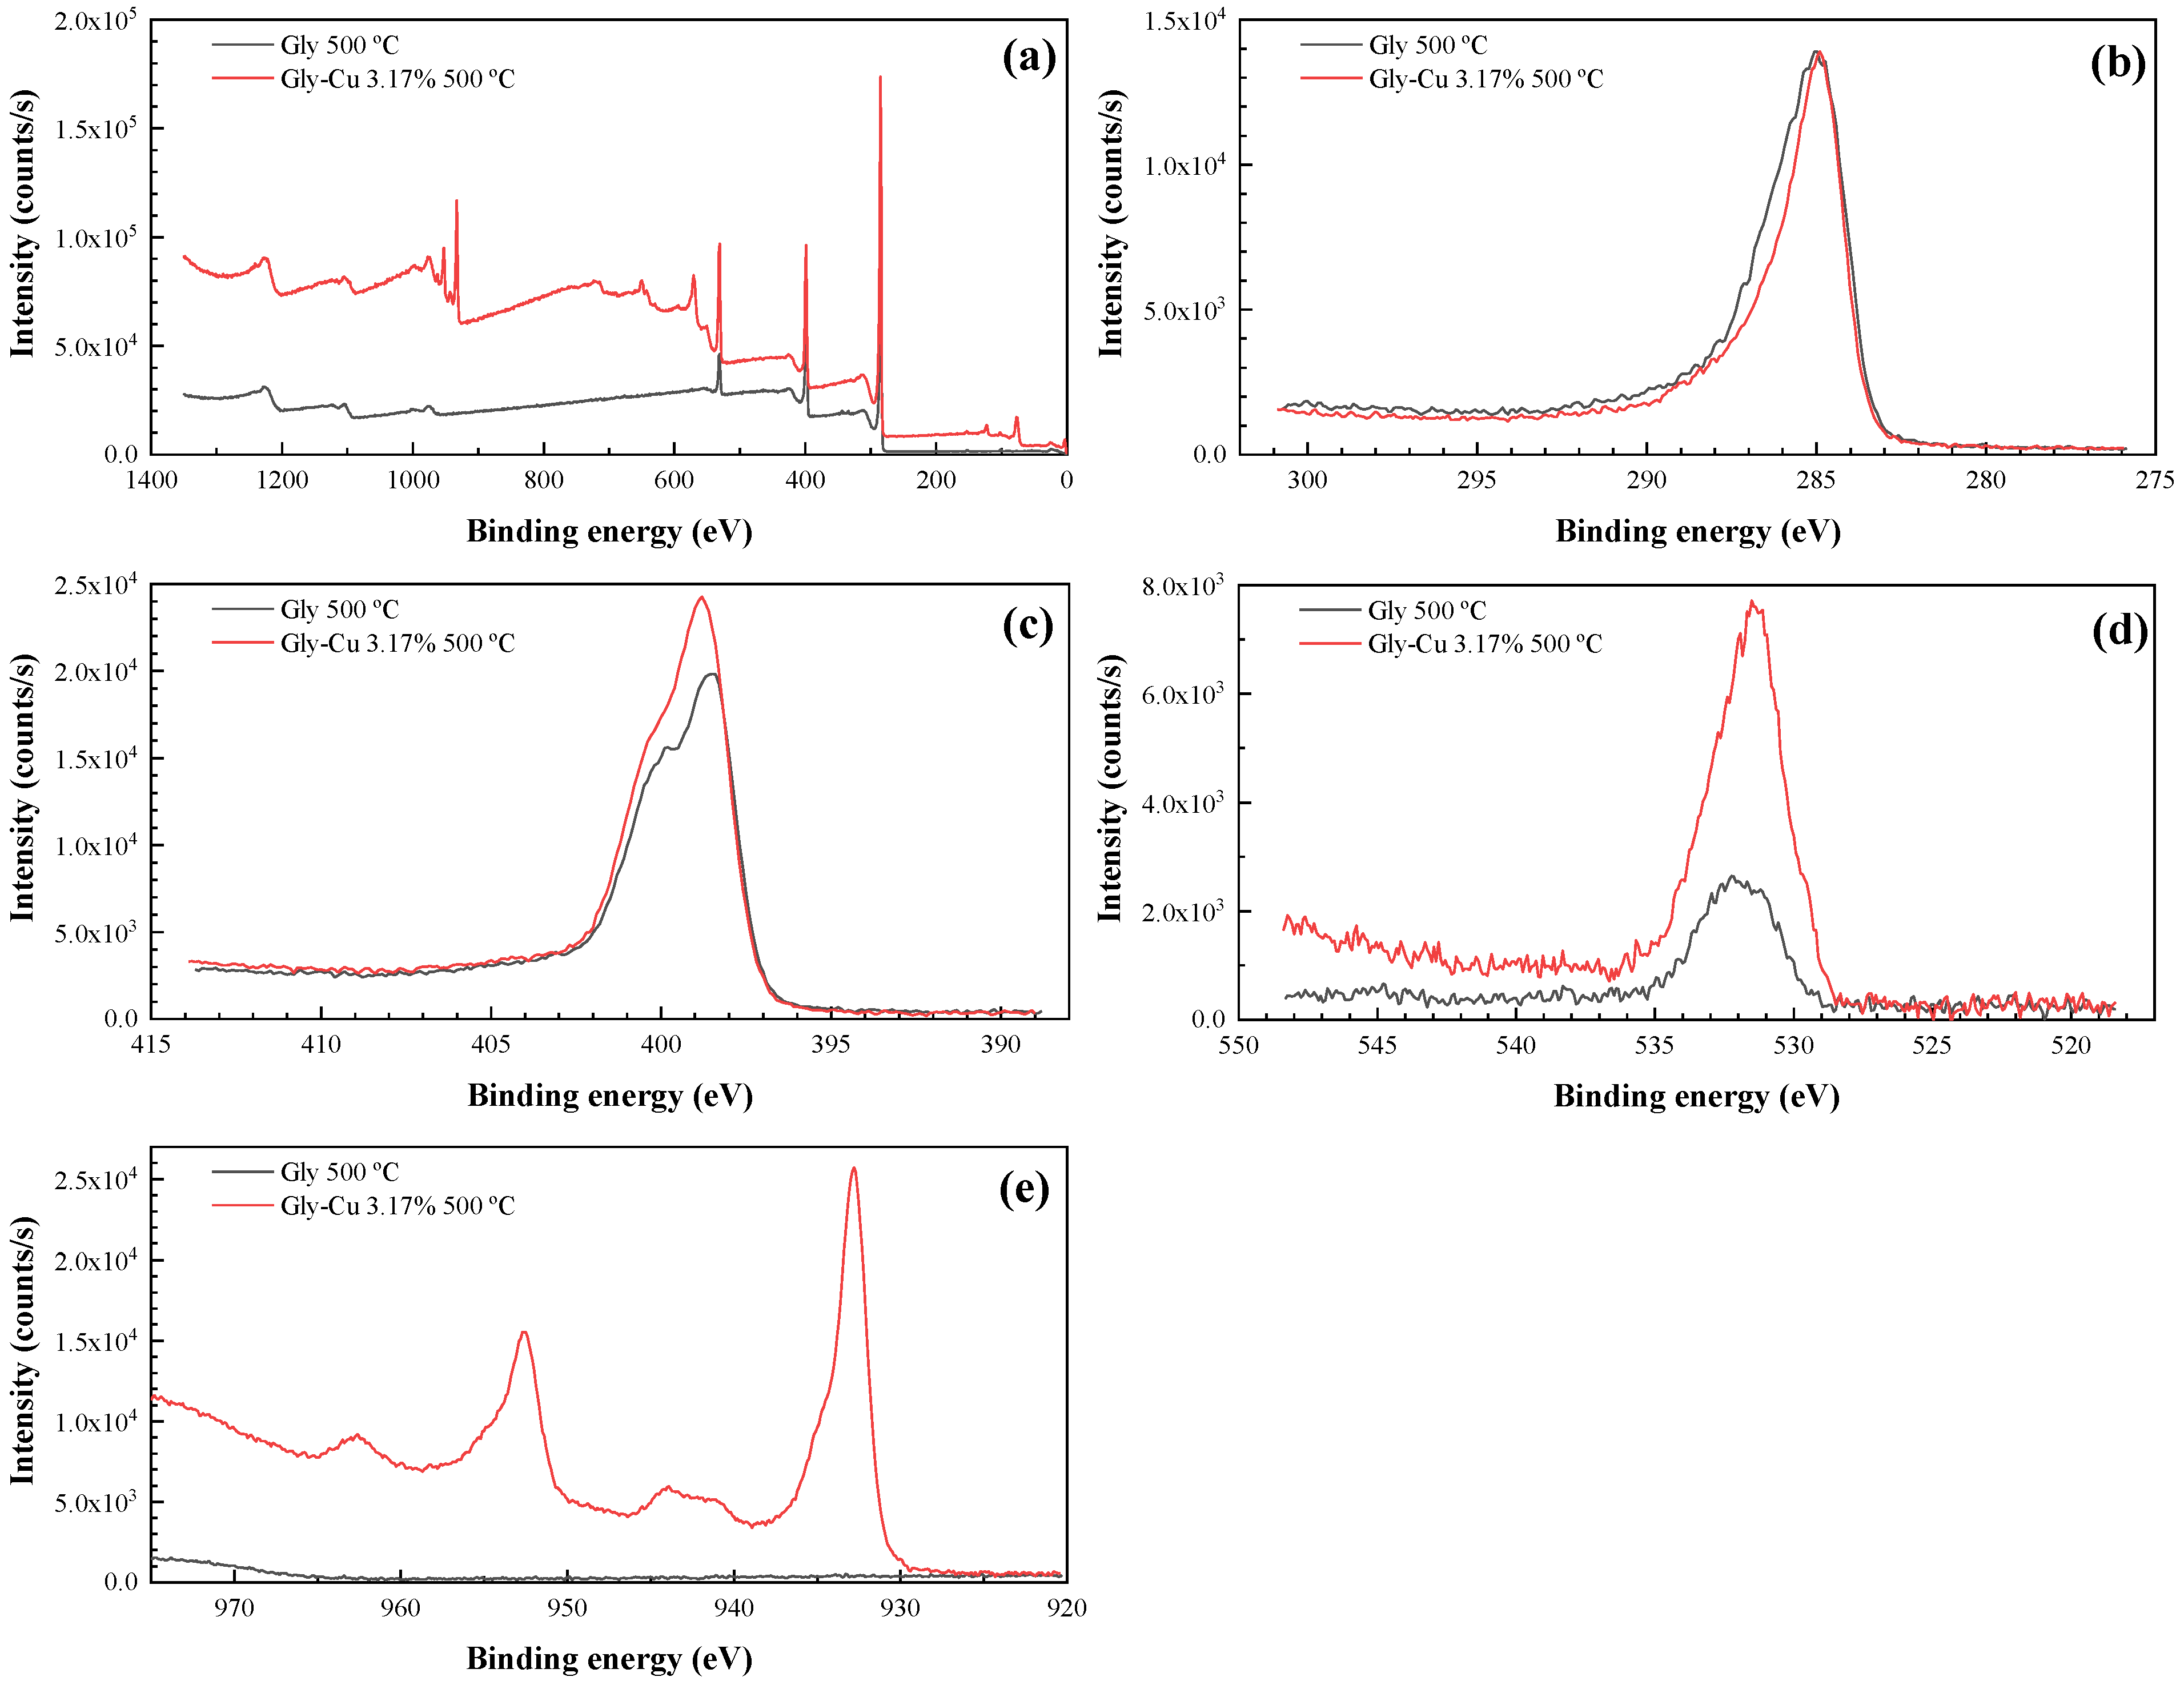
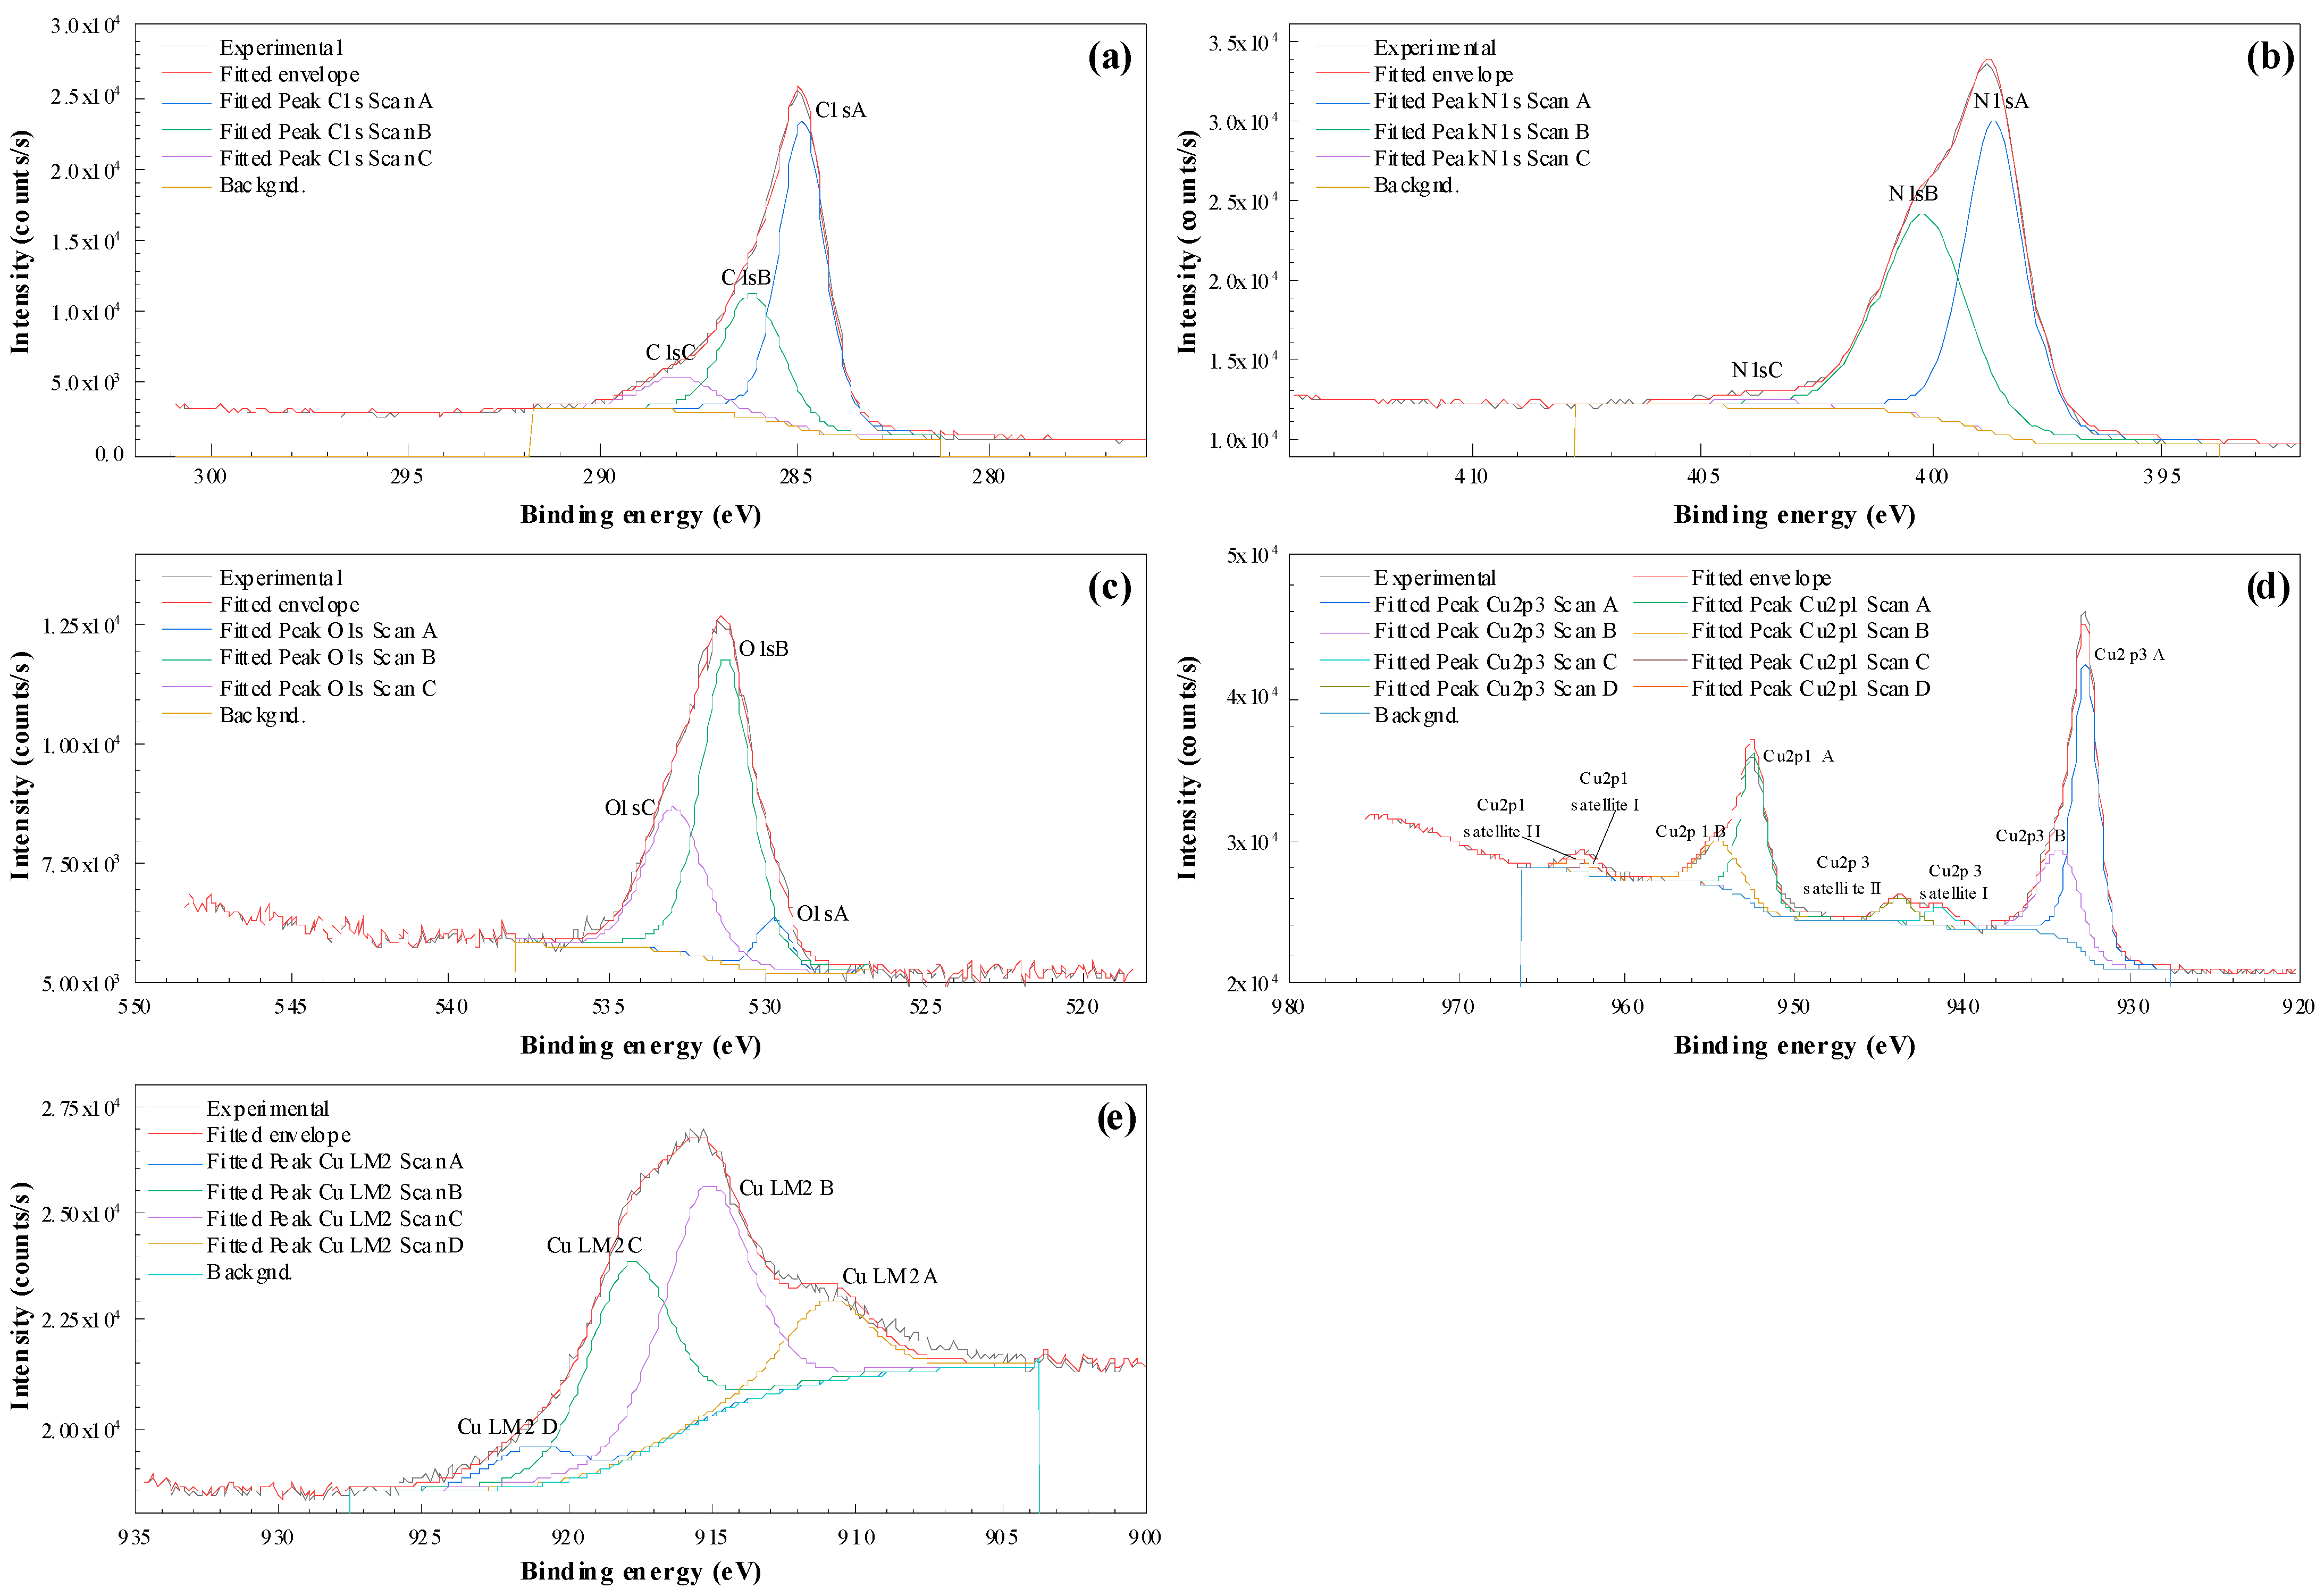
3.6. XPS Characterization

Wide scan survey spectra (Figure 6a) were utilized for the identification and quantification of elements in the thermolysis products obtained at 500 °C (Gly 500 °C and Gly-Cu 3.17% 500 °C), while high-resolution narrow scans were employed to construct the chemical state assessment table (Table 4).
In the wide scan survey spectra, peaks corresponding to O1s, C1s, and N1s were identified at 532.5 eV, in the 285–287 eV range, and in the 399–403 eV range, respectively. The presence of copper in glycine is evident, and the atomic percentage of oxygen increases due to the combination of copper with oxygen, contributing more oxygen to the compound. The C/N ratio of pristine glycine treated at 500 °C (2.9) deviates significantly from the theoretical ratio of glycine (2.0), indicating an excess of carbon or a deficiency of nitrogen resulting from the thermal treatment.
Remarkably, the C/O ratio in the pristine glycine thermolysate at 500 °C is 11, far exceeding the theoretical value of 1 for glycine. This implies a substantial excess of carbon or a deficiency of oxygen. However, upon copper incorporation, the C/O ratio decreases to 6.6, suggesting effective oxygen incorporation in the presence of copper, as mentioned earlier.
These analytical findings align well with those obtained by EDS for the pristine glycine thermolysate, with C/O ratios of 12.55 and 10.91 for EDS (after conversion of wt% results in Table 3 to at%) and XPS, respectively. However, they differ more in the case of the Gly-Cu 3.17% sample, with a C/O ratio of 9.46 for EDS (after conversion of wt% results in Table 3 to at%) vs. 6.61 for XPS. The atomic percentages of Cu obtained for Gly-Cu 3.17% by both methodologies also differ (1.44 at% by EDS vs. 2.44 at% by XPS).
Concerning the high-resolution spectra, in the case of C1s (Figure 6b, Figure 7a, and Table 5), the two carbon atoms of glycine give rise to two photoemission signals from their different chemical environments. The C–NH3+ peak arises at 286.2 eV, and COO at 288.3 eV.
Regarding N1s (Figure 6c, Figure 7b, and Table 6), glycine theoretically has a single nitrogen atom in its structure, resulting in a single photoemission signal at 401.4 eV for both polymorphic forms. However, our high-resolution signal fitting of the N1s reveals two majority components, one around 398.5 eV and the other around 400.2 eV. After copper introduction, the component at 402 eV shifts to 403.8 eV, corresponding to nitrite, although this component has a very low contribution to the overall nitrogen composition.
In relation to O1s (Figure 6d and Figure 7c), the deconvolution peak at 529.76 eV can be ascribed to Cu–O interaction, the peak at 531.27 eV to hydroxyl groups (OH), and the one at 532.9 eV to C–O bonds. The oxygen involved in OH significantly increased due to the introduction of Cu.
As for Cu2p (Figure 6e, Figure 7d, and Table 7), comparing the spectra with those reported by Biesinger et al. [35], the shape of the Cu2p3/2 spectrum and the satellites suggests it is not Cu(0), and Cu(1+) hardly has any satellites. The spectrum is similar to that of Cu(OH)2(2+), indicating a mixture of species with low-intensity satellites, possibly a combination of Cu(0) and a Cu(2+) Cu(OH)2 hydroxide or CuO oxide (tenorite).
Auger parameter calculation was employed for determining the chemical state, as detailed in Table 8. The Cu LMM peak shape, along with the Auger parameter and Cu2p3/2 peak position and shape, also proved valuable in discerning the different chemical states of copper. The presence of Cu (I) seems confirmed and consistent with the discovery by XPD of traces of Cu2O (cuprite).

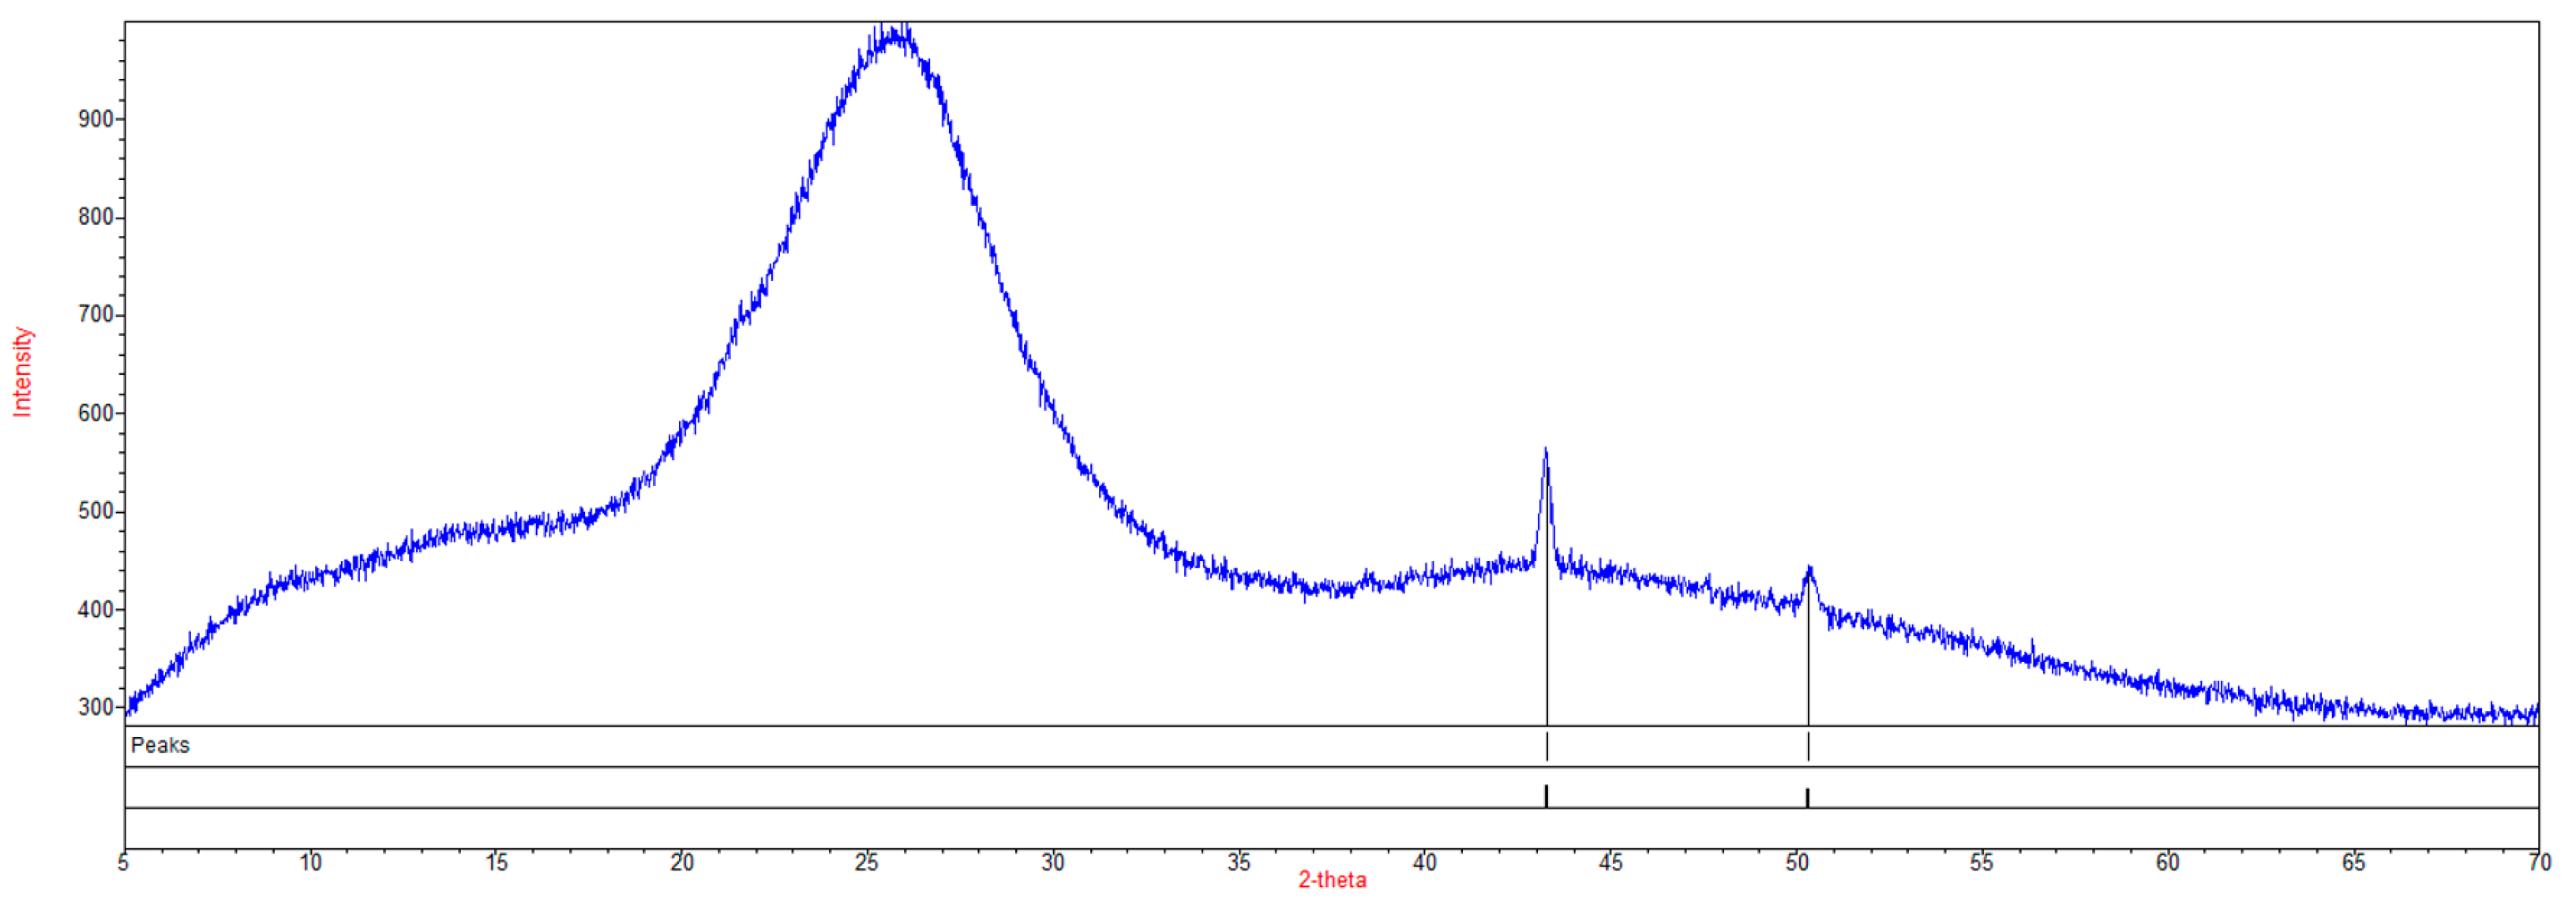
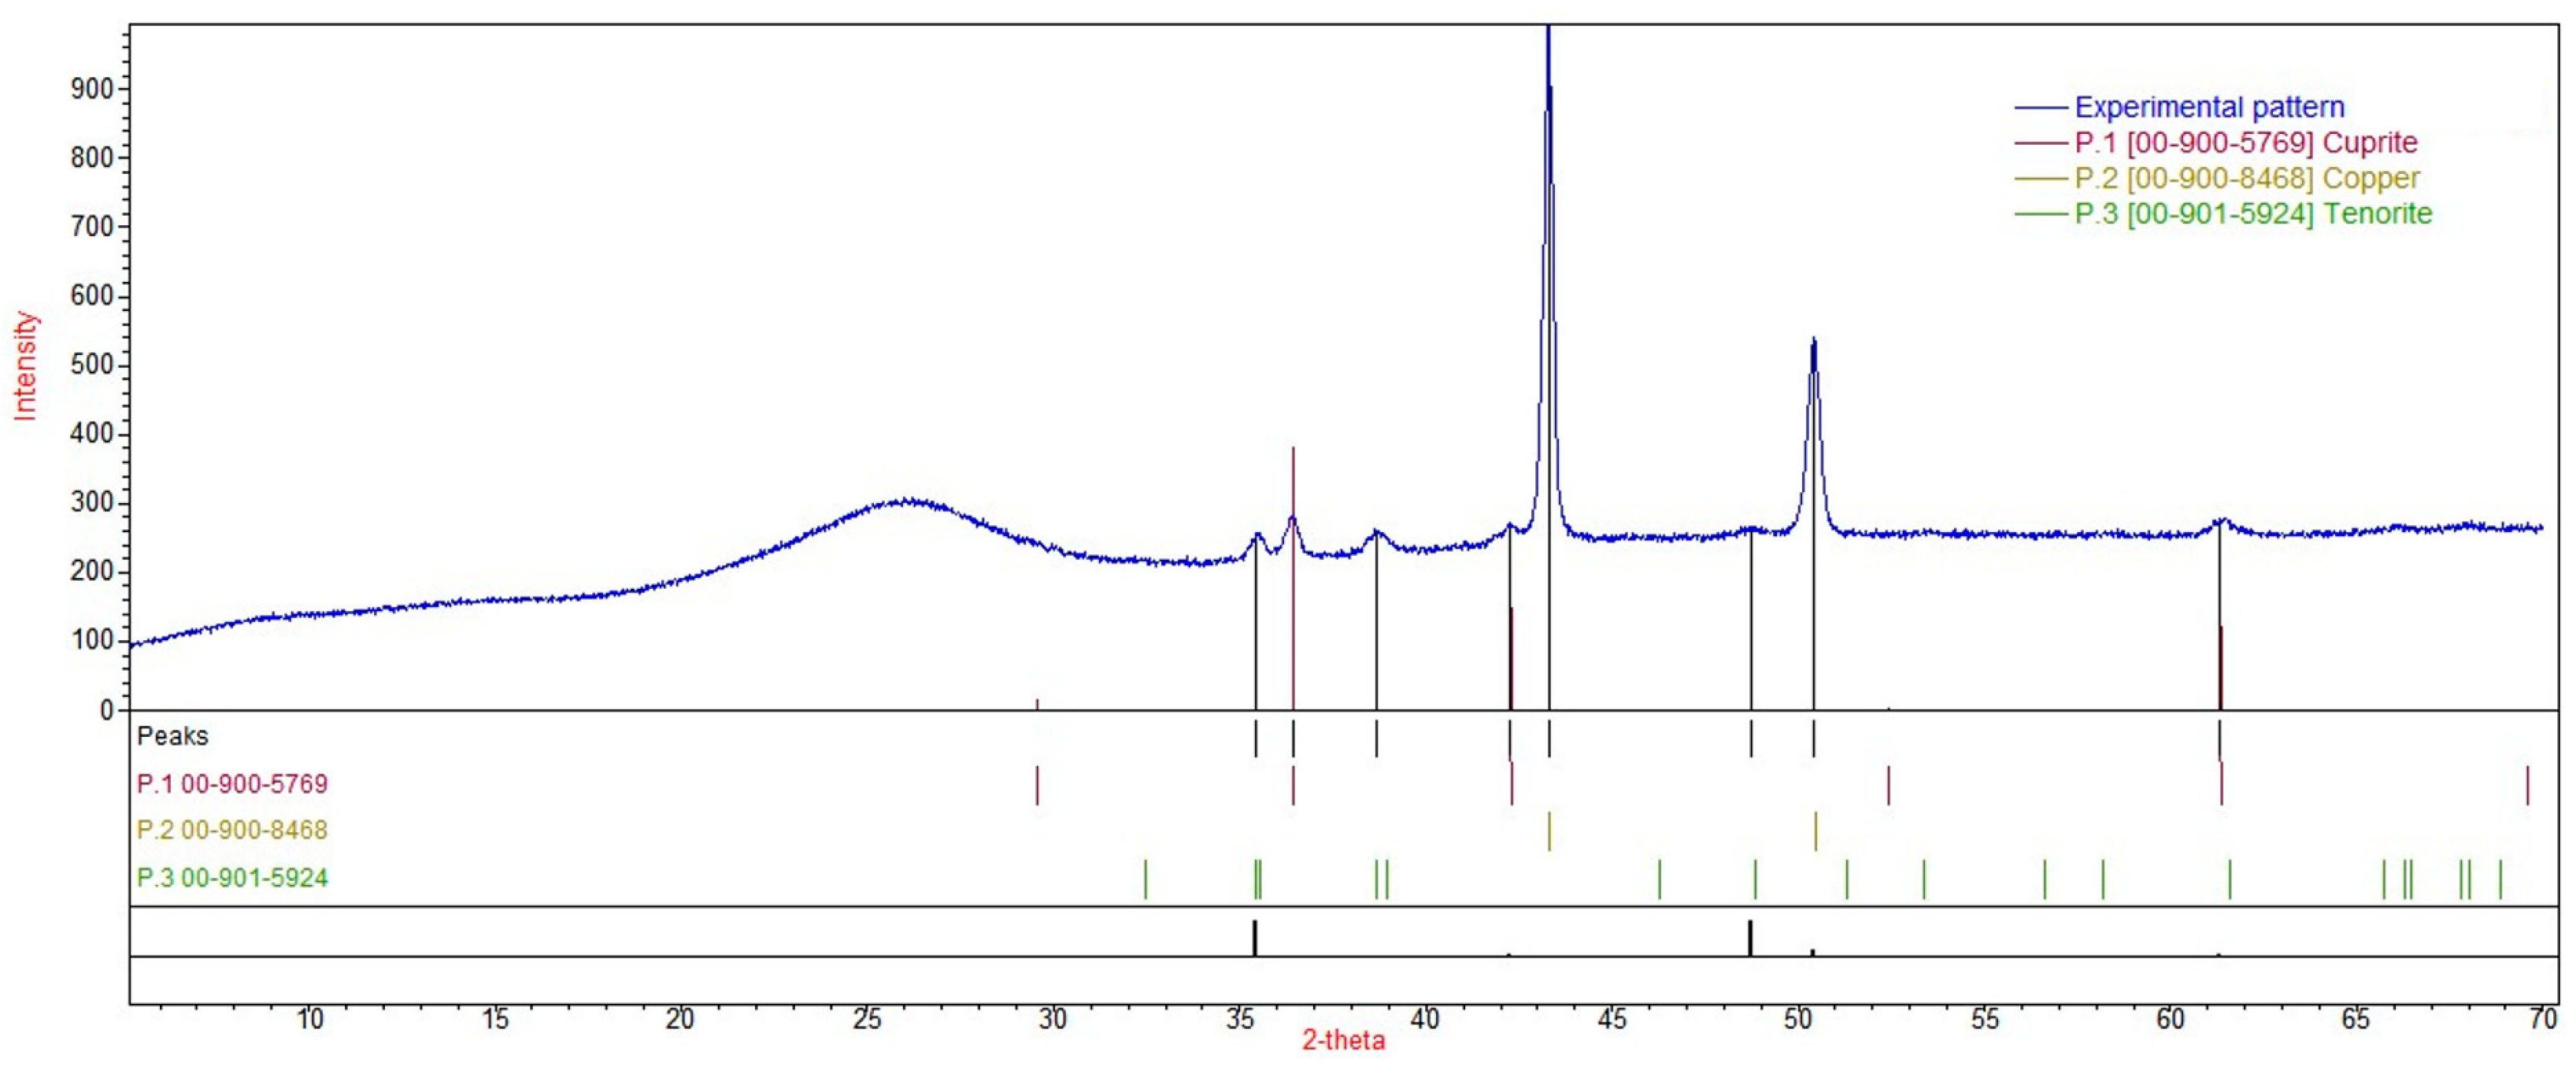
3.7. X-ray Powder Diffraction Characterization

In the powder diffractogram of the Gly-Cu0.16% sample thermolysate (Figure 8), only the presence of Cu metal is observed, indicated by reflections (111) and (200) at 43.3° and 50.4°, respectively, associated with a face-centered cubic lattice with a unit cell length of 361 pm [36]. Crystallite sizes (coherent scattering region sizes), estimated using the Scherrer equation, would be in the 34.76–38.72 nm range. The peak at 25.7° bears resemblance to the (002) reflection of graphite, albeit typically found at 26.7°, and would be associated with an interplanar distance of 3.46 Å.
In the Gly-Cu 3.17% sample thermolysate (Figure 9), alongside the prevailing presence of Cu metal, traces of CuO (tenorite) and Cu2O (cuprite) are evident. Rietveld analysis (Chi2 = 5.1082) yielded weight fractions of 84.88, 7.22, and 7.90% for Cu metal, CuO, and Cu2O, respectively. Average crystallite sizes of 35.10, 18.82, and 28.42 nm were estimated for Cu metal, CuO, and Cu2O, respectively, using the Scherrer equation. These values are comparable to (in the case of Cu metal) or slightly lower (in the case of copper oxides) than the particle sizes obtained from SEM micrographs (in the 29 to 55 nm range, with an average value of 37 ± 9 nm). The peak associated with graphite/graphene shifts to 26.1°, corresponding to an interplanar distance of 3.41 Å. This value does not match the interplanar distance calculated from STEM images. The most likely assignment for the latter interplanar spacing would be the ( 11 1 ¯ ) and (002) plane reflections of CuO at 2θ values of 35.55° and 35.57°, respectively (JCPDS card no. 00–041-0254).

3.8. Vibrational Characterization

3.8.1. Infrared Spectra

The FTIR spectra of the thermolysis products from pristine glycine (Table 9) reveal three prominent bands at 3071–3074 cm−1, 1583 cm−1, and 1206–1216 cm−1. The band in the range of 1206–1216 cm−1 is attributed to C–N stretching vibration, consistent with the presence of single carbo-nitrogenated species such as diazetine-diones. The band around 1580 cm−1, a characteristic mode in graphene and graphite, signifies the in-plane vibration of sp2-bonded carbon atoms and is sensitive to the number of layers in graphite.
Concerning the spectra of the copper/carbonaceous matrix composites, no major differences are observed as a function of the pyrolysis temperature (as shown in Figure 10 for the Gly-Cu 3.17% samples at 450, 500, and 550 °C). On the other hand, upon comparison with the spectra of the samples obtained from pristine glycine, noticeable changes are found (Table 9). These include the disappearance of the bands at 3074 cm−1, 1583 cm−1, and 712 cm−1, a reduction in the intensity of the band at 1206 cm−1, and the emergence of a primary band at 1564 cm−1, followed by another at around 1500 cm−1, along with three smaller bands between 1159 and 1008 cm−1 (with the presence of the bands at 1081 and 1008 cm−1 observed only in the sample with the highest Cu-doping). Additionally, a peak at 479 cm−1 is observed solely in the Gly-Cu 3.17% sample. The frequency at 1564 cm−1 is associated with –CN stretching vibrations [38], corresponding to the strong G band at 1563 cm−1 attributed to graphite. The band at around 1500 cm−1 corresponds to ν (C=C) or the asymmetric flexion (δA) of the C–H bond in CH3. Finally, the band at 479 cm−1 is attributed to Cu–N stretching vibrations [39].

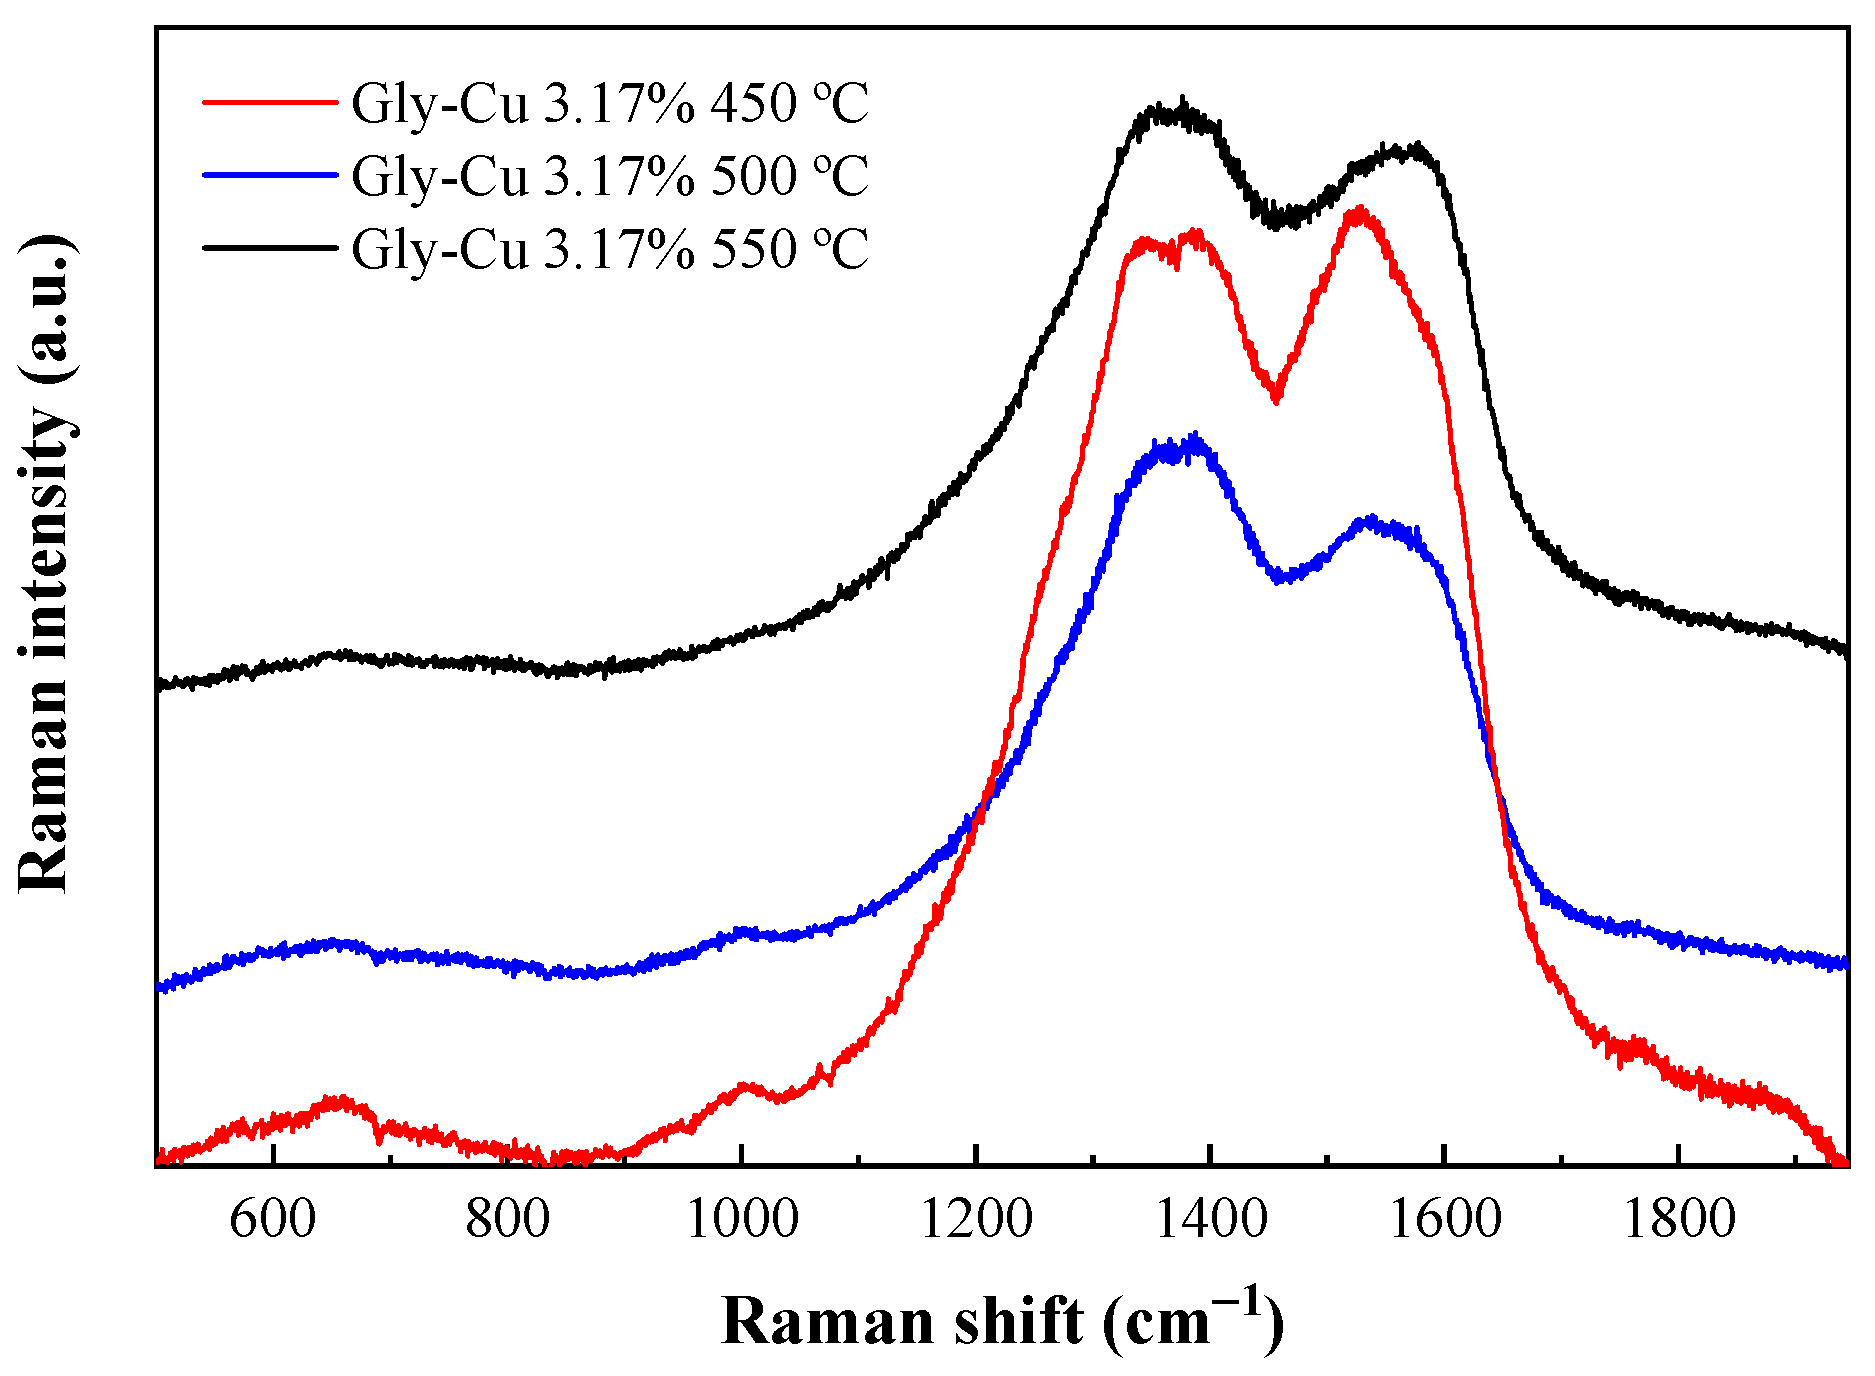
3.8.2. Raman Spectra
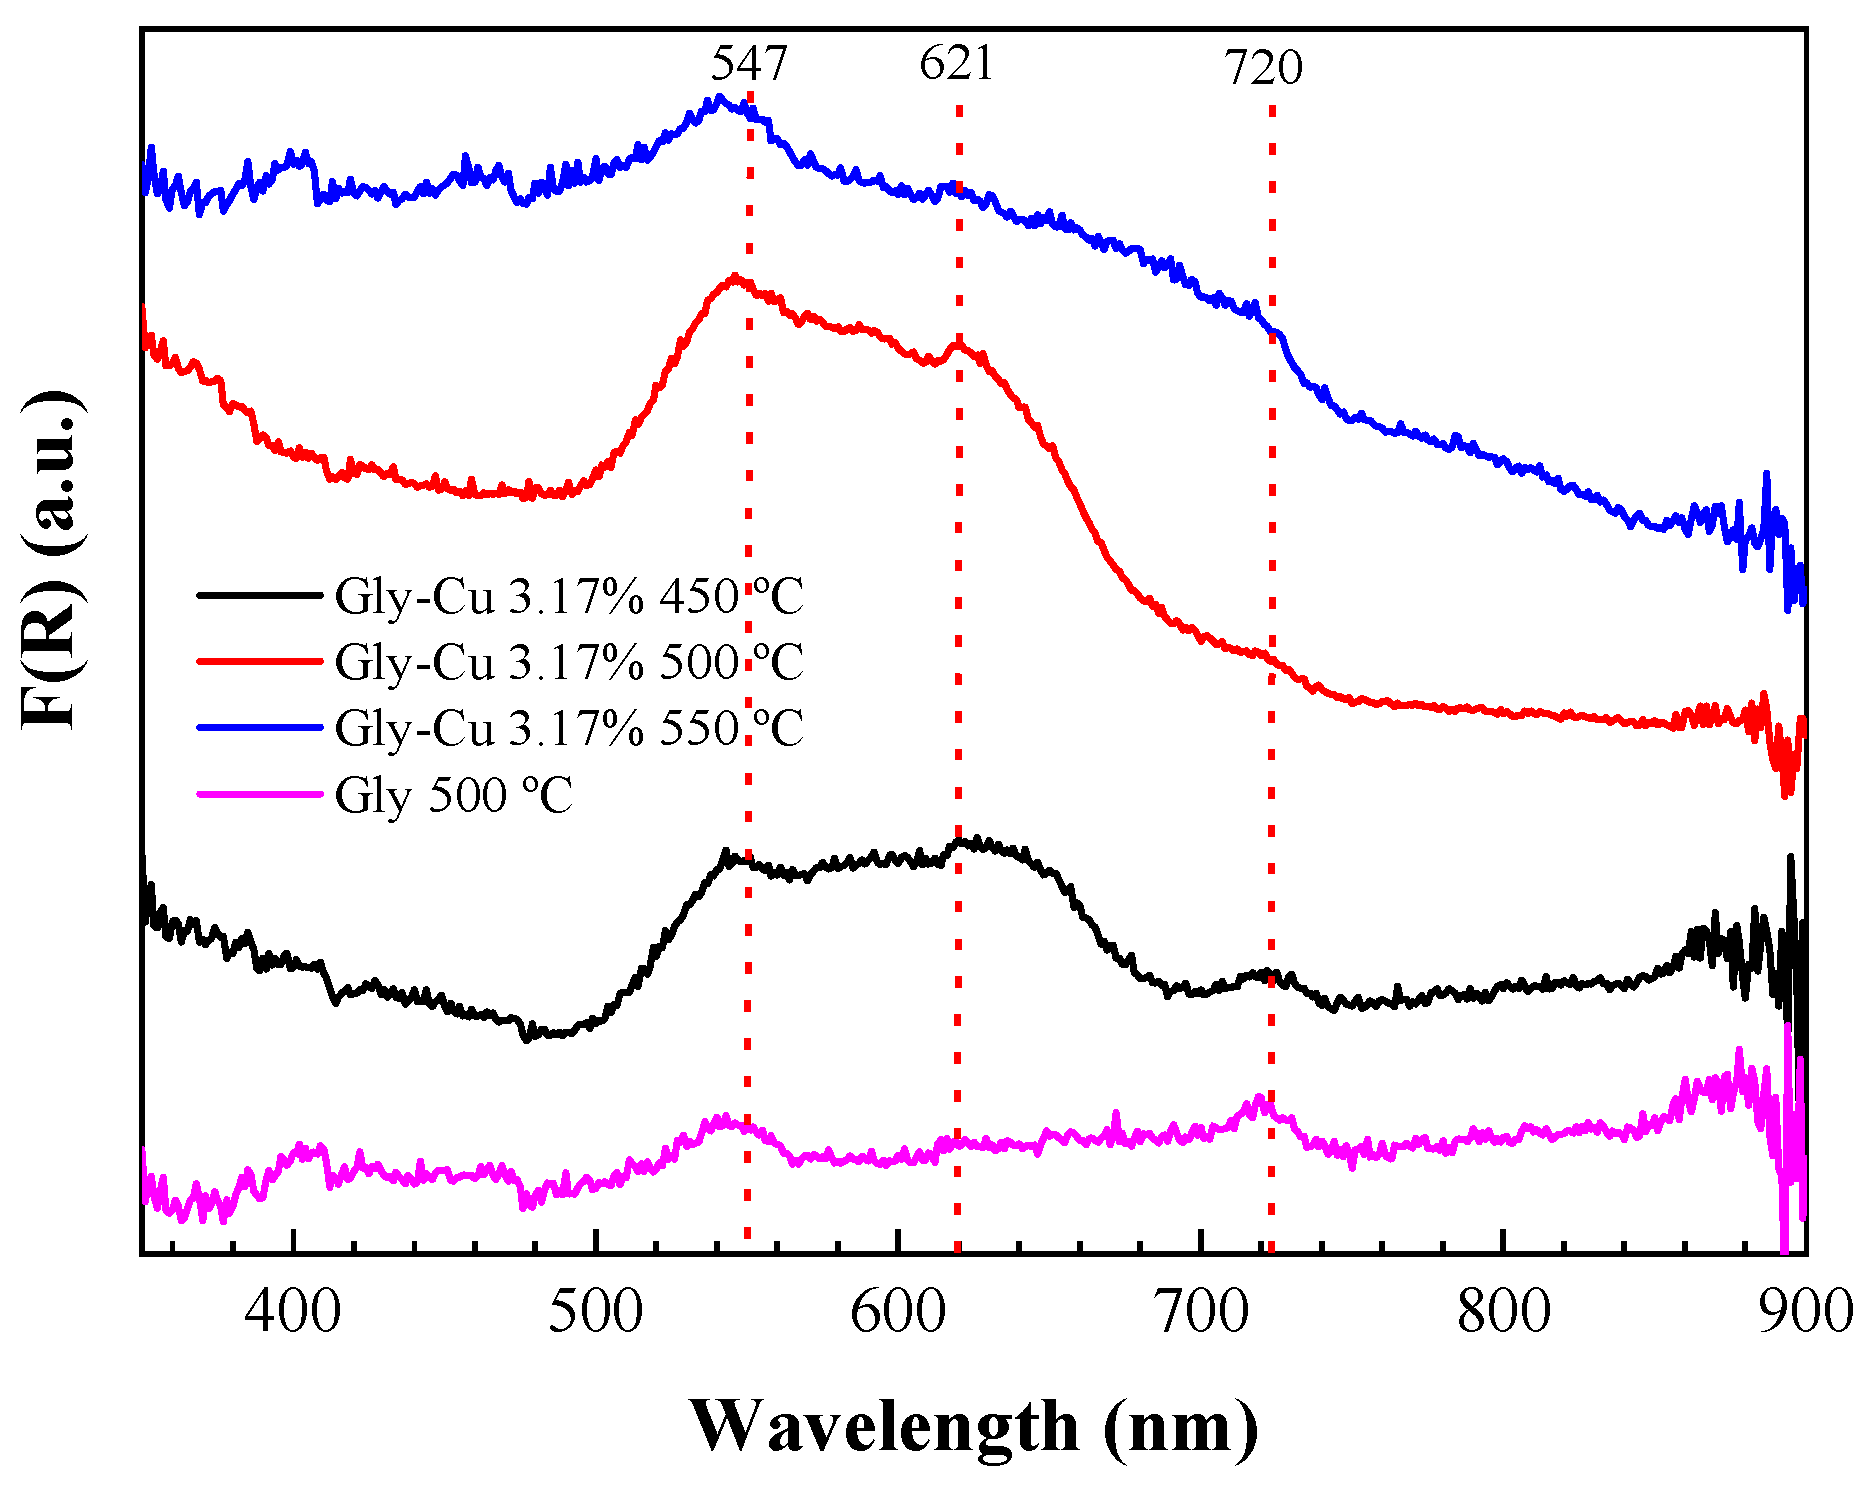
The Raman spectra (Figure 11) exhibit peaks at 1364, 1527, and 1568 cm−1. The peak at 1364 cm−1 is assignable to the graphene D mode (disorder mode), akin to what is observed for pristine graphene at 1350 cm−1. The peak at 1568 cm−1 is a distinctive feature of graphenic carbon (G-mode, graphitic mode), representing the in-plane vibration of sp² hybridized carbon atoms in the hexagonal lattice. The D band is associated with defects and disorder in the graphite structure due to intervalley scattering, while the G band corresponds to the E2g vibration of sp2 of C atoms. The peak at 1527 cm−1 is attributed to a C=C stretching vibration.

3.9. UV–Vis Spectra

Figure 12 illustrates the UV-Vis spectra of Cu-doped glycine thermolisates obtained at 450, 500, and 550 °C, alongside the spectrum of pristine glycine pyrolyzed at 500 °C for comparison. The bandgaps, determined from the Tauc plot, were found to be 1.52, 1.65, and 1.22 eV for the samples with 0.16% Cu treated at 450, 500, and 550 °C, respectively. The bandgap for carbonized glycine at 500 °C was estimated at 0.90 eV. The higher bandgap observed for the Cu samples may be attributed to more localized orbitals around the Cu sites with increased energy.
The band absorptions at 547 and 620 nm bear resemblance to those of copper (II) tetraphenylporphyrinate (CuTPP), where a Cu (II) ion is coordinated by four N atoms. These absorptions can be assigned to Q bands with some ‘vibrational contour’ resulting from the active band around 1507 cm−1 (C–C/C–N conjugated) in the infrared region, corresponding to 0.19 eV, with an overtone around 540 nm. Additionally, they correspond to the intense band around 1159 cm−1 (C–N stretching) that corresponds to 0.14 eV (as observed in IR spectra) [40], with an overtone around 720 nm [40]. Both bands play a role in the coordination of Cu2+ for the N ligand. Furthermore, the consistently present bands at 547 and 620 nm across all samples may be associated with some sites involving pyrrole-like centers arranged in a ring, similar to what is observed in tetraphenyl porphyrin (H2TPP) [41].

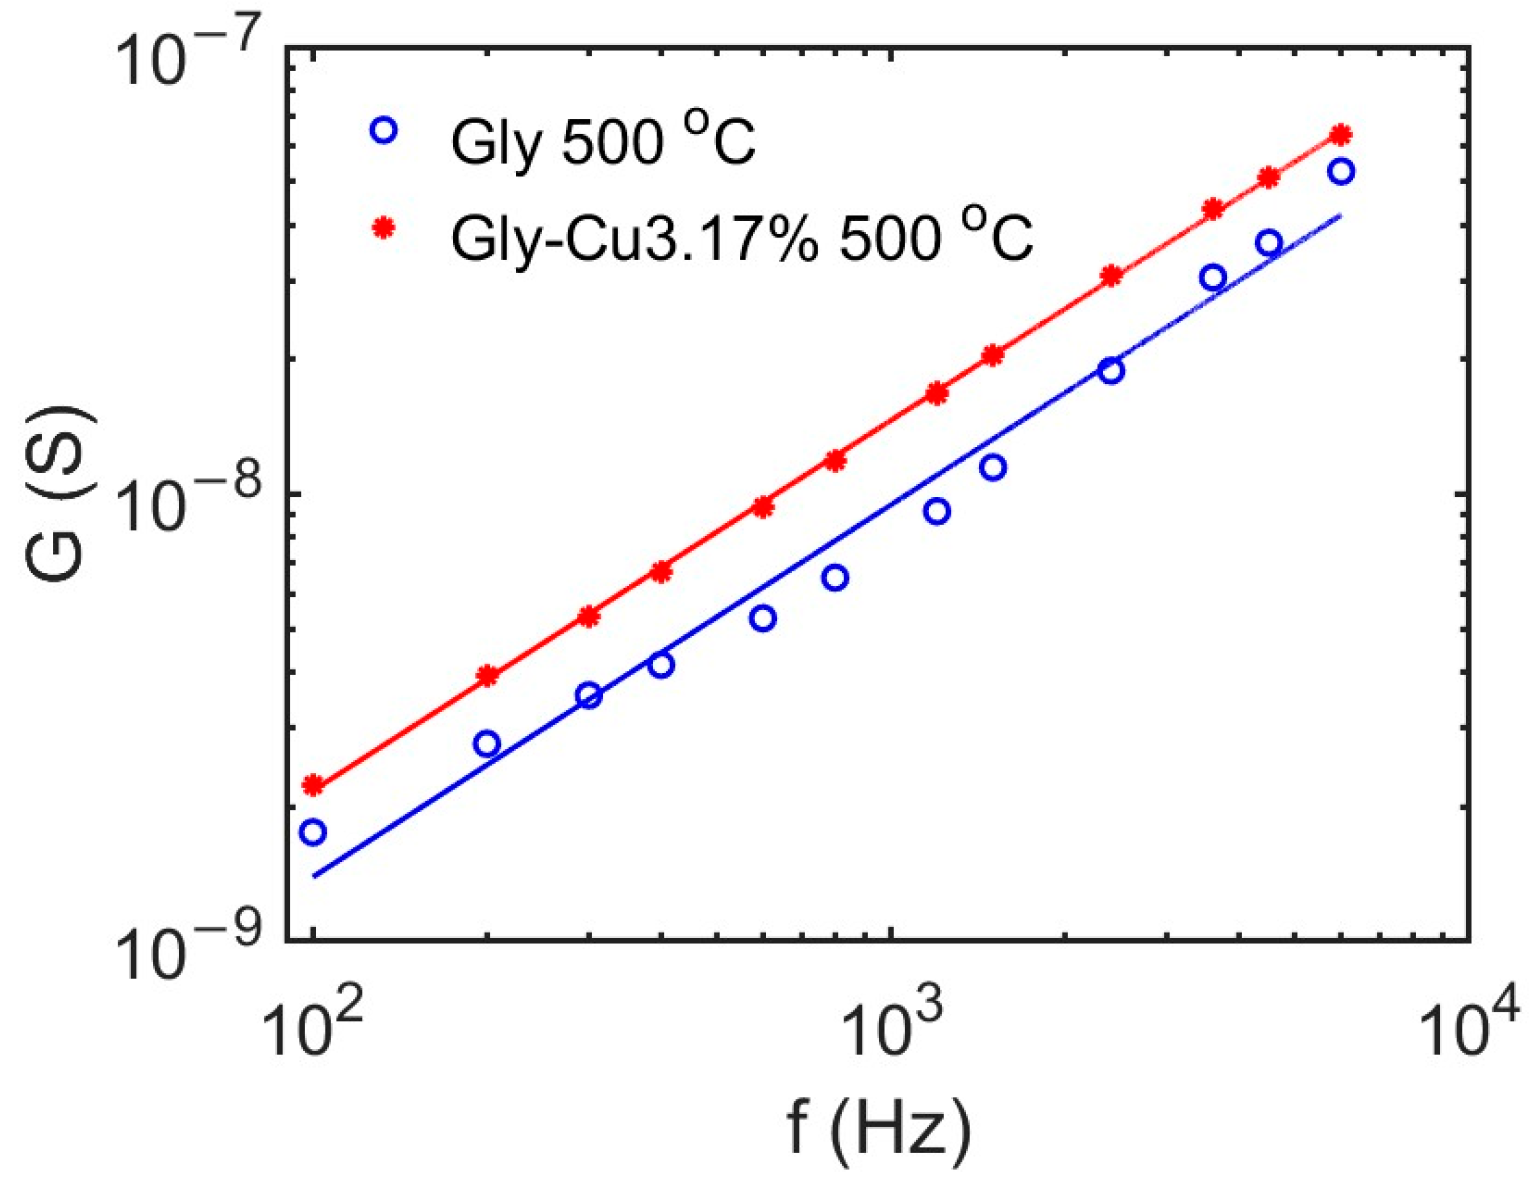
3.10. Conductivity Measurements

Figure 13 displays the conductance values of Gly 500 °C and Gly-Cu 3.17% 500 °C samples measured in the range between 100 Hz and 6 kHz, along with their corresponding least squares fits.
When prepared as described in Section 2.2, the samples constitute random mixtures of a conductor material (the sample) and an insulator (air). These systems are known to exhibit critical behavior due to percolation effects. In particular, it has been shown [42] that the AC conductivity of the mixture follows the power-law behavior near the percolation threshold:
σ ( ω ) ~ ω x ,
where σ is the effective bulk conductivity and ω is the angular frequency.
A very good fit between experimental measurements and the expected behavior of random conductor-insulator mixtures described by Equation (1) was found in this case. The critical exponent obtained from the measurements is x = 0.83 for both samples, in agreement with the previously reported value of x = 0.86 for a mixture of amorphous carbon and Teflon [43]. The measured results indicate a significant increase in the conductivity of the Cu-doped sample, in line with the results observed for electrodeposited particulate composite films [44].

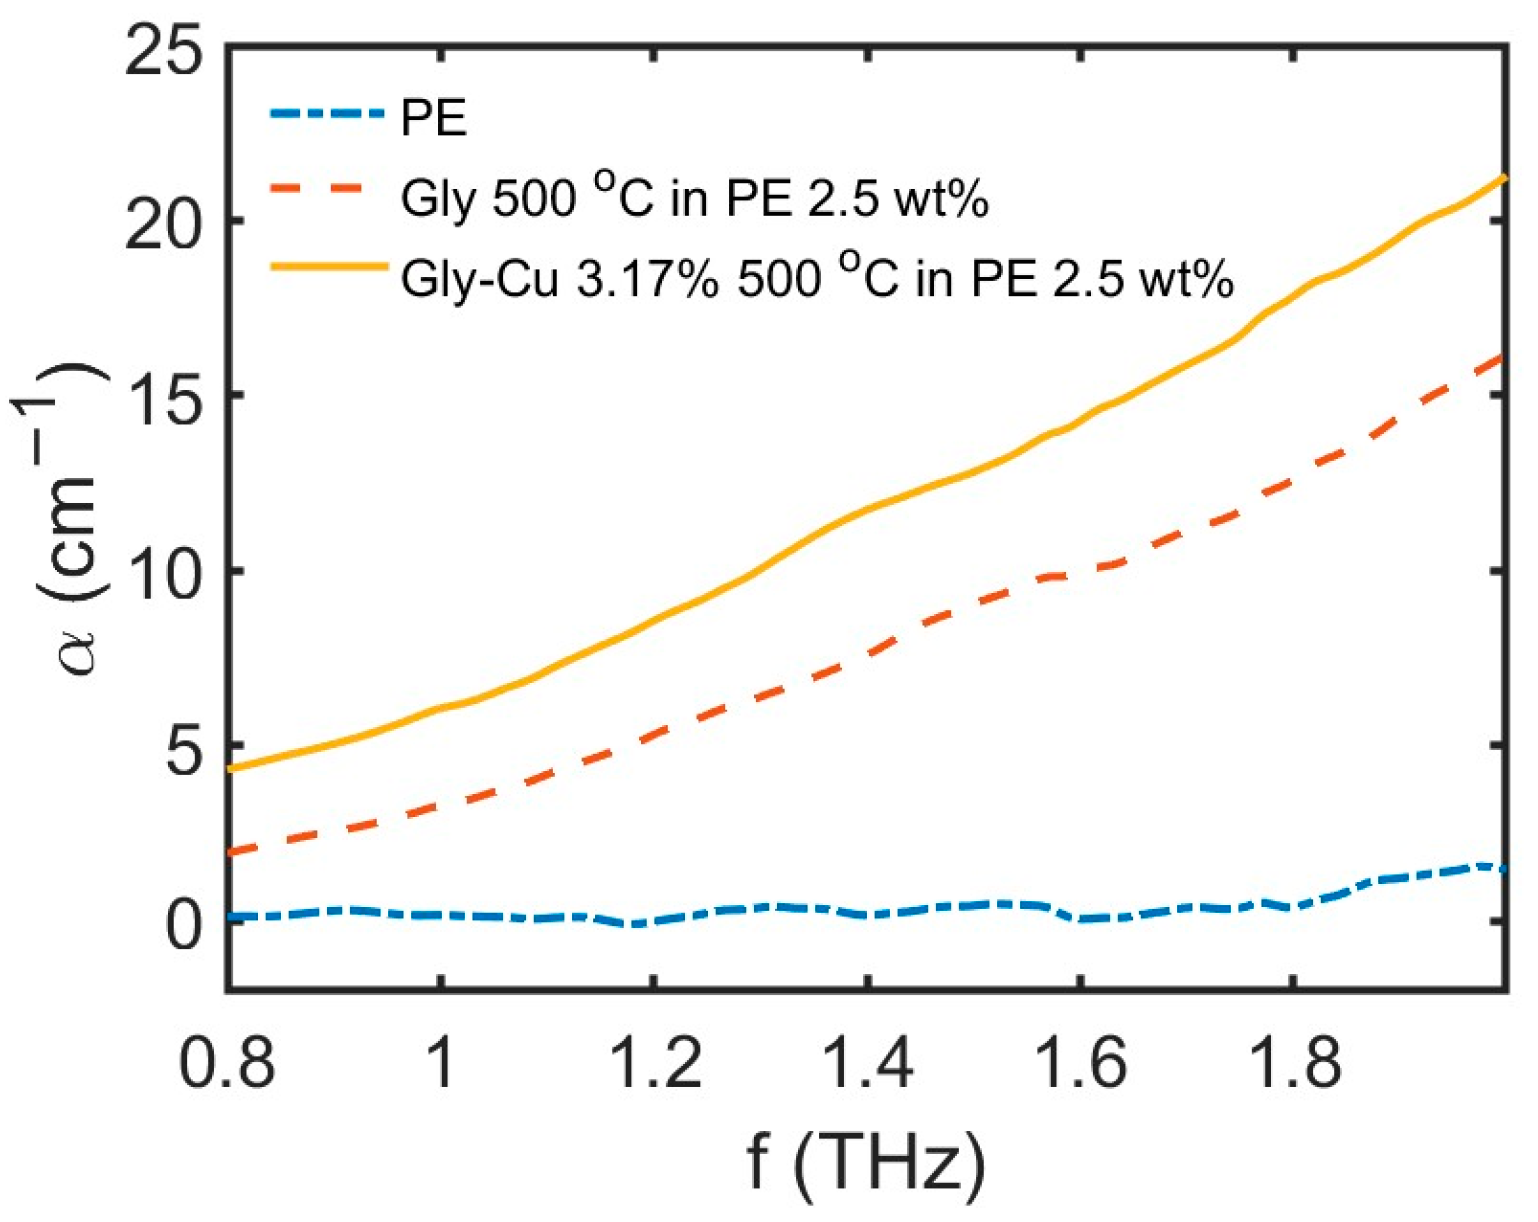
3.11. THz Absorption Study

Carbon-based materials emerge as particularly appealing absorbers for terahertz applications [24]. Blends of these substances with transparent polymers in the terahertz spectral region provide a means to fine-tune absorption to a required value with high flexibility by adjusting the concentration of the carbon material. The results of THz measurements for the thermolysates of pristine glycine and glycine doped with 3.17% Cu obtained at 500 °C, both dispersed in PE, are presented in Figure 14. When comparing the absorption of the new material with reference materials described in the literature [29], it is evident that its absorption is lower than that of Asbury graphite and needle coke mixed with polyethylene at the same concentration. This observation aligns with the lower carbon content in the composite.
Moreover, terahertz measurements demonstrate that copper doping indeed enhances the absorption of radiation in the THz band. In the new copper-doped sample, the absorption appears to be comparable to that of coke, indicating an effective improvement in the material’s THz absorption characteristics.
Consequently, the investigation into the terahertz spectrum properties of the new material reveals its excellent candidacy for applications as a terahertz absorber. Notably, copper doping emerges as a remarkably effective strategy for modulating the absorption properties of such materials, allowing for precise tuning when combined with adjustments to its concentration in a polymer matrix.

4. Discussion

In the conditions employed for the synthesis of the new material through a solid-state reaction, the formation of copper (II) glycinate is expected, following a non-redox dissociative substitution mechanism:
2 H2NCH2COOH + Cu(CH3COO)2 → Cu(H2NCH2COO)2 + 2 CH3COOH
Consequently, copper (II) glycinate should be considered among the precursors of the new composite to justify its nature in terms of shape and composition. While copper acetate melts at 273 °C and glycine at 233 °C [45], copper glycinate chars at 213 °C and decomposes at 228 °C with gas evolution [45,46]. The presence of the latter component in the sample leads to its early decomposition and the generation of carbon, which subsequently dissolves into the melts of glycine and copper acetate to form a solid solution.
Regarding the composition of the new material, the presence of elemental copper, tenorite, and graphenic carbon is evident. However, the formation of copper (II) N-ring chelate complexes as a minority component requires careful analysis. The thermal behavior during the synthesis process implies the loss of the carboxyl group of the glycine/copper (II) complex at around 235 °C, the loss of aminic groups at around 286 °C, and the release of amine fragments in the range of 320–500 °C. This complexity makes it challenging to predict specific species (such as purine bases, ammeline, or others) resulting from the thermolysis. Nevertheless, it has been strongly evidenced that the pyrolysis of glycine between 300 and 400 °C leads to a mixture of C and C2H2N2O2 species (either 1,3-diazetine-2,4-dione or 1,2-diazetine-3,4-dione isomers, Figure 4 [20]). This supports the consideration that the ligands attached to copper (II) are provided by the diazetinedione species (Figure 15). The UV-Vis and FTIR results support this possibility.
A study of the proposed complexes with cis and trans configurations of the ligands has been conducted employing semi-empirical quantum chemistry methods. The ground-state geometries of the complexes, optimized using the PM6 Hamiltonian as implemented in MOPAC, are depicted in Figure 15. In both cases, the calculations reveal planar tetra-coordinated geometries characterized by robust interactions between the d electrons of the copper (II) ion and the in-plane ligand crystal field.
Therefore, copper occupies sites where diazetidine-like nitrogen is present and, in a certain way, acts as a template, increasing these types of sites during synthesis. Similar sites without a centrally coordinated ion also seem to be present in thermolyzed glycine, as indicated by the weak bands at 547 and 720 nm, corresponding to the overtones of the two main IR bands. These diazetine-like sites are often found when pyrolyzing carbon, nitrogen, amino acids, or similar compounds [40]. Glycine likely easily condenses around a metallic ion, with nitrogen coordinated by the central ion. It is noteworthy to point out the broad hydrogen bond region between 3500 and 2800 cm−1, attributable to both NH and OH stretching.
Figure 16 illustrates the electronic resonances resulting from the splitting of the d electronic levels of the Cu (II) ion due to the ligand crystal field effect, observed between 460 and 900 nm. The calculations were performed utilizing the INDO/S method. The figure also includes a visual representation of the associated absorption spectra in this band based on the computed transitions. A closer alignment between the experimental data and computations is observed for the copper (II) complex with the trans isomer ligand 1,3-diazetine-2,4-dione, characterized by relatively strong intensity peaks at 560, 575, and 765 nm.
Concerning conductivity measures, the obtained results suggest that the new copper/graphene composite material holds promise for significant applications in fields requiring high conductivity, such as electronics and energy storage, as demonstrated by Hidalgo-Manrique et al. [2] and Pan et al. [47].
Moreover, the measurement of radiation absorption in the THz band, a crucial parameter for materials used in THz shielding, indicates that copper doping enhances radiation absorption. Notably, the absorption in the copper-doped sample appears comparable to that of coke, a material recognized for its high absorption rate in the THz band. This significance is underscored by the potential applications of the new composite with copper doping as a shielding material in the THz region, akin to findings reported by Khattak et al. [48] and Song et al. [49]. Remarkably, these THz results align with the conductivity measurements, providing a coherent understanding of the material’s performance across different parameters.

5. Conclusions

The reported composite material was produced through the thermal treatment of glycine and copper acetate monohydrate in varying ratios at temperatures ranging from 450 to 550 °C. According to EDS results, the composite consists of a carbonaceous matrix with a 6:1 mixture of graphenic carbon and a copper N-ring chelate resembling diazetidinedione (C2H2N2O2). Additionally, a significant proportion of copper (8%) is present in the free metallic form, with traces of tenorite (CuO). The inclusion of elemental copper results in a noteworthy increase in conductivity for the new copper/graphene composite. These findings suggest potential applications in fields requiring high conductivity, such as electronics and energy storage. Moreover, the results on THz radiation absorption indicate that the copper-doped material may enhance THz shielding. This could find applications in fields like medical imaging and security screening, where THz radiation is commonly used.

Author Contributions

Conceptualization, P.C.-P. and J.M.-G.; methodology, P.C.-P., R.C.D., J.M.-G. and P.M.-R.; software, P.C.-P.; validation, R.C.D. and Ó.R.-L.; formal analysis, P.C.-P., R.C.D., J.V.-C. and P.M.-R.; investigation, P.C.-P., R.C.D., J.M.-G., D.G.D., A.C., J.V.-C., Ó.R.-L., I.M.-M. and P.M.-R.; resources, P.C.-P., J.M.-G. and Ó.R.-L.; writing—original draft preparation, P.C-P., R.C.D., J.M.-G. and P.M.-R.; writing—review and editing, P.M.-R.; visualization, P.C.-P., R.C.D., I.M.-M. and P.M.-R.; project administration, P.C.-P.; funding acquisition, P.C.-P. All authors have read and agreed to the published version of the manuscript.

Funding

This research was funded by the Spanish Ministerio de Ciencia e Innovación (MCIN) under project PID2020-119418GB-I00.

Data Availability Statement

The data supporting the findings of this study are available within the article.

Acknowledgments

XPS and electron microscopy characterizations were performed at CACTI (University of Vigo).

Conflicts of Interest

The authors declare no conflicts of interest.

References

  1. Gupta, S.; Bharti, H. A review on copper-graphite composite material fabrication and its mechanical properties. Int. J. Adv. Res. Innov. Ideas Educ. 2016, 2, 594–599. [Google Scholar]
  2. Hidalgo-Manrique, P.; Lei, X.; Xu, R.; Zhou, M.; Kinloch, I.A.; Young, R.J. Copper/graphene composites: A review. J. Mater. Sci. 2019, 54, 12236–12289. [Google Scholar] [CrossRef]
  3. Cantürk, S.B.; Kováčik, J. Review of recent development in copper/carbon composites prepared by infiltration technique. Energies 2022, 15, 5227. [Google Scholar] [CrossRef]
  4. Subramaniam, C.; Yamada, T.; Kobashi, K.; Sekiguchi, A.; Futaba, D.N.; Yumura, M.; Hata, K. One hundred fold increase in current carrying capacity in a carbon nanotube–copper composite. Nat. Commun. 2013, 4, 2202. [Google Scholar] [CrossRef] [PubMed]
  5. Subramaniam, C.; Yasuda, Y.; Takeya, S.; Ata, S.; Nishizawa, A.; Futaba, D.; Yamada, T.; Hata, K. Carbon nanotube-copper exhibiting metal-like thermal conductivity and silicon-like thermal expansion for efficient cooling of electronics. Nanoscale 2014, 6, 2669–2674. [Google Scholar] [CrossRef] [PubMed]
  6. Arnaud, C.; Lecouturier, F.; Mesguich, D.; Ferreira, N.; Chevallier, G.; Estournès, C.; Weibel, A.; Laurent, C. High strength—High conductivity double-walled carbon nanotube—Copper composite wires. Carbon 2016, 96, 212–215. [Google Scholar] [CrossRef]
  7. Xu, G.; Zhao, J.; Li, S.; Zhang, X.; Yong, Z.; Li, Q. Continuous electrodeposition for lightweight, highly conducting and strong carbon nanotube-copper composite fibers. Nanoscale 2011, 3, 4215. [Google Scholar] [CrossRef] [PubMed]
  8. Ahmad, H.; Markina, A.A.; Porotnikov, M.V.; Ahmad, F. A review of carbon fiber materials in automotive industry. IOP Conf. Ser. Mater. Sci. Eng. 2020, 971, 032011. [Google Scholar] [CrossRef]
  9. Wazeer, A.; Das, A.; Abeykoon, C.; Sinha, A.; Karmakar, A. Composites for electric vehicles and automotive sector: A review. Green Energy Intell. Transp. 2023, 2, 100043. [Google Scholar] [CrossRef]
  10. Li, X.; Zhou, C.; Overman, N.; Ma, X.; Canfield, N.; Kappagantula, K.; Schroth, J.; Grant, G. Copper carbon composite wire with a uniform carbon dispersion made by friction extrusion. J. Manuf. Process. 2021, 65, 397–406. [Google Scholar] [CrossRef]
  11. Graça, I.; Seixas, T.; Ferro, A.C.; Guedes, M. Nanostructured copper-carbon nanotubes composites for aircraft applications. Aircr. Eng. Aerosp. Technol. 2018, 90, 1042–1049. [Google Scholar] [CrossRef]
  12. Sundaram, R.M.; Sekiguchi, A.; Sekiya, M.; Yamada, T.; Hata, K. Copper/carbon nanotube composites: Research trends and outlook. R. Soc. Open Sci. 2018, 5, 180814. [Google Scholar] [CrossRef] [PubMed]
  13. Kute, A.D.; Gaikwad, R.P.; Warkad, I.R.; Gawande, M.B. A review on the synthesis and applications of sustainable copper-based nanomaterials. Green Chem. 2022, 24, 3502–3573. [Google Scholar] [CrossRef]
  14. Reljic, S.; Cuadrado-Collados, C.; Oliveira Jardim, E.; Farrando-Perez, J.; Martinez-Escandell, M.; Silvestre-Albero, J. Activated carbon materials with a rich surface chemistry prepared from L-cysteine amino acid. Fluid Phase Equilib. 2022, 558, 113446. [Google Scholar] [CrossRef]
  15. Wei, L.; Guo, L.; Jiang, J.; Liu, M.; Yang, T. Influence of Fe2O3 on glycine pyrolysis characteristics and nitrogen conversion. CIESC J. 2019, 70, 1942–1950. [Google Scholar] [CrossRef]
  16. Wang, W.; Tesio, A.Y.; Olivares-Marín, M.; Gómez Romero, P.; Tonti, D. Facile preparation of glycine-based mesoporous graphitic carbons with embedded cobalt nanoparticles. J. Mater. Sci. 2022, 57, 13403–13413. [Google Scholar] [CrossRef]
  17. Leng, L.; Yang, L.; Zu, H.; Yang, J.; Ai, Z.; Zhang, W.; Peng, H.; Zhan, H.; Li, H.; Zhong, Q. Insights into glycine pyrolysis mechanisms: Integrated experimental and molecular dynamics/DFT simulation studies. Fuel 2023, 351, 128949. [Google Scholar] [CrossRef]
  18. Li, J.; Wang, Z.; Yang, X.; Hu, L.; Liu, Y.; Wang, C. Evaluate the pyrolysis pathway of glycine and glycylglycine by TG–FTIR. J. Anal. Appl. Pyrolysis 2007, 80, 247–253. [Google Scholar] [CrossRef]
  19. Hao, J.; Guo, J.; Ding, L.; Xie, F.; Xia, Q.; Xie, J. TG-FTIR, Py-two-dimensional GC–MS with heart-cutting and LC–MS/MS to reveal hydrocyanic acid formation mechanisms during glycine pyrolysis. J. Therm. Anal. Calorim. 2013, 115, 667–673. [Google Scholar] [CrossRef]
  20. Weiss, I.M.; Muth, C.; Drumm, R.; Kirchner, H.O.K. Thermal decomposition of the amino acids glycine, cysteine, aspartic acid, asparagine, glutamic acid, glutamine, arginine and histidine. BMC Biophys. 2018, 11, 2. [Google Scholar] [CrossRef]
  21. Shao, Y.; Hu, Z.-y.; Yao, Y.; Wei, X.-r.; Gao, X.-m.; Wu, Z.-x. Glycine-derived nitrogen-doped ordered mesoporous carbons with a bimodal mesopore size distribution for supercapacitors and oxygen reduction. New Carbon Mater. 2022, 37, 259–276. [Google Scholar] [CrossRef]
  22. Cossu, F.L.; Poddighe, M.; Stagi, L.; Anedda, R.; Innocenzi, P. The birth of fluorescence from thermally polymerized glycine. Macromol. Chem. Phys. 2022, 223, 2200052. [Google Scholar] [CrossRef]
  23. Siegel, P.H. Terahertz technology. IEEE Trans. Microw. Theory Tech. 2002, 50, 910–928. [Google Scholar] [CrossRef]
  24. Venkatachalam, S.; Zeranska-Chudek, K.; Zdrojek, M.; Hourlier, D. Carbon-based terahertz absorbers: Materials, applications, and perspectives. Nano Sel. 2020, 1, 471–490. [Google Scholar] [CrossRef]
  25. Castle, J.E. Practical Surface Analysis by Auger and X-ray Photoelectron Spectroscopy; John Wiley & Sons, Ltd.: Chichester, UK, 1984; Volume 6, p. 302. [Google Scholar]
  26. Rodríguez-Carvajal, J. Recent developments of the program FULLPROF. Comm. Powder Diffr. (IUCr) Newsl. 2001, 26, 12–19. [Google Scholar]
  27. Zanatta, A.R. Revisiting the optical bandgap of semiconductors and the proposal of a unified methodology to its determination. Sci. Rep. 2019, 9, 11225. [Google Scholar] [CrossRef]
  28. Duvillaret, L.; Garet, F.; Coutaz, J.L. A reliable method for extraction of material parameters in terahertz time-domain spectroscopy. IEEE J. Sel. Top. Quantum Electron. 1996, 2, 739–746. [Google Scholar] [CrossRef]
  29. Chamorro-Posada, P.; Vazquez-Cabo, J.; Rubinos-Lopez, O.; Martin-Gil, J.; Hernandez-Navarro, S.; Martin-Ramos, P.; Sanchez-Arevalo, F.M.; Tamashausky, A.V.; Merino-Sanchez, C.; Dante, R.C. THz TDS study of several sp(2) carbon materials: Graphite, needle coke and graphene oxides. Carbon 2016, 98, 484–490. [Google Scholar] [CrossRef]
  30. Stewart, J.J.P. Optimization of parameters for semiempirical methods V: Modification of NDDO approximations and application to 70 elements. J. Mol. Model. 2007, 13, 1173–1213. [Google Scholar] [CrossRef] [PubMed]
  31. Ridley, J.; Zerner, M. An intermediate neglect of differential overlap technique for spectroscopy: Pyrrole and the azines. Theor. Chim. Acta 1973, 32, 111–134. [Google Scholar] [CrossRef]
  32. Zerner, M.C.; Loew, G.H.; Kirchner, R.F.; Mueller-Westerhoff, U.T. An intermediate neglect of differential overlap technique for spectroscopy of transition-metal complexes. Ferrocene. J. Am. Chem. Soc. 1980, 102, 589–599. [Google Scholar] [CrossRef]
  33. Neese, F. The ORCA program system. Wiley Interdiscip. Rev. Comput. Mol. Sci. 2012, 2, 73–78. [Google Scholar] [CrossRef]
  34. Schneider, C.A.; Rasband, W.S.; Eliceiri, K.W. NIH Image to ImageJ: 25 years of image analysis. Nat. Methods 2012, 9, 671. [Google Scholar] [CrossRef] [PubMed]
  35. Biesinger, M.C.; Lau, L.W.M.; Gerson, A.R.; Smart, R.S.C. Resolving surface chemical states in XPS analysis of first row transition metals, oxides and hydroxides: Sc, Ti, V, Cu and Zn. Appl. Surf. Sci. 2010, 257, 887–898. [Google Scholar] [CrossRef]
  36. Bansal, V.; Collins, D.; Luxton, T.; Kumar, N.; Shah, S.; Walker, V.K.; Shah, V. Assessing the impact of copper and zinc oxide nanoparticles on soil: A field study. PLoS ONE 2012, 7, e42663. [Google Scholar] [CrossRef] [PubMed]
  37. Altomare, A.; Corriero, N.; Cuocci, C.; Falcicchio, A.; Moliterni, A.; Rizzi, R. QUALX2.0: A qualitative phase analysis software using the freely available database POW_COD. J. Appl. Crystallogr. 2015, 48, 598–603. [Google Scholar] [CrossRef]
  38. Demadis, K.D.; Famelis, N.; Cabeza, A.; Aranda, M.A.G.; Colodrero, R.M.P.; Infantes-Molina, A. 2D Corrugated magnesium carboxyphosphonate materials: Topotactic transformations and interlayer “decoration” with ammonia. Inorg. Chem. 2012, 51, 7889–7896. [Google Scholar] [CrossRef]
  39. Patil, B.; Prabhakar, B.; Kulkarni, V. Magnetic and spectral studies of copper (II) complexes with schiff bases derived from o-amino-benzoyl hydrazide. Curr. Sci. 1979, 48, 974–976. [Google Scholar]
  40. Dante, R.C.; Chamorro-Posada, P.; Vázquez-Cabo, J.; Rubiños-López, Ó.; Sánchez-Árevalo, F.M.; Huerta, L.; Martín-Ramos, P.; Lartundo-Rojas, L.; Ávila-Vega, C.F.; Rivera-Tapia, E.D.; et al. Nitrogen-carbon graphite-like semiconductor synthesized from uric acid. Carbon 2017, 121, 368–379. [Google Scholar] [CrossRef]
  41. Cioci, A.; Dante, D.G.; Martín-Ramos, P.; Chamorro-Posada, P.; Marabello, D.; Benzi, P.; Valsania, M.C.; Dante, R.C. CuTPP films grown on ceramic and ITO-coated glasses. Fuller. Nanotub. Carbon Nanostruct. 2023, 31, 856–867. [Google Scholar] [CrossRef]
  42. Bergman, D.J.; Imry, Y. Critical behavior of the complex dielectric constant near the percolation threshold of a heterogeneous material. Phys. Rev. Lett. 1977, 39, 1222–1225. [Google Scholar] [CrossRef]
  43. Song, Y.; Noh, T.W.; Lee, S.-I.; Gaines, J.R. Experimental study of the three-dimensional ac conductivity and dielectric constant of a conductor-insulator composite near the percolation threshold. Phys. Rev. B 1986, 33, 904–908. [Google Scholar] [CrossRef] [PubMed]
  44. Jagannadham, K. Volume fraction of graphene platelets in copper-graphene composites. Metall. Mater. Trans. A 2013, 44, 552–559. [Google Scholar] [CrossRef]
  45. Haynes, W.M. CRC Handbook of Chemistry and Physics, 97th ed.; CRC Press: Boca Raton, FL, USA, 2016; 2670p. [Google Scholar] [CrossRef]
  46. Perry, D.L. Handbook of Inorganic Compounds; CRC Press: Boca Raton, FL, USA, 2016; 581p. [Google Scholar] [CrossRef]
  47. Pan, C.; Gaur, A.P.S.; Lynn, M.; Olson, M.P.; Ouyang, G.; Cui, J. Enhanced electrical conductivity in graphene–copper multilayer composite. AIP Adv. 2022, 12, 015310. [Google Scholar] [CrossRef]
  48. Khattak, M.I.; Anab, M.; Muqarrab, N. A duo of graphene-copper based wideband planar plasmonic antenna analysis for lower region of terahertz (THz) communications. Prog. Electromagn. Res. C 2021, 111, 83–96. [Google Scholar] [CrossRef]
  49. Song, R.; Mao, B.; Wang, Z.; Hui, Y.; Zhang, N.; Fang, R.; Zhang, J.; Wu, Y.; Ge, Q.; Novoselov, K.S.; et al. Comparison of copper and graphene-assembled films in 5G wireless communication and THz electromagnetic-interference shielding. Proc. Natl. Acad. Sci. USA 2023, 120, e2209807120. [Google Scholar] [CrossRef]
Figure 1. Thermolysis product of the glycine +10% copper acetate initial mixture, equivalent to 3.17% Cu, heated at 500 °C: (a) Gly-Cu 3.17% 500 °C sample inside the crucible, seen from above; (b) detail of Gly-Cu 3.17% 500 °C sample after unmolding.
Carbon 10 00049 g001
Figure 2. (a) TEM and (b) STEM images of the copper-doped glycine thermolysate (Gly-Cu 3.17% 500 °C sample).
Carbon 10 00049 g002
Figure 3. FESEM micrographs of (a) pristine glycine and (bd) Cu-doped glycine thermolysates obtained at 500 °C (Gly 500 °C and Gly-Cu 3.17% 500 °C, respectively).
Carbon 10 00049 g003
Figure 4. Chemical structures of glycine thermolysis products.
Carbon 10 00049 g004
Figure 5. EDS spectrum and elemental mapping (inset) of the Cu-doped glycine thermolysate obtained at 500 °C (Gly-Cu 3.17% 500 °C sample).
Carbon 10 00049 g005
Figure 6. XPS spectra of the pristine glycine and Cu-doped glycine thermolisates obtained at 500 °C (Gly 500 °C and Gly-Cu 3.17% 500 °C samples, respectively): (a) survey spectra; (b) C1s spectra; (c) N1s spectra; (d) O1s spectra; (e) Cu2p spectra.
Carbon 10 00049 g006
Figure 7. Fittings of the XPS spectra of the Gly-Cu 3.17% 500 °C sample: (a) C1s spectra; (b) N1s spectra; (c) O1s spectra; (d) Cu2p spectra; (e) Cu LM2 spectra.
Carbon 10 00049 g007
Figure 8. X-ray powder diffraction pattern of the Gly-Cu 0.16% 500 °C sample thermolysate using QualX [37].
Carbon 10 00049 g008
Figure 9. X-ray powder diffraction pattern of the Gly-Cu 3.17% 500 °C sample using QualX [37].
Carbon 10 00049 g009
Figure 10. Infrared spectra of Cu-doped glycine thermolysis products obtained at 450, 500, and 550 °C; for comparison, pristine glycine treated at 500 °C is also shown.
Carbon 10 00049 g010
Figure 11. Raman spectra of Cu-doped glycine thermolysis products obtained at three temperatures.
Carbon 10 00049 g011
Figure 12. The UV-Vis spectra of the Cu-doped glycine thermolysates obtained at 450, 500, and 550 °C. For comparison purposes, the pristine glycine thermolysate spectrum after heating at 500 °C is also shown.
Carbon 10 00049 g012
Figure 13. Log-log plot of the AC conductance values (points) measured for the material obtained from the thermal treatment of pristine glycine and Cu-doped glycine at 500 °C. Straight lines display the linear least squares fit of the measured data.
Carbon 10 00049 g013
Figure 14. THz measurements on the Gly 500 °C and Gly-Cu 3.17% 500 °C samples dispersed in PE.
Carbon 10 00049 g014
Figure 15. Ground state geometries of the tetra-coordinated Cu(II) complexes with (a) cis and (b) trans ligands obtained with the PM6 Hamiltonian.
Carbon 10 00049 g015
Figure 16. Calculated absorption spectra for the Cu (II) complexes with cis and trans ligand isomers.
Carbon 10 00049 g016
Table 1. Sensitivity factors used to calculate elemental atomic percentages in XPS measurements.
Element/Transition Core LinesSCOFIELD SF
C1s1
O1s2.930
N1s1.8
Cu2p316.730
Table 2. Pyrolysis yields for pristine glycine and copper (II) acetate-doped glycine at different temperatures in static air conditions.
Temperature (°C)GlycineGlycine +
0.5% Copper (II) Acetate
Glycine +
10% Copper (II) Acetate
45034.2%38.1%38.8%
50029.2%30.7%33.8%
5504.8%5.3%7.1%
Table 3. Multielemental composition of the pristine glycine and Cu-doped glycine thermolysates obtained at 500 °C.
Element (wt%)Glycine Thermolysate
(Gly 500 °C)
Cu-doped Glycine Thermolysate
(Gly-Cu 3.17% 500 °C)
Site 1Site 2Site 3Site 1Site 2Site 3
C61.162.169.763.058.458.3
N29.627.725.522.023.226.5
O7.58.34.67.59.18.7
Cu---7.38.83.5
Suggested formulaC12HxN5O
(64.3%C, 27.6%N, 6.8%O)
C50CuHxN17O5
(59.9%C, 23.9%N, 8.4%O, 6.5%Cu)
Table 4. Elemental composition, expressed in at%, along with C/N and C/O ratios, of the pristine glycine and Cu-doped glycine thermolisates obtained at 500 °C.
SampleCNOCuSiClC/NC/O
Gly 500 °C68.9724.026.32-0.540.152.910.9
Gly-Cu 3.17% 500 °C68.7017.4610.392.441.02-3.96.6
Table 5. C1s binding energy (eV)/relative% for the pristine glycine and Cu-doped glycine thermolisates obtained at 500 °C.
SampleC1s A
C–C, CHx
(284.8 eV)
C1s B
C-NH3+, C–O–C, C–O–H
(285.6–286.5 eV)
C1s
COO
(288–289 eV)
Gly 500 °C284.8/45.54%286.13/37.47%288/9.37%
Gly-Cu 3.17% 500 °C284.8/59.09%286.1/30.21%288/10.7%
Table 6. N1s binding energy (eV)/relative% for the pristine glycine and Cu-doped glycine thermolisates obtained at 500 °C.
SampleN1s A
–NH2
N1s B
amine –NH– (400.0 eV),
–N–(C=O) (400.50 eV)
N1s C
doped imine –NH+– (402.00 eV)
nitrite (NO2) (403.9 eV)
Gly 500 °C398.53/49.09%400.17/46.26%402/4.65%
Gly-Cu 3.17% 500 °C398.64/51.3%400.2/46.94%403.8/1.76%
Table 7. Cu2p3/2 binding energy (eV)/relative% and CuLMM kinetic energy (in eV) for the Cu-doped glycine thermolisate obtained at 500 °C.
Cu2p3/2 ACu2p3/2 BSatellite ISatellite IICu LMM2 ACu LMM2 BCu LMM2 CCu LMM2 D
932.71/62.37%934.28/27.5%941.45/4.19%943.8/5.94%921.12917.75915.09910.88
Table 8. Cu LMM (Auger peak) analysis for the Cu-doped glycine thermolisate obtained at 500 °C.
Cu2p3/2 (I)Cu2p3/2 (II)Cu L2–3M45M45
Average Peak Position Peaks 2–3
Auger
Parameter (I)
Auger
Parameter (II)
From high-resolution
spectrum
932.71934.28916.421849.13
Cu2O Cu1+
1850.7
Cu(OH)2 Cu2+
From survey932.9 916.421849.34
Cu2O Cu1+
Table 9. Main infrared bands and assignments of pristine glycine and Cu-doped glycine thermolysates.
Gly
450 °C
Gly
500 °C
Gly
550 °C
Gly–Cu 0.16%
500 °C
Gly–Cu 3.17%
500 °C
Assignment
3074308630723044-C–H stretching; amide B mode; O–H stretching
---28802659CH2 stretching
2223-2161--CH3 asymmetrical stretch; C=C stretch; C=O stretching
1583----graphene/graphite; amide II stretching
-(1564)-15631564asymmetrical stretching of C=O in Cu carboxylates
---15071493ν (C=C); asymmetrical flexion of the C–H bond in CH3
12061212121612041216N–H stretching; asymmetrical vibration COO
---11591155CN stretching
----1081C–O bond stretching
----1008Cu–N stretching mode
711712715--C–H bending vibration
- --479Cu–N stretching vibration
Disclaimer/Publisher’s Note: The statements, opinions and data contained in all publications are solely those of the individual author(s) and contributor(s) and not of MDPI and/or the editor(s). MDPI and/or the editor(s) disclaim responsibility for any injury to people or property resulting from any ideas, methods, instructions or products referred to in the content.

