Article

Stimulating Mesoporous Characteristics of Activated Carbon through Pyrolysis of Compacted Hydroxyethyl Cellulose—A Showcase for H2S Removal

Department of Chemical & Biomolecular Engineering, National University of Singapore, 4 Engineering Drive 4, Singapore 117585, Singapore
*
Author to whom correspondence should be addressed.
Submission received: 24 March 2024 / Revised: 24 April 2024 / Accepted: 30 April 2024 / Published: 6 May 2024
(This article belongs to the Section Carbon Materials and Carbon Allotropes)

Abstract

:
Activated carbon (AC) serves as extensively researched adsorbents, with numerous established methods for their preparation. This study originated from the hypothesis that compressing a hydrocarbon substance to create a densely compacted pellet, known as pelletizing, would enhance the development of porous features of the resulting AC. The anticipated enhancement is attributed to the rise in spatial proximity amidst HEC polymer chains within the bulk of the pellet, which facilitates aromatization both in extent and functionality. 2-Hydroxyethyl cellulose (HEC) pellets were prepared by adjusting the duration of load holding, aiming to increase the packing density of HEC polymer chains via creeping. The BET analysis of the resulting AC samples demonstrates the efficacy of compression on HEC pellets in enhancing their porous properties. The FE-SEM study revealed diverse AC surface morphologies that are associated with a set of specific pelletizing conditions. The 13C NMR spectroscopy for carbon skeletons, FT-IR spectroscopy for organic functionality, and XPS spectroscopy for surface composition collectively report the leverage of compression treatment before pyrolyzing HEC pellets. Furthermore, the assessment of hydrogen sulfide adsorption by the resulting AC samples revealed distinctive breakthrough curves, providing validation for the proposed compression effect.

Graphical Abstract

1. Introduction

Activated carbon (AC) is a crucial industrial absorbent prevalently employed in water and gas purifications [1,2]. It also serves as a versatile support for various catalysts in both heterogeneous and electrolytical systems [3,4]. AC stands out as an indispensable material owing to its high surface area and adsorption capacities, while also being cost-effective in terms of production and molding. Recent advancements in the application of AC have been observed in diverse areas, including the removal of bio-molecules [5,6,7] from various liquid streams, the fabrication of supercapacitor electrodes [8,9], and its effectiveness as a storage medium for natural gas [10,11,12]. The performance features outlined above originate from the porous properties, encompassing surface area, pore-size distribution, specific pore volume, and pendant organic functional groups. Each of these performance features places varied emphasis on the assembly of the porous properties. The development of porous characteristics in carbon is influenced by several factors, including: (i) the parent feedstock; (ii) pyrolysis strategy; (iii) carbonization atmosphere; (iv) carbonization temperature; (v) activation temperature, purging gas, and duration; (vi) activating gas flow rate; and (vii) experimental equipment employed [13,14]. While the synthesis of porous carbons for a particular application invariably involves the optimization of the aforementioned factors, innovative approaches such as surface modifications [15,16,17] and nano-casting [18] have the potential to yield enhanced outcomes surpassing the limits of conventional optimization.
The aforementioned sophistic approaches entail intricate synthesis methods, environmentally demanding materials, and processing protocols, posing challenges in terms of scaling up the associated techniques. Consequently, exploring mechanical approaches capable of inducing chemical changes [19] to tailor ACs from abundant biomass or recycled materials emerges as a more appealing alternative. Among the various mechanical treatments, applying compressive stress (CS) serves as a means to enhance the bulk density and mechanical stability of a carbon monolith, e.g., a pellet, sphere, or cube, albeit at the cost of reduced porosity [20]. This methodology reported that the structural response of a porous solid to CS is contingent upon its intrinsic properties. Consequently, it is viable to apply CS specifically to a chosen polymer precursor, aiming to boost the porous features of an AC, followed by molding to attain the desired AC monolith. In principle, when a thermoplastic polymer is subjected to pelletizing by compression, its visco-plastic properties prevail. This involves the rheological flow, wherein polymer chains experience a series of intricate segment movements towards compacted microstructures through the removal of free volume among polymer chains. The flexibility of the main chain and the type of side-chain groups play a crucial role in influencing the compression creep/relaxation and creep recovery behaviors [21,22]. When the applied stress (load) reaches the maximum designed level, the polymer chains undergo continued sliding during the load-holding duration, a phenomenon known as compressive creeping or relaxation [23]. Consequently, the viscoelastic response within the polymer pellet becomes instrumental in determining the extent of the creep recovery upon removal of the load [24]. The compression and duration of the load applied to the pellet are intended to enhance not only the cohesive associations among polymer chains, leading to permanent deformation, but also to induce defects accompanying creep recovery within the pellet. As proposed earlier, the resulting compacted amorphous polymer matrix serves as a unique starting point, producing a more porous AC framework compared to simply pyrolyzing pristine uncompressed HEC.
Being a cellulose derivative widely used in various industries as a water-binder and hydrophilic gelling agent, HEC stands out as a distinctive precursor for effective AC due to its 2-hydroxyethyl side chains [25]. Mechanically, the application of axial compression to a polymer powder bed in a cylindrical die set transforms the resulting tablet by influencing compaction properties, including bulk density and tap density [26]. This transformation occurs at the microscopic level, relying on factors such as particle plasticity, size, and cohesive forces among polymer chains and, therefore, proximity of the adjacent particles.
Unlike HEC powder, the resulting HEC pellets undergo unconstrained creep recovery upon pressure release. This mechanism, influenced by their different compression histories, results in diverse chain packing distributions in the bulk of the pellet, as well as its surface state. The enhanced cohesion among polymer chains accelerates the generation of thermal reaction intermediates with elevated C/H atomic ratios during pyrolysis. Consequently, the resulting intermediates are expected to foster the production of polyaromatic hydrocarbons (PAHs) as the primary product, manifesting either as grain agglomerations or a continuous continuum [27]. The resulting PAHs serve as template precursors, characterized by specific functionality, size, and spatial arrangement, facilitating the subsequent formation of a highly porous activated carbon during the calcination activation process. To comprehend the fundamental role of the template precursor, this study examined the oxygenated group contents and resonance of the PAHs using spectroscopic characterizations. This analysis suggests that the compression of HEC pellets affects the content of oxygenated groups in PAHs during pyrolysis at 400 °C, which in turn impacts the porous structure of AC during calcination activation at 700 °C.
To date, there is still a lack of awareness regarding how the compression of biomass, including cellulose and derivatives, influences the porous properties of the obtained AC products. An industrial application perspective for enhancing AC involves sweetening natural gas, primarily by scavenging trace H2S from natural gas [28], prior to the liquefaction process. Thus, the porous AC powders prepared in this study were assessed according to their adsorption capability in removing H2S from a gas stream, using nitrogen as the carry gas. The study revealed that the HEC amount and the load-holding duration on top of the applied load profoundly influence the porous properties of the AC, consequently affecting H2S adsorption performance.

2. Materials and Methods

2.1. Preparation of HEC Pellets

A 3.125 cm diameter pellet die set (d = 3.125 cm) was charged with a specified quantity of HEC powder (2.5 or 5 g, Sigma-Aldrich, St. Louis, MO, USA, Mw = 250,000 Da, sizes < 0.8 mm), and compressive stress was incrementally applied to the HEC powder using a manual hydraulic press (refer to Figure 1a). A maximum load of 8 metric tons, equivalent to 102.4 MPa of compressive stress, was used to mold an HEC pellet. The compression was maintained for a predetermined duration of either 15 or 60 min. Following the holding duration, the load on the pellet was gradually released, and the pellet was subsequently extracted from the die set.

2.2. Carbonization of the HEC Pellets

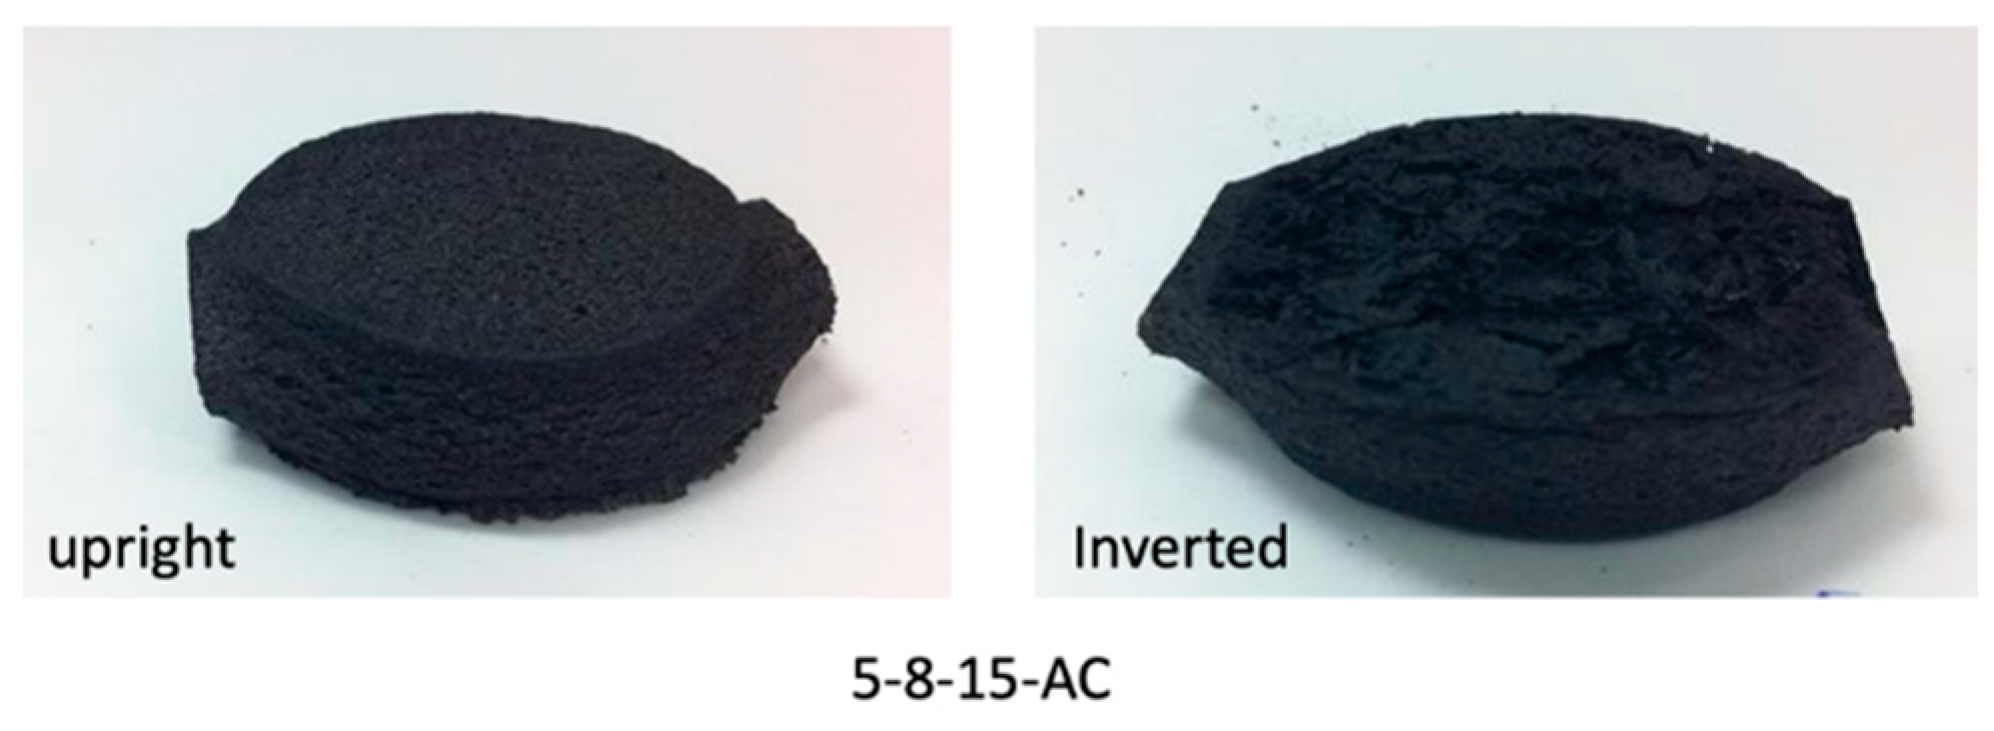
We followed the protocol laid out in [25] for the conversion of HEC pellets to AC through pyrolysis and carbonization steps. Briefly, the heat treatment was carried out in a tubular quartz reactor (diameter: 50 mm; length 1200 mm). Polymer pellets were placed on a ceramic plate at the center position of the reactor, and the reactor was sealed with stainless-steel clamps, O-rings, and securing screws (Figure 1b). The conversion process was initiated with pyrolysis at 400 °C for 1 h in an argon stream (99.9995%, Air Liquide) of 500 cm3/min. The outlet was configured to pass through a bubbler, ensuring a slightly elevated pressure above the atmospheric pressure. Subsequently, the carbonaceous pieces produced from pyrolysis underwent carbonization activation coupled with CO2-induced activation, conducted by calcination at 700 °C for 2 h in a CO2 purging stream (500 cm3/min, 99.8%, Air Liquide). The reactor was then allowed to naturally cool down to room temperature. For both pyrolysis and activation processes, the designed ramp rate was 5 °C/min. The resulting AC pellets (Figure 2), retaining approximately 40% of the weight of the HEC pellets, were crushed into fine powders, respectively, using a mortar and pestle. The AC powder was washed with distilled water and filtrated through several rounds until the filtrate became colorless and was then dried in an oven.
The samples were labeled in the format of 5-2-15-suffix, using hyphen as separators. The first digit denotes the mass, in grams, of HEC loaded into the die set; the second digit represents the predetermined force in metric tons (1 mt corresponds to 12.8 MPa in the present die set) applied to the HEC powder; and the third digit represents the holding duration in minutes after reaching the predetermined force. A suffix “P” refers to HEC pellets without conversion to carbon, a suffix “AC” designates the activated carbon formed, and a suffix “C” designates the carbonaceous substances formed after pyrolysis at 400 °C. In this study, the term “carbonaceous substances” is used to describe the carbon material produced only from pyrolysis at 400 °C.

2.3. Characterizations

2.3.1. Measurement of Surface Area and Pore Size by N2 Adsorption Analysis

The porous characteristics of the prepared AC samples, including surface area and pore size, were analyzed using an adsorption analyzer (Quantachrome Autosorb-1 Series, Boynton Beach, FL, USA). The samples underwent initial degassing in a vacuum at 300 °C for 3 h. Nitrogen gas acted as the adsorbate for measuring the adsorption at 77 K, with liquid nitrogen used as a coolant. The specific surface area of the AC, SBET, was determined using the Brunauer–Emmett–Teller (BET) model at relative pressures (P/P0) ranging from 0.05 to 0.30. The total pore volume (Vtotal) was determined using the Barret–Joyner–Halenda (BJH) model with reference to the relative pressure P/P0 at 0.99. Additionally, the micropore volume (Vmicro) was determined using the Dubinin–Redushkevich (DR) method. In this study, the mesopore volume (Vmeso) was estimated by taking the difference between Vtotal and Vmicro. The non-linear density functional theory (NLDFT) was employed to determine the pore size distribution of the AC samples.

2.3.2. Surface Morphology Recorded by FE-SEM

The structural morphologies of the carbonaceous substances (C) and AC were examined using a field-emission scanning electron microscope (FESEM, JEOK, JSM-6700F, Tokyo, Japan). The carbon samples were coated with platinum for a duration of 90 s at a current of 30 mA before each analysis.

2.3.3. Analysis of the Pendant Functional Groups on Carbonaceous Substances

The surface functionalities of the carbon samples were determined by X-ray photoelectron spectroscopy (XPS) using the Kratos Axis His System (Manchester, UK). The binding energy of C 1s of 284.6 eV was used as the reference for other functionalities in the peak fitting process. Peak fitting was accomplished using a Gaussian model with a Shirely baseline [25,29]. The solid-state cross-polarization/magic angle spinning (CP/MAS) 13C spectra of the prepared samples were obtained with the Bruker Avance 400 (DRX400) instrument (Billerica, MA, USA). Additionally, Fourier transform infrared spectroscopy (FTIR-8400, Shimadzu, Tokyo, Japan) was employed for characterization. Prior to conducting each analysis, a specific minute quantity of the carbon sample was thoroughly ground alongside a corresponding control amount of KBr powder. The resulting powder mixture had identical weight percentages of carbon and was compressed for 30 s at 6 metric tons to create an analysis pellet.

2.3.4. Determination of Surface Basicity

An AC sample (0.1 g) was dispersed in 80 mL distilled water. The dispersion was left overnight to promote acid–base equilibrium, with the conjugated π-system abstracting hydrogen ions from water—a phenomenon known as the π-effect in chemistry. The pH of the water was measured at ambient temperature using a Fisher Accumet Basic AB15 pH Meter (Waltham, MA, USA) and the obtained reading was used to characterize the surface basicity of the AC sample under investigation.

2.3.5. Evaluation of the Adsorption Capacities

The adsorption capability of the investigated AC for H2S was evaluated at an ambient temperature (~25 °C) using a quartz tubular fixed-bed reactor with a diameter of 10 mm and a length of 200 mm. In each experimental run, 0.13 g of the prepared AC was gently packed by tapping with a metal rod. The AC powder column was secured at both ends with two bundles of quartz glass wool at the center of the quartz tube. The bed length ranged from 7.5 to 8.5 mm.
A nitrogen stream containing H2S with a concentration of 1000 ppm was directed through the AC packed bed column at a flow rate of 1000 cm3 per hour. The H2S concentration in the outlet stream from the reactor was continuously monitored throughout the entire process using an electro-chemical sensor manufactured by MOT500-H2S, Keernuo Electronics Technology (Shen Zhen, China). The flow was maintained until the AC packed bed reached full saturation, indicating the loss of its adsorption capability. During the testing process, the breakthrough concentration of H2S in the packed bed was defined at 10 ppm. Specifically, the breakthrough time was recorded when 1% of the H2S, relative to the initial concentration in the feed, was detected in the outlet stream. This duration covers the gradual increase in H2S concentration in the outlet stream to 10 ppm. Subsequently, the breakthrough capacity of the AC to remove H2S was calculated using the following equation [30]:
m g   H 2 S g   C a r b o n = Q m l m i n ·   t   ( m i n )   ·   C H 2 S ( p p m )   ·   M H 2 S ( g m o l ) 22.4 ( l m o l ) ·   m c a r b o n g ·   10 6
where Q is the flow rate of the feed gas, t is the breakthrough time, C H 2 S is the inlet concentration of H2S, M H 2 S is the molecular weight of H2S, and m c a r b o n is the mass of the AC packed bed.

3. Results and Discussion

3.1. Impact of HEC Pellet Compression on the Evolution of Carbonaceous Intermediates as Templates for Constructing Porous AC Media

It has been noted that subjecting HEC powder to cold compression results in a tablet with a smooth surface [31]. This surface characteristic signifies superior compaction properties in comparison to tablets produced by compressing cellulose. The distinction can be attributed to the 2-hydroxyethyl side chains present in HEC, which contribute to improved compressibility and plasticity of the HEC powder. Furthermore, the constraint of viscoelastic recovery upon load removal of the load, known as demolding [32], reflects the impact of the HE sidechains (Figure 1a) on retaining the compaction state. It is hypothesized that the HE sidechains function as tightening arms among the cellulose backbones through hydrogen bonding, mitigating viscoelastic recovery during and after demolding. This physical interaction is deemed to enhance the thermal stability of HEC, and therefore a different pyrolysis mechanism. Such an inference draws parallels with an observation of the thermal degradation of chitosan, where thermal stability diminishes with a higher deacetylation degree [33], corresponding to the removal of N-acetyl side chain groups.
In a recent study [34] presenting the thermogravimetric analysis (TGA) diagram of HEC, the weight losses at 400 °C and 700 °C in an Ar gas flow were approximately 45% and 58%, respectively. As outlined in Section 2.2, the two-step conversion of HEC to AC in this study adhered to the conditions specified in this report. Consequently, the resulting AC samples demonstrated a comparable mass retention rate of approximately 40%, even though the carbonization step was conducted in CO2, a weak oxidizing environment. The role of CO2, employed as the calcinating atmosphere, was attributed to its facilitation of decarboxylation, as supported by the infrared spectroscopic and nanofiltration evidence [35]. This assistance occurs through dispersion forces, notably the π−π interaction of CO2 with conjugated (sp2) carbon rings [36], which aids in weakening the C-C bonds between the conjugated rings and carboxylic acid or other functional groups. Concerning the decarboxylation reaction, RC(O)OH → R· + H· + CO2, where R represents turbostratic carbon species, rapid coupling, and chain transfer of R· species generated throughout the calcination activation course ensues, resulting in a random blend of a minor amorphous phase and graphitic crystallites containing a high density of nanopore channels. The former primarily comprises graphene species with defects resulting from the presence of random and scattered sp3 carbons in the PAHs backbone.
As outlined in Section 2.2, the compression conditions (or variables) for preparing HEC pellets are presented in the following format: HEC powder (g)—metric ton (mt)—load holding duration (min)—P (pellet), as detailed in Table 1. The third column of the table shows that ∆x represents the relative reduction in pellet thickness, where a larger value indicates greater plastic deformation due to creep relaxation. Consistently, it can be observed that the load and load-holding duration impose, respectively, a positive effect on the creep relaxation. This conclusion is drawn by examining one of the three processing variables while holding the other two constant, as previously mentioned. For example, 5-8-60-P exhibits a stronger creep relaxation compared to 5-2-60-P. Furthermore, the ∆x/xref % rate (the 4th column) provides a more accurate depiction of the relaxation rate relative to their respective references. For instance, despite both 5-8-60-P and 2.5-8-60-P having identical tap densities, the former exhibits a higher percentage, indicative of its stronger creep relaxation extent compared to the latter. Lastly, the tap density reflects the combined effect of compression creep/relaxation and the subsequent demolding-induced creep-recovery processes. On the microscopic level, elevated pellet tap-density stems from concentrated packing and entanglement sites within HEC chains; meanwhile, the process of creep recovery, as chains and segments distance themselves, tends to create voids and defects, thus revealing a lower ∆x/xref % rate. It is established that prolonging the load-holding duration results in increased plastic deformation [37], aligning with the trends reflected in the ∆x/xref % rates. Moreover, 5 g pellets attain greater ∆x/xref % rates than their 2.5 g counterparts, a conclusion consistent with the observed variation in ∆x. Consequently, the aggregated HEC chains foster the production of carbon-rich organic species during pyrolysis at 400 °C, known as PAHs, while the spaces between HEC chains lead to pores within the resulting carbonaceous substance. In essence, the formed PAHs record the structural characteristics of the HEC pellets.
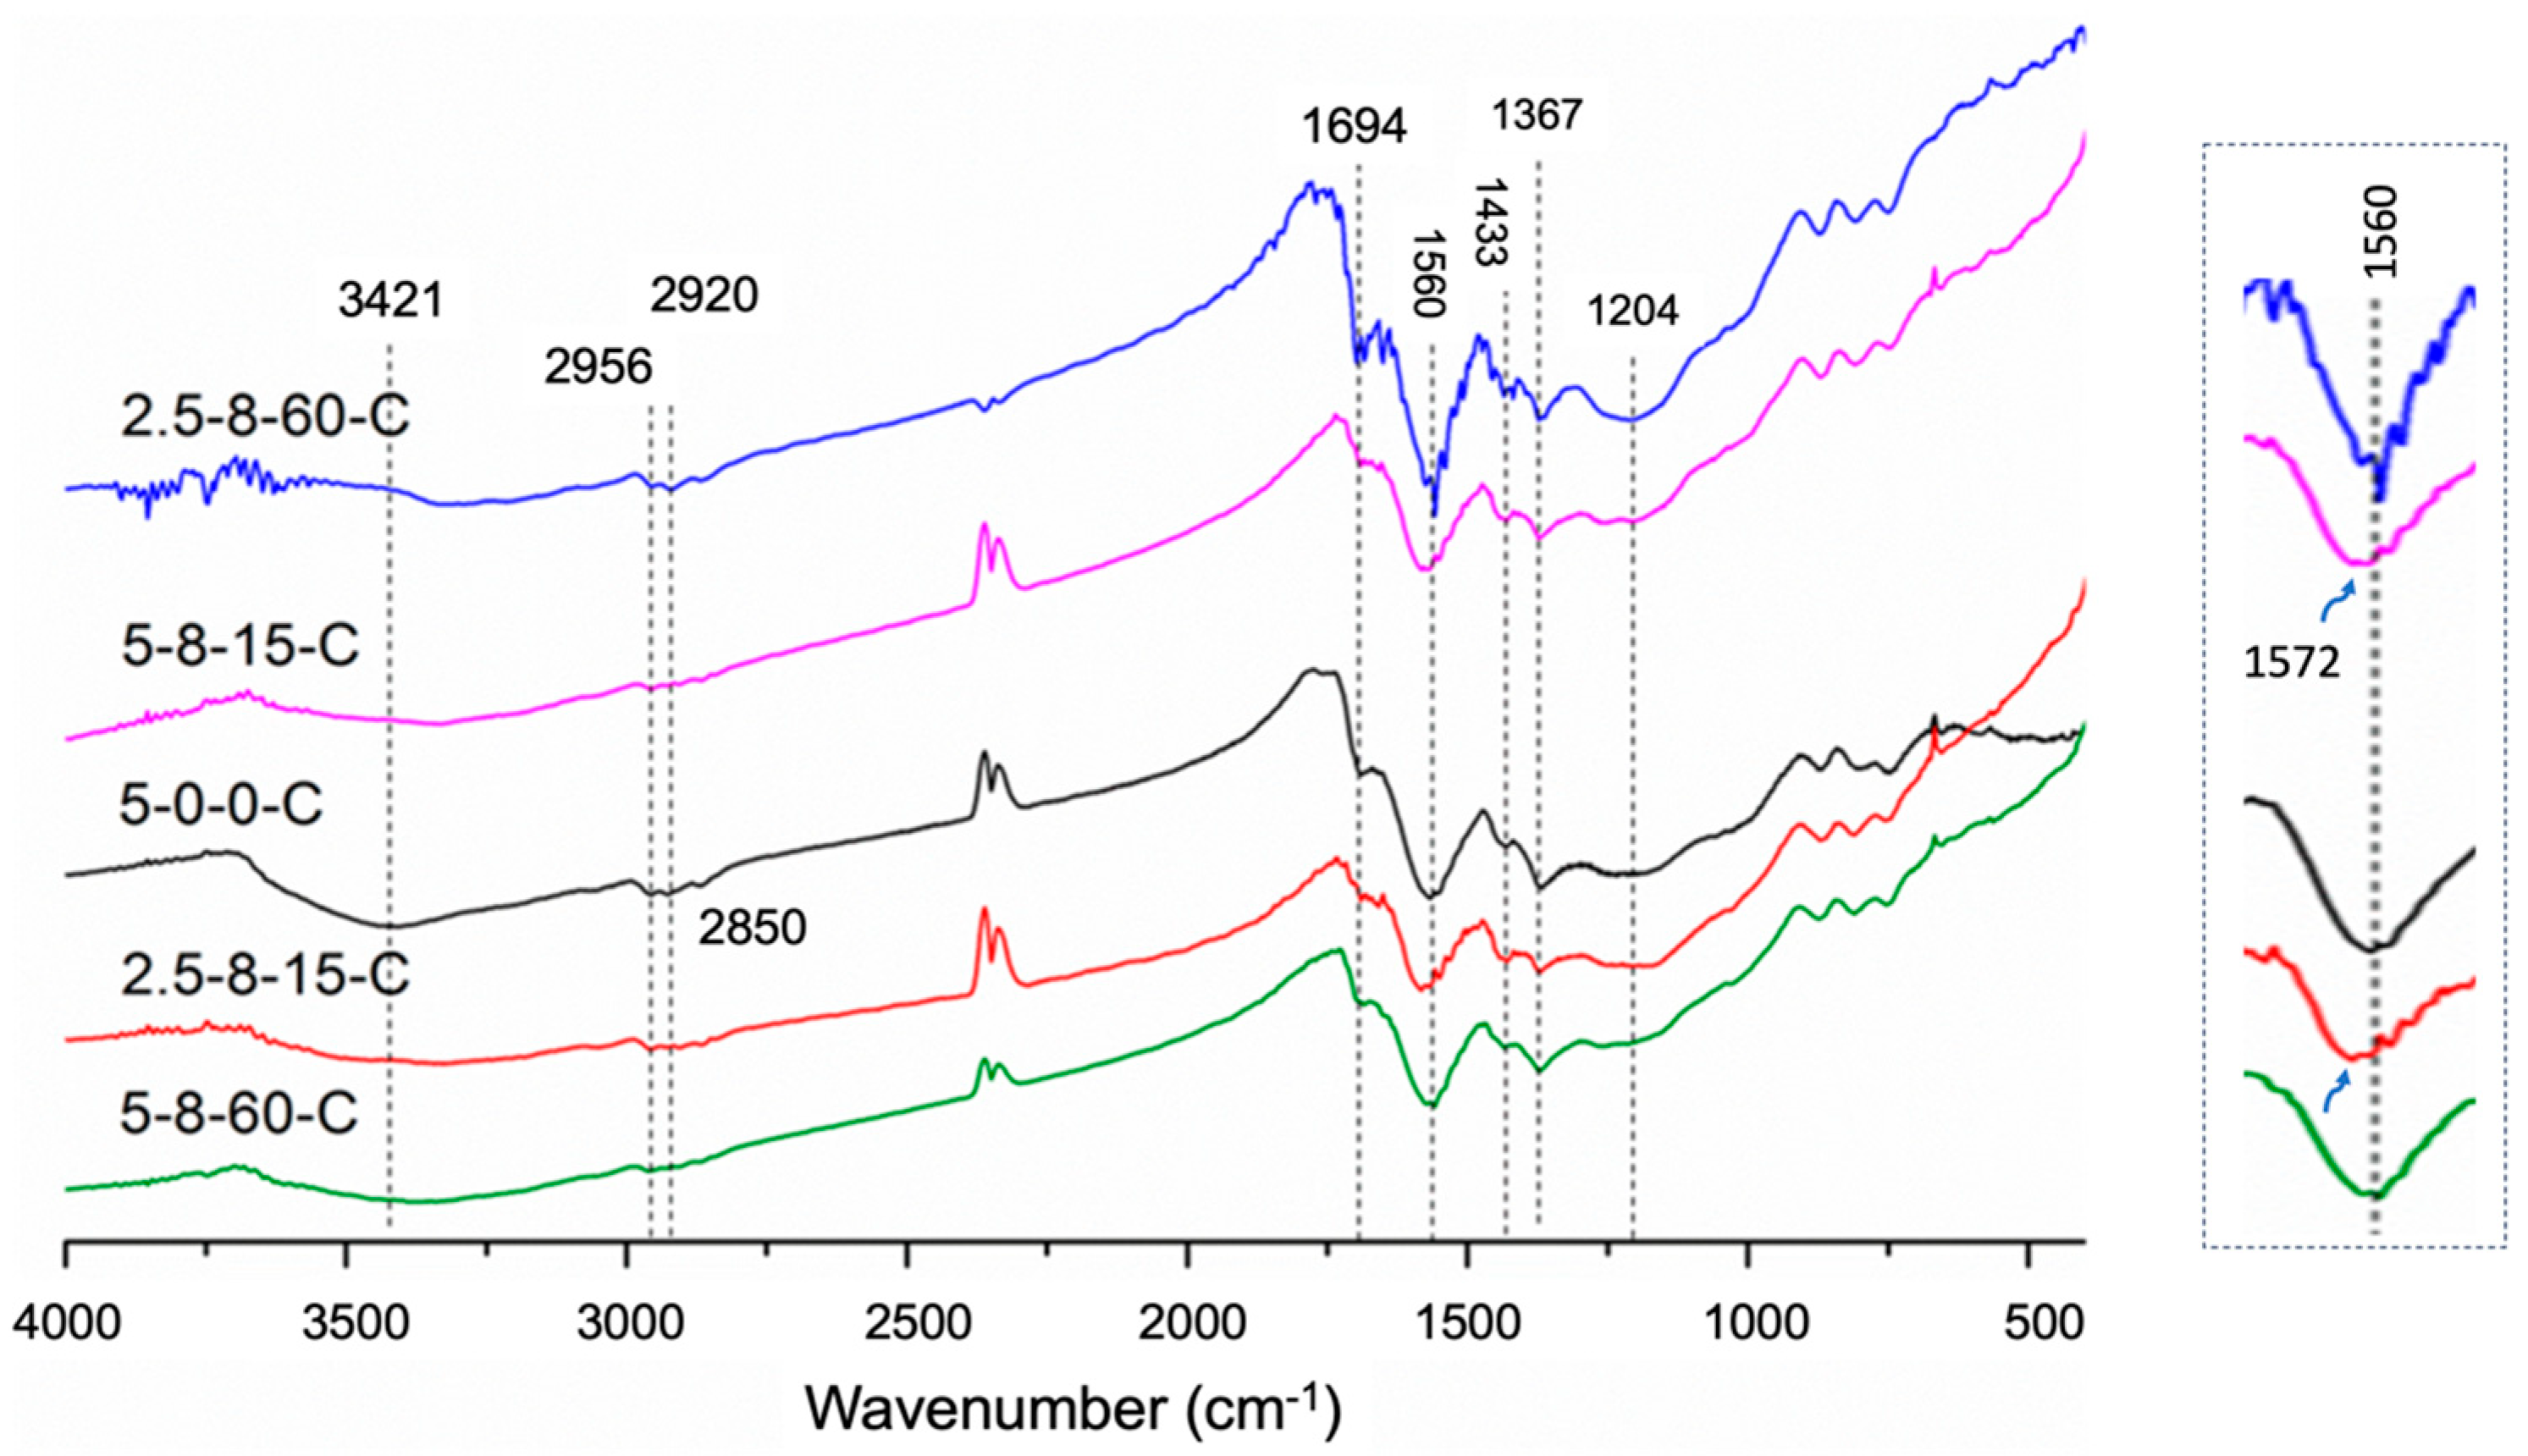
The pyrolysis includes the elimination of oxygen-containing groups and aromatic condensation [27]. The main products are primarily PAHs. The initial characterization was carried out through infrared spectroscopic scrutiny (Figure 3). Five carbonaceous substances were compared, with specimen 5-0-0-C serving as the control reference (black curve), and the other four samples had the same load (8 mt). Statistically, on an equivalent carbon content (in KBr-pellet) basis, a larger IR absorption band area indicates a higher number of the interested bonds, such as saturated carbon–hydrogen stretch [38]. The control displays prominent IR absorption bands of the following groups: the O-H stretching mode at 3421 cm−1, the aliphatic C-H stretching modes at 2956 cm−1 and 2850 cm−1, the aliphatic C-H bending modes at 1433 cm−1 and 1367 cm−1, and the carboxylic C=O stretching mode at 1694 cm−1, within the analyzed samples. Furthermore, the C=C stretch of the aromatic ring carbon skeleton at around 1560 cm−1 provides insights into the structure of PAHs species. It is slightly stronger in spectrum 5-0-0-C compared to its counterparts in the spectra of both 5-8-15-C and 5-8-60-C. In summary, the control, 5-0-0-C, shows a somewhat higher presence of saturated carbon species, evidenced by its relatively more pronounced C-C bond stretching hump at 1204 cm−1, besides the aliphatic C-H stretching and bending modes.
Furthermore, variations in the load-holding duration and the amount of HEC for compression affect the infrared spectroscopic behaviors of the PAHs formed. When 5 g HEC was used, extending the compression duration from 15 min (pink curve) to 60 min (green curve) yielded a subtle impact on the carbon skeletons. Despite both spectra displaying minimal saturated carbon species and similar peak shapes (in terms of area and intensity) for the PAH C=C stretch around 1560 cm−1, the wavenumber corresponding to the peak absorption of 5-8-15-C shifted slightly towards the higher-frequency side by approximately 12 cm−1 compared to both 5-8-60-C and 5-0-0-C. This implies that the 15-min load holding duration led to a certain percentage of PAHs with a lower degree of conjugation, i.e., relatively smaller PAH rings or the disruption of resonance caused by the insertion of sp3 carbons in the aromatic rings. This assertion is supported by the relationship wherein an increase in the degree of π-conjugation leads to a reduction in π-bonding energy.
On the contrary, 2.5-8-15-C and 2.5-8-60-C represent the samples compressing half the amount of HEC. The latter spectrum exhibits a more pronounced PAH C=C stretching band and consistently shows the maximum absorption occurring at a lower wavenumber compared to the former, by approximately 15 cm−1 (see inset of Figure 3). Furthermore, 2.5-8-60-C displays a slightly more pronounced sp3 C-C stretching hump at 1204 cm−1 compared to the spectrum of 2.5-8-15-C. As the precursor to AC, the carbonaceous substance is composed of dominant PAHs with a minimal presence of saturated amorphous carbon species. It is presumed that the saturated branches serve as connecting corners, aiding in the amalgamation of PAHs for the growth of graphite crystallites during the calcination activation step. Regarding the peak areas of C=C and C-C at 1560 and 1204 cm−1, respectively, they follow the order: 2.5-8-60-C > 5-0-0-C > 5-8-60-C ≈ 5-8-15-C > 2.5-8-15. This order approximately indicates the abundances of unsubstituted carbon species in the five carbonaceous samples, although it does not completely match the carbon contents (Table 2) obtained from the deconvolution.
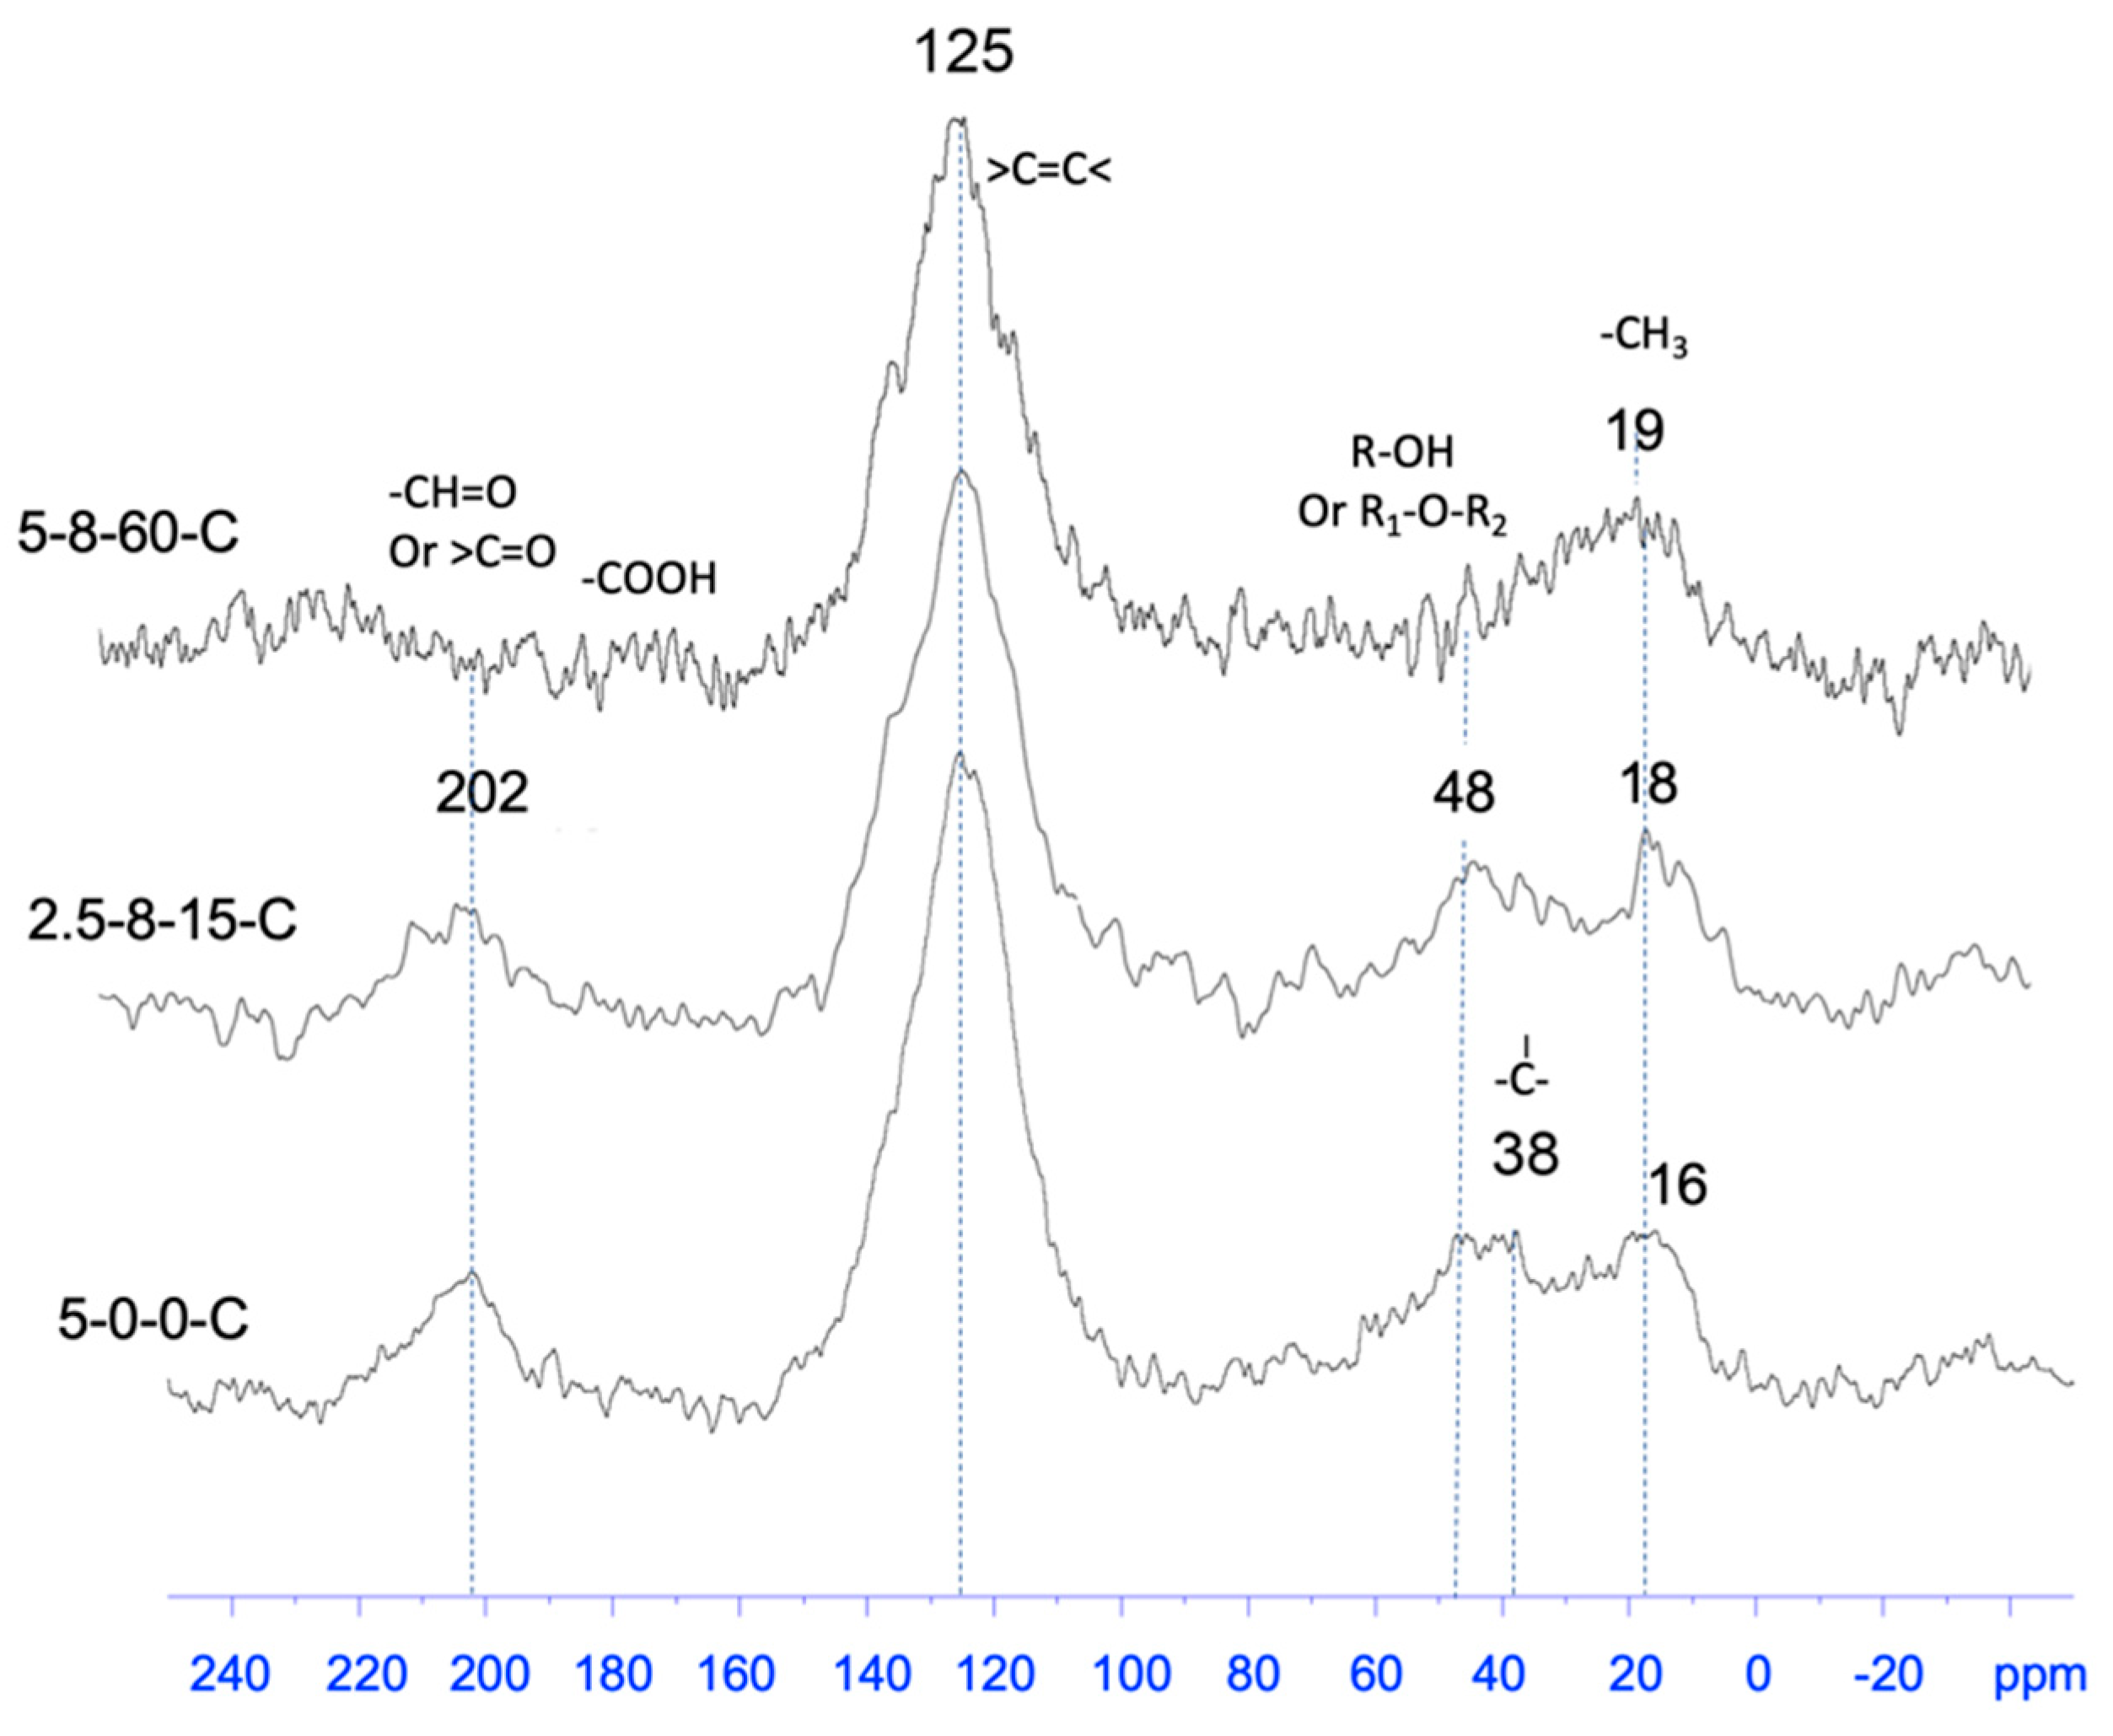
Beyond the analysis conducted with IR spectroscopy, the XPS spectra of the carbonaceous substances provide a quantitative assessment of carbon-linked functional groups by examining the binding energy within the C 1s spectrum. Across all spectra, a deconvolution of the C 1s peak was undertaken, resulting in five distinct peaks representing the following carbon species: C-C/C=C (284.6 eV,), C-O (285.7 eV), C=O (287.3 eV), COO (289.0 eV), and the plasmon (290.8 eV) peaks [25,29]. In Figure 4, the spectrum 5-0-0-C represents the remaining spectra with approximately similar characteristics. The spectrum of 2.5-8-15-C is somewhat distinct, featuring a broader C 1s peak compared to the others. The deconvoluted C1s peaks of 5-0-0-C and 2.5-8-15-C are selected as representatives in Figure 4. Utilizing curve-fitting treatment, the quantification, in terms of atomic %, of the four identified carbon species as listed above was carried out (Table 2). The control, 5-0-0-P, consists of individual HEC particles and therefore is expected to undergo pyrolysis reactions faster than the pellets. This results in a higher carbon content, primarily consisting of C-C and C=C species, compared to oxygenated species, as evidenced by their atomic percentage values. Additionally, the 13C-NMR spectrum of 5-0-0-C (Figure 5) illustrates the aforementioned carbon species, with PAHs being predominant as well as the presence of noticeable amorphous sp3 carbons. Both IR and NMR testing of 5-0-0-C provide evidence supporting the validation of the XPS elemental analysis of the other carbonaceous samples.
The AC samples were produced through the calcination activation of the carbonaceous substances at 700 °C in a CO2 atmosphere. This process led to the transformation of PAHs and the accompanying saturated moiety into graphite crystallites via the growth of graphene and π-stacking to form graphite crystallites with diverse sizes and defects. The discrete and associated crystallites contained interstices, along with various defects within the crystallite grains. These features collectively contributed to the overall pore volume [39]. The CO2 atmosphere played a dual role as an oxidant, facilitating the etching of the amorphous carbon component via the gasification reaction, CO2 + C → 2CO, and promoting decarboxylation, as mentioned earlier. Table 3 provides an overview of the porous characteristics of the examined AC samples. These porous characteristics were determined by the N2-physisorption approach, including BET surface areas and the total volumes of specific pores, which will be elaborated upon later. Table 3 reveals three discernible trends that illustrate the influence of compression history on the porous characteristics (SBET and Vtotal) of the investigated AC samples.
  • The effect of applied load: 5-0-0-AC < 5-2-15-AC < 5-8-15-AC or 2.5-0-0-AC < 2.5-2-15-AC < 2.5-8-15-AC.
  • The impact of the load holding duration: 5-2-15-AC < 5-2-60-AC and 5-8-15-AC < 5-8-60-AC. Conversely, this trend is reversed with the use of half the amount of HEC to form pellets, as demonstrated by the comparisons: 2.5-8-15-AC > 2.5-8-60-AC, respectively. This reversal is attributed to a significant creep-recovery extent in 2.5-8-15-P, which will be discussed in detail later.
  • The impact of HEC mass under the same pressure and the load-holding duration: 5-2-15-AC < 2.5-2-15-AC, 5-8-15-AC < 2.5-8-15-AC, and 5-8-60-AC < 2.5-8-60-AC. This trend can be related to the relative creep-relaxation rate (∆x/xref %) of their corresponding HEC pellets (Table 1). A lower rate, as explained earlier, suggests a greater extent of creep recovery, thus favoring formation of a larger BET surface area.
Table 3. The porous features of the AC samples and the specifics of their carbonaceous substances.
AC SampleSBET/m2/gSpecific Pore Vtotal/cc·g−1Oxygrp to C Ratio *
2.5-0-0-AC9500.490.31
2.5-2-15-AC15801.070.56
2.5-8-15-AC20801.430.64
2.5-8-60-AC17901.300.58
5-0-0-AC8200.350.31
5-2-15-AC11700.590.85
5-8-15-AC13700.860.52
5-8-60-AC17101.170.56
* Oxygrp denotes the three oxygenated groups, while C represents C-C and C=C, present in the carbonaceous substances rather than in AC, as highlighted in Table 2.
Given these trends, it is intriguing to explore the correlation between the XPS data (Table 2) and the porous characteristics (Table 3) to understand how the composition of carbonaceous substances influences the development of porous characteristics in the activated carbon (AC). The atomic ratio of carbon species in the carbonaceous substances, explicitly those with substituted oxygenated groups versus unsubstituted ones, is found to be correlated with the formation of porous characteristics in AC. Specifically, when the numeric values of the ratio approach 0.64, the porous properties tend to be higher. This ratio signifies a specific set of carbonaceous compositions with values falling within the range of approximately 0.56 to 0.64, where phenolics and aromatic ethers (C-O) prevail among the oxygenated groups. Achieving these compositions is crucial for the effective construction of porous AC structures during the calcination activation of carbonaceous substances. This numerical range fundamentally signifies the influence of oxygenated groups on the amalgamation of PAHs through free radical condensation. Essentially, the oxygenated groups exert the inductive effect to facilitate generation of free radical on PAH rings via dehydrogenation reaction [40]. The free radicals thus formed can be stabilized by p-π resonance involving ether or phenolic group (C-O) or quinone group (C=O), for example [41]. Therefore, achieving an optimal content of oxygenated groups is crucial for balancing radical generation and stabilization. Adequate oxygenation facilitates the necessary concentration of PAH radicals, whereas excessive oxygenation diminishes the condensation reactivity of radicals [42], leading to the formation of smaller structures [43]. Accordingly, planar condensation of PAH radicals with an appropriate oxygen substitution level enables the formation of extended graphene sheets [44]. Consistent with the prior studies, the specified oxygrp/C range leads to the development of corrugated continuum surface morphology during the calcination activation step. Thus, this morphology develops meso- and micro-pores throughout its bulk (details will be provided later). The pores correspond to the interstices among graphite crystallites and the defects embedded in the crystallites within the resulting AC.
The AC samples, derived from 5-8-60-C and 2.5-8-15-C, achieved the highest surface areas within their respective mass groups. Their 13C-NMR spectra reveal substituted and unsubstituted carbon species, as defined earlier, along with specific chemical shifts (Figure 5). On the other hand, the 13C-NMR spectrum of 5-0-0-C, the control, exhibits stronger peaks of aliphatic carbons (16 and 38 ppm) and PAH carbons (125 ppm) compared to 5-8-60-C and 2.5-8-15-C. In contrast, the 13C-NMR spectra of the latter two samples reveal a higher chemical shift shoulder on the PAH carbon peak, indicating the occurrence of PAH rings with more substituted oxygenated groups compared to the control. This observation complements the IR and XPS characterizations, suggesting a higher graphitization reactivity of the properly oxygenated PAHs in the calcination activation process, as indicated by the ratio of Oxygrp/C (Table 3). Unfortunately, the aforementioned 13C spectra lack quantitative information, as they were acquired without running extended acquisition times to attain adequate signal-to-noise ratios [45].

3.2. The Porous Properties of AC Samples Derived from HEC Pellets Made by Using the Compression Load of 8 mt

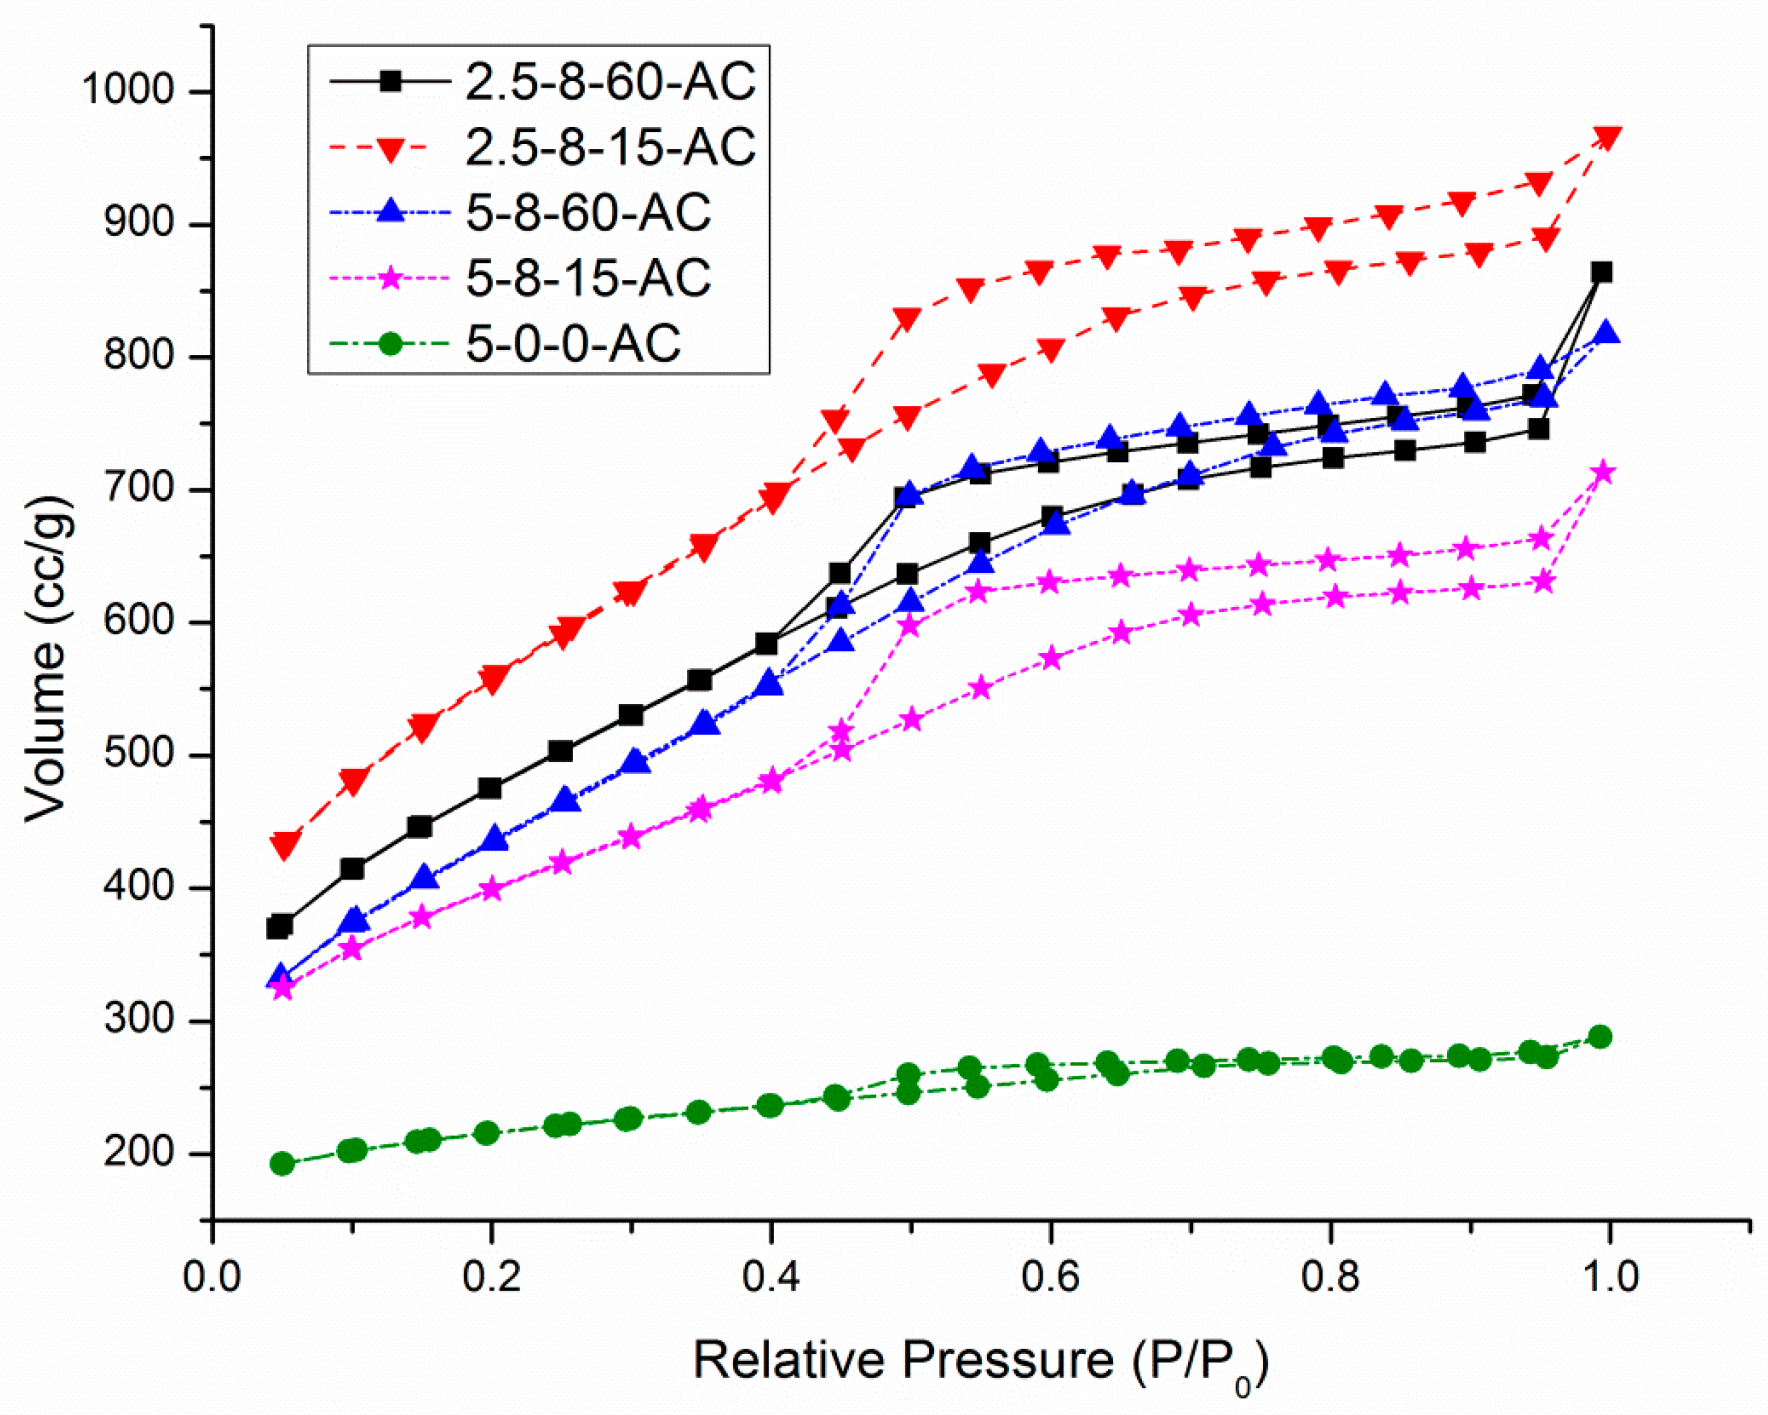
In the preceding section, the spectroscopic analyses demonstrated the significant impact of HEC pellet compression conditions on the composition of carbonaceous substances, consequently influencing the porous characteristics of AC samples. The porous structure of AC samples can be discerned through physisorption and microscopic image scrutiny. Furthermore, building upon the information in Table 3, Table 4 provides additional insight into the porous structures of AC samples by analyzing their characteristic isotherm hysteresis (H-4 type) loops, as presented in Figure 6. Furthermore, unlike Table 3, Table 4 exclusively displays samples consistent with those depicted in Figure 6. Generally, Vtotal aligns with the BET surface area, where the contribution of micropores (<2 nm) to the surface area is dominant compared to that of mesopores (from 2 to 50 nm). Furthermore, the Vmeso proportion expands with the extension of the HEC-pellet load-holding duration for both mass groups.
This pattern became more pronounced when the HEC amount is reduced to 2.5 g from 5.0 g. Consequently, Vmeso surpassed Vmicro in 2.5-8-60-AC. However, this dominance is not evident in 5-8-60-AC, which could be attributed to the lower relative creep-relaxation rate, ∆x/xref %, of 2.5-8-60-P compared to 5-8-60-P in Table 1. This implies a higher presence of micro-voids among highly compact HEC chain segments within the HEC pellet, as previously inferred. The voids then contribute to the eventual formation of meso-pores in the AC. Additionally, 2.5-8-15-AC exhibits a Vmeso/Vtotal ratio lower than that of the other samples, including the control, owing to its highest Vtotal (Table 4). This observation aligns with trends ii and iii, which were discussed earlier. As observed in Table 1, 2.5-8-15-P demonstrates the lowest ∆x/xref % rate, indicating the presence of numerous micro-voids among fairly compact HEC chain segments. Therefore, it displays the lowest tap density among the pellets with 8 mt load. This type of void, in turn, primarily contributes to the development of micropores in the AC through generating higher concentrations of the oxygenated groups on PAHs, as evidenced by the carbon-13 NMR spectrum. The steric effect of these oxygenated groups induces spaces between PAHs. Regarding the determination of pore volume, it is important to note that this study utilized the BJH method based on the type IV isotherm to assess Vtotal, which assumes capillary condensation of adsorbed N2 in all pores at P/P0 = 0.99. In contrast, the Gurvich rule, typically employed for total pore volume determination, assumes that the density of adsorbed N2 equals that of bulk liquid N2 at the same temperature. Consequently, disparities in volume between these two methods arise from minor variations in the packing density of N2 in the condensed N2 phase compared to that in the bulk liquid N2 phase.
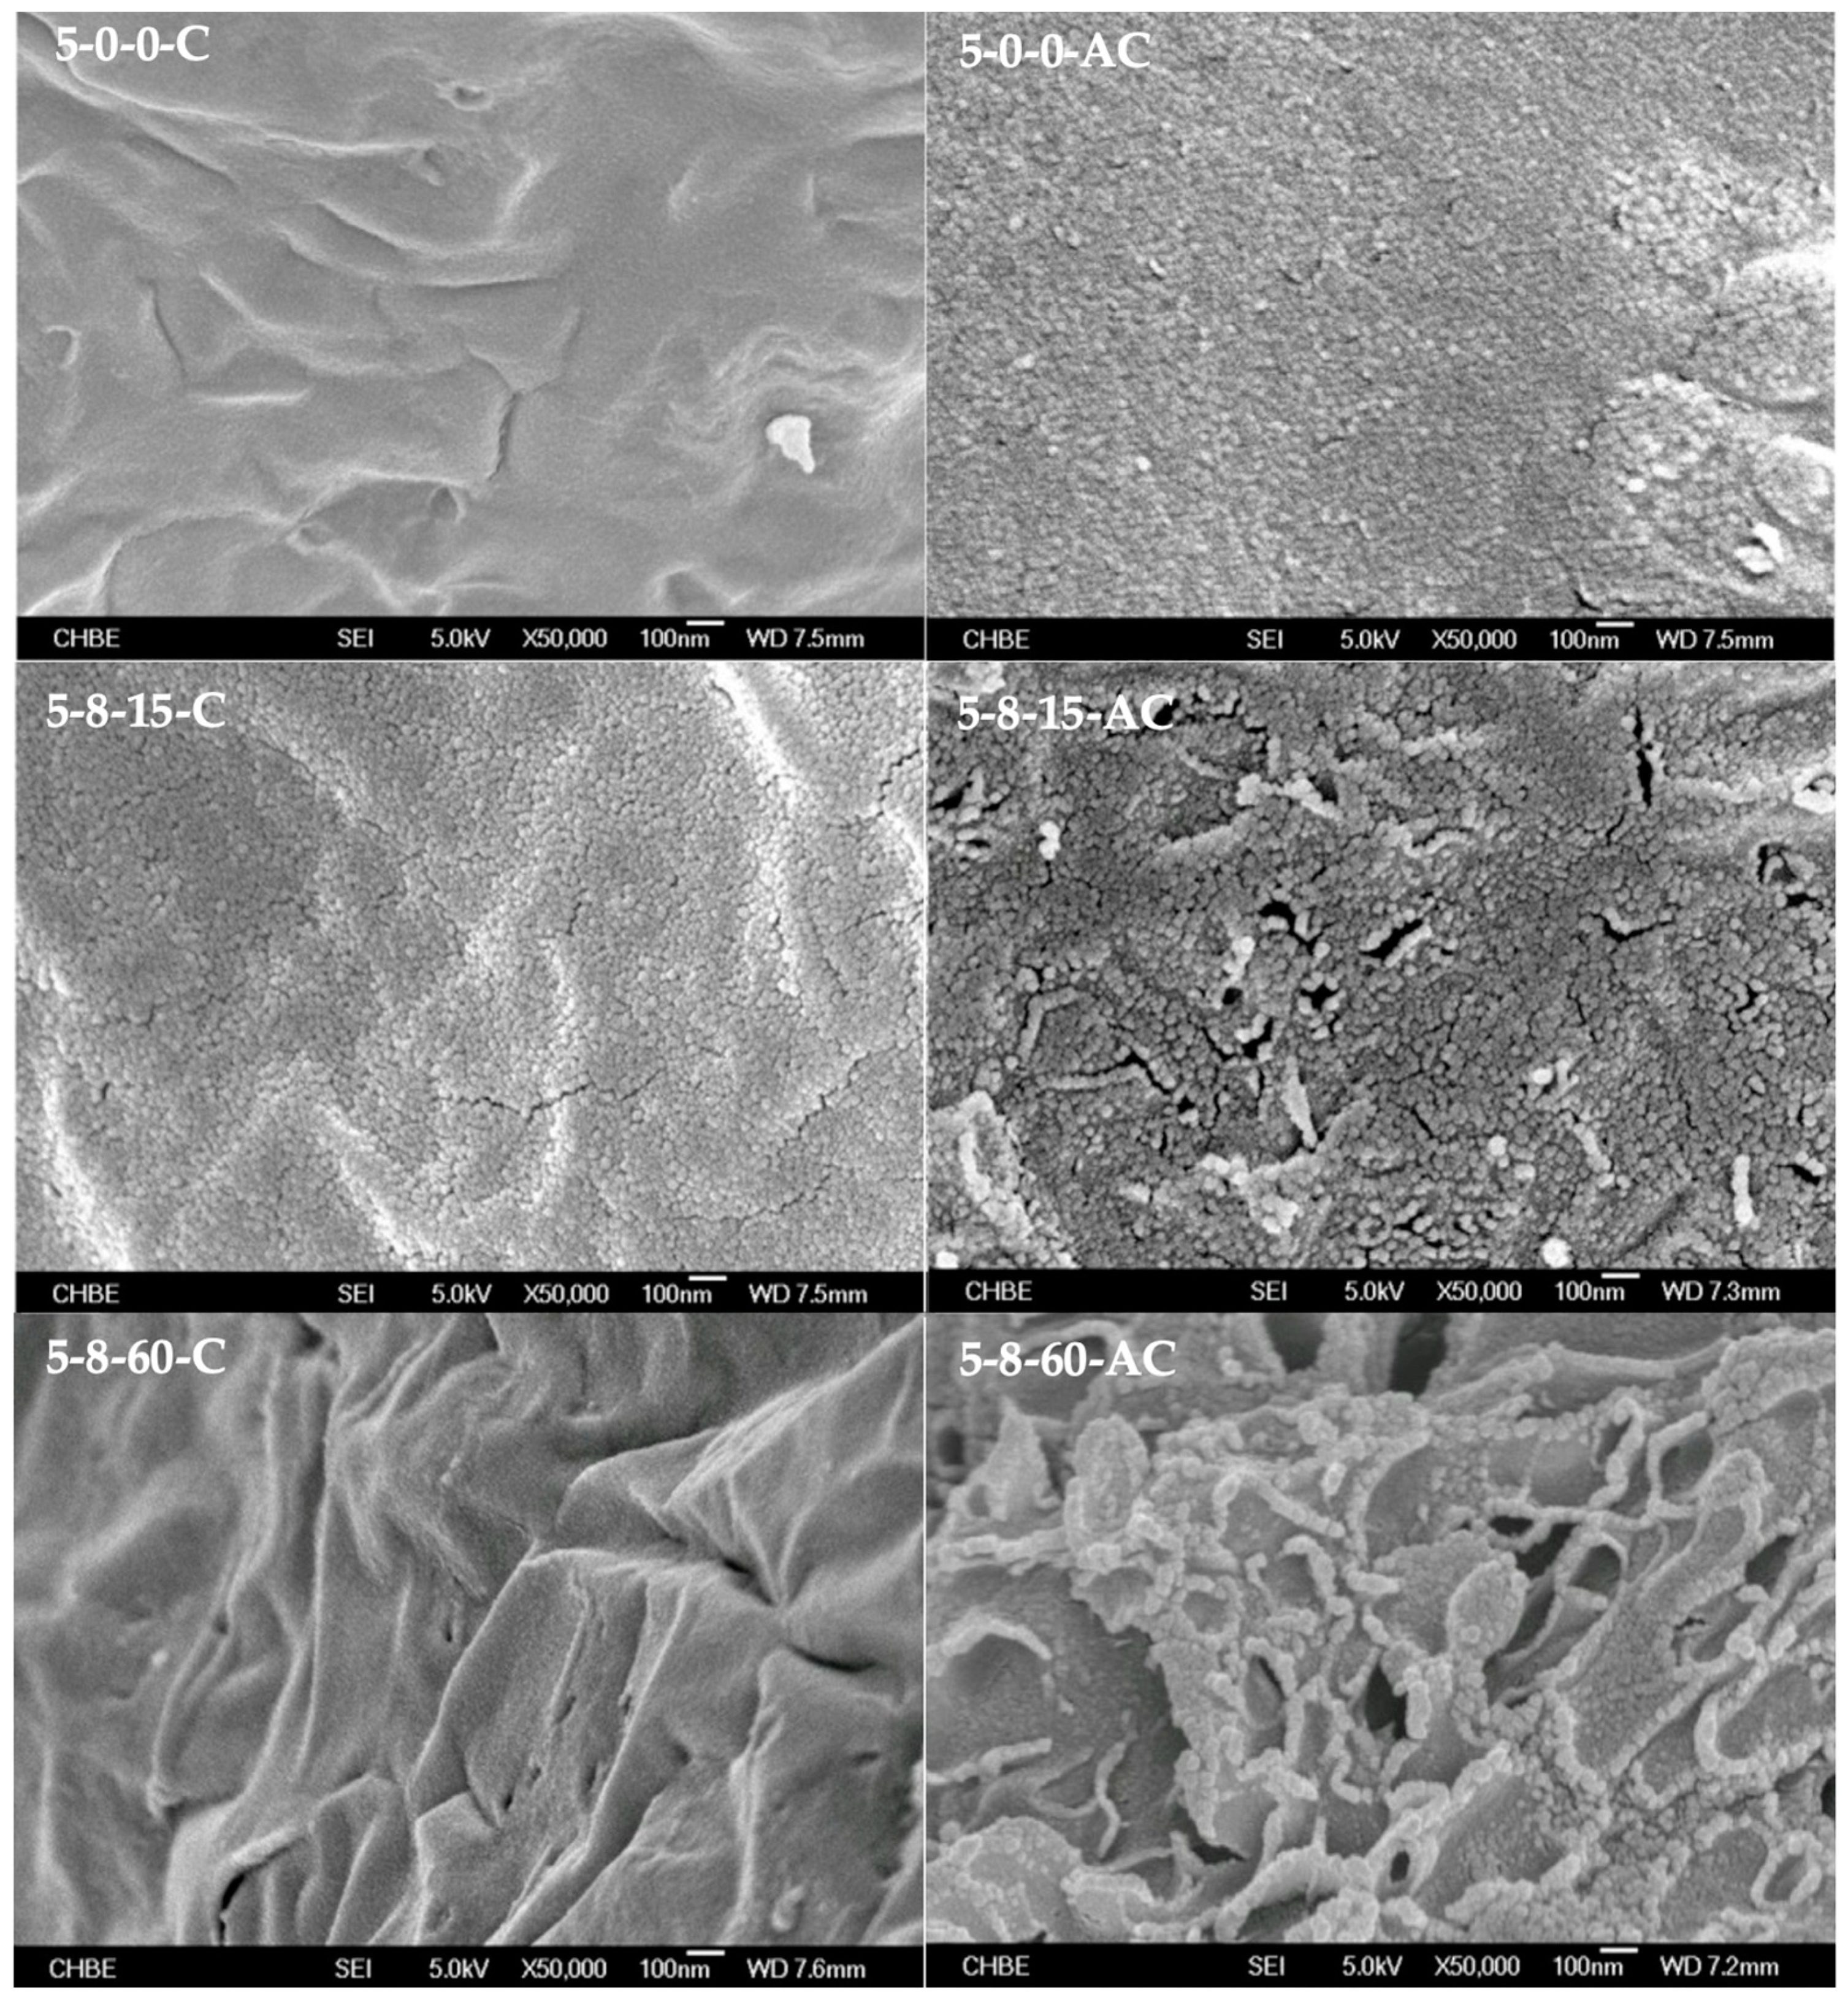
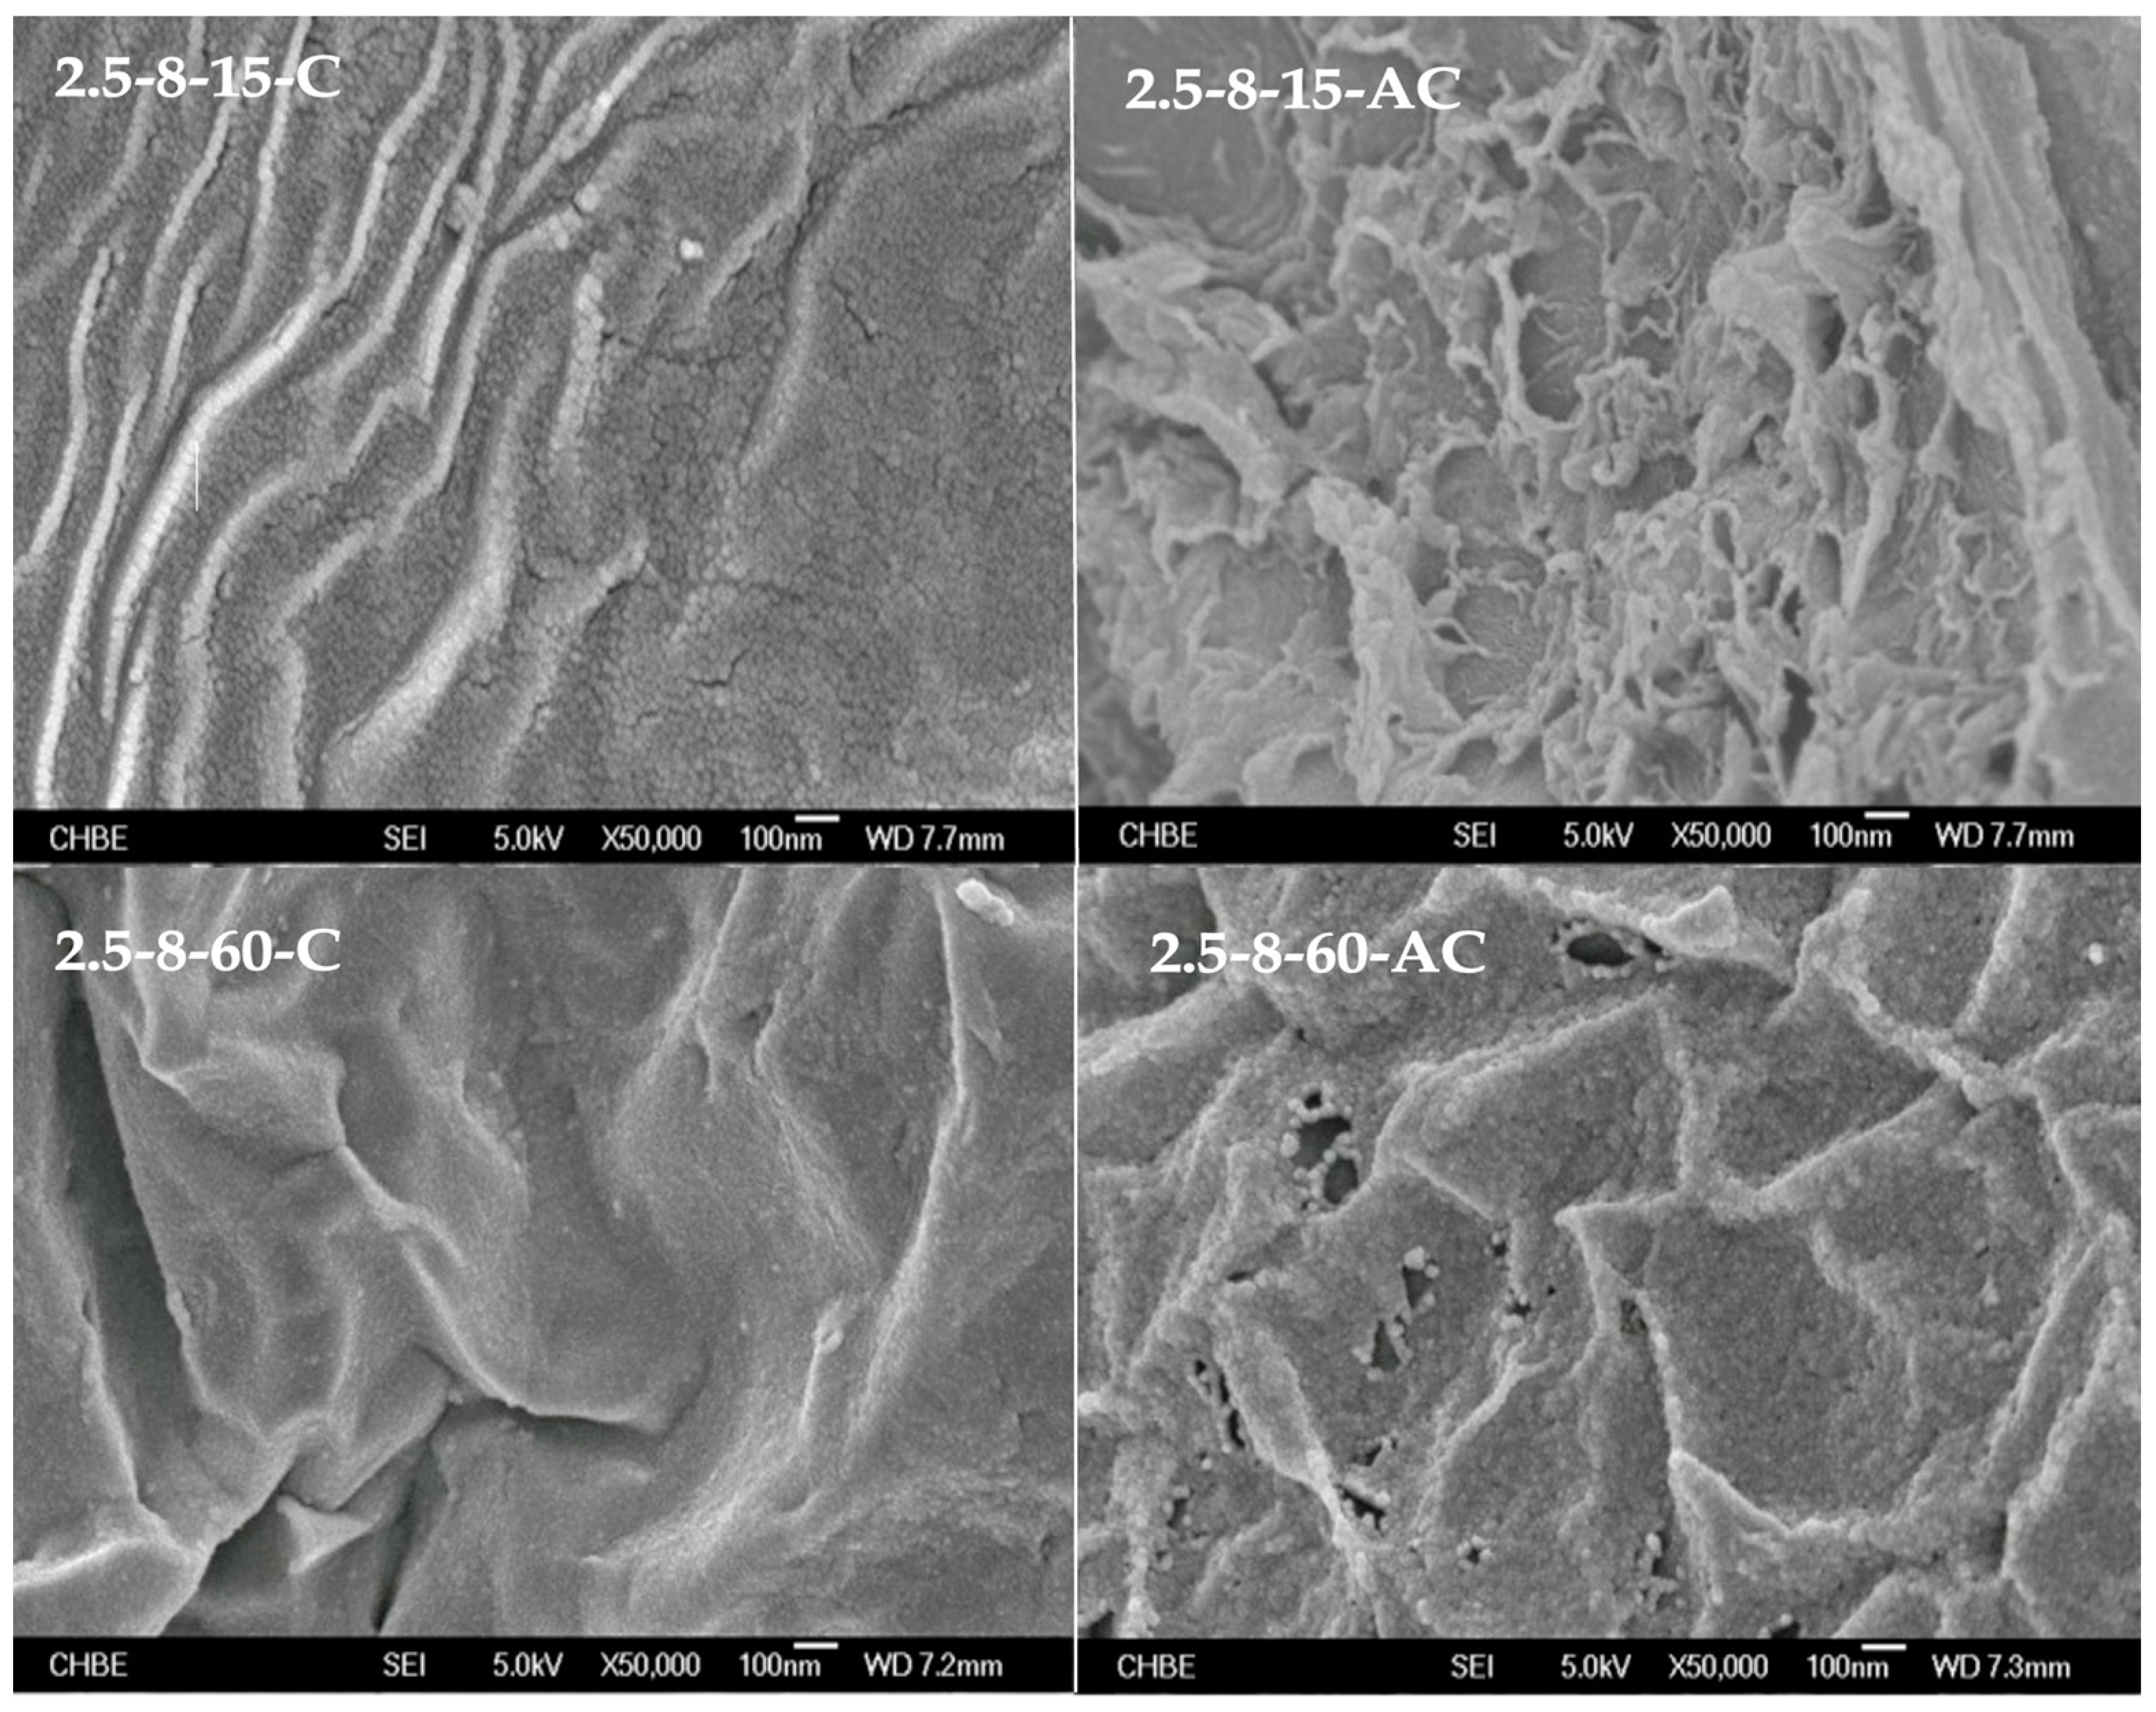
With regard to the carbonaceous substance morphologies, for the control sample, 5-0-0-C, despite presenting a continuous morphology (Figure 7), it is rational to attribute this morphology to the random congregation of PAHs connected by the saturated moieties, as previously examined by IR and 13C-NMR analysis. It may be worth noting that the saturated branches interfere with π–π stacking amidst PAHs. In addition, as 5-0-0-C has the lowest Oxygrp/C ratio, it indicates that PAH radicals lack resonance stabilization by oxygenated groups, resulting in low condensation extents due to the rapid annihilation of free radicals. Hence, during the transition from 5-0-0-C to 5-0-0-AC, graphitization occurs locally in dispersed sites, involving a variety of PAHs, which leads to the creation of smaller and more densely packed graphite crystallites. Nevertheless, the carbonaceous sample, 5-8-60-C, exhibits a wrinkled continuum morphology. As explained earlier, the extension of compression from 15 min to 60 min allows for the deep creep-relaxation of HEC chains in 5-8-60-P, leading to significant tangling among the existing HEC particles. As a consequence, PAH rings are collectively generated and extended throughout the pyrolysis process of HEC, leading to the aforementioned morphology. During the subsequent calcination activation step, while graphite crystallite grains continue forming on the surface, the wrinkled morphology is preserved and experiences an increase in roughness and porosity. This inherent structure encompasses comparable meso- and micro-pore volumes (Table 4), with the mesopore channels permeating through the diversely amalgamated graphite crystallites within the bulk of 5-8-60-AC. In comparison to 5-8-60-P, 5-8-15-P exhibits only a slightly lower tap density, but displays a more noticeably smaller ∆x/xref % (Table 1), suggesting that the compression leaves behind a different density distribution in the pellet [46]. This difference is attributed to the shorter load-holding duration. As a result, 5-8-15-C maintains the morphology of aggregated nano-grains. Subsequently, graphitization is facilitated by the π-affinity-driven aggregation of PAHs [47] within individual nanograins during the calcination activation, leading to the formation of distinct graphite crystallite grains in 5-8-15-AC.
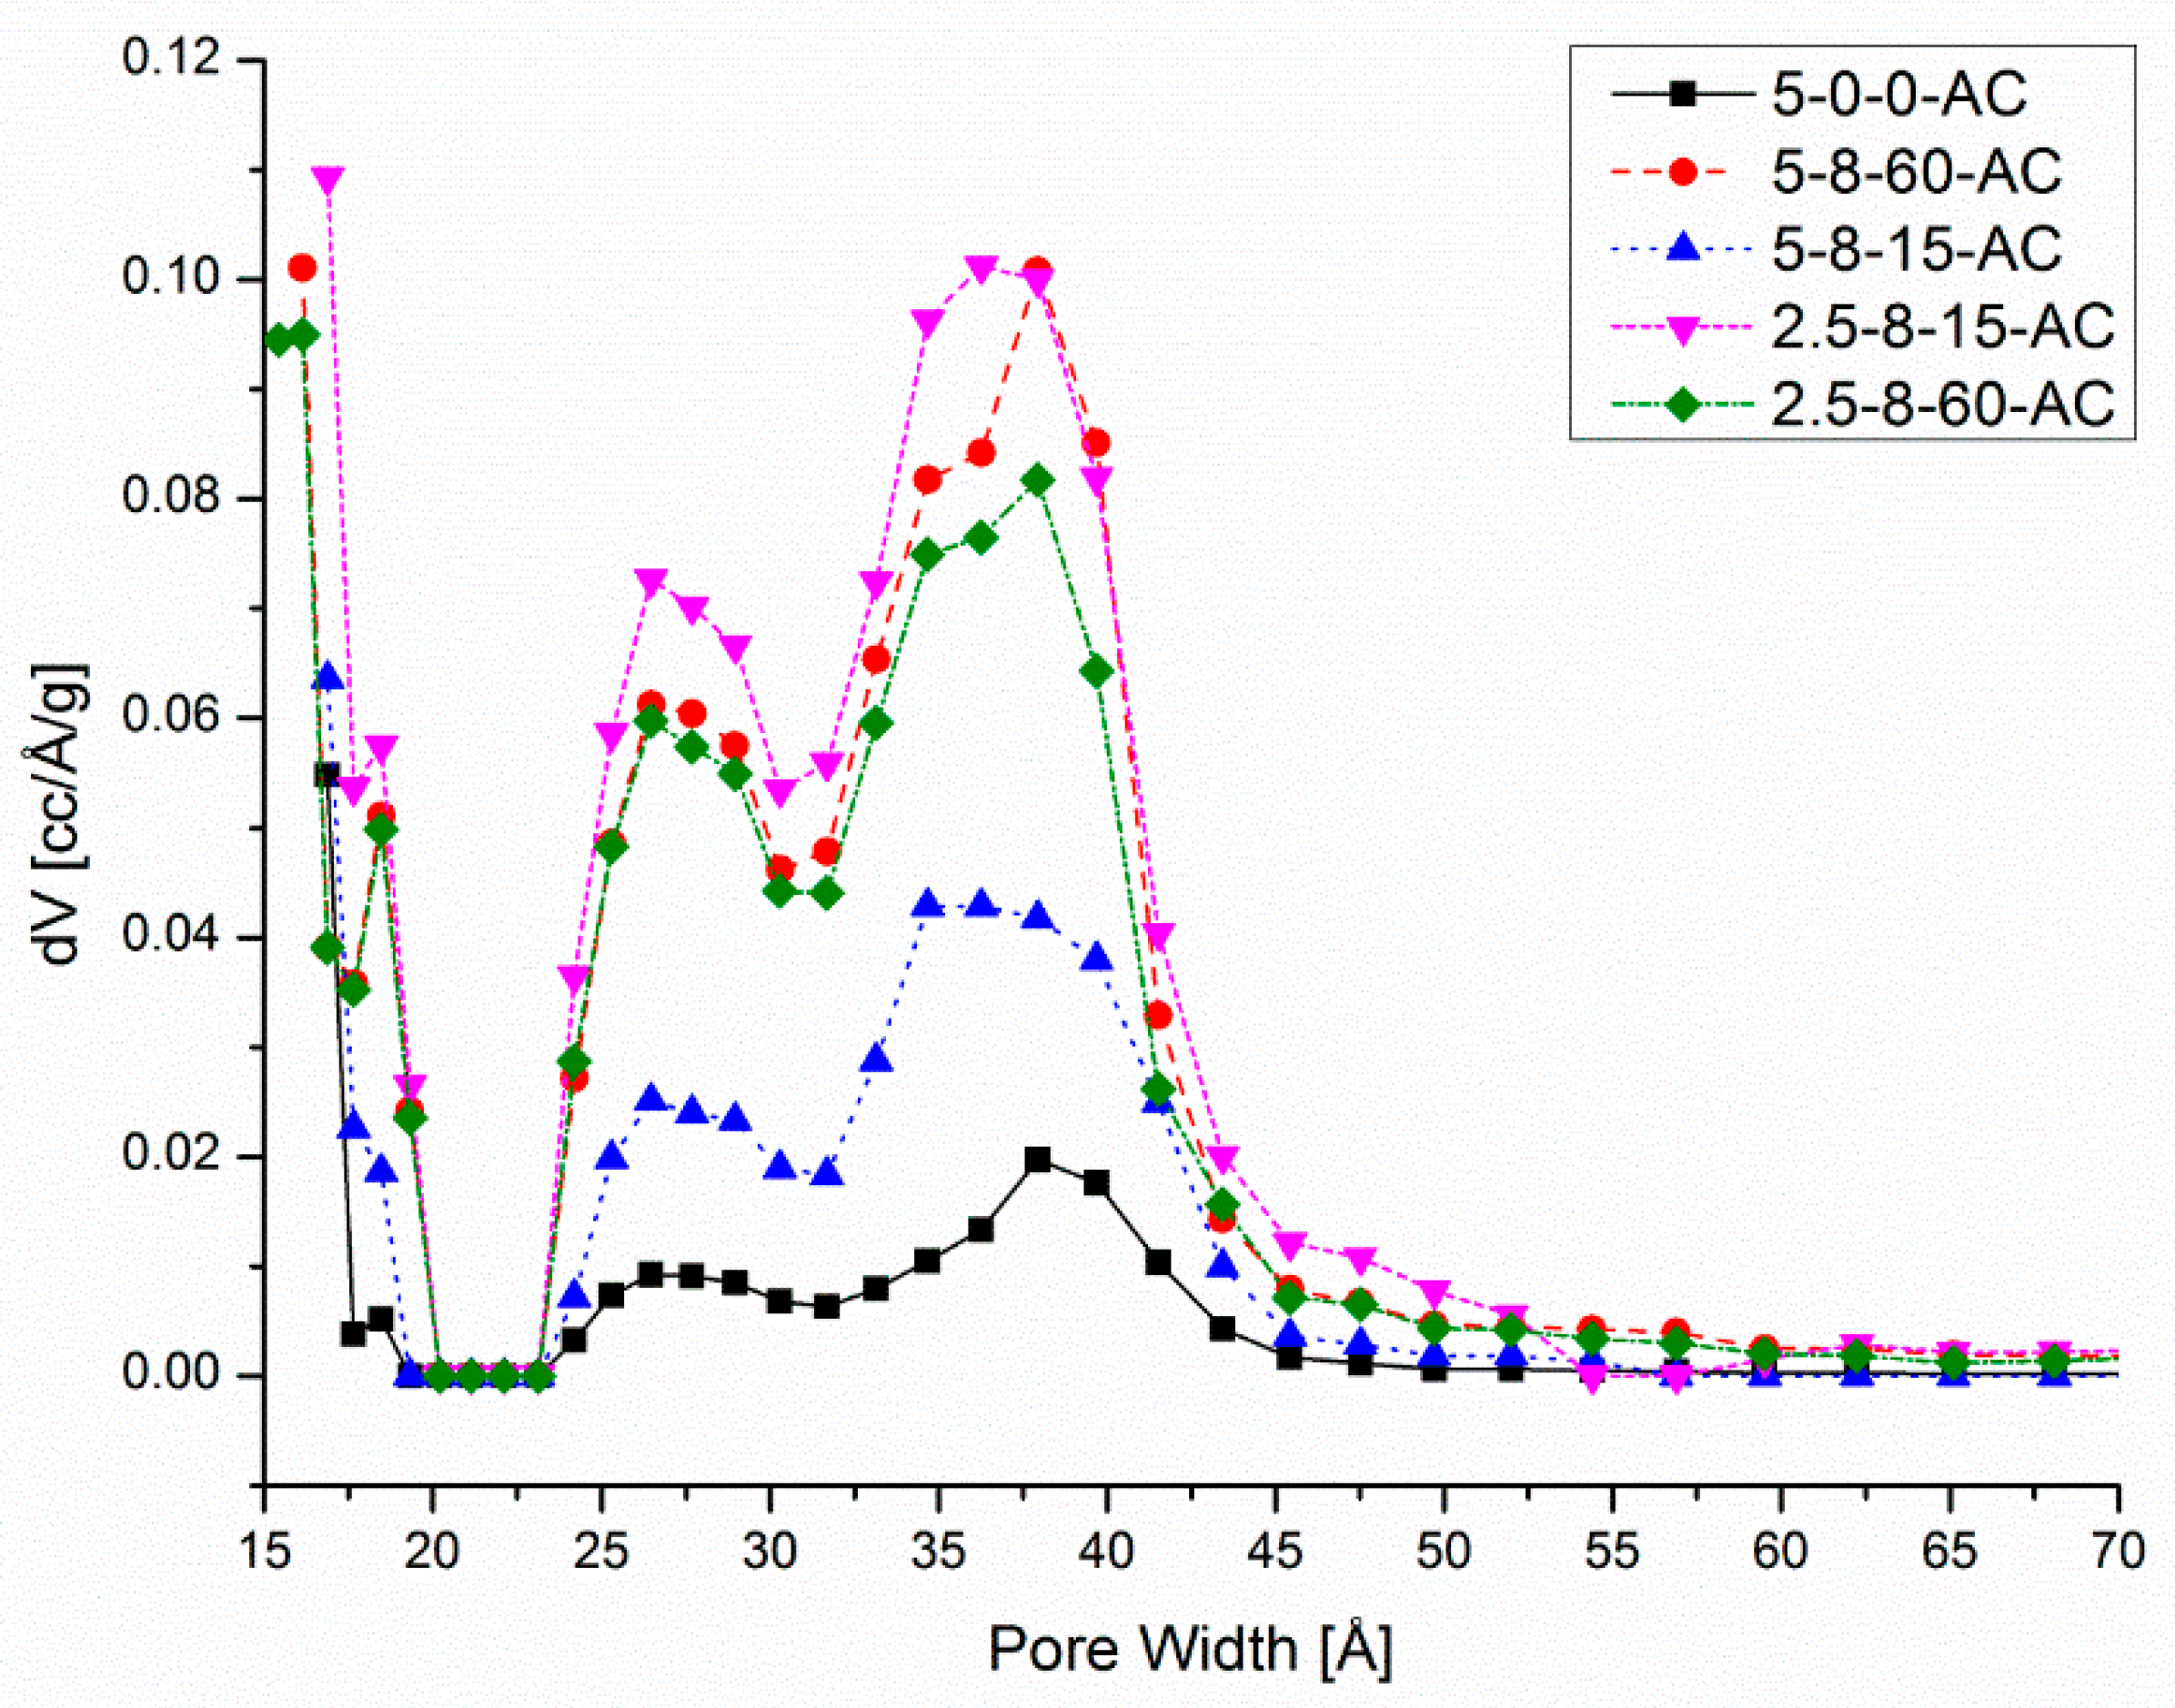
Furthermore, in contrast to 5-8-15-C, which possesses aggregated nano-grains, 2.5-8-15-C reveals a morphology integrating a wrinkled continuum and tiny agglomeration of PAHs. This nano-scale discreteness corresponds with the aforementioned inference regarding the presence of voids among PAHs. As such, the distinctive morphology likely induces more vigorous and stochastic graphitization reactions upon calcination activation, resulting in the formation of 2.5-8-15-AC with a highly wrinkled structure (Figure 7). In contrast to 2.5-8-15-AC, 2.5-8-60-AC exhibits a pronounced corrugated morphology, including a higher mesopore volume but a smaller micropore volume than the former, as elucidated previously. In conclusion, the highly continuous carbonaceous morphologies observed in 5-8-60-C and 2.5-8-60-C, resulting from extensive lateral collection of PAH rings, serve as templates for directing the two-dimensional fusion of PAHs. This process preserves mesopores that penetrate amidst PAHs, facilitating the formation of their AC skeletons with the corrugated continuum morphologies. The NLDFT pore-size distribution plots (Figure 8), representing the change in pore volume per unit of pore diameter (dV/dD), consist of three mesopore sizes, with the representative pore sizes centered at 2.7 and 3.8 nm, respectively.

3.3. Assessment of the H2S Removal Efficacies of the AC Samples from a Gas Stream

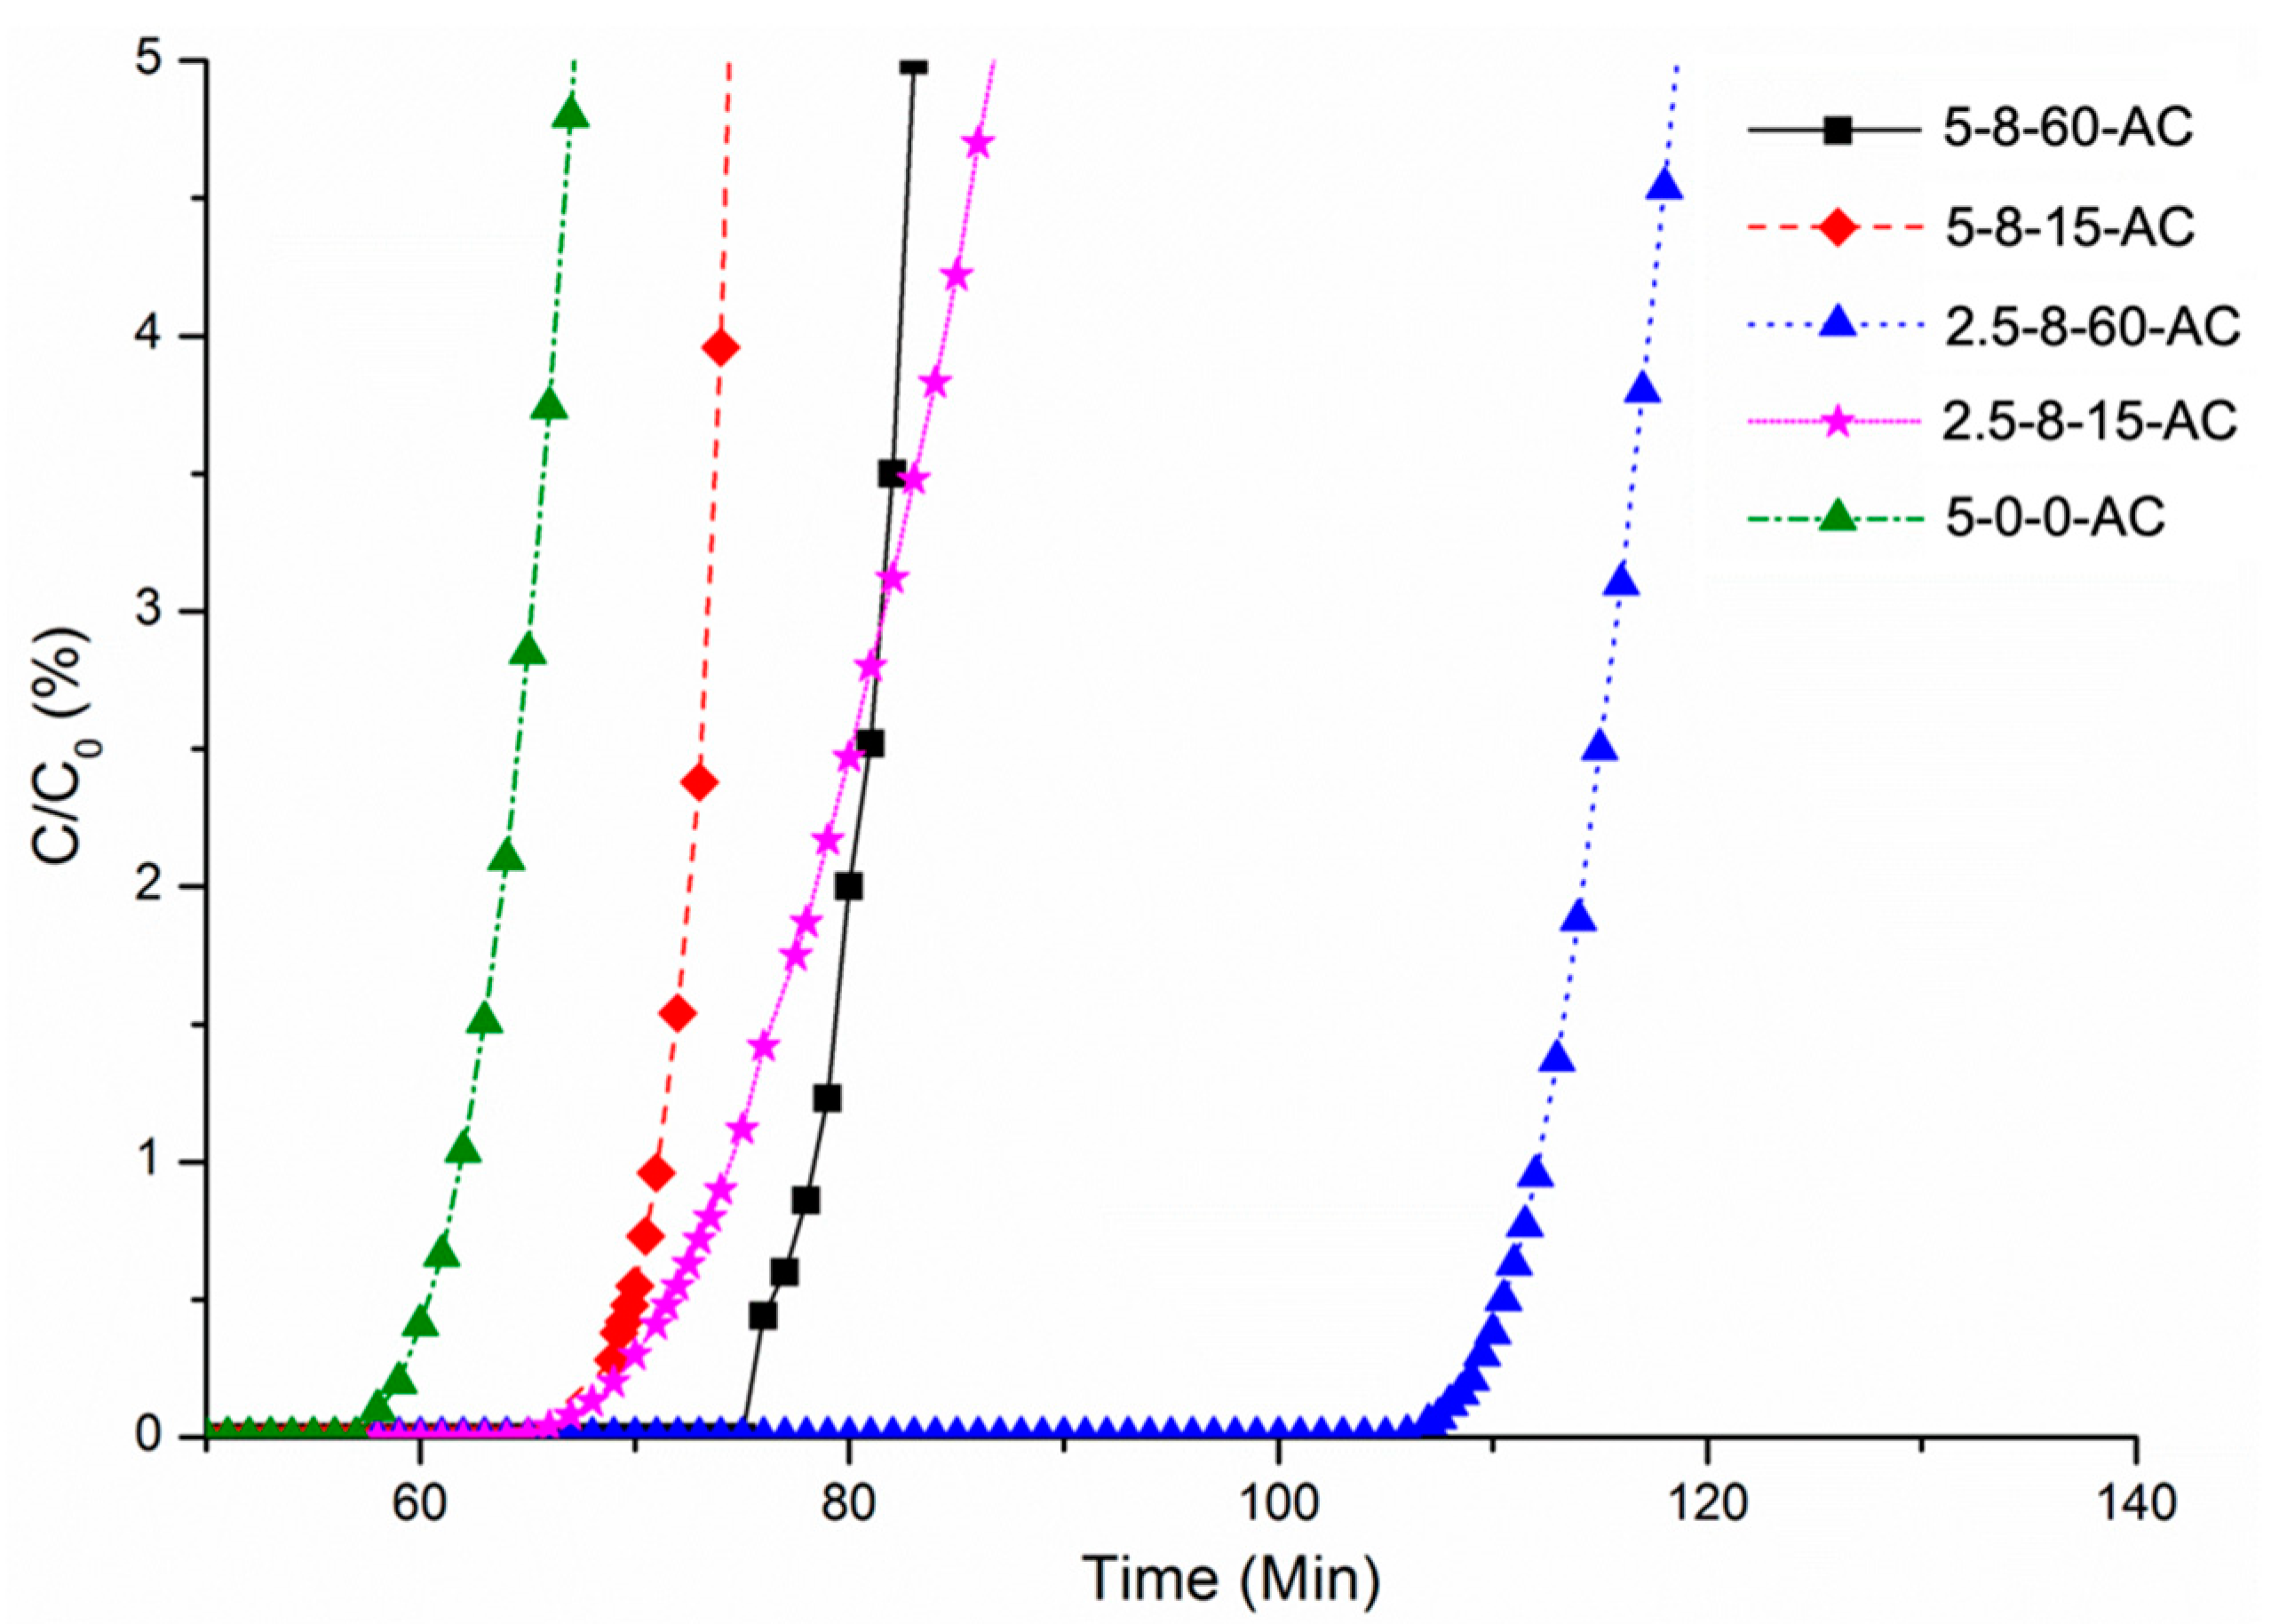
Referring to Section 2.3.5, the assessment was carried out in a micro-fixed-bed reactor using a feed comprising H2S (C0 = 1000 ppm) and nitrogen. The H2S adsorption breakthrough concentration was set at 10 ppm (equivalent to C/C0 value of 1%), and the breakthrough time was defined as the total time taken to detect this concentration of H2S in the outlet stream. Figure 9 displays the H2S adsorption breakthrough curves. It can be observed that the breakthrough time was influenced by the total pore volume (Vtotal) and the fraction of mesopore volume (Vmeso%), whereas the weak surface basicity of the examined AC samples did not show a noticeable impact on H2S adsorption. The surface basicity arose from the association of a proton (H+) with the conjugated π-electron system, i.e., on the surface of graphite crystallites. The adsorption breakthrough time spans generally follow the magnitude order of Vtotal, but another trend is that prolonged the load-holding durations favor for H2S removal because of the increased Vmeso% (Table 5). The inference based on these two trends suggests that mesopores are more efficient than micropores in removing H2S from the gas stream. A recent review highlighted that pore sizes ranging from 2 to 4.5 nm are optimal for H2S removal [48]. It should be noted that the real gas molar volume of H2S is 23 L/mol at 298 K and 1 atm, as reported by the Engineering ToolBox. Utilizing the ideal gas molar volume in the calculation (Equation (1)) would very slightly overestimate the AC absorption capacities of all the samples, constituting a systematic error. However, this would not impact the observed trends.
Concerning the relationship between the pore size distribution (PSD) curves (Figure 8) and the adsorption performance in terms of removing H2S, the peaks in dV(D) centered at 2.7 nm and 3.8 nm in the PSD curve display an intensity sequence. The dV(D) assessment reveals the response at which pore volume changes with variations in pore sizes, fundamentally divulging the influence of mesopore size and internal pore structure on the evolution of the mesopore chamber. Hence, we observe the dV(D) peak intensity order of 2.5-8-15-AC > 5-8-60-AC > 2.5-8-60-AC > 5-8-15-AC in the mesopore range, reflecting the influences of both the response magnitude and the related Vmeso. In the first three samples, the response prevails because they exhibit a reversed Vmeso order (Table 4), whereas the last sample demonstrates lowest peak of the four for both lower response and Vmeso. Specifically, regarding 2.5-8-60-AC, despite having the largest Vmeso, its mesopores exhibit less responsiveness in internal structure and capacity to the increase in pore size compared to 2.5-8-15-AC and 5-8-60-AC. As previously mentioned, mesopores in 2.5-8-60-AC primarily form between the corrugated sp2-carbon planes composed of fused PAHs, as depicted in Figure 7. These mesopores within the wrinkled continuum morphology are interconnected. Consequently, the mesopore geometries are less discernable as the gap width between the planes varies. This reduced discrepancy in mesoporous structural characteristic becomes less apparent in 5-8-60-AC and even less so in 2.5-8-15-AC, although they still exhibit the wrinkled continuum morphology. Thereby, the less discrepant mesoporous structure contributes to maintaining higher efficacy in H2S removal, which follows the reverse order of the dV(D) peak intensity, except for the last sample, 5-8-15-AC. Furthermore, it is noteworthy that the first sample in this series, 2.5-8-15-AC, and the last sample, 5-8-15-AC, exhibit similar H2S removal capacities (Table 5) despite the former having the largest Vtotal in the series. This suggests that micro-pores play an insignificant role in H2S removal compared to mesopores.
In contrast to a previous study [49], it utilized the micropores of a specific type of AC fibers for H2S removal from a stream (200 ppm H2S in N2) in a fixed-bed reactor, the current AC samples exhibit notably improved adsorption capacities. Meanwhile, mesoporous carbon materials, such as mesoporous carbon sphere adsorbent produced via a template-removal technique [50], while exhibiting a higher total pore volume, show a H2S removal breakthrough capacity of 10 (mg/g) from a feed stream similar to the present study. This performance, nevertheless, falls below the corresponding data in Table 5, which could be attributed to the larger average mesopore size (10 nm) and different pore geometries and pore walls. It is therefore reasonable to infer that the improved H2S removal capacity demonstrated by the current mesoporous AC is maintained by the stronger capillary condensation of H2S [51], facilitated by the optimal mesopore sizes (approximately 2.7 and 3.7 nm) and planar pore pattern.

4. Conclusions

Diverging from conventional approaches that modify activated carbon (AC) through adjustments in heat treatment conditions, post-treatment after carbonization, or chemical modifications to the selected polymer precursor, this work explores how the packing scenario of polymer chains influences the porous characteristics of the resulting AC. The underlying rationale for this influence is rooted in the mechanism; thereby, the packing state governs the pyrolysis chemistry, subsequently shaping the formation of the AC framework. The key achievements of this study encompass the following aspects:
  • HEC fine powder was compressed in a cylindrical die set, yielding compaction in both the radial and axial directions. By keeping the load at 8 mt with a load-holding duration, it was observed that a greater polymer compaction, i.e., the relative creep-relaxation extent, was realized in a 5 g pellet than in a 2.5 g pellet. Conversely, extending the duration of load (8 mt) application resulted in compaction for either the 2.5 g or the 5.0 g pellet.
  • The pyrolysis of HEC pellets yielded carbonaceous substances comprising polycyclic aromatic hydrocarbons (PAHs) and a minor fraction of aliphatic species. Both types of species carried oxygenated groups. The atomic ratio of the unsubstituted carbon species to the oxygenated groups, according to XPS analysis, affected the evolution of the porous structure of AC during the subsequent calcination activation process. The optimal ratio range, resulting in high surface areas, originated from the tap densities (g · cm−3) observed in the HEC pellets, ranging from 1.22 to 1.27 compared to 1.14 for the HEC powder used.
  • By referencing the HEC powder chosen as the control, the HEC pellets demonstrated evidently larger volumes of total pores and mesopores after their conversion into corresponding AC samples. Moreover, extending the initial load-holding duration from 15 to 60 min resulted in the formation of a wrinkled AC medium embedded with interpenetrating mesopores in addition to micropores. These two distinct porous characteristics worked together to enhance the removal of H2S from a gas stream compared to microporous AC adsorbents with particulate morphology.

Author Contributions

Conceptualization, L.H.; methodology, L.H. and F.C.; validation, L.H. and F.C.; formal analysis, F.C.; investigation, F.C.; resources, L.H.; data curation, F.C.; writing—original draft preparation, F.C.; writing—review and editing, L.H.; visualization, L.H.; supervision, L.H.; project administration, L.H.; funding acquisition, L.H. All authors have read and agreed to the published version of the manuscript.

Funding

This research was funded by Singapore National Research Foundation (NRF), grant number R-279-000-261-281.

Data Availability Statement

Master Thesis by Chen Fuxiang: “Carbonizing compressed hydroxyethyl cellulose utilizing stress relaxation—an effective way to tune pore structure of activated carbon”. 2012. https://scholarbank.nus.edu.sg/handle/10635/36133 (accessed on 15 August 2012).

Acknowledgments

The authors acknowledge administrative and logistical support provided by Chemical and Biomolecular Engineering Department of National University of Singapore.

Conflicts of Interest

The authors declare no conflicts of interest.

References

  1. Reza, M.S.; Yun, C.S.; Afroze, S.; Radenahmad, M.S.; Bakar, A.; Saidur, R.; Taweekun, J.; Azad, A.K. Preparation of activated carbon from biomass and its’ applications in water and gas purification, a review. Arab. J. basic Appl. Sci. 2020, 27, 208–238. [Google Scholar] [CrossRef]
  2. Jin, P.; Jin, X.; Wang, X.; Feng, Y.C.X. Biological activated carbon treatment process for advanced water and wastewater treatment. In Biomass Now-Cultivation and Utilization; Matovic, M.D., Ed.; InTech: London, UK, 2013; pp. 153–192. [Google Scholar] [CrossRef]
  3. De Mello, R.; Motheo, A.J.; Sáez, C.; Rodrigo, M.A. Recent progress in the combination of activated carbon adsorption and electrolysis for the treatment of wastes. Curr. Opin. Electrochem. 2022, 36, 101167. [Google Scholar] [CrossRef]
  4. Naji, S.Z.; Tye, C.T. A review of the synthesis of activated carbon for biodiesel production: Precursor, preparation, and modification. Energy Convers. Manag. 2022, X13, 100152. [Google Scholar] [CrossRef]
  5. Guo, Z.; Zhu, G.; Gao, B.; Zhang, D.; Tian, G.; Chen, Y.; Zhang, W.; Qiu, S. Adsorption of vitamin B12 on ordered mesoporous carbons coated with PMMA. Carbon 2005, 43, 2344–2351. [Google Scholar] [CrossRef]
  6. Shen, W.; Wang, H.; Guan, R.; Li, Z. Surface modification of AC fiber and its adsorption for vitamin B1 and folic acid. Colloids Surf. A Physicochem. Eng. Asp. 2008, 331, 263–267. [Google Scholar] [CrossRef]
  7. Slocum, A.; Santora, S.; Ly, M.; Zhang, J.; Castano, J.; Becerra-Arteaga, A. Development of an activated carbon filtration step and high throughput screening method to remove host cell proteins from a recombinant enzyme process. Biotechnol. Prog. 2021, 37, e3151. [Google Scholar] [CrossRef] [PubMed]
  8. Fuertes, A.B.; Lota, G.; Centeno, T.A.; Frackowiak, E. Templated mesoporous carbons for supercapacitor application. Electrochimica Acta 2005, 50, 2799–2805. [Google Scholar] [CrossRef]
  9. Ahmad, A.; Gondal, M.A.; Hassan, M.; Rashid, I.; Ullah, S.; Alzahrani, A.S.; Memon, W.A.; Mabood, F.; Melhi, S. Preparation and Characterization of Physically Activated Carbon and Its Energetic Application for All-Solid-State Supercapacitors: A Case Study. ACS Omega 2023, 8, 21653–21663. [Google Scholar] [CrossRef] [PubMed]
  10. Strizhenov, E.M.; Shkolin, A.V.; Chugaev, S.S.; Men’shchikov, I.E.; Solovtsova, O.V.; Shiryaev, A.A.; Nickolsky, M.S. Adsorbed natural gas storage facility based on activated carbon of wood waste origin. Adsorption 2023, 29, 291–307. [Google Scholar] [CrossRef]
  11. Guan, C.; Loo, S.; Wang, K.; Yang, C. Methane storage in carbon pellets prepared via a binderless method. Energy. Convers. Manag. 2011, 52, 1258–1262. [Google Scholar] [CrossRef]
  12. Zhang, T.; Walawender, W.P.; Fan, L.T. Grain-based AC for natural gas storage. Bioresour. Technol. 2010, 101, 1983–1991. [Google Scholar] [CrossRef] [PubMed]
  13. Inomata, K.; Kanazawa, K.; Urabe, Y.; Hosono, H.; Araki, T. Natural gas storage in AC pellets without a binder. Carbon 2002, 40, 87–93. [Google Scholar] [CrossRef]
  14. Zhu, R.; Yu, Q.; Li, M.; Zhao, H.; Jin, S.; Huang, Y.; Fan, J.; Chen, J. Analysis of factors influencing pore structure development of agricultural and forestry waste-derived activated carbon for adsorption application in gas and liquid phases: A review. J. Environ. Chem. Eng. 2021, 9, 105905. [Google Scholar] [CrossRef]
  15. Li, L.; Liu, S.; Liu, J. Surface modification of coconut shell-based AC for the improvement of hydrophobic VOC removal. J. Hazard. Mater. 2011, 192, 683–690. [Google Scholar] [CrossRef] [PubMed]
  16. Zhi, Y.; Liu, J. Surface modification of activated carbon for enhanced adsorption of perfluoroalkyl acids from aqueous solutions. Chemosphere 2016, 144, 1224–1232. [Google Scholar] [CrossRef] [PubMed]
  17. Jha, M.K.; Joshi, S.; Sharma, R.K.; Kim, A.A.; Pant, B.; Park, M.; Pant, H.R. Surface Modified Activated Carbons: Sustainable Bio-Based Materials for Environmental Remediation. Nanomaterials 2021, 11, 3140. [Google Scholar] [CrossRef] [PubMed]
  18. Lingjun Kong, L.; Liu, M.; Diao, Z.; Chen, D.; Chang, X.; Xiong, Y. Coupling template nanocasting and self-activation for fabrication of nanoporous carbon. Sci. Rep. 2016, 6, 38176. [Google Scholar] [CrossRef] [PubMed]
  19. Rambau, K.M.; Musyoka, N.M.; Manyala, N.; Ren, J.; Langmi, H.W. Mechanochemical approach in the synthesis of activated carbons from waste tyres and its hydrogen storage applications. Mater. Today Proc. 2018, 5, 10505–10513. [Google Scholar] [CrossRef]
  20. Alcañiz-Monge, J.; Trautwein, G.; Pérez-Cadenas, M.; Román-Martínez, M.C. Effects of compression on the textural properties of porous solids. Microporous Mesoporous Mater. 2009, 126, 291–301. [Google Scholar] [CrossRef]
  21. Münstedt, H. Influence of hydrostatic pressure on rheological properties of polymer melts—A review. J. Rheol. 2020, 64, 751–774. [Google Scholar] [CrossRef]
  22. Grandes, F.A.; Sakano, V.K.; Rego, A.C.; Rebmann, M.S.; Cardoso, F.A.; Pileggi, R.G. Rrheological behaviour and flow induced microstructural changes of cement-based mortars assessed by pressure mapped squeeze flow. Powder Technol. 2021, 393, 519–538. [Google Scholar] [CrossRef]
  23. Jeya, R.P.K.; Bouzid, A.-H. Compression Creep and Thermal Ratcheting Behaviour of High Density Polyethylene (HDPE). Polymers 2018, 10, 156. [Google Scholar] [CrossRef] [PubMed]
  24. Chen, X.; Nguyen, T.D. Influence of thermoviscoelastic properties and loading conditions on the recovery performance of shape memory polymers. Mech. Mater. 2011, 43, 127–138. [Google Scholar] [CrossRef]
  25. Sun, M.; Hong, L. Impacts of the pendant functional groups of cellulose precursor on the generation of pore structures of AC. Carbon 2011, 49, 2173–2180. [Google Scholar] [CrossRef]
  26. Shivanand, P.; Sprockel, O.L. Compaction behaviour of cellulose polymers. Powder Technol. 1992, 69, 177–184. [Google Scholar] [CrossRef]
  27. Lewis, I.C. Chemistry of carbonization. Carbon 1982, 20, 519–529. [Google Scholar] [CrossRef]
  28. Norit Activated Carbon. Available online: https://norit.com/applications/biogas-rng/hydrogen-sulfide-removal (accessed on 14 November 2022).
  29. Sevilla, M.; Fuertes, A.B. The production of carbon materials by hydrothermal carbonization of cellulose. Carbon 2009, 47, 2281–2289. [Google Scholar] [CrossRef]
  30. Cui, H.; Turn, S.Q.; Reese, M.A. Removal of sulfur compounds from utility pipelined synthetic natural gas using modified AC. Catalysis Today 2009, 139, 274–279. [Google Scholar] [CrossRef]
  31. Shokri, J.; Adibkia, K. Application of cellulose and cellulose derivatives in pharmaceutical industries. In Cellulose-Medical, Pharmaceutical and Electronic Applications; Van De Ven Theo, G.M., Ed.; InTech: London, UK, 2013. [Google Scholar] [CrossRef]
  32. Ghori, M.U.; Conway, B. Powder compaction: Compression properties of cellulose ethers. Br. J. Pharm. 2016, 1, 19–29. [Google Scholar] [CrossRef]
  33. Tang, W.; Wang, C.; Chen, D. Kinetic studies on the pyrolysis of chitin and chitosan. Polym. Degrad. Stab. 2005, 87, 389–394. [Google Scholar] [CrossRef]
  34. El-Sayed, N.S.; Awad, H.; El-Sayed, G.M. Synthesis and characterization of biocompatible hydrogel based on hydroxyethyl cellulose-g-poly(hydroxyethyl methacrylate). Polym. Bull. 2020, 77, 6333–6347. [Google Scholar] [CrossRef]
  35. Xing, Z.; Ng, Y.H.; Tay, S.W.; Oon, R.P.H.; Hong, L. Shaping nanofiltration channels in a carbonaceous membrane via controlling the pyrolysis atmosphere. Phys. Chem. Chem. Phys. 2017, 19, 21426–21435. [Google Scholar] [CrossRef] [PubMed]
  36. Pham, N.K.; Nguyen, T.T. Understanding interaction capacity of CO2 with organic compounds at molecular level: A theoretical approach. In Carbon Dioxide Chemistry, Capture and Oil Recovery; Karame, I., Shaya, J., Srour, H., Eds.; InTech: London, UK, 2017. [Google Scholar] [CrossRef]
  37. Sehaqui, H.; Zhou, Q.; Berglund, L.A. Nanostructured biocomposites of high toughness—A wood cellulose nanofiber network in ductile hydroxyethylcellulose matrix. Soft Matter. 2011, 7, 7342. [Google Scholar] [CrossRef]
  38. Sandford, S.A.; Bernstein, M.P.; Materese, C.K. The infrared spectra of polycyclic aromatic hydrocarbons with excess peripheral h atoms (Hn-PAHs) and their relation to the 3.4 and 6.9 μm PAH emission features. Astrophys. J. Suppl. Ser. 2013, 205, 30. [Google Scholar] [CrossRef] [PubMed]
  39. Miao, M.; Zuo, S.; Zhao, Y.; Wang, Y.; Xia, H.; Tan, C.; Gao, H. Selective oxidation rapidly decomposes biomass-based activated carbons into graphite-like crystallites. Carbon 2018, 140, 504–507. [Google Scholar] [CrossRef]
  40. Wang, T.; Liu, Q.; Shi, L.; Xiang, C.; Liu, Z.; Han, W.; Zhang, L.; Nie, H.; Li, M. Radicals and coking behaviors during thermal cracking of two vacuum resids and their SARA fractions. Fuel 2020, 279, 118374. [Google Scholar] [CrossRef]
  41. Johansson, K.; Head-Gordon, M.; Schrader, P.; Wilson, K.; Michelsen, H. Resonance-stabilized hydrocarbon-radical chain reactions may explain soot inception and growth. Science 2018, 361, 997–1000. [Google Scholar] [CrossRef] [PubMed]
  42. Elvati, P.; Violi, A. Homo-dimerization of oxygenated polycyclic aromatic hydrocarbons under flame conditions. Fuel 2018, 222, 307–311. [Google Scholar] [CrossRef]
  43. Leon, G.; Martin, J.W.; Bringley, E.J.; Akroyd, J.; Kraft, M. The role of oxygenated species in the growth of graphene, fullerenes and carbonaceous particles. Carbon 2021, 182, 203–213. [Google Scholar] [CrossRef]
  44. Hu, M.; Ye, Z.; Zhang, Q.; Xue, Q.; Li, Z.; Wang, J.; Pan, Z. Towards understanding the chemical reactions between KOH and oxygen-containing groups during KOH-catalyzed pyrolysis of biomass. Fuel 2022, 245, 123286. [Google Scholar] [CrossRef]
  45. Otte, D.A.L.; Borchmann, D.E.; Lin, C.; Weck, M.; Woerpel, K.A. 13C NMR spectroscopy for the quantitative determination of compound ratios and polymer end groups. Org. Lett. 2014, 16, 1566–1569. [Google Scholar] [CrossRef] [PubMed]
  46. Eiliazadeh, B.; Briscoe, B.J.; Sheng, Y.; Pitt, K. Investigating density distributions for tablets of different geometry during the compaction of pharmaceuticals. Part. Sci. Technol. 2003, 21, 303–316. [Google Scholar] [CrossRef]
  47. Tonga, M. Effect of π–conjugation on aggregation–induced emission of α–cyanostilbene incorporated polycyclic aromatic hydrocarbons. J. Photochem. Photobio. A 2021, 412, 113247. [Google Scholar] [CrossRef]
  48. Khabazipour, M.; Anbia, M. Removal of Hydrogen Sulfide from Gas Streams Using Porous Materials: A Review. Ind. Eng. Chem. Res. 2019, 58, 22133–22164. [Google Scholar] [CrossRef]
  49. Feng, W.; Kwon, S.; Borguet, E.; Vidic, R. Adsorption of hydrogen sulfide onto activated carbon fibers: Effect of pore structure and surface chemistry. Environ. Sci. Technol. 2005, 39, 9744–9749. [Google Scholar] [CrossRef] [PubMed]
  50. Zhang, Z.; Wang, J.; Li, W.; Wang, M.; Qiao, W.; Long, D.; Ling, L. Millimeter-sized mesoporous carbon spheres for highly efficient catalytic oxidation of hydrogen sulfide at room temperature. Carbon 2016, 96, 608–615. [Google Scholar] [CrossRef]
  51. Morishige, K.; Kawai, T.; Kittaka, S. Capillary condensation of water in mesoporous carbon. J. Phys. Chem. C 2014, 118, 4664–4669. [Google Scholar] [CrossRef]
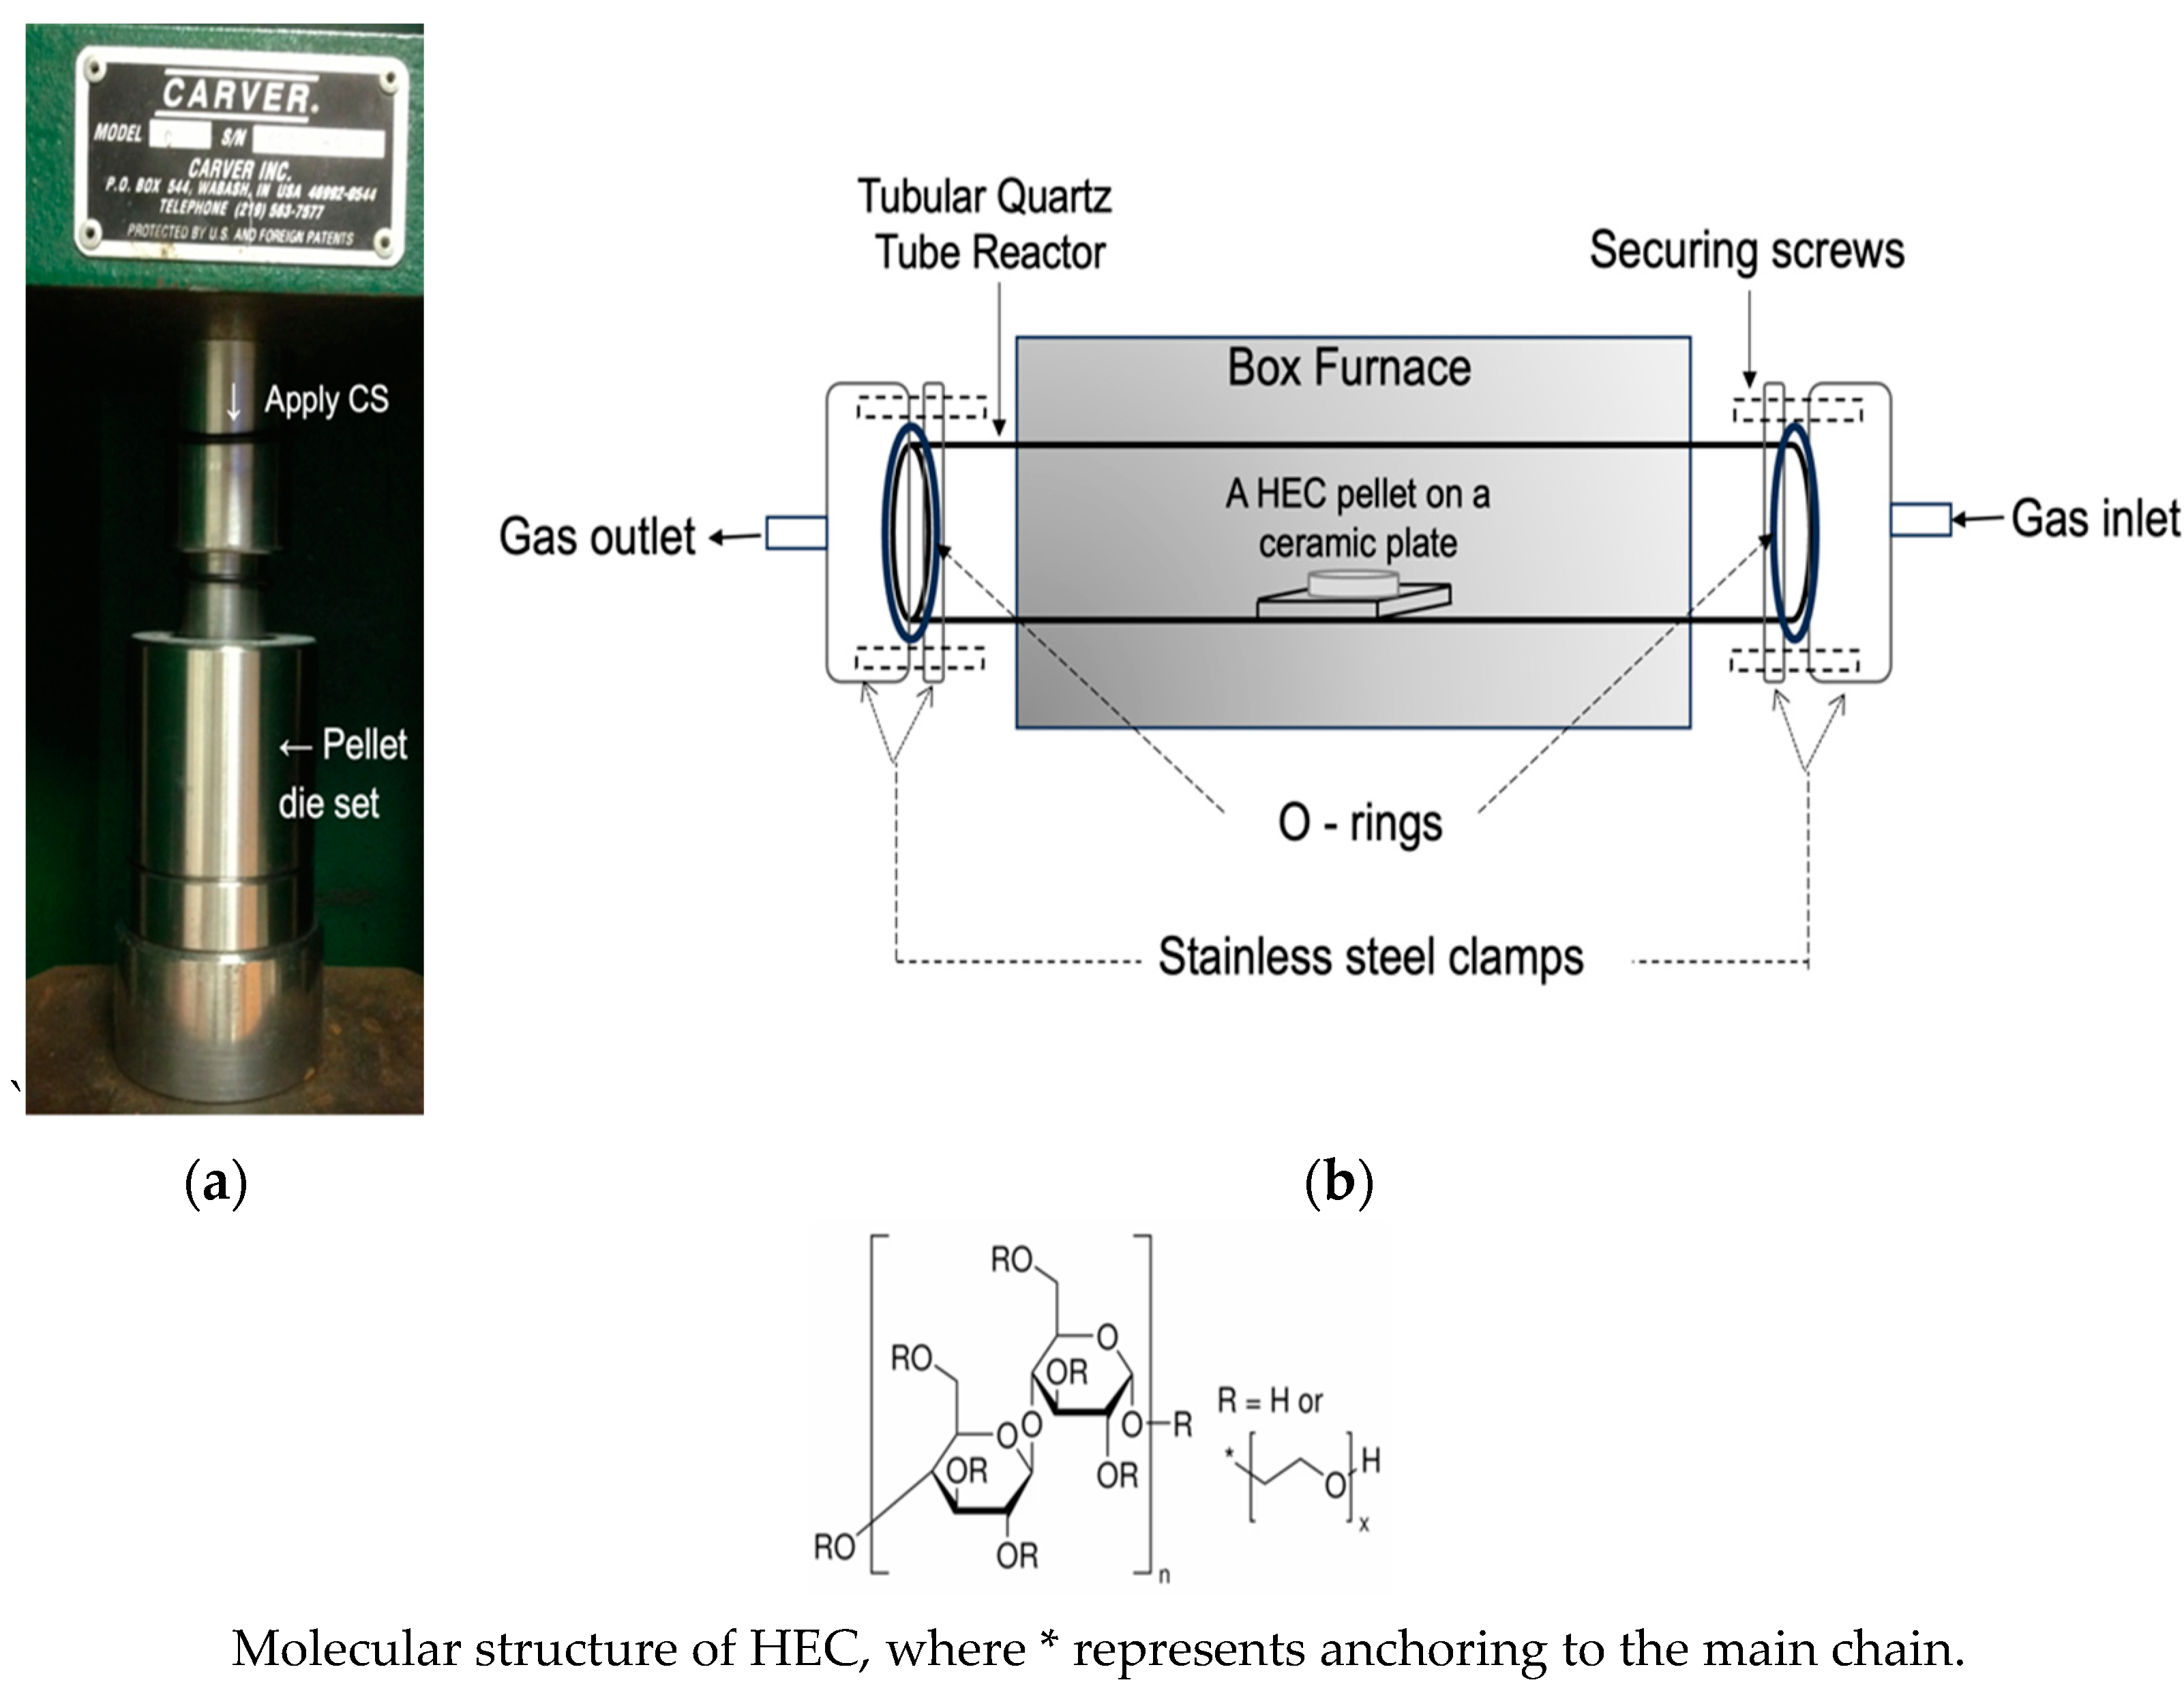
Figure 1. (a) Preparation of HEC pellet using a manual hydraulic press. (b) Schematic illustration of the setup for converting HEC pellets to their AC specimens, respectively.
Carbon 10 00043 g001
Figure 2. The images showcase a 5-8-15-AC slab, referring to the sample naming system described in the paragraph below, for illustrating the outcomes of the calcination activation process.
Carbon 10 00043 g002
Figure 3. Infrared spectra of the carbonaceous substances obtained from pyrolysis at 400 °C, in which the vertical axis is transmittance (↑). Inset (right): an expansion of the aromatic C=C stretching bands, with curve arrows indicating the blue shift observed in 5-8-15-C and 2.5-8-15-C.
Carbon 10 00043 g003
Figure 4. The deconvoluted C1s peaks of the two selected carbonaceous samples, where pink for C-C/C=C, green for C-O, blue for C=O, and purple for COO groups, respectively.
Carbon 10 00043 g004
Figure 5. Carbon-13 NMR spectra of the selected carbonaceous substance samples.
Carbon 10 00043 g005
Figure 6. Adsorption isotherms of the AC samples reported in Table 4.
Carbon 10 00043 g006
Figure 7. FESEM images of carbonaceous substances with the “C” suffix and their corresponding activated carbons with the “AC” suffix.
Carbon 10 00043 g007aCarbon 10 00043 g007b
Figure 8. NLDFT pore-size distribution plots of desorption dV(D)/dD, expressed as dV(D), versus pore diameter (D) of the AC samples obtained from the calcination activation of their corresponding carbonaceous substances.
Carbon 10 00043 g008
Figure 9. The H2S adsorption breakthrough curves of the selected AC samples.
Carbon 10 00043 g009
Table 1. The preparation conditions designed for the fabrication of HEC pellets.
HEC SampleThickness, x/mm∆x a∆x/xref %Tap Density (25 °C)/g·cm−3
Powder---1.14 b
5-2-15-Pref5.69001.15
5-8-15-P5.250.447.731.24
5-8-60-P5.140.559.671.27
2.5-2-15-Pref2.79001.17
2.5-8-15-P2.650.145.021.22
2.5-8-60-P2.560.238.241.27
a In the context of ∆x = |x − xref|, two reference samples, fabricated using the lowest compressive stress, were designated to evaluate the thickness of pellets produced under higher pressures. b According to vender’s website.
Table 2. The composition of the carbon-derived species present in the carbonaceous substances *.
Carbonaceous SubstancesAtomic %
C-C and C=CC-OC=OCOO
2.5-2-15-C63.824.46.64.7
2.5-8-15-C59.718.513.66.1
2.5-8-60-C62.228.83.54.0
5-2-15-C53.434.06.35.1
5-8-15-C64.825.33.55.0
5-8-60-C63.321.810.33.6
5-0-0-C/2.5-0-0-C75.314.06.53.1
* They were determined by the deconvolution of C 1s XPS spectra. The atomic % of plasmon is excluded.
Table 4. Classification of pore volumes of AC samples (refer to Section 2.3.1 for the experimental determination of the total and micropore volumes).
AC SampleVtotal (cc/g)Vmicro (cc/g)Vmeso (cc/g)Vmeso/Vtotal
5-0-0-AC0.350.240.110.32
5-8-15-AC0.860.510.350.41
5-8-60-AC1.170.600.570.49
2.5-8-15-AC1.431.080.350.24
2.5-8-60-AC1.300.460.840.65
Table 5. Correlation of the H2S removing efficacies of the AC samples with their porous characteristics.
AC SampleVtotal (cc/g)/Vmeso %Breakthrough
Time (min)
Breakthrough Capacity (mg/g)pH
5-0-0-AC0.35/3261.8613.010.3
5-8-15-AC0.86/4171.0913.710.0
5-8-60-AC1.17/4984.5516.19.7
2.5-8-15-AC1.43/2474.4414.38.8
2.5-8-60-AC1.30/65112.0021.69.6
Disclaimer/Publisher’s Note: The statements, opinions and data contained in all publications are solely those of the individual author(s) and contributor(s) and not of MDPI and/or the editor(s). MDPI and/or the editor(s) disclaim responsibility for any injury to people or property resulting from any ideas, methods, instructions or products referred to in the content.