
DANSR: A Tool for the Detection of Annotated and Novel Small RNAs

 , ,
, , 
Abstract
:1. Background
2. Results and Discussion
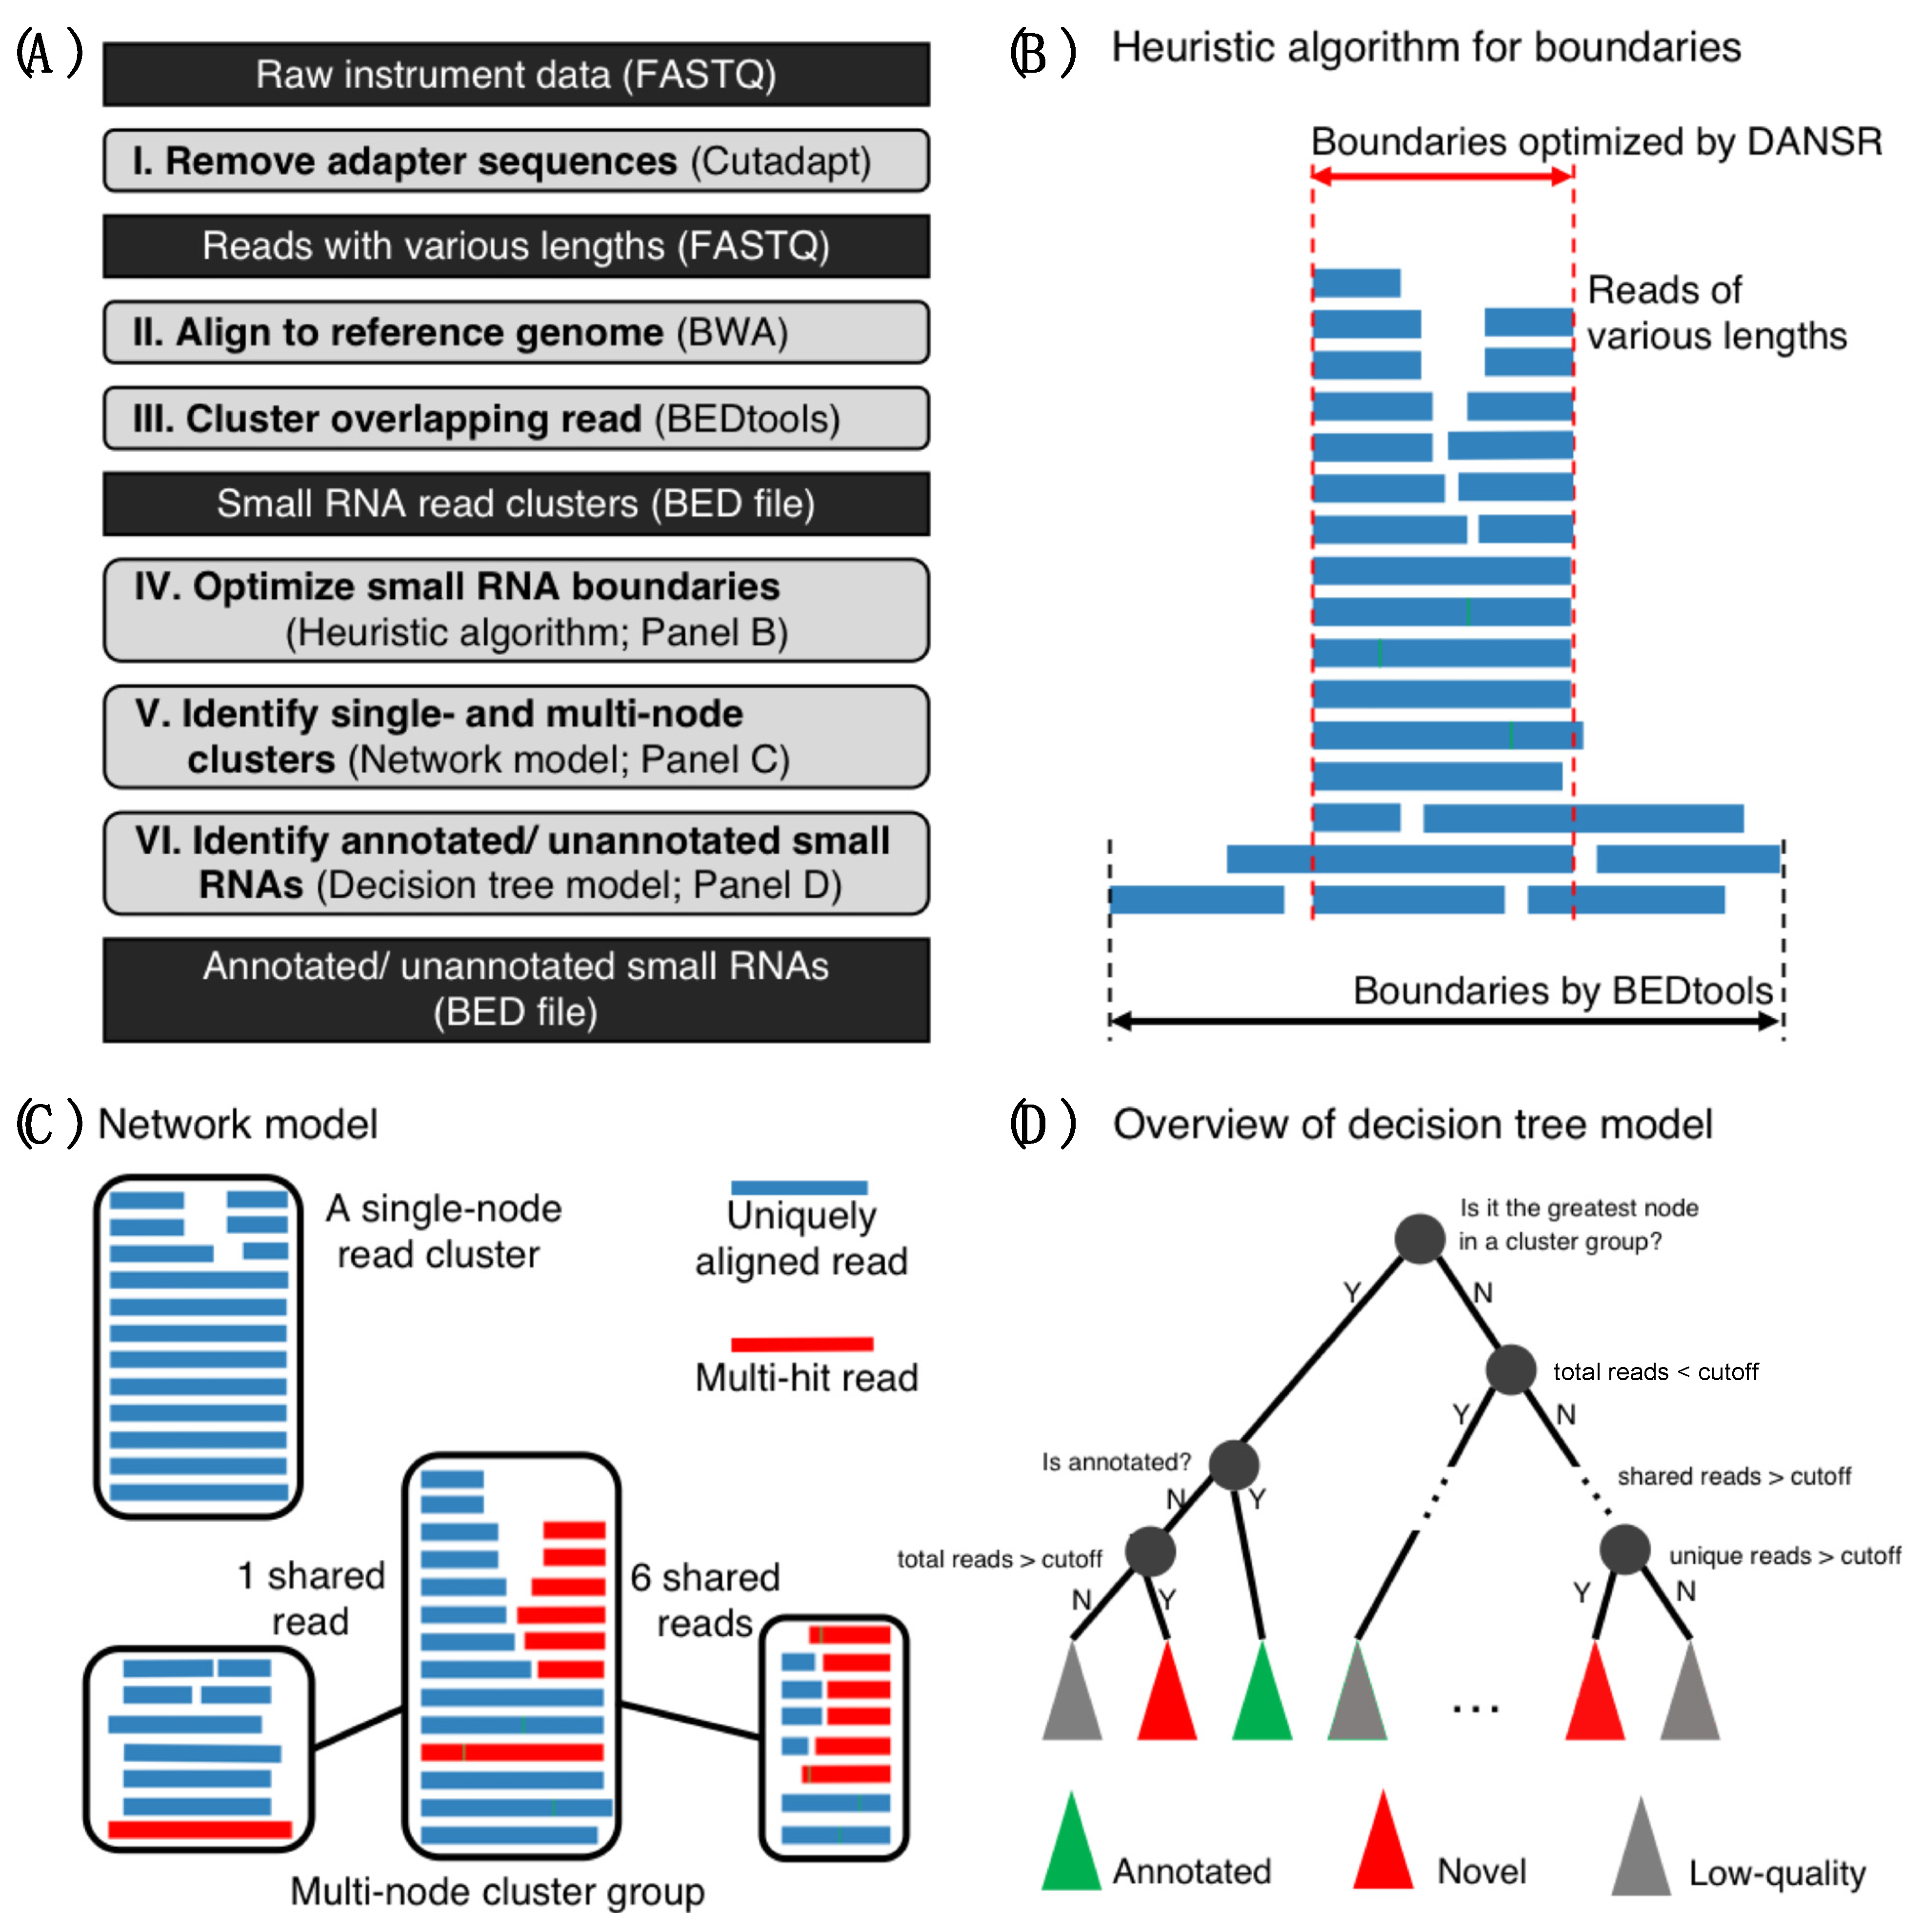
2.1. Overview of DANSR (Detection of Annotated and Novel Small RNAs)
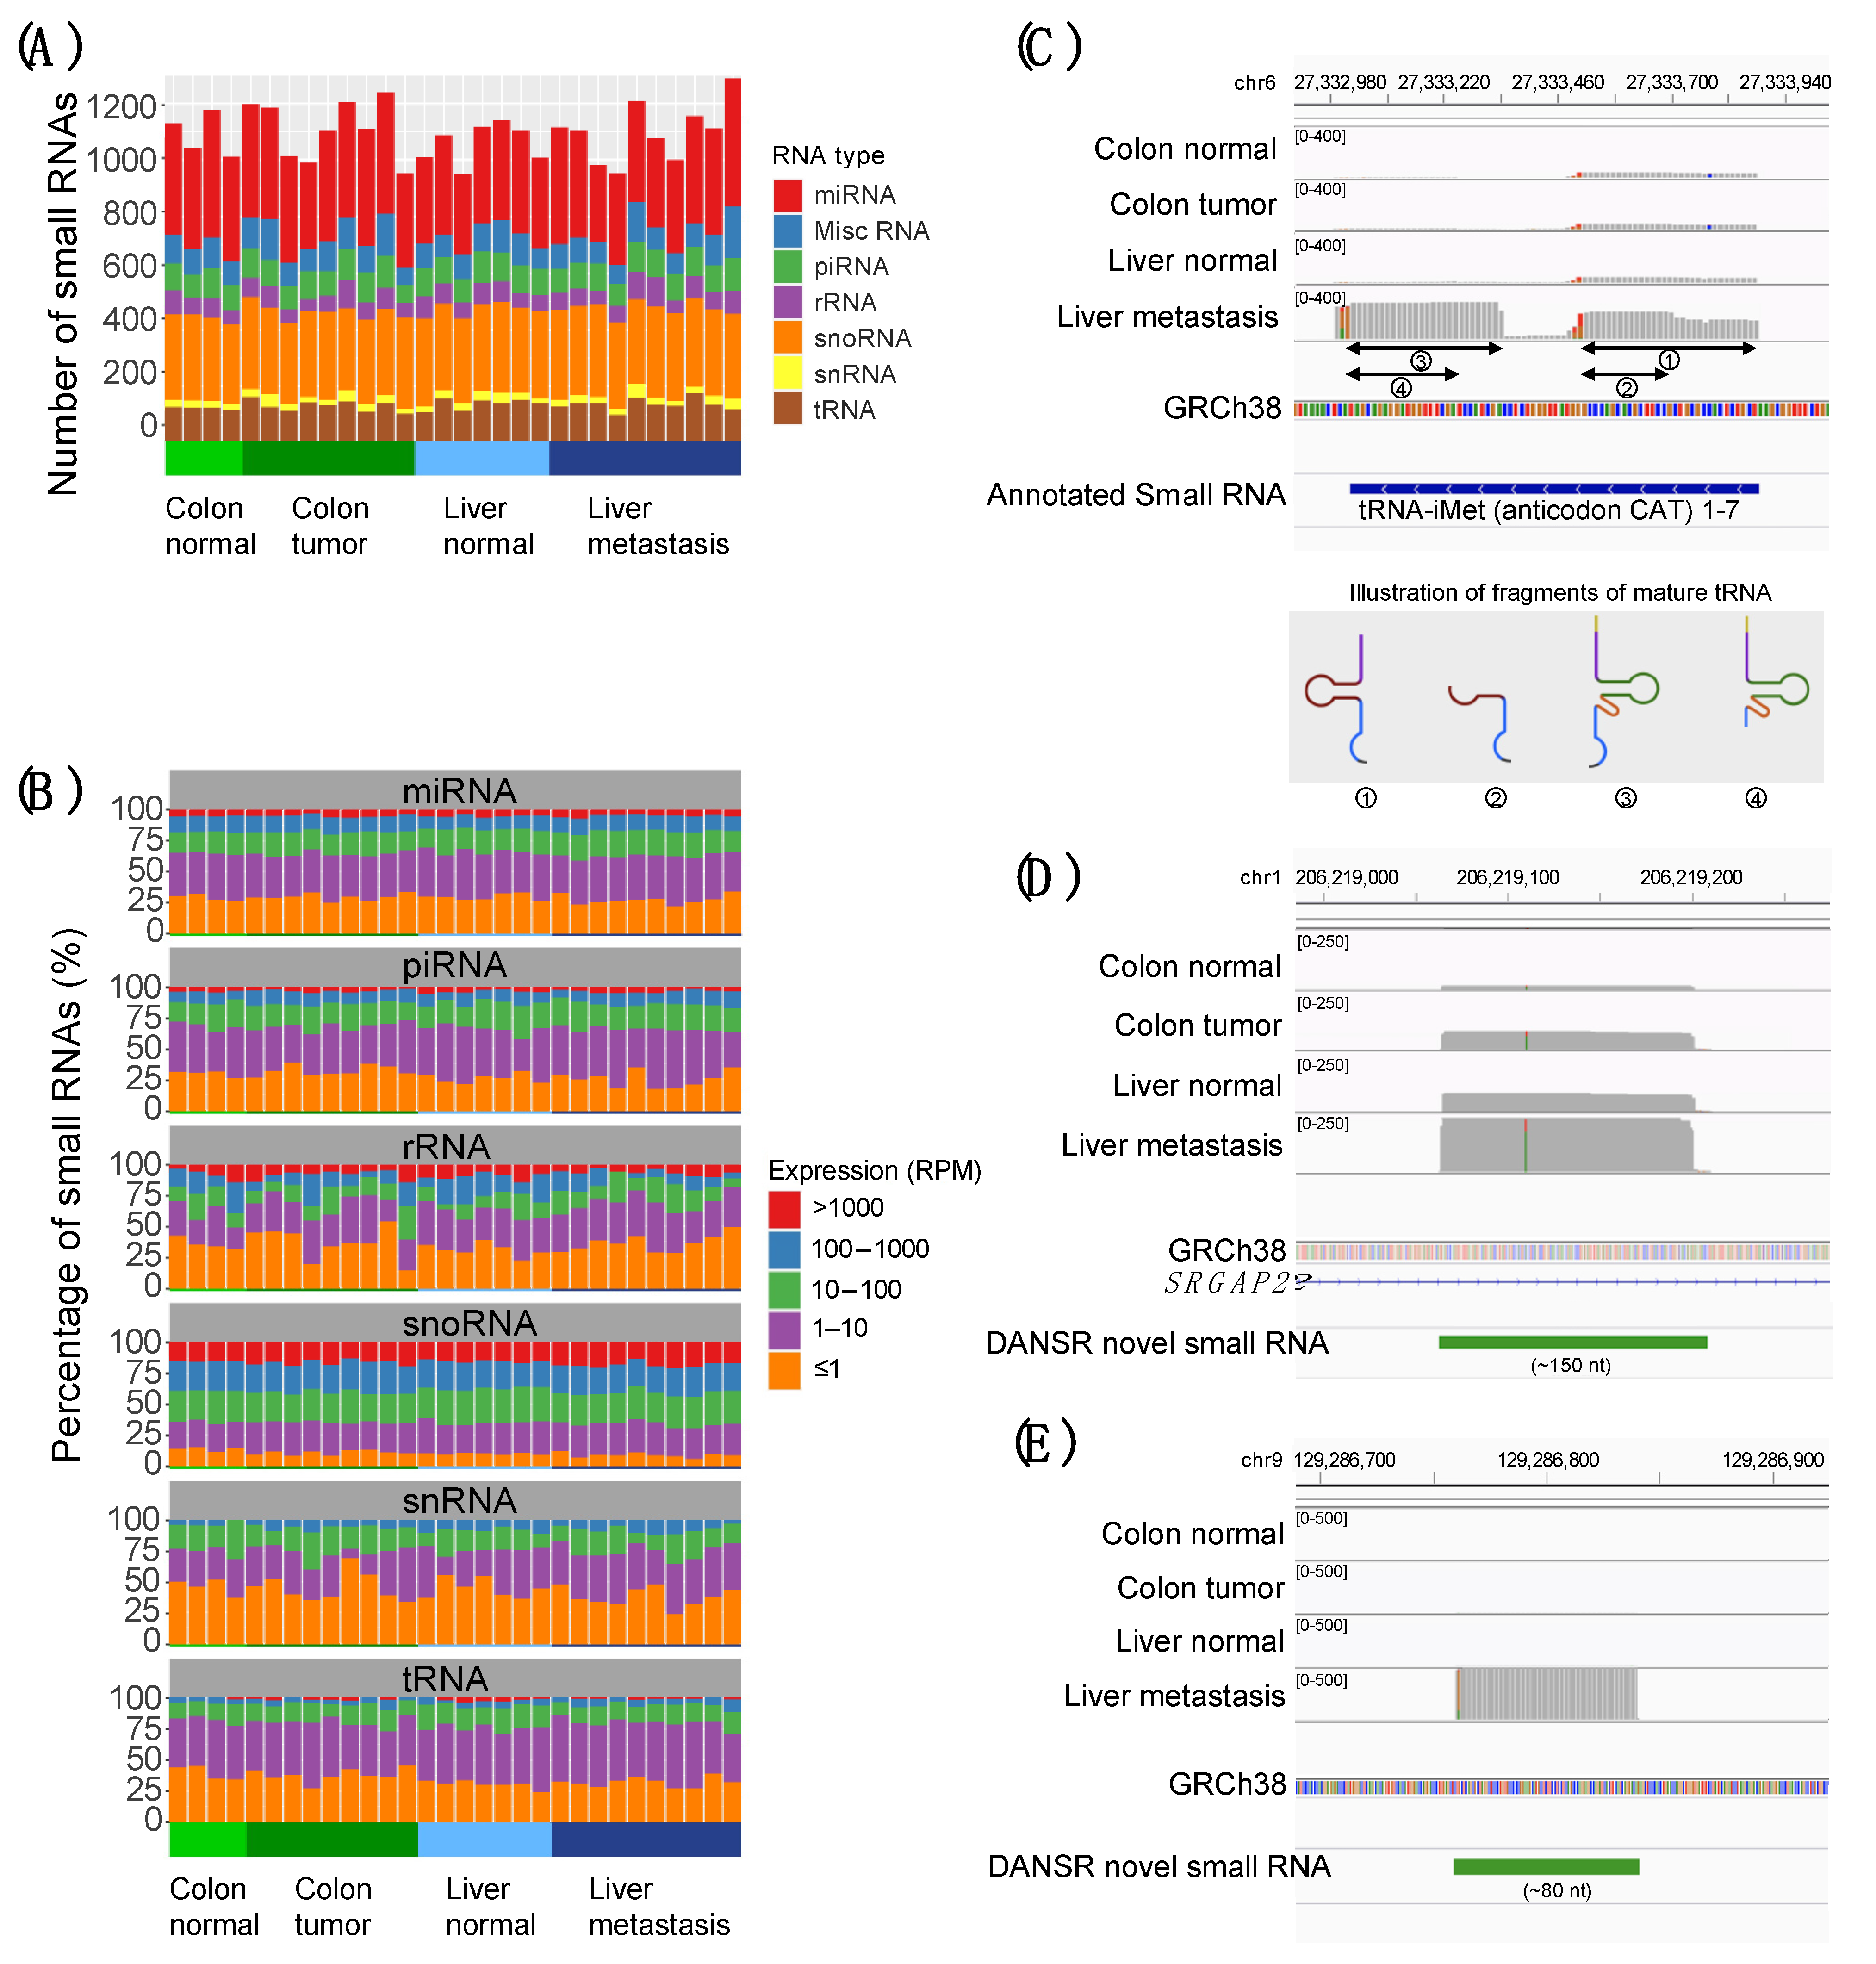
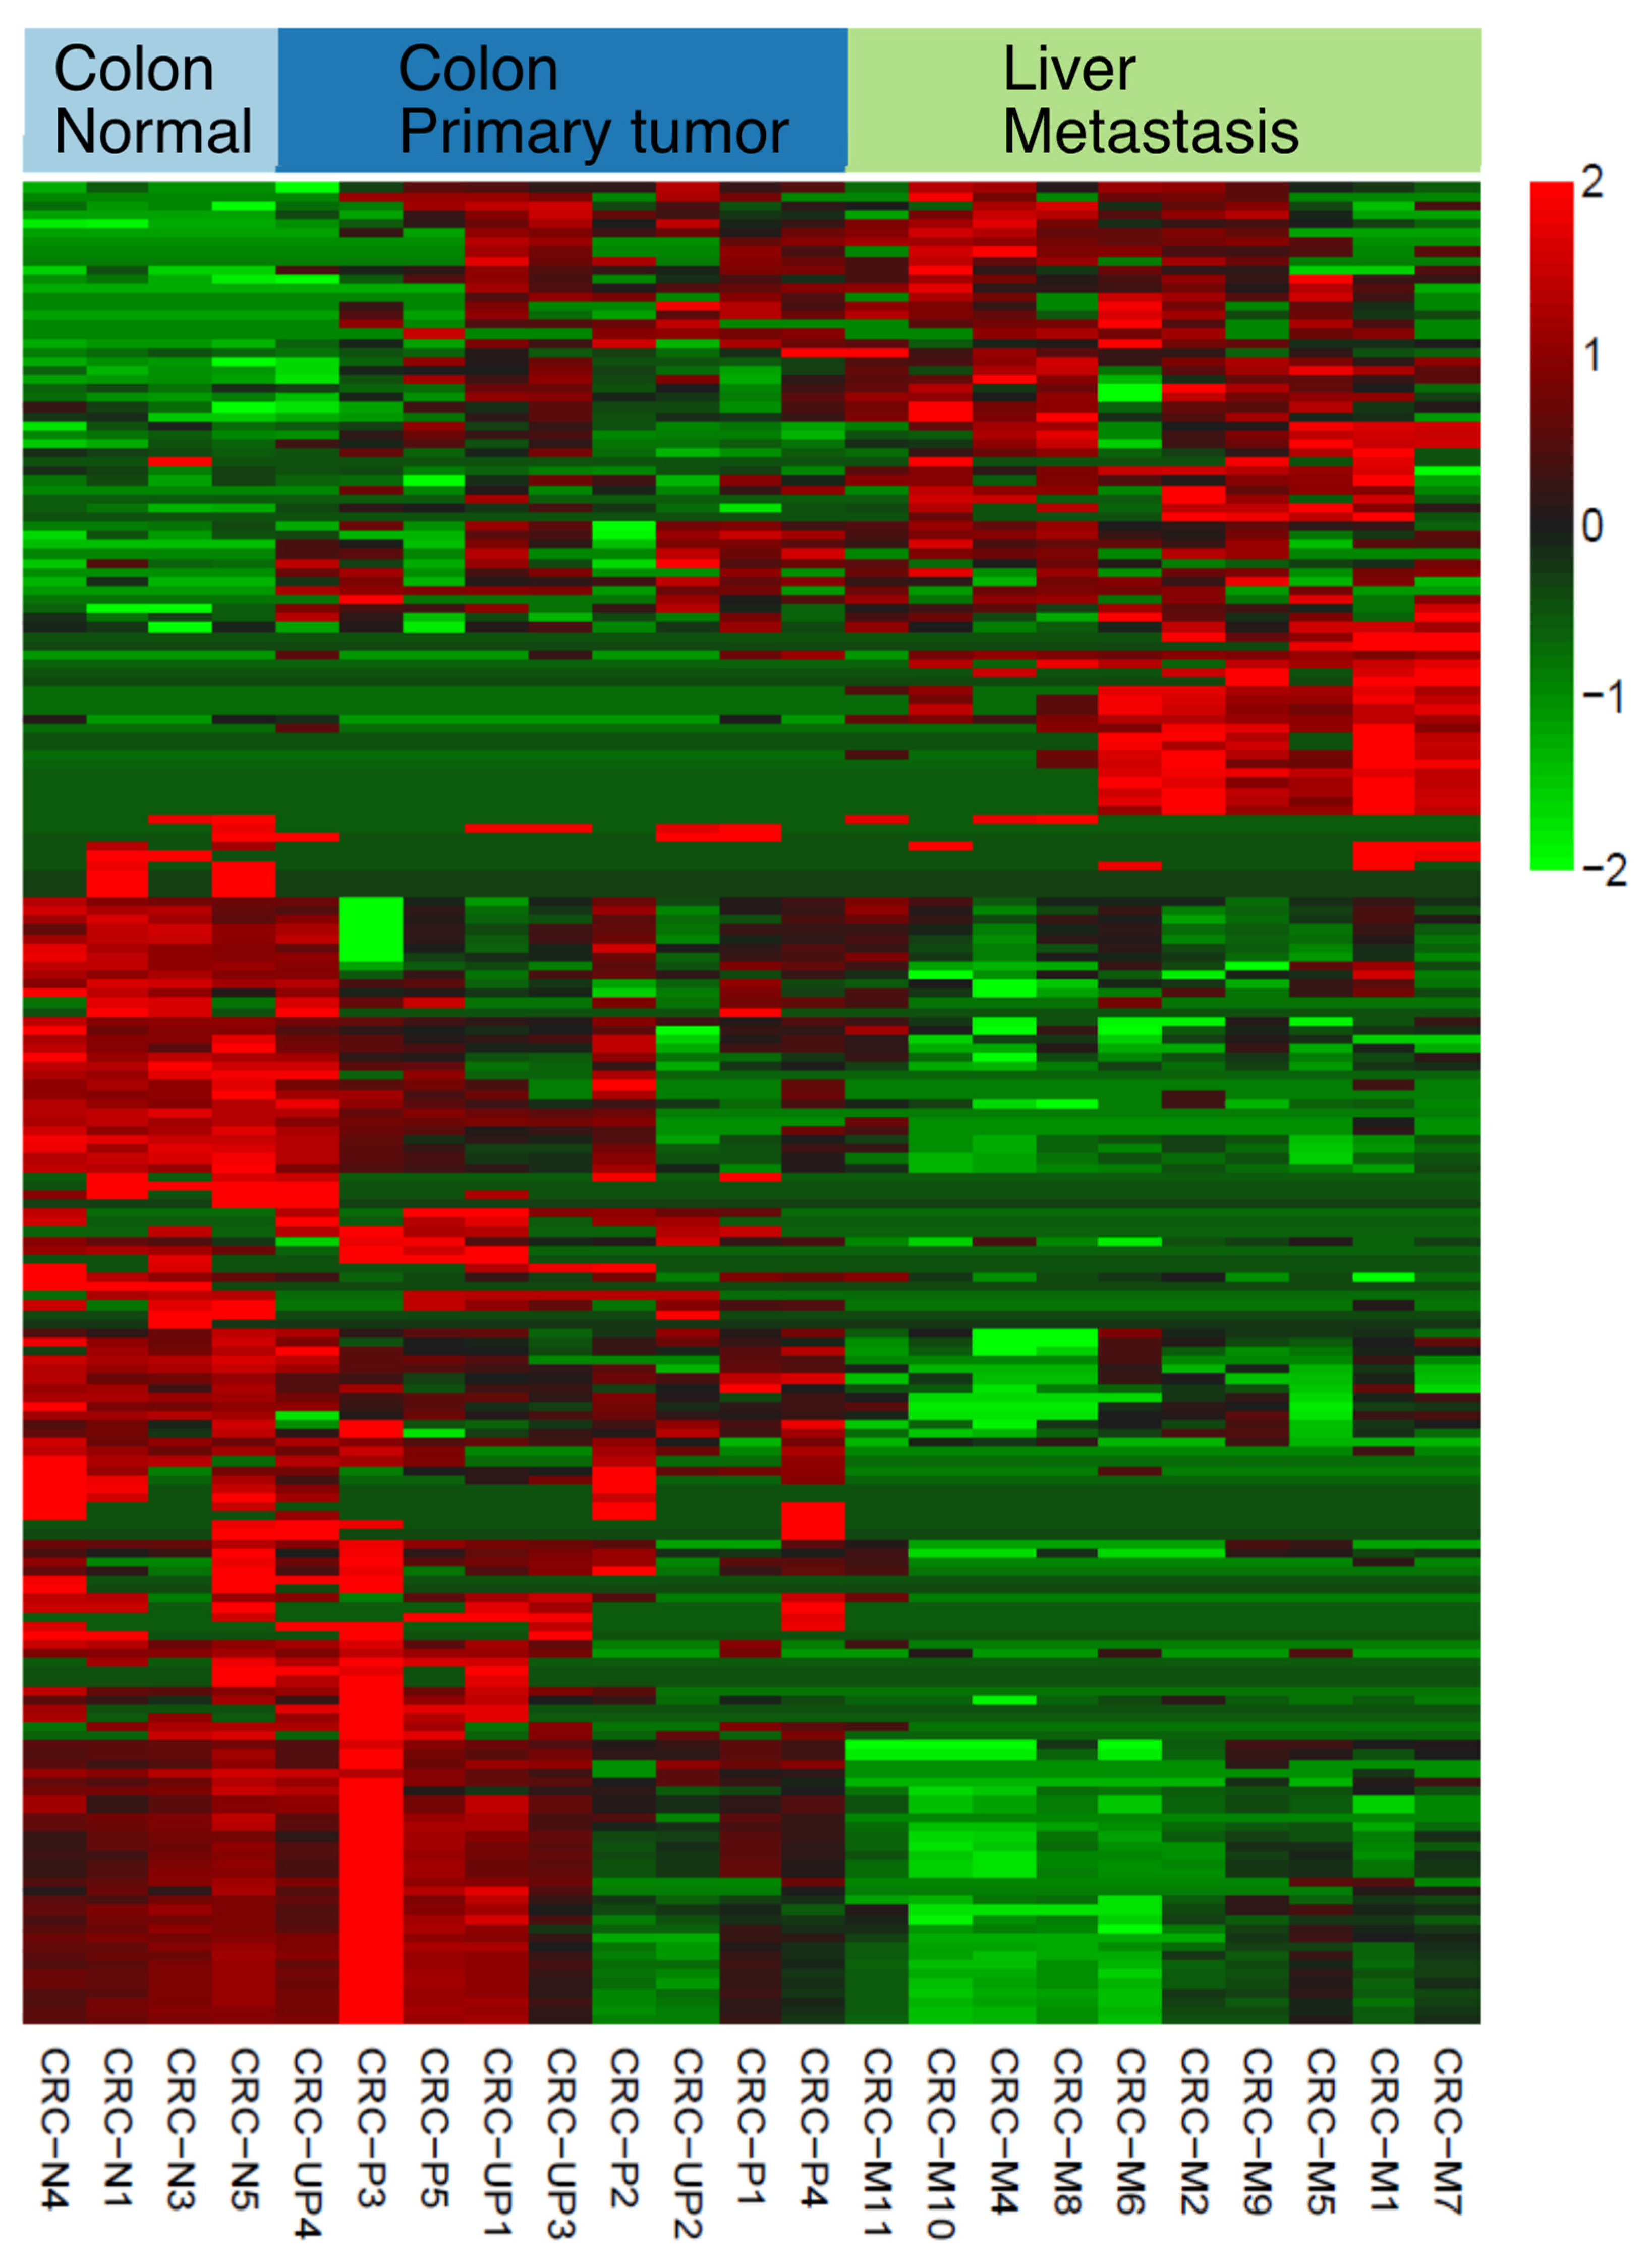
2.2. Discovery of Dysregulated and Novel Small RNA Expression in Colon Cancer Progression
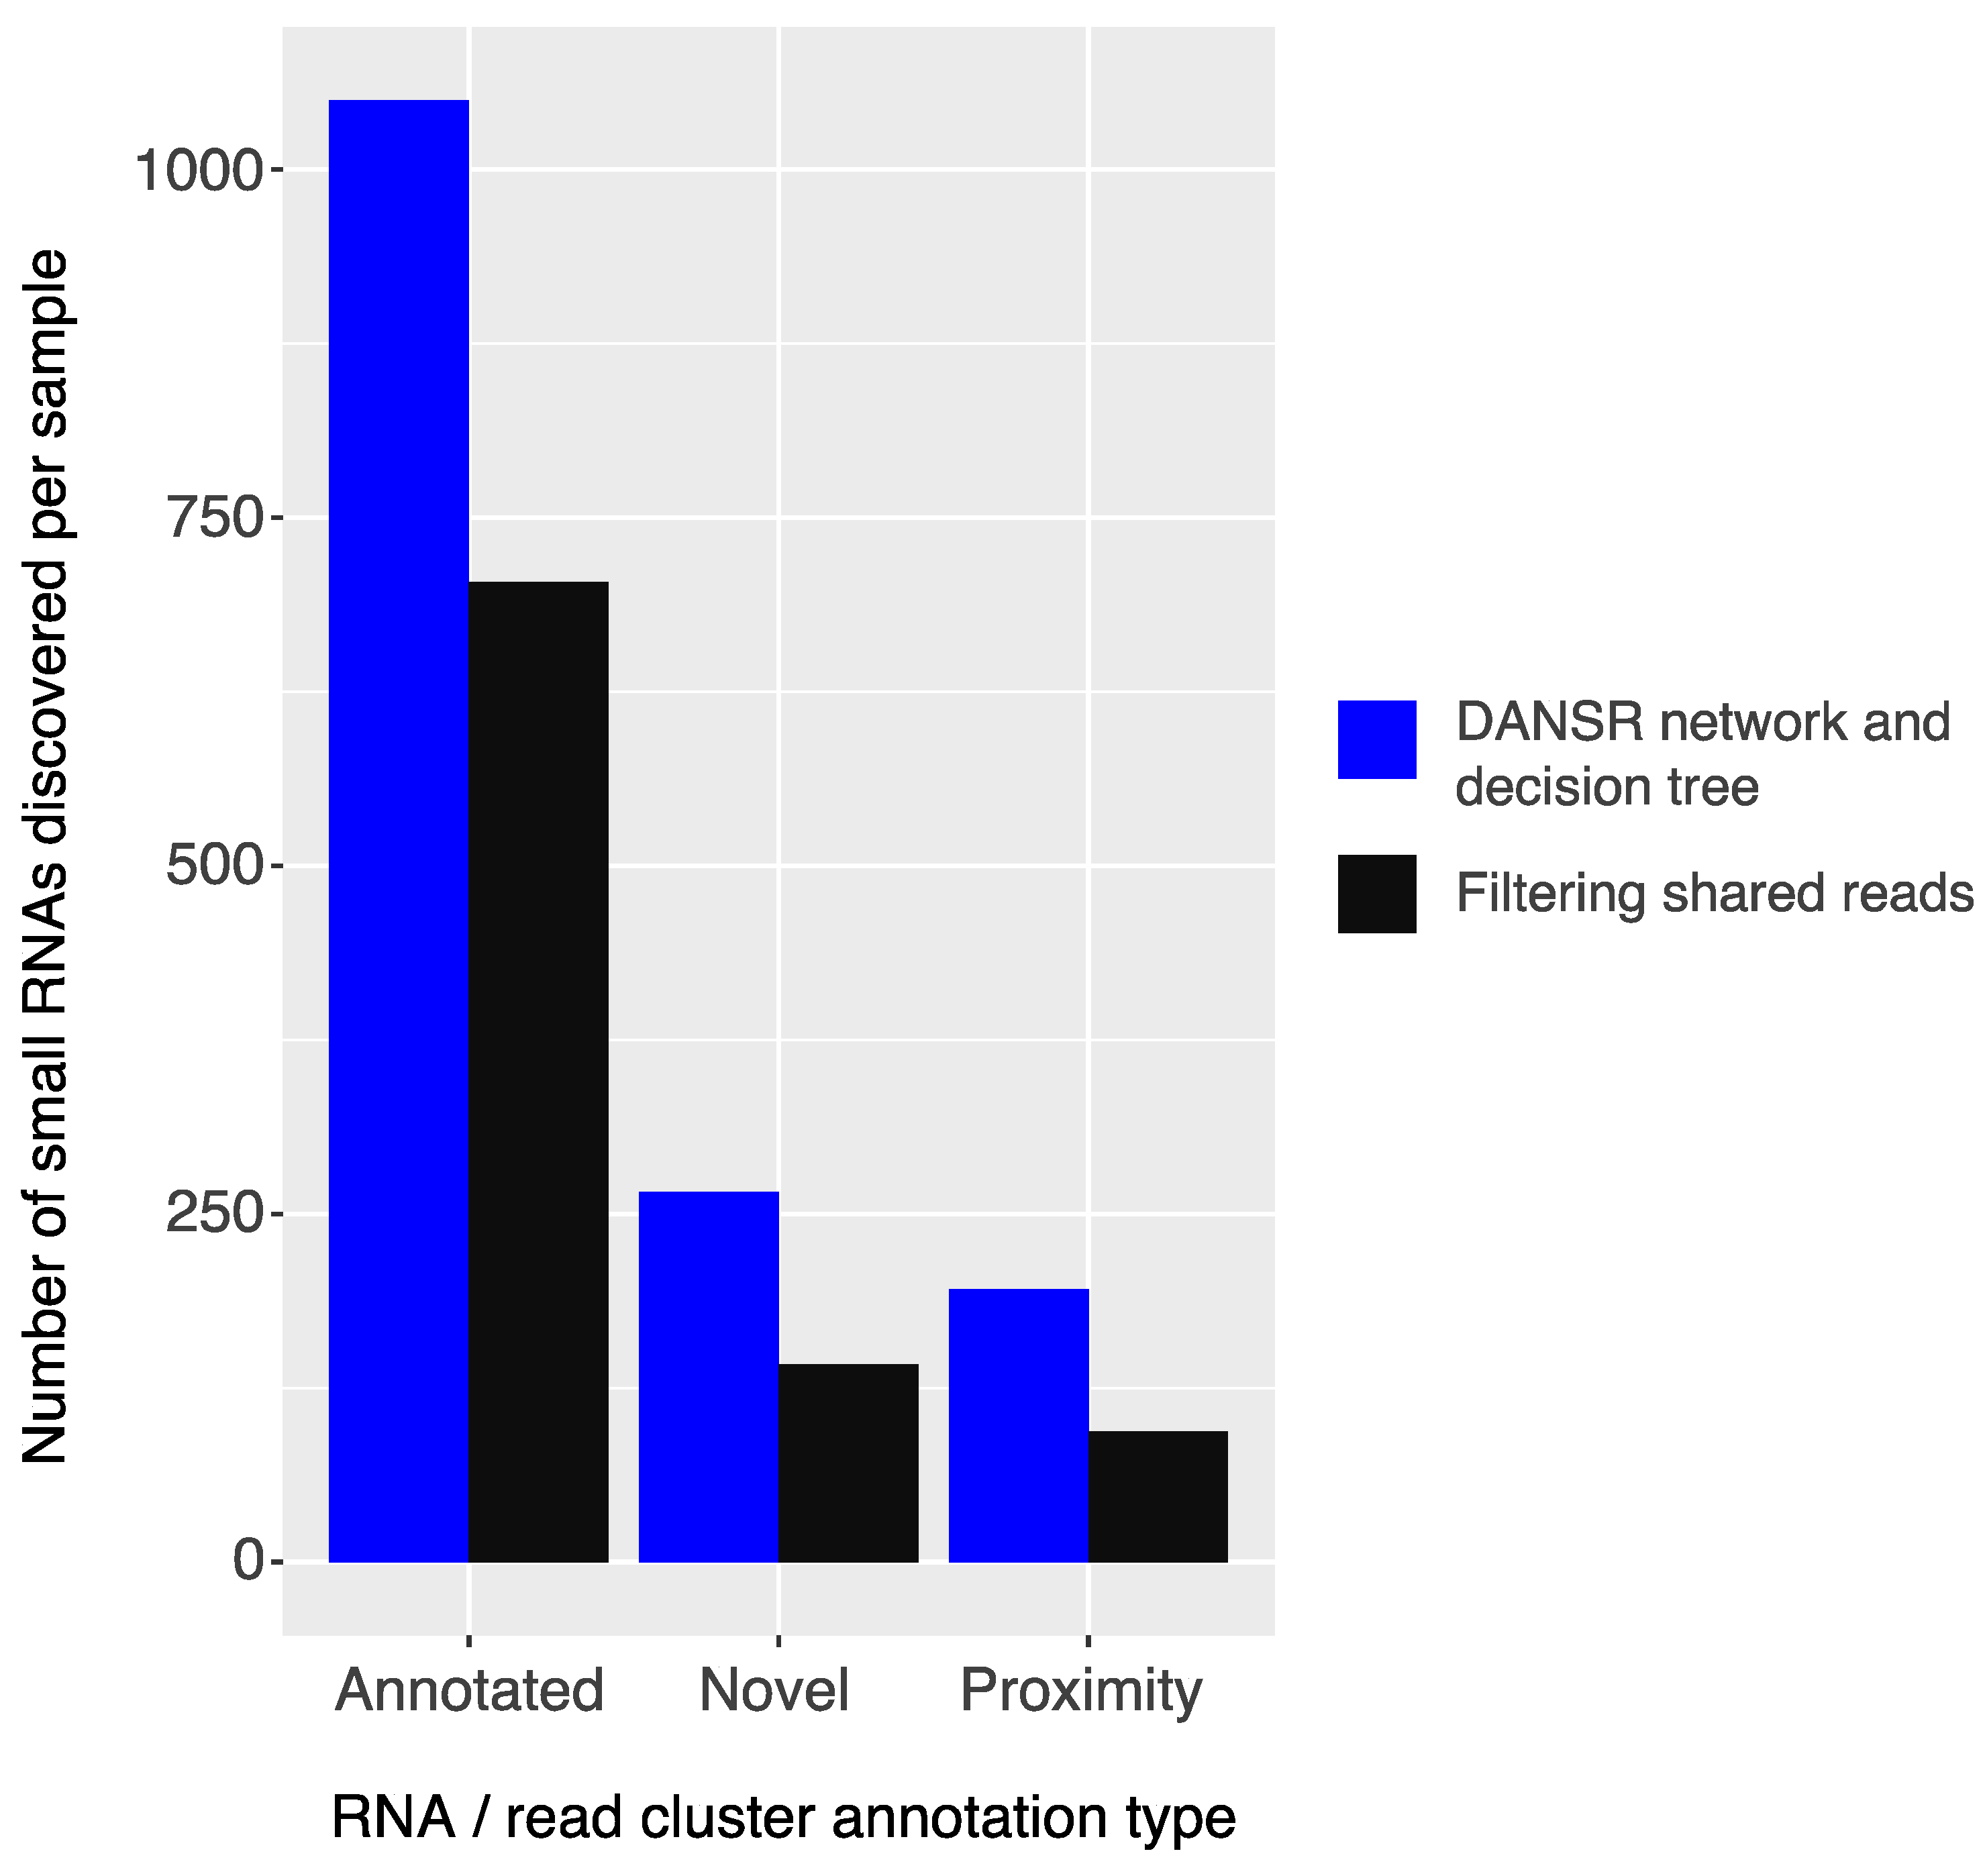
2.3. Comparison of Strategies for Utilizing Multi-Mapped Reads
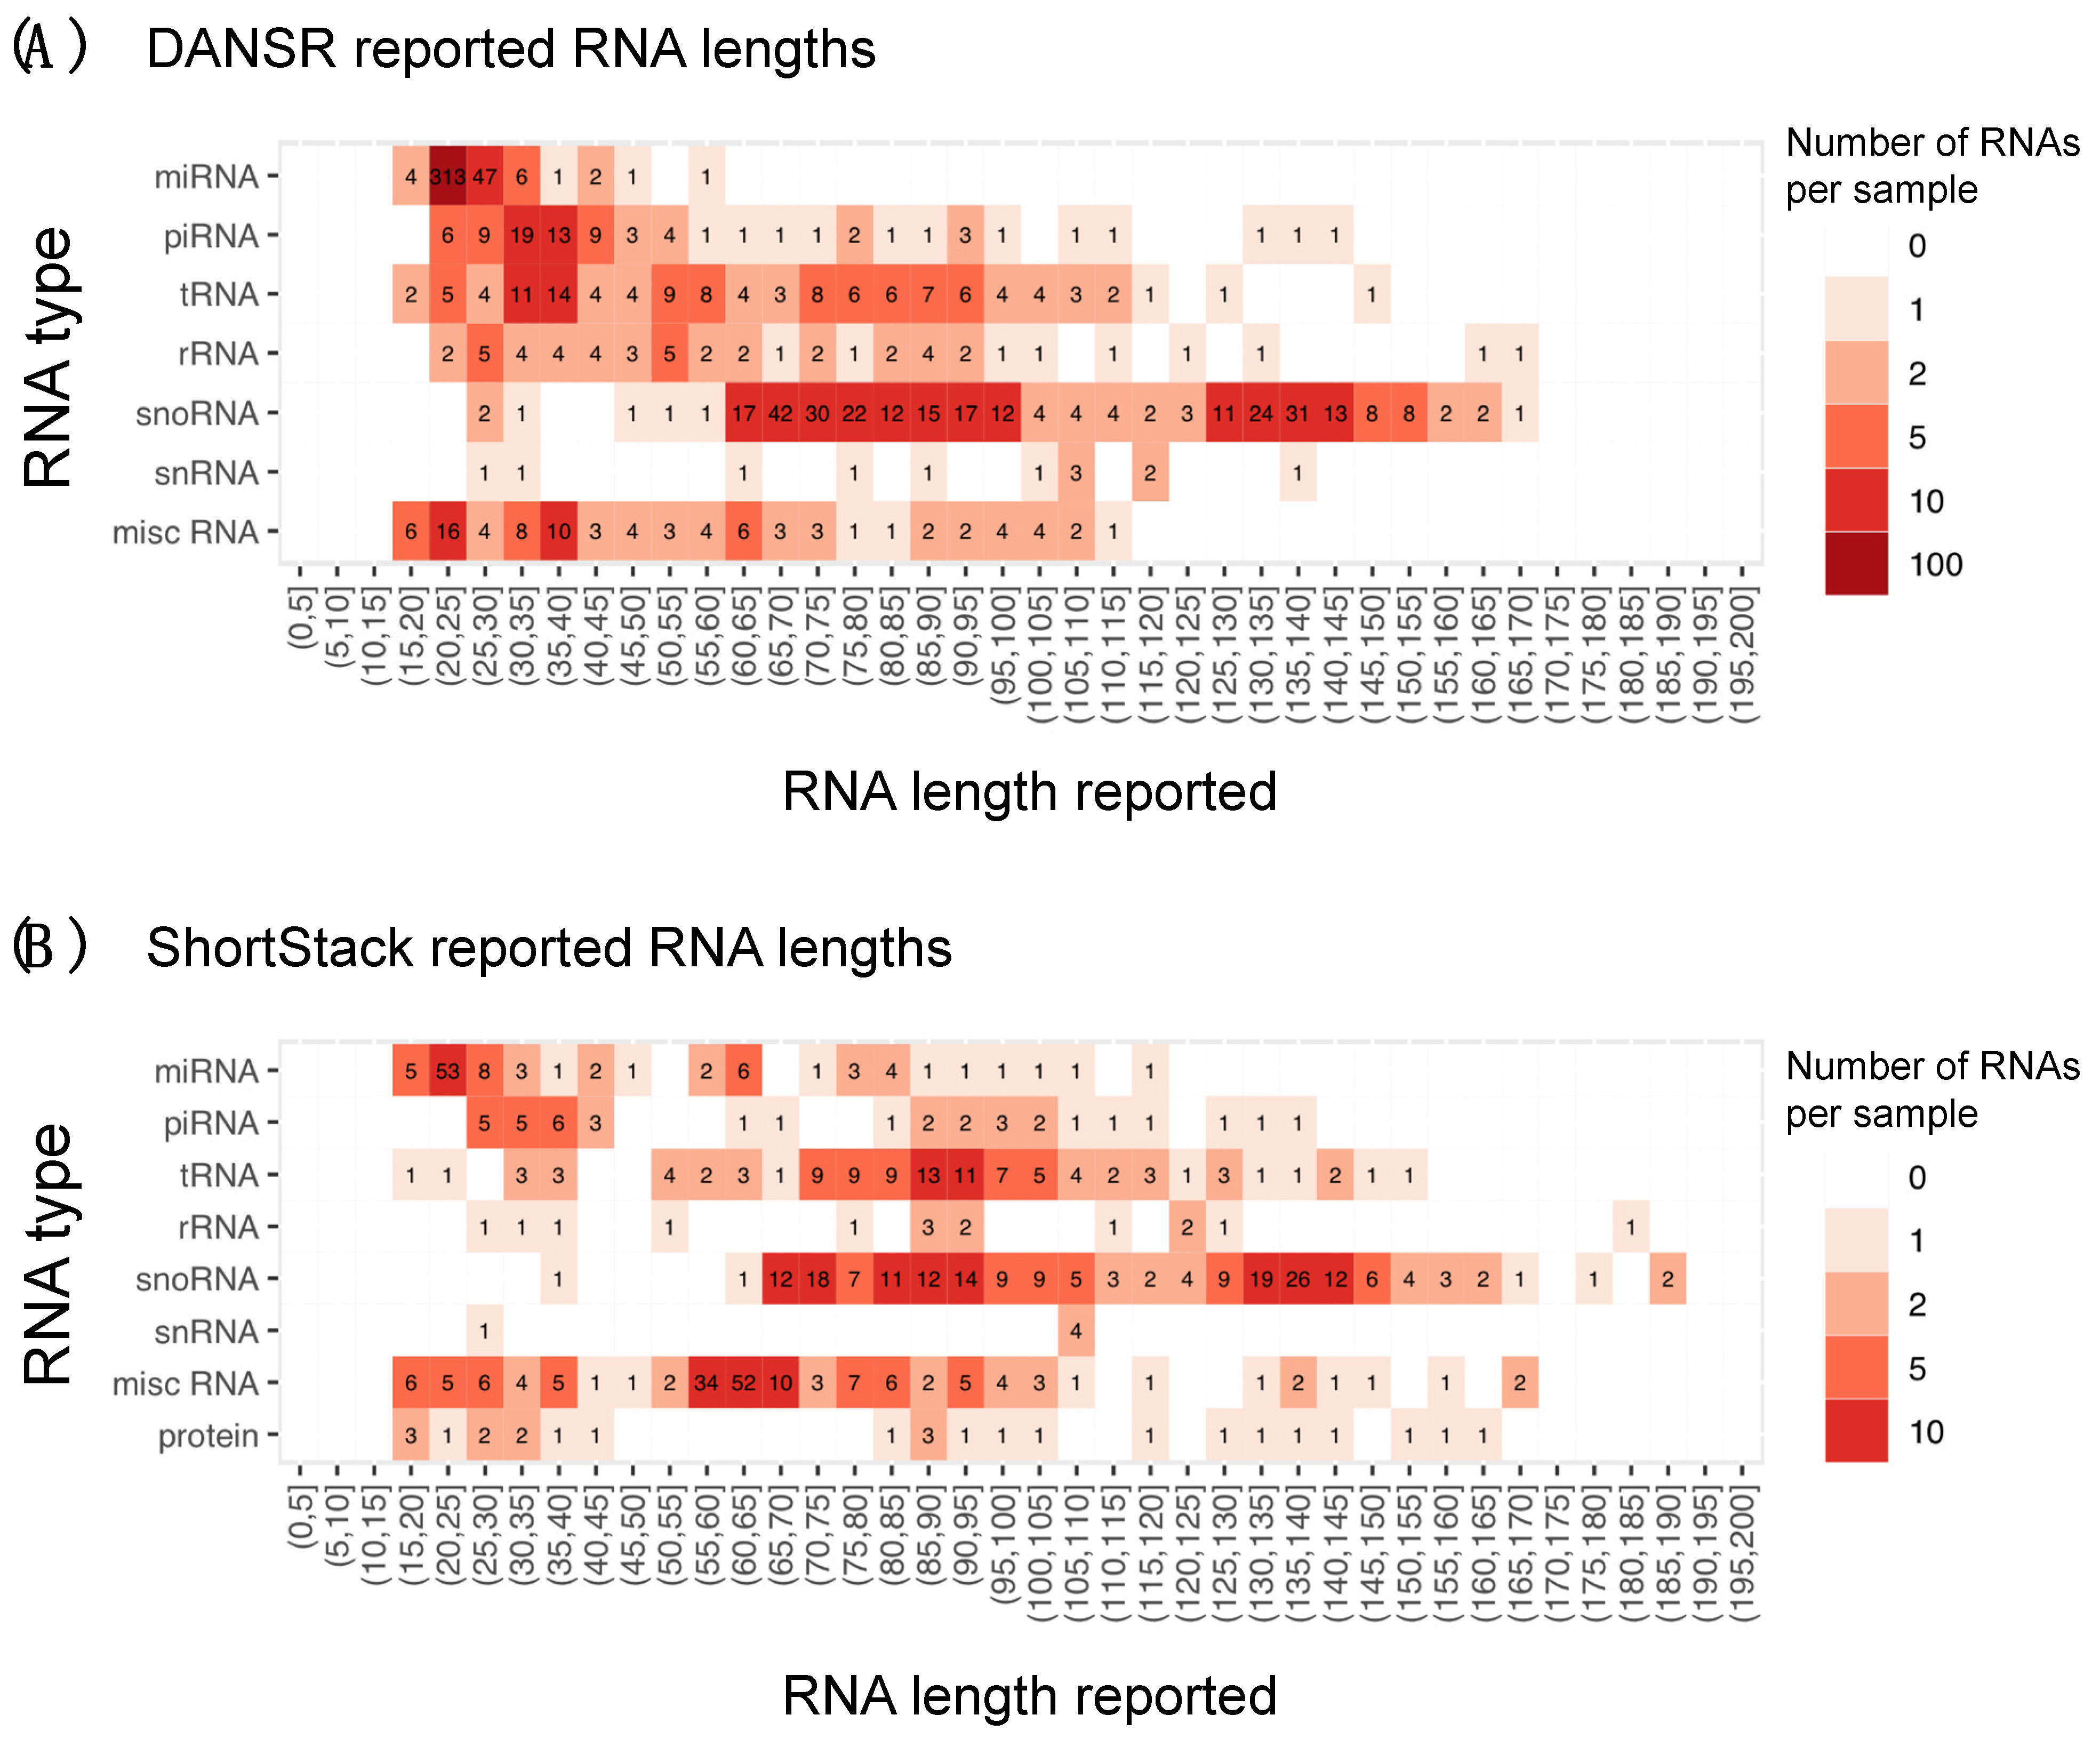
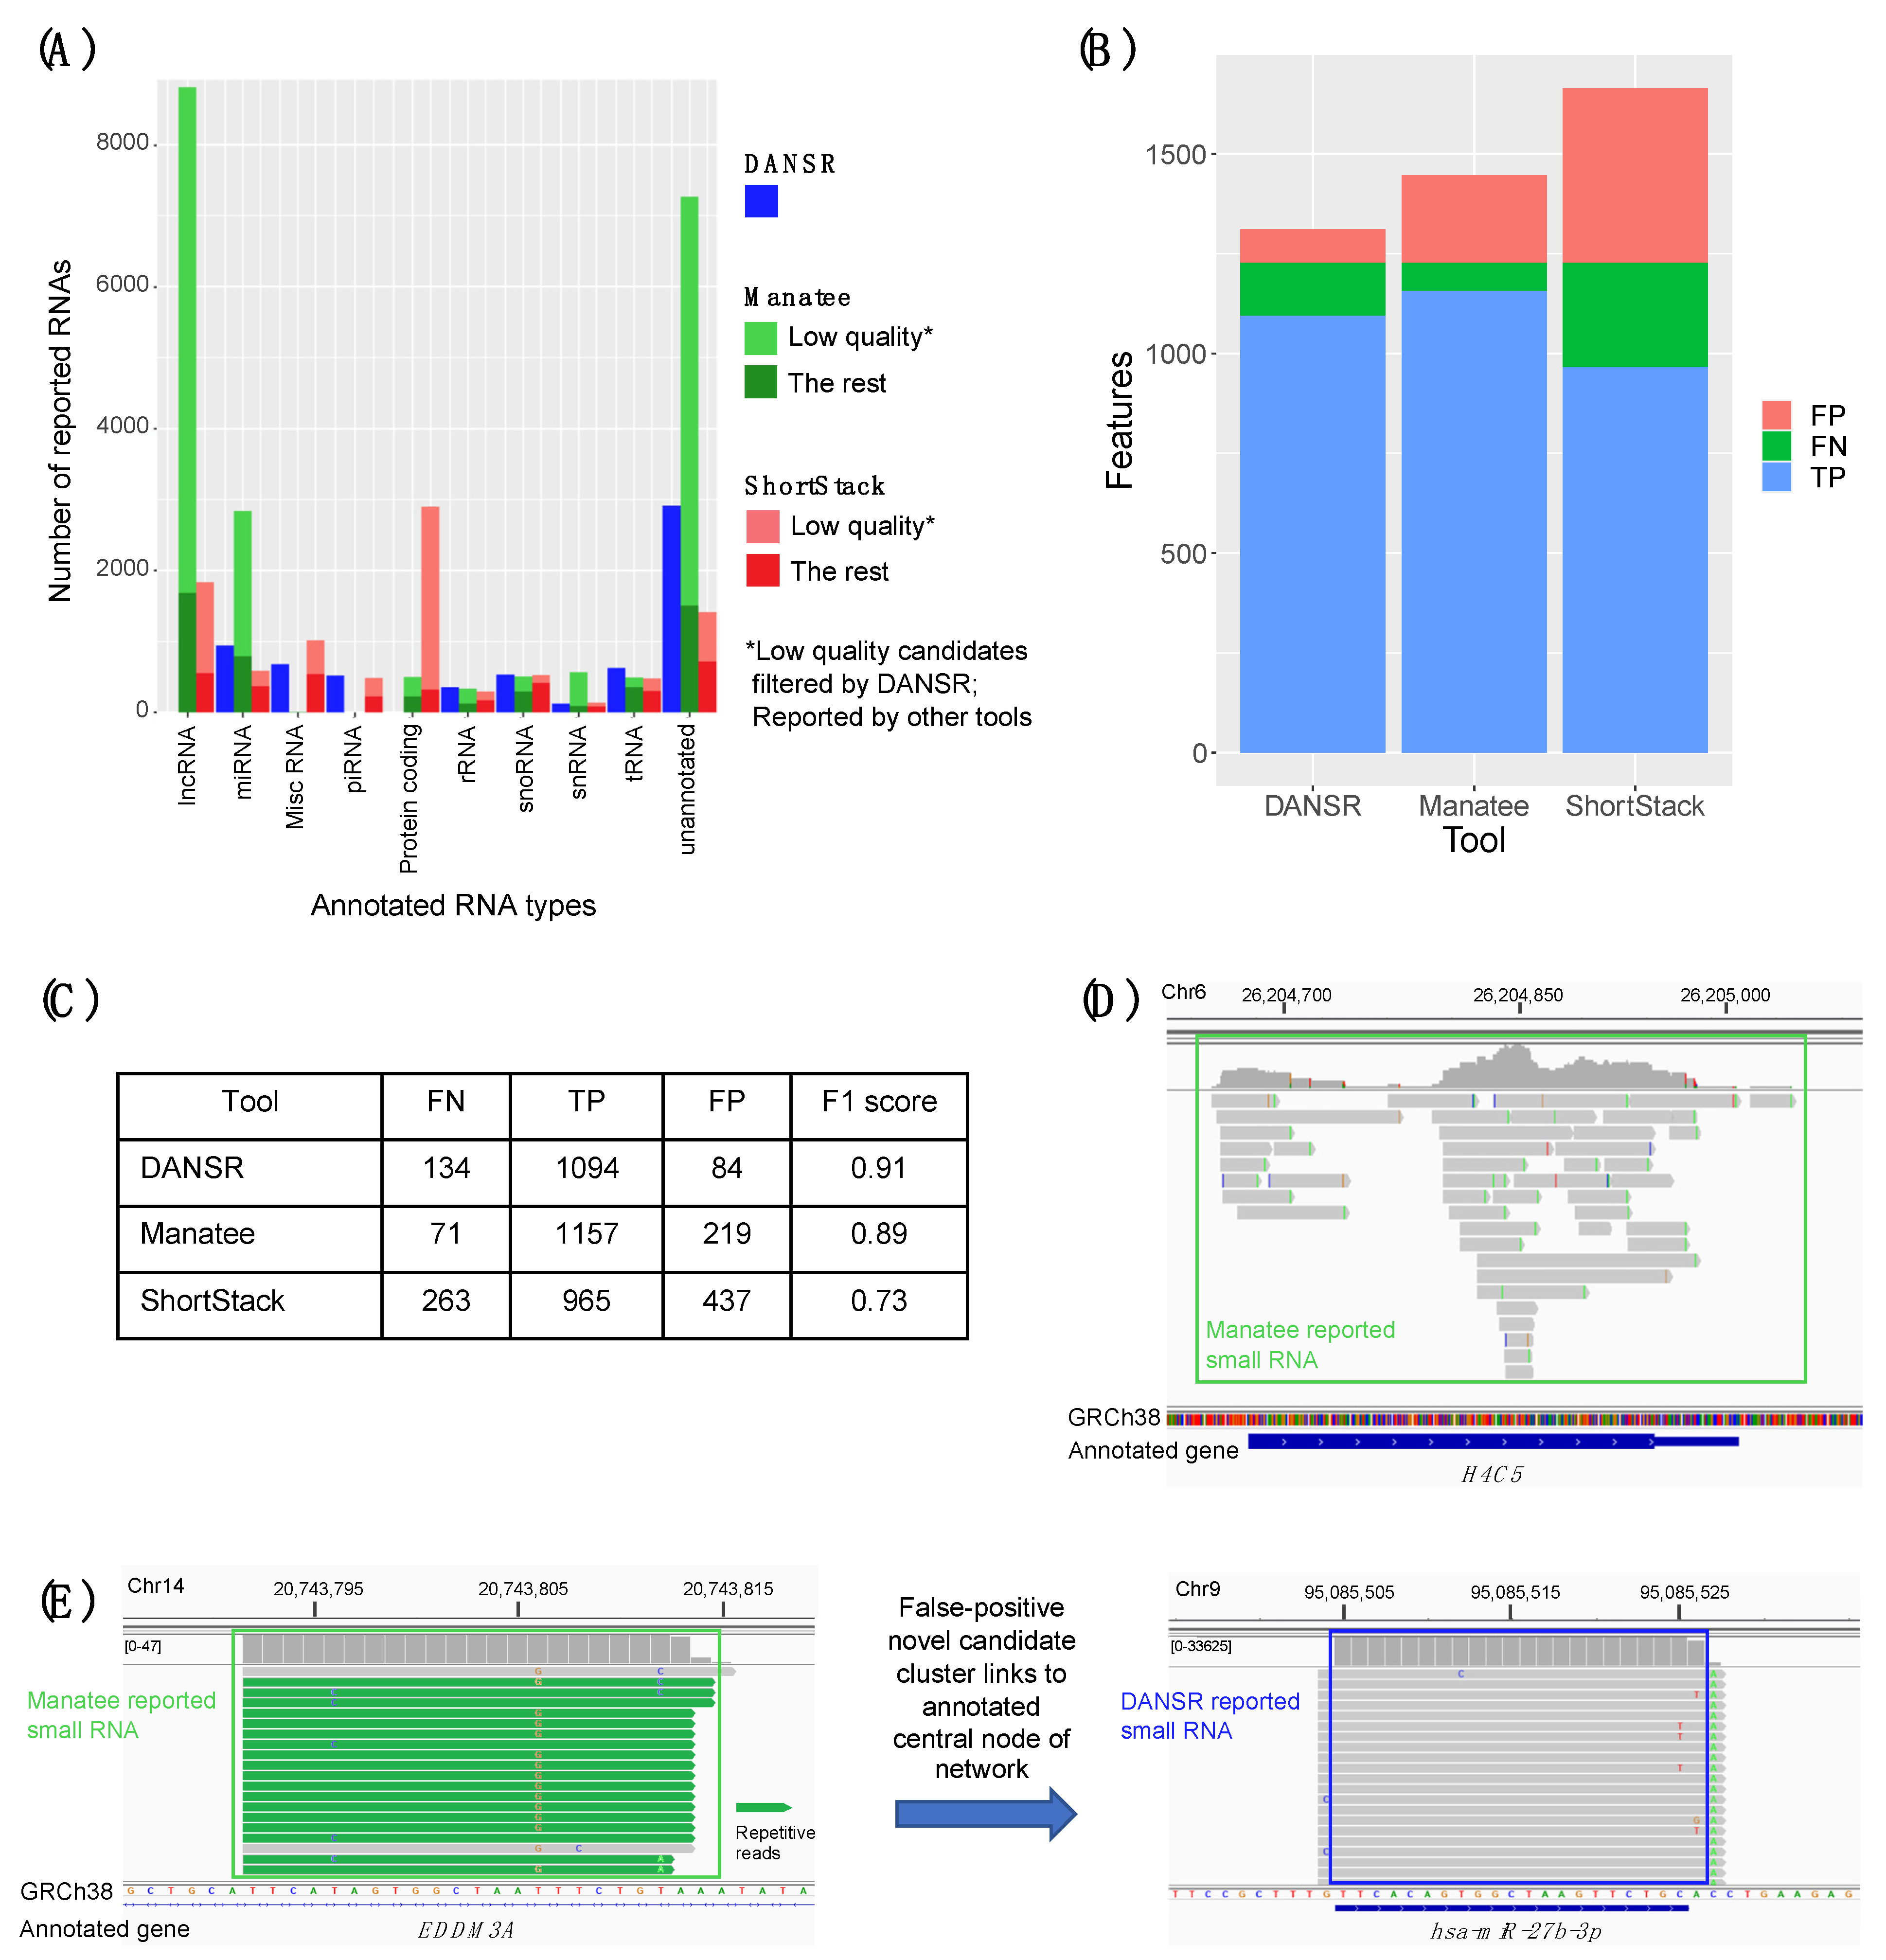
2.4. Benchmarking Using Contemporary State-of-the-Art Tools
2.5. Estimating Boundaries in Mid-Sized Small RNA Discovery
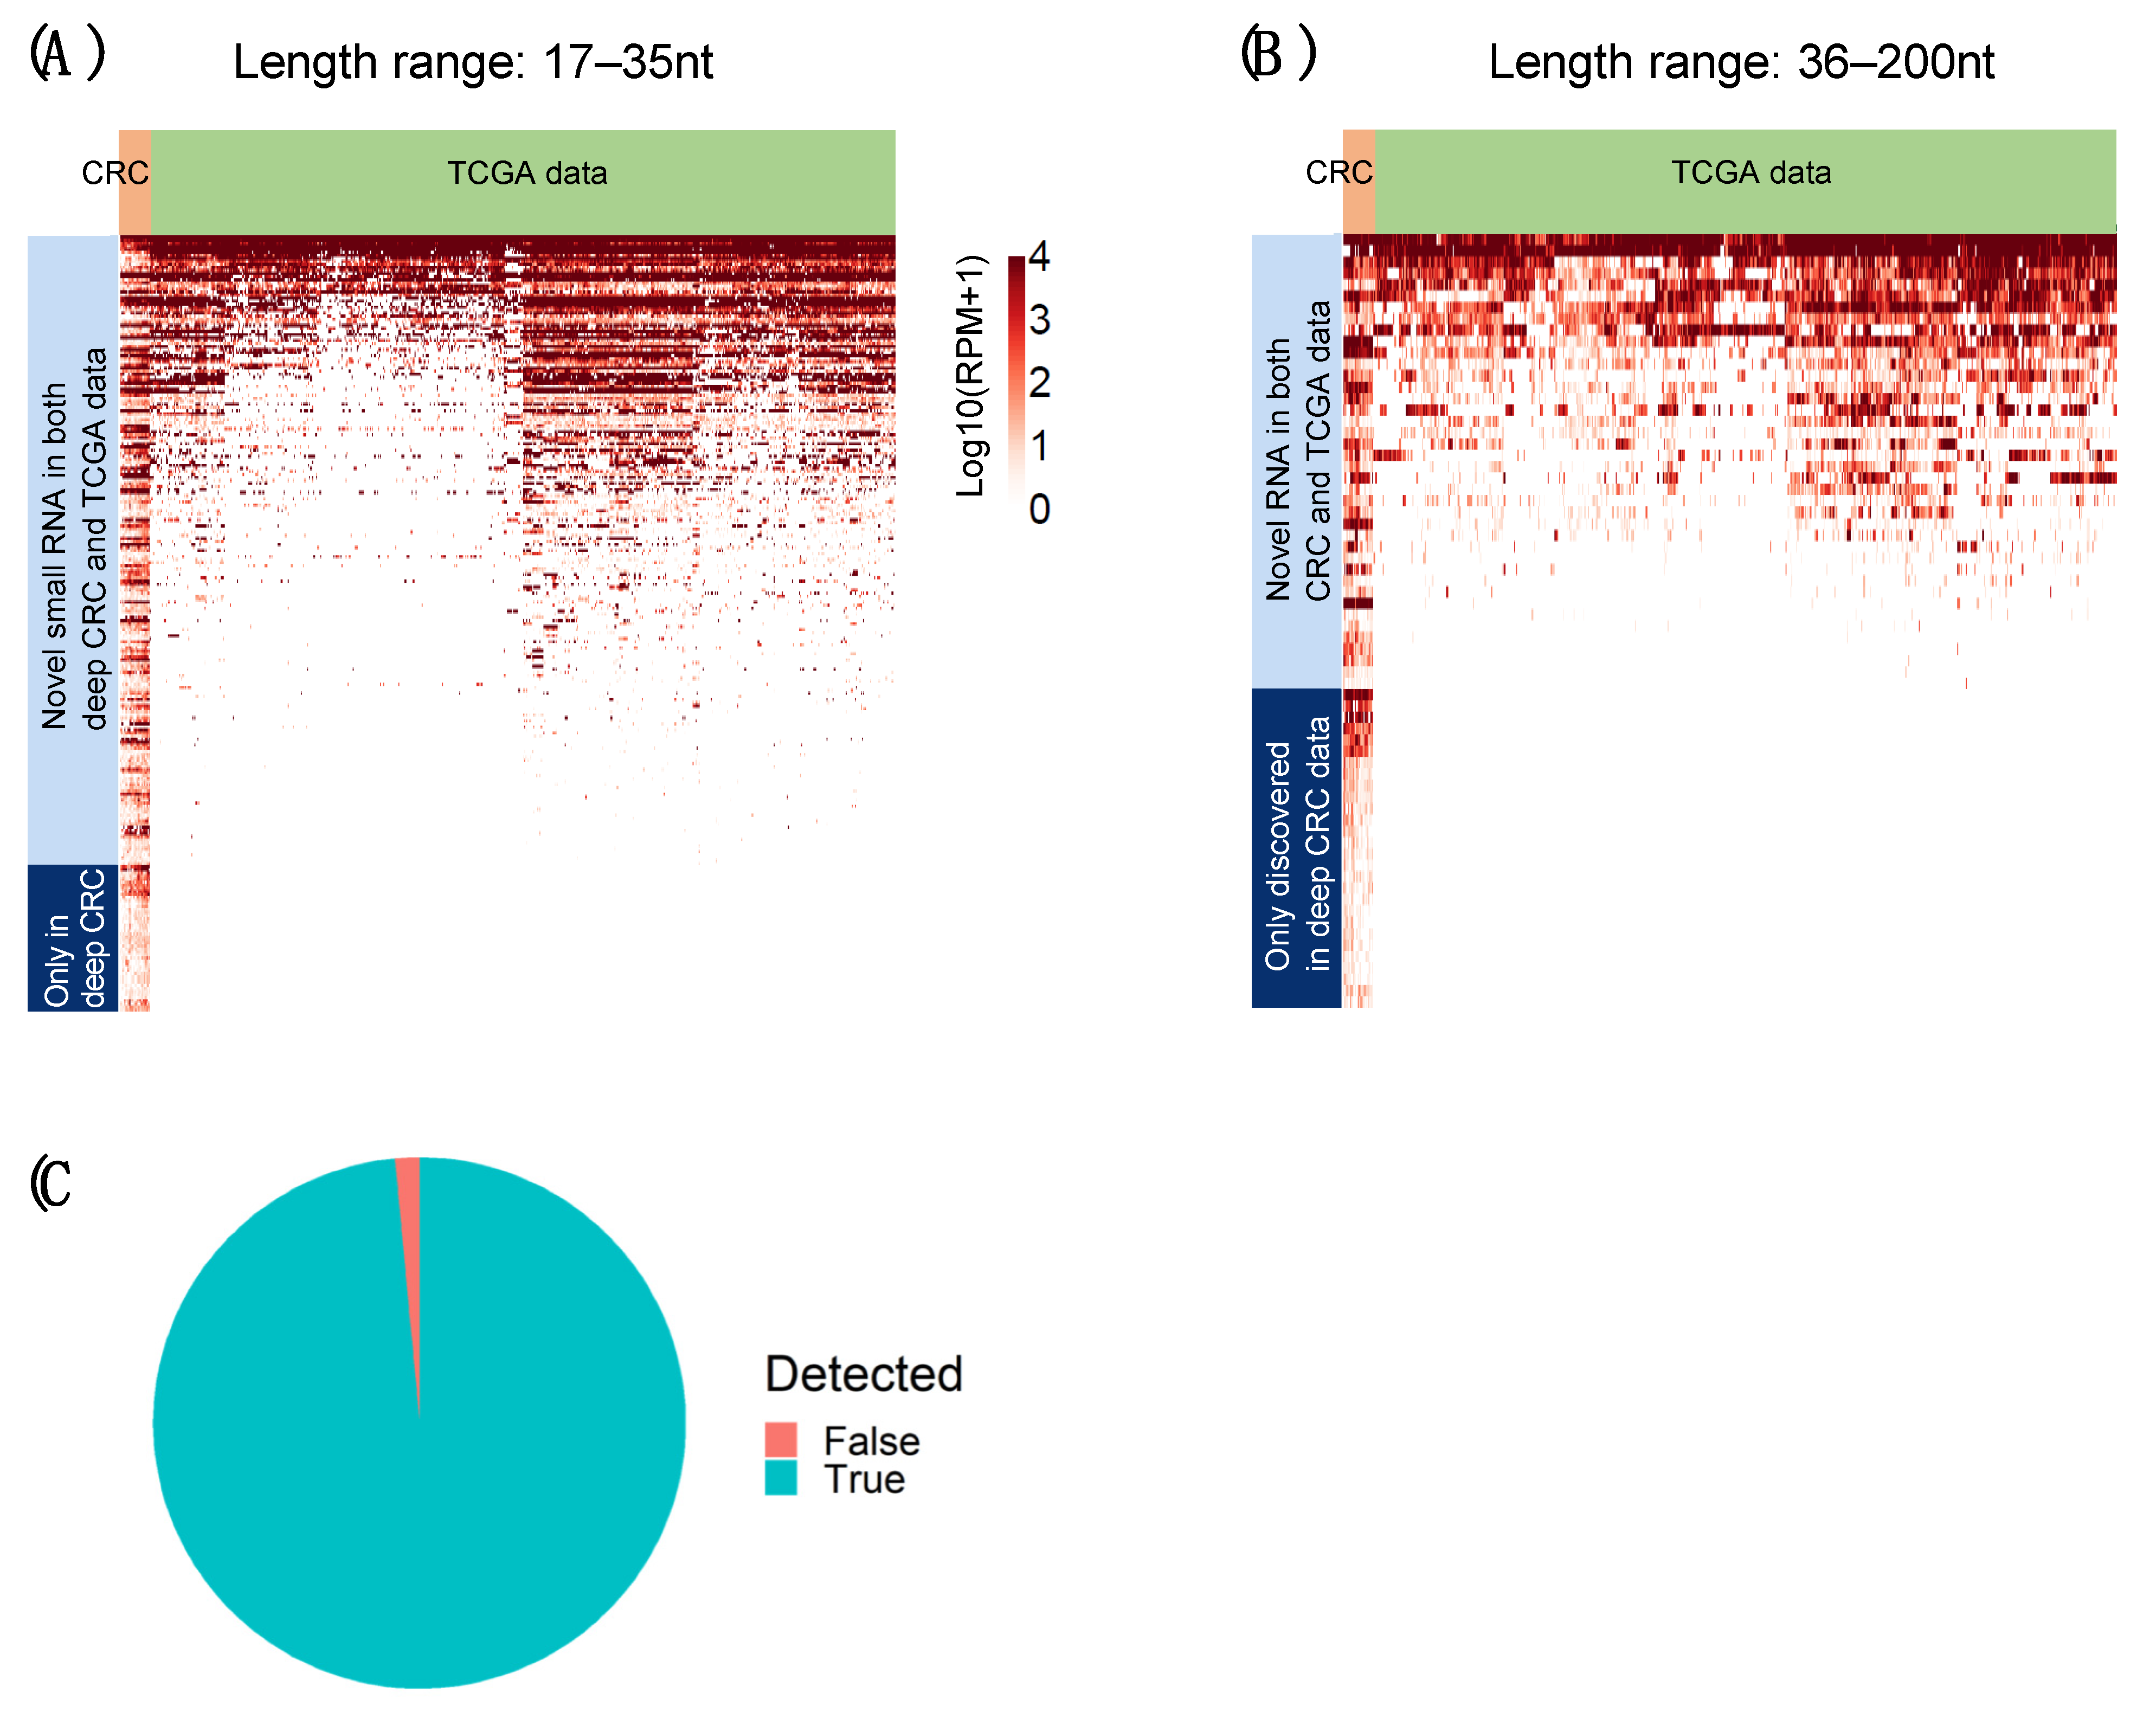
2.6. Novel RNAs Confirmed Using TCGA Colon and Rectum Cancer Cohorts
3. Discussion
4. Methods
4.1. Implementation of DANSR Tool
4.2. Standard Data Input/Output Format and Small RNA Annotation
4.3. Optimize Small RNA Boundaries
4.4. Identify Single- and Multi-Node Clusters
4.5. Identify Annotated and Unannotated Small RNAs
4.6. Sequencing Protocol for Small RNAs in the 17–200 Nucleotide Range
5. Conclusions
Supplementary Materials
Author Contributions
Funding
Institutional Review Board Statement
Informed Consent Statement
Data Availability Statement
Conflicts of Interest
References
- Cech, T.R.; Steitz, J.A. The noncoding RNA revolution-trashing old rules to forge new ones. Cell 2014, 157, 77–94. [Google Scholar] [CrossRef] [Green Version]
- Goodarzi, H.; Nguyen, H.C.B.; Zhang, S.; Dill, B.D.; Molina, H.; Tavazoie, S.F. Modulated Expression of Specific tRNAs Drives Gene Expression and Cancer Progression. Cell 2016, 165, 1416–1427. [Google Scholar] [CrossRef] [Green Version]
- Zhang, C.; Zhao, L.M.; Wu, H.; Tian, G.; Dai, S.L.; Zhao, R.Y.; Shan, B.E. C/D-Box Snord105b Promotes Tumorigenesis in Gastric Cancer via ALDOA/C-Myc Pathway. Cell Physiol. Biochem. 2018, 45, 2471–2482. [Google Scholar] [CrossRef] [Green Version]
- Cancer Genome Atlas Network. Comprehensive molecular characterization of human colon and rectal cancer. Nature 2012, 487, 330–337. [Google Scholar] [CrossRef] [Green Version]
- Aparicio-Puerta, E.; Lebron, R.; Rueda, A.; Gomez-Martin, C.; Giannoukakos, S.; Jaspez, D.; Medina, J.M.; Zubkovic, A.; Jurak, I.; Fromm, B.; et al. sRNAbench and sRNAtoolbox 2019: Intuitive fast small RNA profiling and differential expression. Nucleic Acids Res. 2019, 47, W530–W535. [Google Scholar] [CrossRef] [Green Version]
- Wu, J.; Liu, Q.; Wang, X.; Zheng, J.; Wang, T.; You, M.; Sheng Sun, Z.; Shi, Q. mirTools 2.0 for non-coding RNA discovery, profiling, and functional annotation based on high-throughput sequencing. RNA Biol. 2013, 10, 1087–1092. [Google Scholar] [CrossRef] [Green Version]
- Ragan, C.; Mowry, B.J.; Bauer, D.C. Hybridization-based reconstruction of small non-coding RNA transcripts from deep sequencing data. Nucleic Acids Res. 2012, 40, 7633–7643. [Google Scholar] [CrossRef] [Green Version]
- Zhang, J.; Griffith, M.; Miller, C.A.; Griffith, O.L.; Spencer, D.H.; Walker, J.R.; Magrini, V.; McGrath, S.D.; Ly, A.; Helton, N.M.; et al. Comprehensive discovery of non-coding RNAs in acute myeloid leukemia cell transcriptomes. Exp. Hematol. 2017, 55, 19–33. [Google Scholar] [CrossRef]
- Sun, C.; Fu, Z.; Wang, S.; Li, J.; Li, Y.; Zhang, Y.; Yang, F.; Chu, J.; Wu, H.; Huang, X.; et al. Roles of tRNA-derived fragments in human cancers. Cancer Lett. 2018, 414, 16–25. [Google Scholar] [CrossRef]
- Martin, M. Cutadapt Removes Adapter Sequences From High-Throughput Sequencing Reads. EMBnet. J. 2011, 17, 10–12. [Google Scholar] [CrossRef]
- Li, H.; Durbin, R. Fast and accurate short read alignment with Burrows-Wheeler transform. Bioinformatics 2009, 25, 1754–1760. [Google Scholar] [CrossRef] [Green Version]
- Quinlan, A.R.; Hall, I.M. BEDTools: A flexible suite of utilities for comparing genomic features. Bioinformatics 2010, 26, 841–842. [Google Scholar] [CrossRef] [Green Version]
- Bartel, D.P. MicroRNAs: Genomics, biogenesis, mechanism, and function. Cell 2004, 116, 281–297. [Google Scholar] [CrossRef] [Green Version]
- Seto, A.G.; Kingston, R.E.; Lau, N.C. The coming of age for Piwi proteins. Mol. Cell 2007, 26, 603–609. [Google Scholar] [CrossRef]
- Sharp, S.J.; Schaack, J.; Cooley, L.; Burke, D.J.; Soll, D. Structure and transcription of eukaryotic tRNA genes. CRC Crit. Rev. Biochem. 1985, 19, 107–144. [Google Scholar] [CrossRef]
- Bachellerie, J.P.; Cavaille, J.; Huttenhofer, A. The expanding snoRNA world. Biochimie 2002, 84, 775–790. [Google Scholar] [CrossRef]
- Matera, A.G.; Terns, R.M.; Terns, M.P. Non-coding RNAs: Lessons from the small nuclear and small nucleolar RNAs. Nat. Rev. Mol. Cell Biol. 2007, 8, 209–220. [Google Scholar] [CrossRef]
- Yusupov, M.M.; Yusupova, G.Z.; Baucom, A.; Lieberman, K.; Earnest, T.N.; Cate, J.H.; Noller, H.F. Crystal structure of the ribosome at 5.5 A resolution. Science 2001, 292, 883–896. [Google Scholar] [CrossRef] [PubMed]
- Hubbard, T.; Barker, D.; Birney, E.; Cameron, G.; Chen, Y.; Clark, L.; Cox, T.; Cuff, J.; Curwen, V.; Down, T.; et al. The Ensembl genome database project. Nucleic Acids Res. 2002, 30, 38–41. [Google Scholar] [CrossRef] [Green Version]
- Consortium, R.N. RNAcentral 2021: Secondary structure integration, improved sequence search and new member databases. Nucleic Acids Res. 2021, 49, D212–D220. [Google Scholar] [CrossRef]
- Li, Z.; Ender, C.; Meister, G.; Moore, P.S.; Chang, Y.; John, B. Extensive terminal and asymmetric processing of small RNAs from rRNAs, snoRNAs, snRNAs, and tRNAs. Nucleic Acids Res. 2012, 40, 6787–6799. [Google Scholar] [CrossRef] [Green Version]
- Lorenz, R.; Bernhart, S.H.; Honer Zu Siederdissen, C.; Tafer, H.; Flamm, C.; Stadler, P.F.; Hofacker, I.L. ViennaRNA Package 2.0. Algorithms Mol. Biol. 2011, 6, 26. [Google Scholar] [CrossRef]
- Robinson, M.D.; McCarthy, D.J.; Smyth, G.K. edgeR: A Bioconductor package for differential expression analysis of digital gene expression data. Bioinformatics 2010, 26, 139–140. [Google Scholar] [CrossRef] [Green Version]
- Axtell, M.J. ShortStack: Comprehensive annotation and quantification of small RNA genes. RNA 2013, 19, 740–751. [Google Scholar] [CrossRef] [PubMed] [Green Version]
- Handzlik, J.E.; Tastsoglou, S.; Vlachos, I.S.; Hatzigeorgiou, A.G. Manatee: Detection and quantification of small non-coding RNAs from next-generation sequencing data. Sci. Rep. 2020, 10, 705. [Google Scholar] [CrossRef] [PubMed] [Green Version]


Publisher’s Note: MDPI stays neutral with regard to jurisdictional claims in published maps and institutional affiliations. |
© 2022 by the authors. Licensee MDPI, Basel, Switzerland. This article is an open access article distributed under the terms and conditions of the Creative Commons Attribution (CC BY) license (https://creativecommons.org/licenses/by/4.0/).
Share and Cite
Zhang, J.; Eteleeb, A.M.; Rozycki, E.B.; Inkman, M.J.; Ly, A.; Scharf, R.E.; Jayachandran, K.; Krasnick, B.A.; Mazur, T.; White, N.M.; et al. DANSR: A Tool for the Detection of Annotated and Novel Small RNAs. Non-Coding RNA 2022, 8, 9. https://doi.org/10.3390/ncrna8010009
Zhang J, Eteleeb AM, Rozycki EB, Inkman MJ, Ly A, Scharf RE, Jayachandran K, Krasnick BA, Mazur T, White NM, et al. DANSR: A Tool for the Detection of Annotated and Novel Small RNAs. Non-Coding RNA. 2022; 8(1):9. https://doi.org/10.3390/ncrna8010009
Chicago/Turabian StyleZhang, Jin, Abdallah M. Eteleeb, Emily B. Rozycki, Matthew J. Inkman, Amy Ly, Russell E. Scharf, Kay Jayachandran, Bradley A. Krasnick, Thomas Mazur, Nicole M. White, and et al. 2022. "DANSR: A Tool for the Detection of Annotated and Novel Small RNAs" Non-Coding RNA 8, no. 1: 9. https://doi.org/10.3390/ncrna8010009
APA StyleZhang, J., Eteleeb, A. M., Rozycki, E. B., Inkman, M. J., Ly, A., Scharf, R. E., Jayachandran, K., Krasnick, B. A., Mazur, T., White, N. M., Fields, R. C., & Maher, C. A. (2022). DANSR: A Tool for the Detection of Annotated and Novel Small RNAs. Non-Coding RNA, 8(1), 9. https://doi.org/10.3390/ncrna8010009