
Polychlorinated Biphenyl Exposure Alters tRNA Transcriptome in High-Fat Diet-Fed Mouse Liver

 , , , and
Abstract
1. Introduction
2. Results
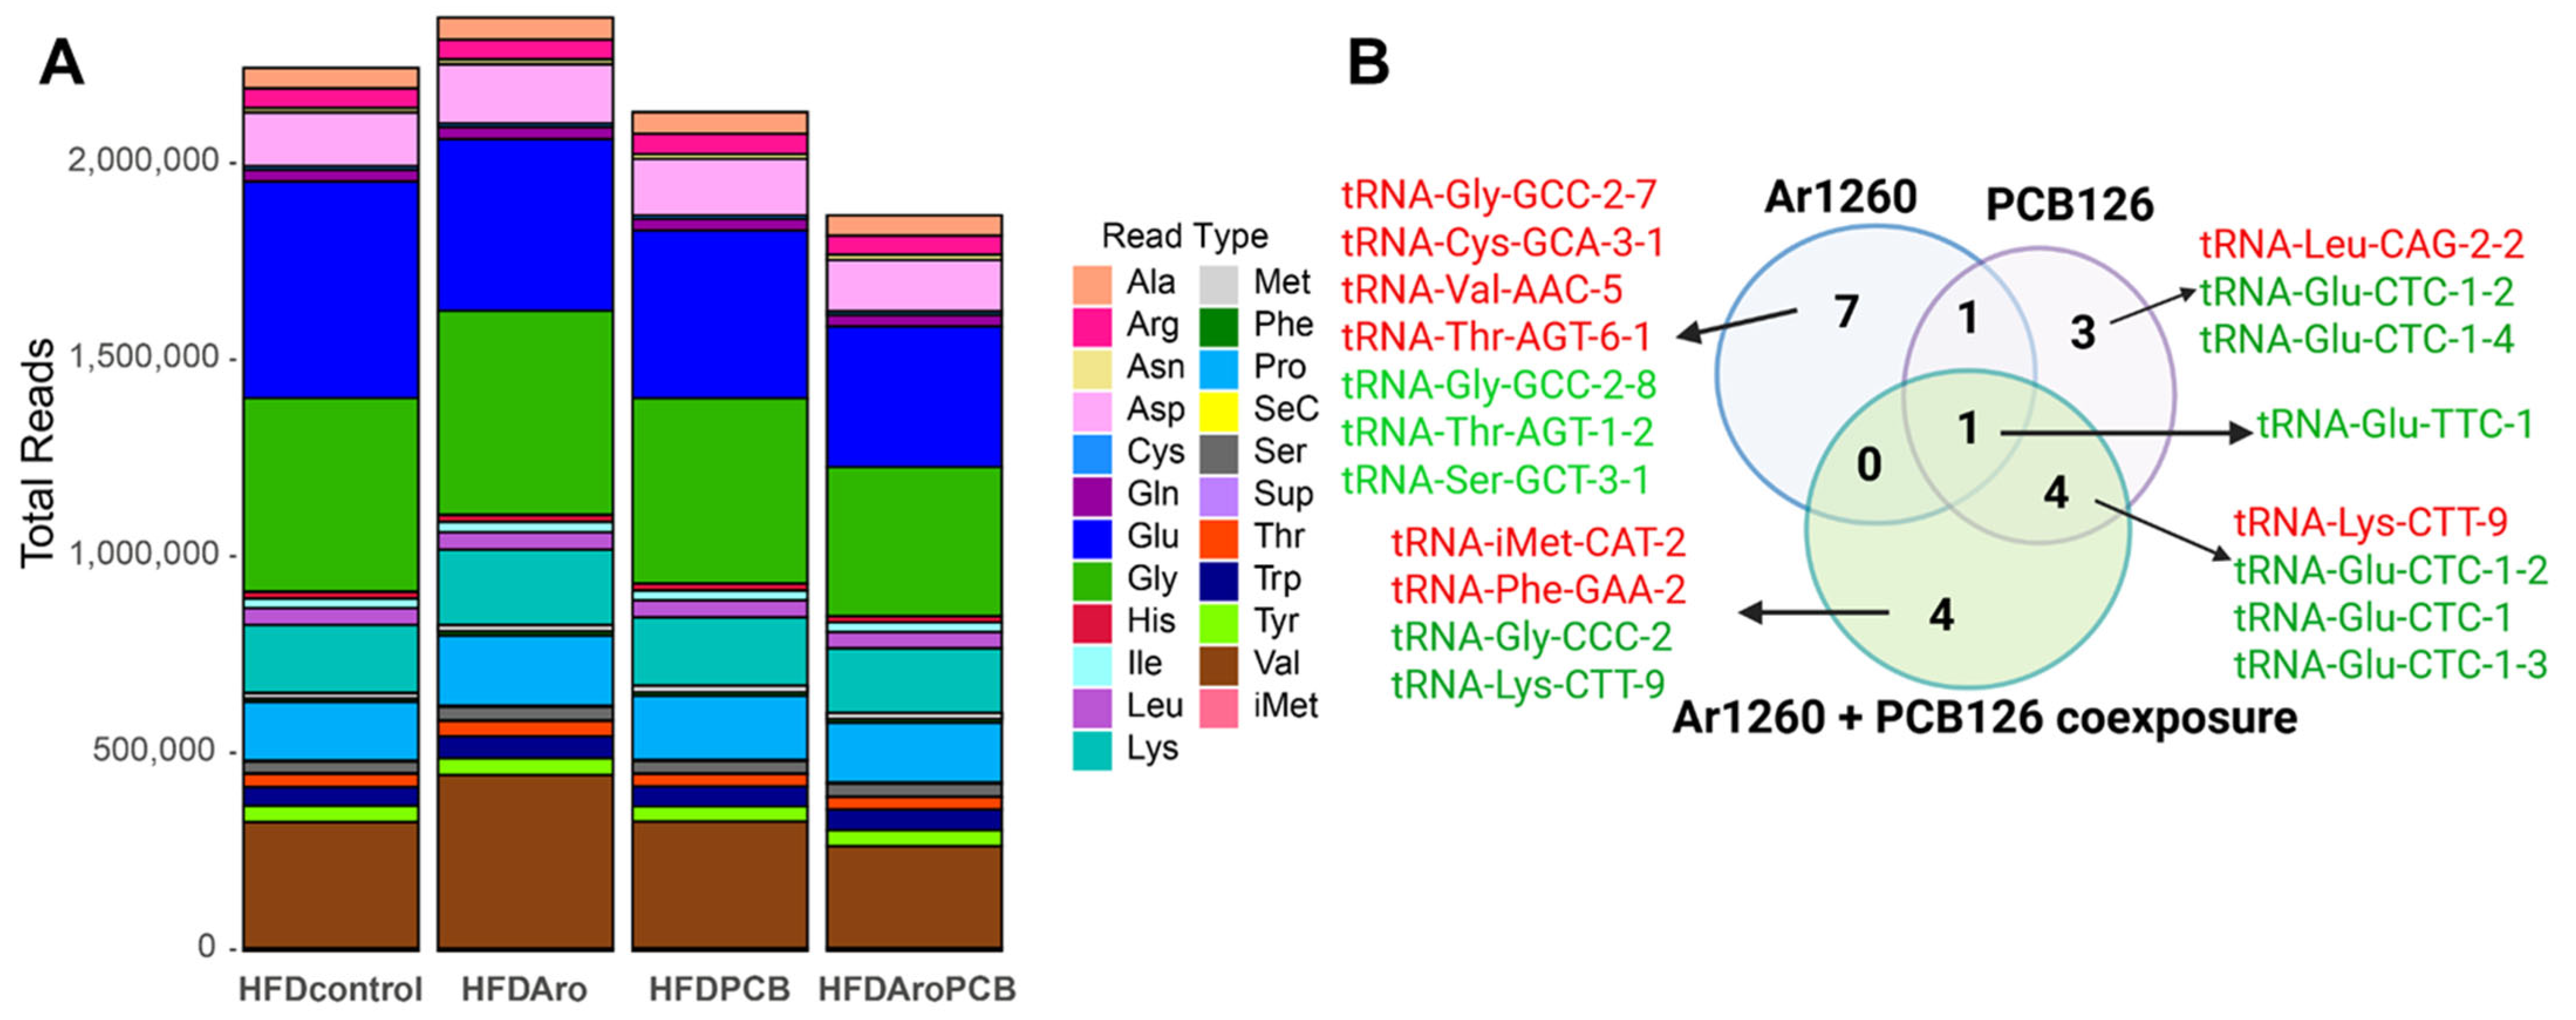
2.1. PCB Exposures in HFD-Fed Mice Affect Hepatic tRNA Abundance
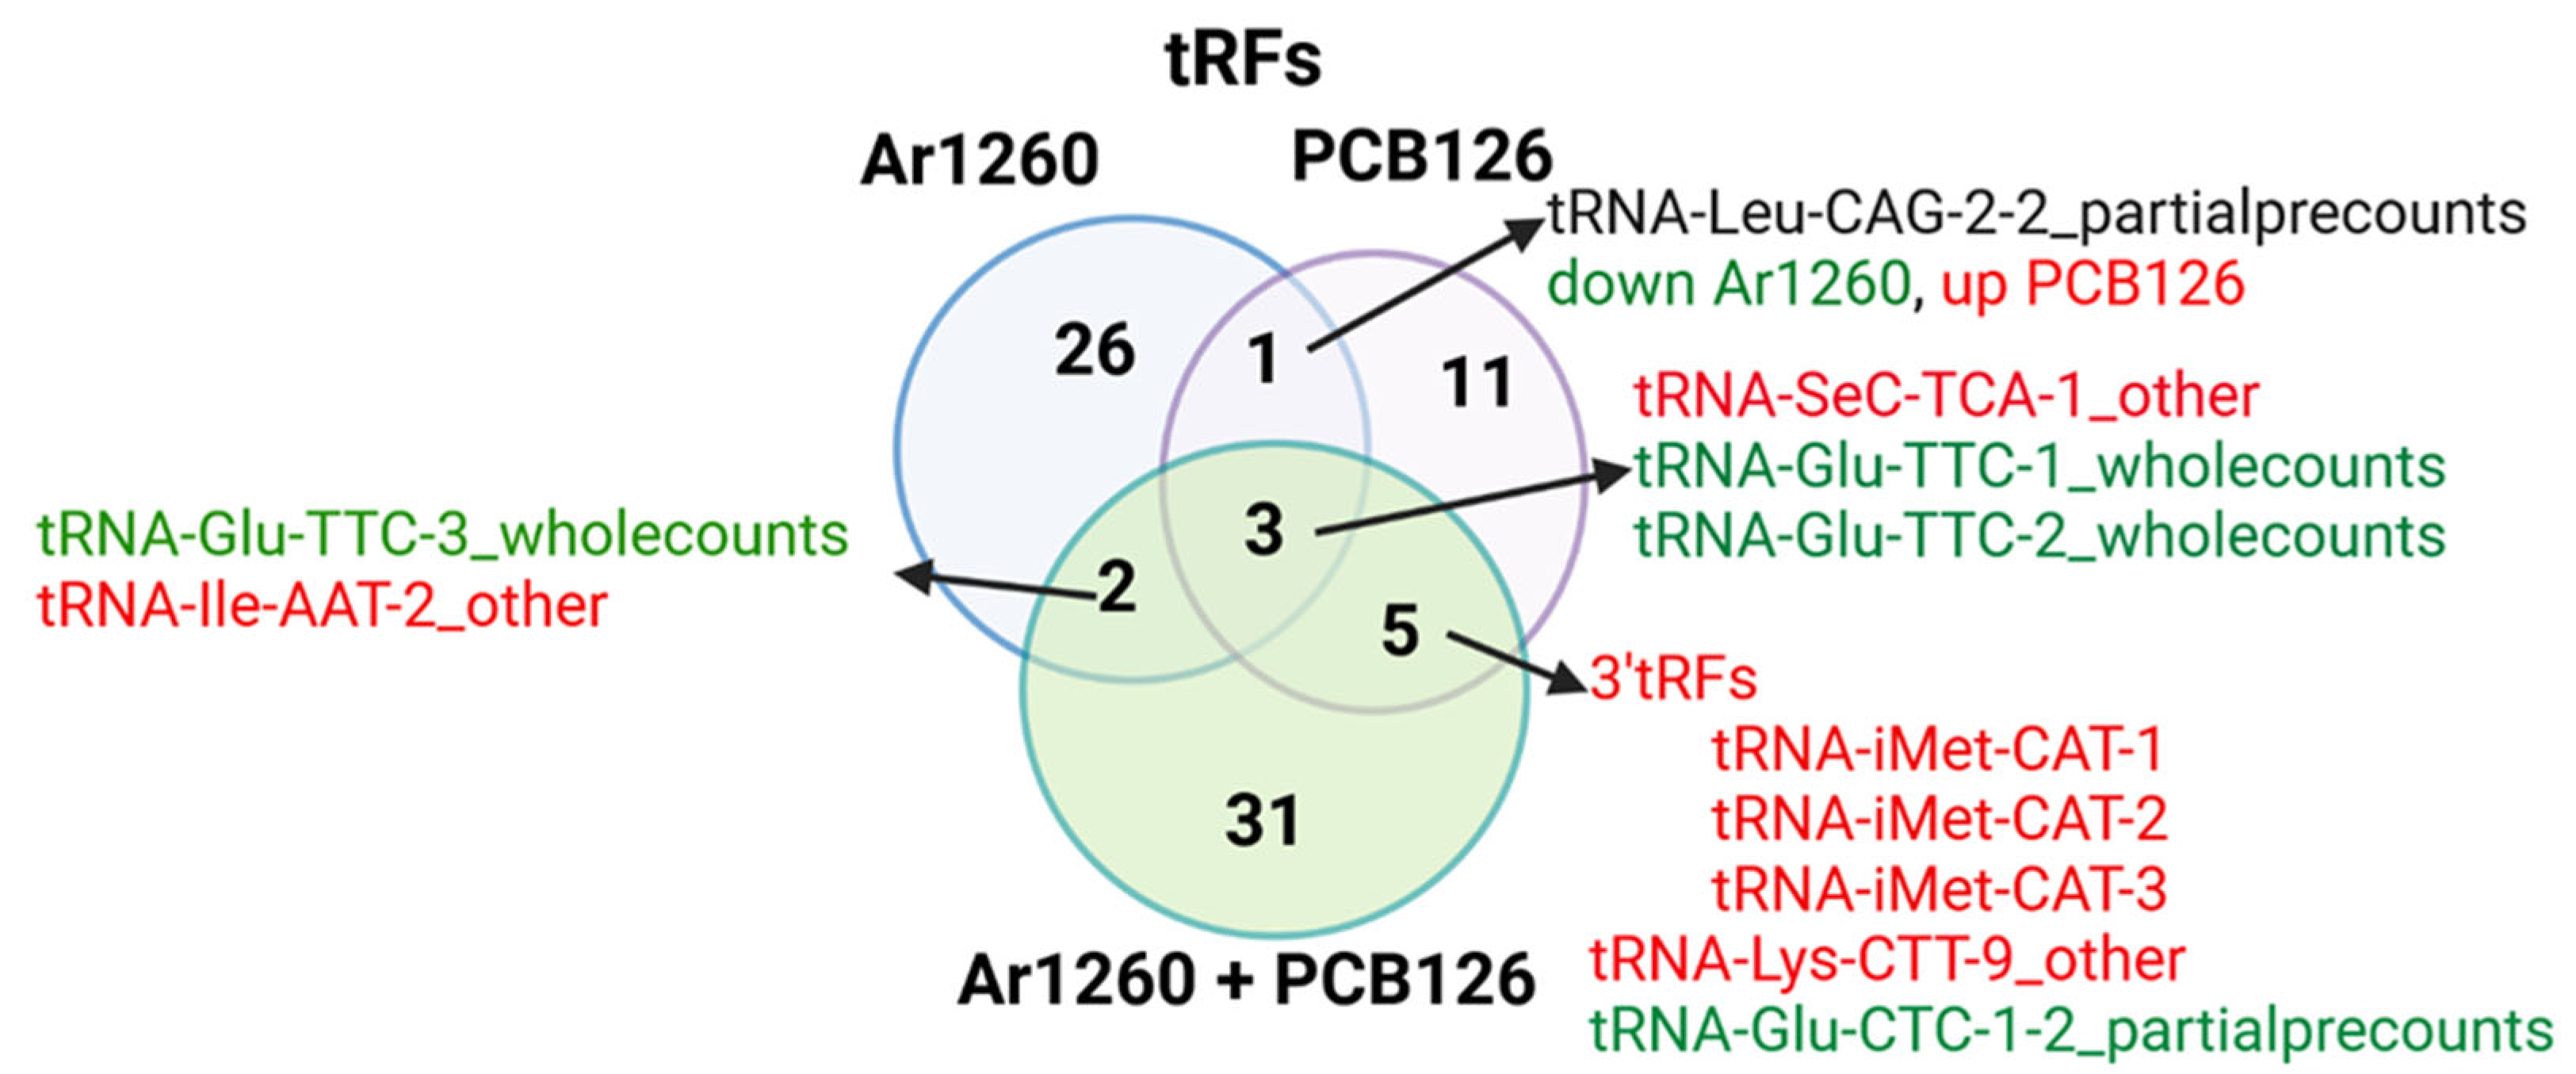
2.2. PCB Exposures in HFD-Fed Mice Affect Hepatic tRF Abundance

| tRF | Log2FC | Adj p Value | tRF Type | Correspondence with tRNAs (Table 1) or AS-tRNAs (Table S1) | Other Reports |
|---|---|---|---|---|---|
| tRNA-Gln-TTG-4_other | 0.56 | 0.011 | undefined | none | |
| tRNA-Leu-CAA-2-1_trailercounts | 0.52 | 0.021 | tRF-1 | none | |
| tRNA-Val-AAC-4_fiveprime | 0.51 | 0.011 | tRF-5 | none | |
| tRNA-Gly-TCC-1_others | 0.47 | 0.019 | undefined | tRNA increased; no change in AS-tRNA | tRNA-Gly-TCC-1-tRF-3 was increased in the livers of diet-induced obese (DIO) C57Bl/6 mice with lipid droplet accumulation [32]. |
| tRNA-Pro-TGG-3_other | 0.44 | 0.047 | undefined | none | |
| tRNA-Leu-CAG-2-2_partialprecounts | 0.41 | 0.039 | undefined | none | |
| tRNA-Cys-GCA-12_other | 0.40 | 0.040 | undefined | none | |
| tRNA-Thr-AGT-6-1_trailercounts | 0.39 | 0.037 | tRF-1 | none | |
| tRNA-Ile-AAT-2_other | 0.37 | 0.032 | undefined | none | |
| tRNA-Val-CAC-3_fiveprime | 0.34 | 0.030 | tRF-5 | none | tRF-Val-CAC-005 was elevated in MASLD patient plasma and in the plasma of BALBc mice after 2–6 weeks on a high cholesterol diet [46]. |
| tRNA-Val-AAC-2_fiveprime | 0.32 | 0.031 | tRF-5 | none | |
| tRNA-Val-AAC-3_fiveprime | 0.32 | 0.032 | tRF-5 | none | |
| tRNA-Val-CAC-4_fiveprime | 0.30 | 0.024 | tRF-5 | none | tRF-Val-CAC-005 was elevated in MASLD patient plasma and in the plasma of BALBc mice after 2–6 weeks on a high cholesterol diet [46] |
| tRNA-SeC-TCA-1_other | 0.30 | 0.042 | undefined | none | |
| tRNA-Val-CAC-1_fiveprime | 0.30 | 0.017 | tRF-5 | none | tRF-Val-CAC-005 was elevated in MASLD patient plasma and in the plasma of BALBc mice after 2–6 weeks on a high cholesterol diet [46]. |
| tRNA-Val-AAC-5_fiveprime | 0.28 | 0.042 | tRF-5 | tRNA-Val-AAC-5 increased; no AS-tRNA change | tRNA-Val-AAC-5-tRF-5 was increased in the livers of DIO C57Bl/6 mice [32]. |
| tRNA-Val-AAC-5_trailercounts | 0.26 | 0.043 | tRF-1 | tRNA-Val-AAC-5 increased; no AS-tRNA change | |
| tRNA-Gly-TCC-1_other | −0.19 | 0.048 | undefined | none | tRNA-Gly-TCC-1-tRF-3 was increased in the livers of DIO C57Bl/6 mice with lipid droplet accumulation [32] |
| tRNA-iMet-CAT-1_other | −0.32 | 0.018 | undefined | No change in tRNA; AS decreased | |
| tRNA-Thr-AGT-1-2_trailercounts | −0.34 | 0.033 | tRF-1 | tRNA-Thr-AGT-1-2 decreased; no AS-tRNA change | |
| tRNA-Leu-CAA-2_other | −0.36 | 0.034 | undefined | none | tRNA-Leu-CAA was down regulated with increased ER stress [47]. |
| tRNA-Leu-CAG-2-2_partialprecounts | −0.36 | 0.028 | undefined | none | |
| tRNA-Leu-CAA-1_other | −0.37 | 0.042 | undefined | No for tRNA, AS-tRNA was decreased | tRNA-Leu-CAA was down regulated with increased ER stress [47]. |
| tRNA-Leu-CAG-3_other | −0.38 | 0.048 | undefined | No for tRNA, AS-tRNA was decreased | |
| tRNA-Glu-TTC-3_wholecounts | −0.39 | 0.048 | undefined | none | |
| tRNA-Leu-CAA-4_other | −0.39 | 0.031 | undefined | none | tRNA-Leu-CAA was down regulated with increased ER stress [47]. |
| tRNA-Leu-CAA-3_other | −0.39 | 0.021 | undefined | none | tRNA-Leu-CAA is down regulated with increased ER stress [47]. |
| tRNA-Glu-TTC-2_wholecounts | −0.41 | 0.025 | undefined | none | |
| tRNA-Gly-GCC-2-8_trailercounts | −0.44 | 0.035 | tRF-1 | tRNA-Gly-GCC-2-7 increased; no AS-tRNA change | tRNA-Gly-GCC fragments are generated in response to activation of the ER stress response in KGN cells overexpressing IRE1α (ERN1) or in KGN, HeLa, and other cell lines treated with thapsigargin or tunicamycin [48]. |
| tRNA-Ser-GCT-3-1_trailercounts | −0.46 | 0.020 | tRF-1 | tRNA-Ser-GCT-3-1 decreased; no AS-tRNA change | |
| tRNA-Glu-TTC-1_wholecounts | −0.50 | 0.010 | undefined | tRNA-Glu-TTC-1 decreased; no AS-tRNA change | |
| tRNA-Ala-CGC-7_other | −0.62 | 0.001 | undefined | none | tRF-Ala-CGC-006 was elevated in MASLD patient plasma and in the plasma of BALBc mice after 2–6 weeks on a high cholesterol diet [46] |
| tRF | Log2FC | Adj p Value | Type of tRF | Correspondence with tRNAs (Table 2) or AS-tRNAs (Table S2) | Other Reports |
|---|---|---|---|---|---|
| tRNA-Leu-CAG-2-2_partialprecounts | 0.59 | 0.003 | undefined | tRNA-Leu-CAG-2-2 was increased; no AS-tRNA change | |
| tRNA-Met-CAT-1_fiveprime | 0.44 | 0.045 | tRF-5 | none | |
| tRNA-SeC-TCA-1_other | 0.374 | 0.012 | undefined | none | |
| tRNA-SeC-TCA-1_threeprime | 0.37 | 0.014 | tRF-3 | none | |
| tRNA-Lys-CTT-9_other | 0.36 | 0.019 | undefined | tRNA-Lys-CTT-9 was increased; no AS-tRNA change | |
| tRNA-Ser-AGA-3_fiveprime | 0.35 | 0.040 | tRF-5 | none | tRNA-Ser-AGA-1-tRF-5 was reduced in the livers of DIO C57Bl/6 mice [32] |
| tRNA-iMet-CAT-1_threeprime | 0.28 | 0.032 | tRF-3 | none | |
| tRNA-iMet-CAT-3_threeprime | 0.28 | 0.033 | tRF-3 | none | |
| tRNA-iMet-CAT-2_threeprime | 0.27 | 0.034 | tRF-3 | none | |
| tRNA-Leu-AAG-3_other | 0.23 | 0.017 | undefined | none | |
| tRNA-Lys-TTT-1_threeprime | 0.21 | 0.046 | tRF-3 | none | tRNA-Lys-TTT-3-tRF-5 was increased in the livers of DIO C57Bl/6 mice [32]. |
| tRNA-Leu-AAG-1_other | 0.20 | 0.040 | undefined | none | |
| tRNA-Leu-AAG-2_other | 0.20 | 0.049 | undefined | none | |
| tRNA-Glu-TTC-2_wholecounts | −0.36 | 0.049 | undefined | none | |
| tRNA-Asp-GTC-1_wholecounts | −0.39 | 0.046 | undefined | none | |
| tRNA-Glu-TTC-1_wholecounts | −0.43 | 0.027 | undefined | tRNA-Glu-TTC-1 was decreased; AS-tRNA was increased | |
| tRNA-Glu-CTC-1-1_partialprecounts | −0.45 | 0.010 | undefined | tRNA-Glu-CTC-1-1 decreased; AS-tRNA change | |
| tRNA-Glu-CTC-1-2_partialprecounts | −0.45 | 0.040 | undefined | tRNA-Glu-CTC-1-2 decreased; AS-tRNA change | |
| tRNA-Glu-CTC-1-3_partialprecounts | −0.45 | 0.040 | undefined | none | |
| tRNA-Thr-CGT-2-1_trailercounts | −0.46 | 0.005 | tRF-1 | tRNA-Thr-CGT-2-1 decreased; AS-tRNA |
| tRF | Log2FC | Adj p Value | Type of tRF | Correspondence with tRNAs (Table 3) or AS-tRNAs (Table S3) | Other Reports |
|---|---|---|---|---|---|
| tRNA-SeC-TCA-1_other | 0.66 | 6.76 × 10⁻⁶ | undefined | none | |
| tRNA-iMet-CAT-3_threeprime | 0.51 | 0.00011 | tRF-3 | AS decreased | |
| tRNA-iMet-CAT-1_threeprime | 0.49 | 0.00018 | tRF-3 | none | |
| tRNA-iMet-CAT-2_threeprime | 0.49 | 0.00013 | tRF-3 | tRNA increased; AS decreased | |
| tRNA-Ser-CGA-2_threeprime | 0.44 | 0.003 | tRF-3 | none | |
| tRNA-Lys-CTT-9_other | 0.44 | 0.004 | undefined | tRNA increased; No change AS-tRNA | |
| tRNA-Glu-CTC-5_threeprime | 0.40 | 0.029 | tRF-3 | none | tRNA-Glu-CTC-tRF-5 (fiveprime) was increased in exosomes purified from the blood of patients with metastatic pancreatic cancer to the liver and promoted liver metastasis by increasing the stability of WDR1 (WD Repeat Domain 1) mRNA and increasing WDR1 protein in hepatic stellate cells [49] |
| tRNA-Cys-GCA-5_fiveprime | 0.38 | 0.029 | tRF-5 | none | |
| tRNA-SeC-TCA-1_threeprime | 0.37 | 0.013 | tRF-3 | none | |
| tRNA-Ile-AAT-2_other | 0.34 | 0.046 | undefined | none | |
| tRNA-iMet-CAT-2_fiveprime | 0.33 | 0.049 | tRF-5 | AS-tRNA decreased | |
| tRNA-Ser-GCT-4_threeprime | 0.33 | 0.006 | tRF-3 | none | |
| tRNA-Ser-GCT-3_threeprime | 0.32 | 0.007 | tRF-3 | none | |
| tRNA-Ser-GCT-2_threeprime | 0.32 | 0.007 | tRF-3 | none | |
| tRNA-Arg-ACG-3_threeprime | 0.30 | 0.0005 | tRF-3 | AS-tRNA decreased | |
| tRNA-Phe-GAA-1_other | 0.30 | 0.0120 | undefined | none | |
| tRNA-Ser-AGA-2_other | 0.29 | 0.035 | undefined | none | |
| tRNA-Arg-ACG-1_threeprime | 0.28 | 0.001 | tRF-3 | AS-tRNA decreased | |
| tRNA-Lys-CTT-7_other | 0.28 | 0.038 | undefined | none | |
| tRNA-Ala-CGC-3_threeprime | 0.28 | 0.038 | tRF-3 | none | tRF-ALA-CGC-3 was increased in DIO mouse liver [32]. tRF-Ala-CGC-006 was elevated in MASLD patient plasma and in the plasma of BALBc mice after 2–6 weeks on a high cholesterol diet [46] |
| tRNA-Ala-CGC-4_threeprime | 0.29 | 0.038 | tRF-3 | none | tRF-Ala-CGC-006 was elevated in MASLD patient plasma and in the plasma of BALBc mice after 2–6 weeks on a high cholesterol diet [46] |
| tRNA-Ala-CGC-7_threeprime | 0.28 | 0.039 | tRF-3 | none | tRF-Ala-CGC-006 was elevated in MASLD patient plasma and in the plasma of BALBc mice after 2–6 weeks on a high cholesterol diet [46] |
| tRNA-Ala-TGC-5_threeprime | 0.27 | 0.039 | tRF-3 | none | |
| tRNA-Ala-TGC-7_threeprime | 0.27 | 0.047 | tRF-3 | none | |
| tRNA-Ala-TGC-8_threeprime | 0.27 | 0.046 | tRF-3 | none | |
| tRNA-Ala-TGC-6_threeprime | 0.27 | 0.047 | tRF-3 | none | |
| tRNA-Asn-GTT-2_threeprime | 0.25 | 0.030 | tRF-3 | AS-tRNA decreased | |
| tRNA-Phe-GAA-2_other | 0.23 | 0.041 | undefined | none | |
| tRNA-Asn-GTT-3_threeprime | 0.21 | 0.042 | tRF-3 | none | |
| tRNA-Arg-CCG-3_threeprime | 0.12 | 0.035 | tRF-3 | none | |
| tRNA-Lys-CTT-2_fiveprime | −0.29 | 0.033 | tRF-5 | none | |
| tRNA-Lys-CTT-3_fiveprime | −0.35 | 0.016 | tRF-5 | none | |
| tRNA-Glu-TTC-2_wholecounts | -0.37 | 0.045 | undefined | none | |
| tRNA-Ala-CGC-7_other | −0.44 | 0.024 | undefined | none | tRF-Ala-CGC-006 was elevated in MASLD patient plasma and in the plasma of BALBc mice after 2–6 weeks on a high cholesterol diet [46]. |
| tRNA-Glu-TTC-1_wholecounts | −0.53 | 0.006 | undefined | none | |
| tRNA-Gly-CCC-2_fiveprime | −0.54 | 0.013 | tRF-5 | AS-tRNA increased | tRF-5 tRNA-Gly-CCC-2 was upregulated and positively correlated with the inflammation level and ANG expression in mouse tibialis anterior (TA) muscle after injury from injection of 50 μL of 10 μΜ cardiotoxin [50]. |
| tRNA-Glu-CTC-1-1_partialprecounts | −0.57 | 0.008 | undefined | none | |
| tRNA-Glu-CTC-1-2_partialprecounts | −0.57 | 0.008 | undefined | none | |
| tRNA-Glu-CTC-1-3_partialprecounts | −0.57 | 0.008 | undefined | none | |
| tRNA-Glu-TTC-3_wholecounts | −0.63 | 0.001 | undefined | none | |
| tRNA-Glu-CTC-1_wholecounts | −0.64 | 0.0006 | undefined | none |
2.3. PCB Exposures in HFD-Fed Mice Affect Hepatic tRNA Modifications Detected by RT Misincorporation Terminations by tRAX
3. Discussion
3.1. tRNAs
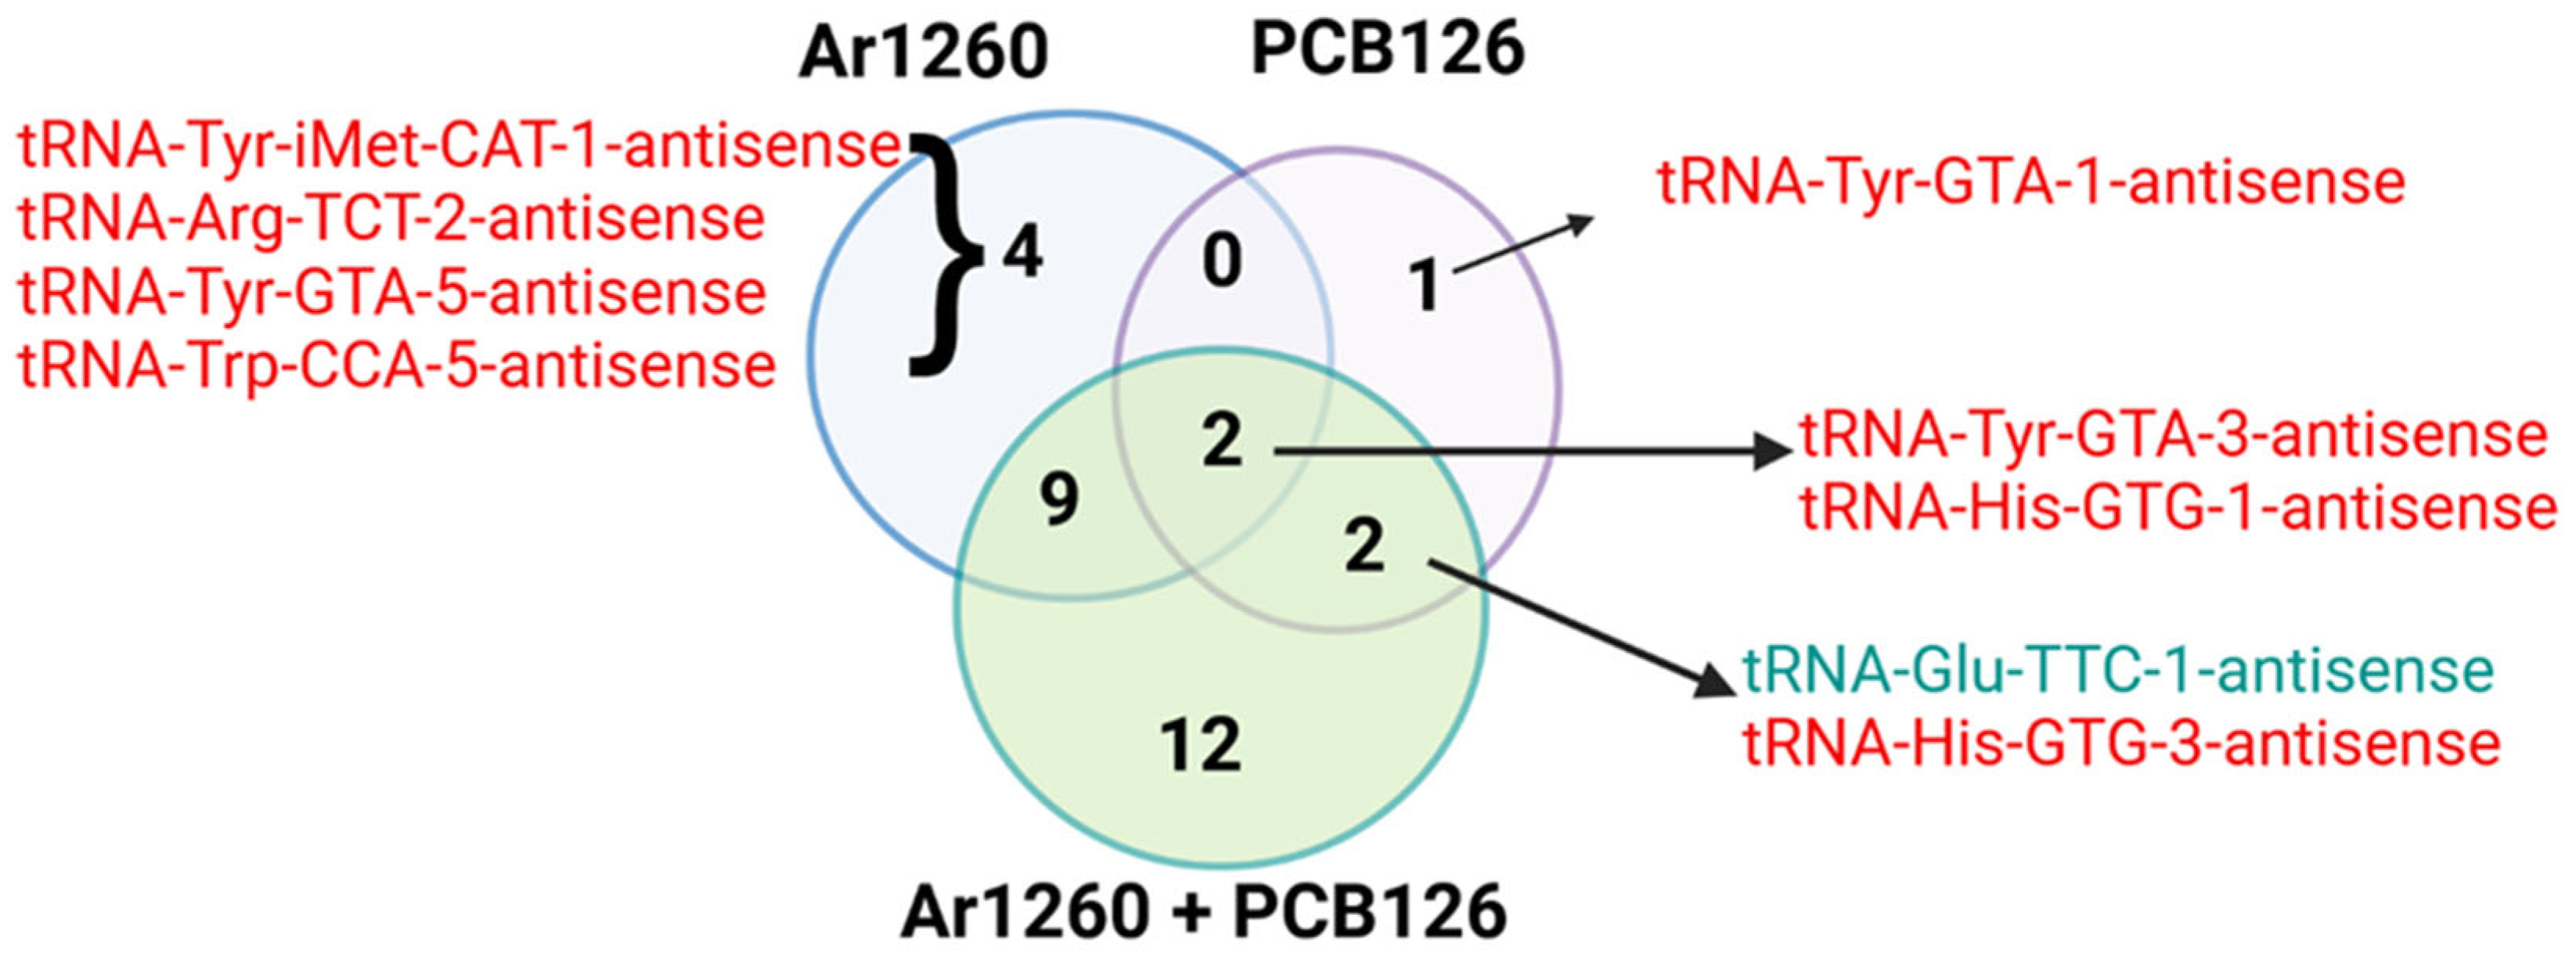
3.2. AS-tRNAs
3.3. tRFs
4. Conclusions
Limitations
5. Materials and Methods
5.1. Animal Studies
5.2. Short RNA Sequencing
5.3. Bioinformatics Analysis
5.4. Venn Diagrams
Supplementary Materials
Author Contributions
Funding
Institutional Review Board Statement
Data Availability Statement
Conflicts of Interest
Abbreviations
| PCB | polychlorinated biphenyls |
| HFD | high-fat diet |
| MASLD | metabolic dysfunction-associated steatotic liver disease |
| MASH | metabolic dysfunction-associated steatohepatitis |
| tDRs | tRNA-derived small RNAs |
| tRF | tRNA-derived fragment |
| tsRNAs | shorter tRNA-derived small RNAs |
| AS-tRNA | antisense tRNA |
| NDL | non-dioxin like |
| DL | dioxin-like |
| AHR | arylhydrocarbon receptor |
| ANG | angiogenin |
| MDC | metabolism-disrupting chemicals |
| EDC | endocrine-disrupting chemicals |
| HCC | hepatocellular carcinoma |
| NAFLD | nonalcoholic fatty liver disease |
| ACL | anticodon loop |
| Am | 2-O-methyladenosine |
| m1A | 1-methyladenosine |
| m2,2G | N2,N2-dimethylguanosine) |
| m3C | 3-methylcytosine |
| m5C | 5-methylcytosine |
| m5U | 5-methylurdine |
| m6A | N6-methyladenosin |
| Ψ | pseudouridine |
| ELAC | Elac ribonuclease Z 2 |
| DIO | diet-induced obesity |
| ER | endoplasmic reticulum |
| UPR | unfolded protein response |
References
- Wu, H.; Eckhardt, C.M.; Baccarelli, A.A. Molecular mechanisms of environmental exposures and human disease. Nat. Rev. Genet. 2023, 24, 332–344. [Google Scholar] [CrossRef] [PubMed]
- Deierlein, A.L.; Rock, S.; Park, S. Persistent Endocrine-Disrupting Chemicals and Fatty Liver Disease. Curr. Environ. Health Rep. 2017, 4, 439–449. [Google Scholar] [CrossRef] [PubMed]
- Samala, N.; Kulkarni, M.; Lele, R.S.; Gripshover, T.C.; Lynn Wise, J.; Rai, S.N.; Cave, M.C. Associations between per- and polyfluoroalkyl substance exposures and metabolic dysfunction associated steatotic liver disease (MASLD) in adult National Health and Nutrition Examination Survey 2017 to 2018. Toxicol. Sci. 2024, 202, 142–151. [Google Scholar] [CrossRef]
- Tovoli, F.; Stefanini, B.; Mandrioli, D.; Mattioli, S.; Vornoli, A.; Sgargi, D.; Manservisi, F.; Piscaglia, F.; Curti, S.; Bolondi, L. Exploring occupational toxicant exposures in patients with metabolic dysfunction-associated steatotic liver disease: A prospective pilot study. Dig. Liver Dis. 2024, 56, 571–578. [Google Scholar] [CrossRef]
- Wahlang, B.; Jin, J.; Beier, J.I.; Hardesty, J.E.; Daly, E.F.; Schnegelberger, R.D.; Falkner, K.C.; Prough, R.A.; Kirpich, I.A.; Cave, M.C. Mechanisms of Environmental Contributions to Fatty Liver Disease. Curr. Environ. Health Rep. 2019, 6, 80–94. [Google Scholar] [CrossRef]
- Huang, D.Q.; El-Serag, H.B.; Loomba, R. Global epidemiology of NAFLD-related HCC: Trends, predictions, risk factors and prevention. Nat Rev Gastroenterol Hepatol 2021, 18, 223–238. [Google Scholar] [CrossRef]
- Cayir, A.; Byun, H.-M.; Barrow, T.M. Environmental epitranscriptomics. Environ. Res. 2020, 189, 109885. [Google Scholar] [CrossRef]
- Petri, B.J.; Cave, M.C.; Klinge, C.M. Changes in m6A in Steatotic Liver Disease. Genes 2023, 14, 1653. [Google Scholar] [CrossRef] [PubMed]
- Weiss, J.L.; Decker, J.C.; Bolano, A.; Krahn, N. Tuning tRNAs for improved translation. Front. Genet. 2024, 15, 1436860. [Google Scholar] [CrossRef]
- Chan, C.M.; Lykkesfeldt, A.E.; Parker, M.G.; Dowsett, M. Expression of nuclear receptor interacting proteins TIF-1, SUG-1, receptor interacting protein 140, and corepressor SMRT in tamoxifen-resistant breast cancer. Clin. Cancer Res. Off. J. Am. Assoc. Cancer Res. 1999, 5, 3460–3467. [Google Scholar]
- Coughlin, D.J.; Babak, T.; Nihranz, C.; Hughes, T.R.; Engelke, D.R. Prediction and verification of mouse tRNA gene families. RNA Biol. 2009, 6, 195–202. [Google Scholar] [CrossRef] [PubMed]
- Dittmar, K.A.; Goodenbour, J.M.; Pan, T. Tissue-specific differences in human transfer RNA expression. PLoS Genet 2006, 2, e221. [Google Scholar] [CrossRef]
- Geslain, R.; Pan, T. Functional analysis of human tRNA isodecoders. J. Mol. Biol. 2010, 396, 821–831. [Google Scholar] [CrossRef]
- Hughes, L.A.; Rudler, D.L.; Siira, S.J.; McCubbin, T.; Raven, S.A.; Browne, J.M.; Ermer, J.A.; Rientjes, J.; Rodger, J.; Marcellin, E.; et al. Copy number variation in tRNA isodecoder genes impairs mammalian development and balanced translation. Nat. Commun. 2023, 14, 2210. [Google Scholar] [CrossRef]
- Zhang, W.; Foo, M.; Eren, A.M.; Pan, T. tRNA modification dynamics from individual organisms to metaepitranscriptomics of microbiomes. Mol. Cell 2022, 82, 891–906. [Google Scholar] [CrossRef] [PubMed]
- Han, L.; Phizicky, E.M. A rationale for tRNA modification circuits in the anticodon loop. RNA 2018, 24, 1277–1284. [Google Scholar] [CrossRef]
- Klinge, C.M.; Piell, K.M.; Petri, B.J.; He, L.; Zhang, X.; Pan, J.; Rai, S.N.; Andreeva, K.; Rouchka, E.C.; Wahlang, B.; et al. Combined exposure to polychlorinated biphenyls and high-fat diet modifies the global epitranscriptomic landscape in mouse liver. Environ. Epigenetics 2021, 7, dvab008. [Google Scholar]
- Cui, W.; Zhao, D.; Jiang, J.; Tang, F.; Zhang, C.; Duan, C. tRNA Modifications and Modifying Enzymes in Disease, the Potential Therapeutic Targets. Int. J. Biol. Sci. 2023, 19, 1146–1162. [Google Scholar] [CrossRef]
- Lin, S.; Kuang, M. RNA modification-mediated mRNA translation regulation in liver cancer: Mechanisms and clinical perspectives. Nat. Rev. Gastroenterol. Hepatol. 2024, 21, 267–281. [Google Scholar] [CrossRef]
- Petri, B.J.; Piell, K.M.; Wahlang, B.; Head, K.Z.; Andreeva, K.; Rouchka, E.C.; Pan, J.; Rai, S.N.; Cave, M.C.; Klinge, C.M. Multiomics analysis of the impact of polychlorinated biphenyls on environmental liver disease in a mouse model. Environ. Toxicol. Pharmacol. 2022, 94, 103928. [Google Scholar] [CrossRef]
- Chen, L.; Wu, Y.; Tang, Q.; Tang, F. Oncogenic-tsRNA: A novel diagnostic and therapeutic molecule for cancer clinic. J. Cancer 2024, 15, 5403–5414. [Google Scholar] [CrossRef] [PubMed]
- Su, Z.; Wilson, B.; Kumar, P.; Dutta, A. Noncanonical Roles of tRNAs: tRNA Fragments and Beyond. Annu. Rev. Genet. 2020, 54, 47–69. [Google Scholar] [CrossRef]
- Jacovetti, C.; Bayazit, M.B.; Regazzi, R. Emerging Classes of Small Non-Coding RNAs With Potential Implications in Diabetes and Associated Metabolic Disorders. Front. Endocrinol. 2021, 12, 670719. [Google Scholar] [CrossRef]
- Murillo-Recio, M.; Martínez de Lejarza Samper, I.M.; Tuñí i Domínguez, C.; Ribas de Pouplana, L.; Torres, A.G. tRNAstudio: Facilitating the study of human mature tRNAs from deep sequencing datasets. Bioinformatics 2022, 38, 2934–2936. [Google Scholar] [CrossRef] [PubMed]
- Pekarsky, Y.; Balatti, V.; Croce, C.M. tRNA-derived fragments (tRFs) in cancer. J. Cell Commun. Signal. 2022, 17, 47–54. [Google Scholar] [CrossRef] [PubMed]
- Guan, L.; Grigoriev, A. tatDB: A database of Ago1-mediated targets of transfer RNA fragments. Nucleic Acids Res. 2023, 51, D297–D305. [Google Scholar] [CrossRef]
- Suresh, P.S.; Thankachan, S.; Venkatesh, T. Landscape of Clinically Relevant Exosomal tRNA-Derived Non-coding RNAs. Mol. Biotechnol. 2023, 65, 300–310. [Google Scholar] [CrossRef]
- Muthukumar, S.; Li, C.-T.; Liu, R.-J.; Bellodi, C. Roles and regulation of tRNA-derived small RNAs in animals. Nat. Rev. Mol. Cell Biol. 2024, 25, 359–378. [Google Scholar] [CrossRef]
- Zhang, L.; Liu, J.; Hou, Y. Classification, function, and advances in tsRNA in non-neoplastic diseases. Cell Death Dis. 2023, 14, 748. [Google Scholar] [CrossRef]
- Hawwash, N.; Sperrin, M.; Martin, G.P.; Joshu, C.E.; Florido, R.; Platz, E.A.; Renehan, A.G. Waist circumference-years and cancer risk: A prospective study of the association and comparison of predictive performance with waist circumference and body mass index. Br. J. Cancer 2024, 131, 1623–1634. [Google Scholar] [CrossRef]
- Shen, Y.; Yu, X.; Zhu, L.; Li, T.; Yan, Z.; Guo, J. Transfer RNA-derived fragments and tRNA halves: Biogenesis, biological functions and their roles in diseases. J. Mol. Med. 2018, 96, 1167–1176. [Google Scholar] [CrossRef]
- Tzur, Y.; Winek, K.; Madrer, N.; Dubnov, S.; Bennett, E.R.; Greenberg, D.S.; Hanin, G.; Gammal, A.; Tam, J.; Arkin, I.T.; et al. Lysine tRNA fragments and miR-194-5p co-regulate hepatic steatosis via β-Klotho and perilipin 2. Mol. Metab. 2024, 79, 101856. [Google Scholar] [CrossRef] [PubMed]
- Jin, J.; Wahlang, B.; Shi, H.; Hardesty, J.E.; Falkner, K.C.; Head, K.Z.; Srivastava, S.; Merchant, M.L.; Rai, S.N.; Cave, M.C.; et al. Dioxin-like and non-dioxin-like PCBs differentially regulate the hepatic proteome and modify diet-induced nonalcoholic fatty liver disease severity. Med. Chem. Res. 2020, 29, 1247–1263. [Google Scholar] [CrossRef]
- Heindel, J.J.; Blumberg, B.; Cave, M.; Machtinger, R.; Mantovani, A.; Mendez, M.A.; Nadal, A.; Palanza, P.; Panzica, G.; Sargis, R.; et al. Metabolism disrupting chemicals and metabolic disorders. Reprod. Toxicol. 2017, 68, 3–33. [Google Scholar] [CrossRef] [PubMed]
- Jandacek, R.J.; Tso, P. Enterohepatic circulation of organochlorine compounds: A site for nutritional intervention. J. Nutr. Biochem. 2007, 18, 163–167. [Google Scholar] [CrossRef]
- Cave, M.; Appana, S.; Patel, M.; Falkner, K.C.; McClain, C.J.; Brock, G. Polychlorinated biphenyls, lead, and mercury are associated with liver disease in American adults: NHANES 2003-2004. Environ. Health Perspect. 2010, 118, 1735–1742. [Google Scholar] [CrossRef]
- Wahlang, B.; Song, M.; Beier, J.I.; Cameron Falkner, K.; Al-Eryani, L.; Clair, H.B.; Prough, R.A.; Osborne, T.S.; Malarkey, D.E.; Christopher States, J.; et al. Evaluation of Aroclor 1260 exposure in a mouse model of diet-induced obesity and non-alcoholic fatty liver disease. Toxicol Appl Pharmacol. 2014, 279, 380–390. [Google Scholar] [CrossRef] [PubMed]
- Shi, H.; Jan, J.; Hardesty, J.E.; Falkner, K.C.; Prough, R.A.; Balamurugan, A.N.; Mokshagundam, S.P.; Chari, S.T.; Cave, M.C. Polychlorinated biphenyl exposures differentially regulate hepatic metabolism and pancreatic function: Implications for nonalcoholic steatohepatitis and diabetes. Toxicol. Appl. Pharmacol. 2019, 363, 22–33. [Google Scholar] [CrossRef]
- Wahlang, B.; Jin, J.; Hardesty, J.E.; Head, K.Z.; Shi, H.; Falkner, K.C.; Prough, R.A.; Klinge, C.M.; Cave, M.C. Identifying sex differences arising from polychlorinated biphenyl exposures in toxicant-associated liver disease. Food Chem. Toxicol. 2019, 129, 64–76. [Google Scholar] [CrossRef]
- Suzuki, T. The expanding world of tRNA modifications and their disease relevance. Nat. Rev. Mol. Cell Biol. 2021, 22, 375–392. [Google Scholar] [CrossRef]
- Holmes, A.D.; Howard, J.M.; Chan, P.P.; Lowe, T.M. tRNA Analysis of eXpression (tRAX): A tool for integrating analysis of tRNAs, tRNA-derived small RNAs, and tRNA modifications. bioRxiv 2022. bioRxiv:2022.2007.2002.498565. [Google Scholar]
- Dai, H.; Yang, X.; Sheng, X.; Wang, Y.; Zhang, S.; Zhang, X.; Hu, L.; Zhang, Z.; Dong, X.; Yin, W.; et al. XPOT Disruption Suppresses TNBC Growth through Inhibition of Specific tRNA Nuclear Exportation and TTC19 Expression to Induce Cytokinesis Failure. Int. J. Biol. Sci. 2023, 19, 5319–5336. [Google Scholar] [CrossRef] [PubMed]
- Gerber, A.; Ito, K.; Chu, C.-S.; Roeder, R.G. Gene-Specific Control of tRNA Expression by RNA Polymerase II. Mol. Cell 2020, 78, 765–778.e767. [Google Scholar] [CrossRef]
- Vilardo, E.; Amman, F.; Toth, U.; Kotter, A.; Helm, M.; Rossmanith, W. Functional characterization of the human tRNA methyltransferases TRMT10A and TRMT10B. Nucleic Acids Res. 2020, 48, 6157–6169. [Google Scholar] [CrossRef]
- Pinzaru, A.M.; Tavazoie, S.F. Transfer RNAs as dynamic and critical regulators of cancer progression. Nat. Rev. Cancer 2023, 23, 746–761. [Google Scholar] [CrossRef]
- Huang, P.; Tu, B.; Liao, H.-j.; Huang, F.-z.; Li, Z.-z.; Zhu, K.-y.; Dai, F.; Liu, H.-z.; Zhang, T.-y.; Sun, C.-z. Elevation of plasma tRNA fragments as a promising biomarker for liver fibrosis in nonalcoholic fatty liver disease. Sci. Rep. 2021, 11, 5886. [Google Scholar] [CrossRef] [PubMed]
- Guillon, J.; Coquelet, H.; Leman, G.; Toutain, B.; Petit, C.; Henry, C.; Boissard, A.; Guette, C.; Coqueret, O. tRNA biogenesis and specific aminoacyl-tRNA synthetases regulate senescence stability under the control of mTOR. PLoS Genet. 2021, 17, e1009953. [Google Scholar] [CrossRef]
- Jin, H.; Yeom, J.-H.; Shin, E.; Ha, Y.; Liu, H.; Kim, D.; Joo, M.; Kim, Y.-H.; Kim, H.K.; Ryu, M.; et al. 5′-tRNAGly(GCC) halves generated by IRE1α are linked to the ER stress response. Nat. Commun. 2024, 15, 9273. [Google Scholar] [CrossRef]
- Chen, W.; Peng, W.; Wang, R.; Bai, S.; Cao, M.; Xiong, S.; Li, Y.; Yang, Y.; Liang, J.; Liu, L.; et al. Exosome-derived tRNA fragments tRF-GluCTC-0005 promotes pancreatic cancer liver metastasis by activating hepatic stellate cells. Cell Death Dis. 2024, 15, 102. [Google Scholar] [CrossRef]
- Shen, L.; Liao, T.; Chen, Q.; Lei, Y.; Wang, L.; Gu, H.; Qiu, Y.; Zheng, T.; Yang, Y.; Wei, C.; et al. tRNA-derived small RNA, 5′tiRNA-Gly-CCC, promotes skeletal muscle regeneration through the inflammatory response. J. Cachexia Sarcopenia Muscle 2023, 14, 1033–1045. [Google Scholar] [CrossRef]
- Torres, A.G.; Reina, O.; Stephan-Otto Attolini, C.; Ribas de Pouplana, L. Differential expression of human tRNA genes drives the abundance of tRNA-derived fragments. Proc. Natl. Acad. Sci. USA 2019, 116, 8451–8456. [Google Scholar] [CrossRef] [PubMed]
- Cappannini, A.; Ray, A.; Purta, E.; Mukherjee, S.; Boccaletto, P.; Moafinejad, S.N.; Lechner, A.; Barchet, C.; Klaholz, B.P.; Stefaniak, F.; et al. MODOMICS: A database of RNA modifications and related information. 2023 update. Nucleic Acids Res. 2024, 52, D239–D244. [Google Scholar] [CrossRef] [PubMed]
- Oerum, S.; Dégut, C.; Barraud, P.; Tisné, C. m1A Post-Transcriptional Modification in tRNAs. Biomolecules 2017, 7, 20. [Google Scholar] [CrossRef]
- Le, P.; Tatar, M.; Dasarathy, S.; Alkhouri, N.; Herman, W.H.; Taksler, G.B.; Deshpande, A.; Ye, W.; Adekunle, O.A.; McCullough, A.; et al. Estimated Burden of Metabolic Dysfunction–Associated Steatotic Liver Disease in US Adults, 2020 to 2050. JAMA Netw. Open 2025, 8, e2454707. [Google Scholar] [CrossRef] [PubMed]
- Younossi, Z.M.; Razavi, H.; Sherman, M.; Allen, A.M.; Anstee, Q.M.; Cusi, K.; Friedman, S.L.; Lawitz, E.; Lazarus, J.V.; Schuppan, D.; et al. Addressing the High and Rising Global Burden of Metabolic Dysfunction-Associated Steatotic Liver Disease (MASLD) and Metabolic Dysfunction-Associated Steatohepatitis (MASH): From the Growing Prevalence to Payors’ Perspective. Aliment. Pharmacol. Ther. 2025, 61, 1467–1478. [Google Scholar] [CrossRef]
- Carlsson, B.; Lindén, D.; Brolén, G.; Liljeblad, M.; Bjursell, M.; Romeo, S.; Loomba, R. Review article: The emerging role of genetics in precision medicine for patients with non-alcoholic steatohepatitis. Aliment. Pharmacol. Ther. 2020, 51, 1305–1320. [Google Scholar] [CrossRef]
- Jonas, W.; Schürmann, A. Genetic and epigenetic factors determining NAFLD risk. Mol. Metab. 2021, 50, 101111. [Google Scholar] [CrossRef]
- Maude, H.; Sanchez-Cabanillas, C.; Cebola, I. Epigenetics of Hepatic Insulin Resistance. Front. Endocrinol. 2021, 12, 681356. [Google Scholar] [CrossRef]
- Cotter, T.G.; Rinella, M. NAFLD 2020: The State of the Disease. Gastroenterology 2020, 158, 1851–1864. [Google Scholar] [CrossRef]
- Loomba, R.; Friedman, S.L.; Shulman, G.I. Mechanisms and disease consequences of nonalcoholic fatty liver disease. Cell 2021, 184, 2537–2564. [Google Scholar] [CrossRef]
- Wahlang, B.; Alexander, N.C.; Li, X.; Rouchka, E.C.; Kirpich, I.A.; Cave, M.C. Polychlorinated biphenyls altered gut microbiome in CAR and PXR knockout mice exhibiting toxicant-associated steatohepatitis. Toxicol. Rep. 2021, 8, 536–547. [Google Scholar] [CrossRef]
- Cave, M.C.; Pinkston, C.M.; Rai, S.N.; Wahlang, B.; Pavuk, M.; Head, K.Z.; Carswell, G.K.; Nelson, G.M.; Klinge, C.M.; Bell, D.A.; et al. Circulating MicroRNAs, Polychlorinated Biphenyls, and Environmental Liver Disease in the Anniston Community Health Survey. Environ. Health Perspect 2022, 130, 017003. [Google Scholar] [CrossRef] [PubMed]
- Pavuk, M.; Rosenbaum, P.F.; Lewin, M.D.; Serio, T.C.; Rago, P.; Cave, M.C.; Birnbaum, L.S. Polychlorinated biphenyls, polychlorinated dibenzo-p-dioxins, polychlorinated dibenzofurans, pesticides, and diabetes in the Anniston Community Health Survey follow-up (ACHS II): Single exposure and mixture analysis approaches. Sci. Total Environ. 2023, 877, 162920. [Google Scholar] [CrossRef] [PubMed]
- Lee, D.Y.; Kim, E.H. Therapeutic Effects of Amino Acids in Liver Diseases: Current Studies and Future Perspectives. J. Cancer Prev. 2019, 24, 72–78. [Google Scholar] [CrossRef]
- Holeček, M. Branched-chain amino acids in health and disease: Metabolism, alterations in blood plasma, and as supplements. Nutr. Metab. 2018, 15, 33. [Google Scholar] [CrossRef]
- Wang, W.; Wu, Z.; Dai, Z.; Yang, Y.; Wang, J.; Wu, G. Glycine metabolism in animals and humans: Implications for nutrition and health. Amino Acids 2013, 45, 463–477. [Google Scholar] [CrossRef] [PubMed]
- Broadfield, L.A.; Duarte, J.A.G.; Schmieder, R.; Broekaert, D.; Veys, K.; Planque, M.; Vriens, K.; Karasawa, Y.; Napolitano, F.; Fujita, S.; et al. Fat Induces Glucose Metabolism in Nontransformed Liver Cells and Promotes Liver Tumorigenesis. Cancer Res 2021, 81, 1988–2001. [Google Scholar] [CrossRef]
- Rentsch, M.; Puellmann, K.; Sirek, S.; Iesalnieks, I.; Kienle, K.; Mueller, T.; Bolder, U.; Geissler, E.; Jauch, K.-W.; Beham, A. Benefit of Kupffer cell modulation with glycine versus Kupffer cell depletion after liver transplantation in the rat: Effects on postischemic reperfusion injury, apoptotic cell death graft regeneration and survival. Transpl. Int. 2005, 18, 1079–1089. [Google Scholar] [CrossRef]
- Matthews, D.E. Review of Lysine Metabolism with a Focus on Humans. J. Nutr. 2020, 150, 2548S–2555S. [Google Scholar] [CrossRef]
- Paulusma, C.C.; Lamers, W.H.; Broer, S.; van de Graaf, S.F.J. Amino acid metabolism, transport and signalling in the liver revisited. Biochem. Pharmacol. 2022, 201, 115074. [Google Scholar] [CrossRef]
- Labbé, K.; LeBon, L.; King, B.; Vu, N.; Stoops, E.H.; Ly, N.; Lefebvre, A.; Seitzer, P.; Krishnan, S.; Heo, J.M.; et al. Specific activation of the integrated stress response uncovers regulation of central carbon metabolism and lipid droplet biogenesis. Nat. Commun. 2024, 15, 8301. [Google Scholar] [CrossRef] [PubMed]
- Grankvist, N.; Jönsson, C.; Hedin, K.; Sundqvist, N.; Sandström, P.; Björnsson, B.; Begzati, A.; Mickols, E.; Artursson, P.; Jain, M.; et al. Global 13C tracing and metabolic flux analysis of intact human liver tissue ex vivo. Nat. Metab. 2024, 6, 1963–1975. [Google Scholar] [CrossRef]
- Warren, J.M.; Sloan, D.B. Hopeful monsters: Unintended sequencing of famously malformed mite mitochondrial tRNAs reveals widespread expression and processing of sense–antisense pairs. NAR Genom. Bioinform. 2021, 3, lqaa111. [Google Scholar] [CrossRef] [PubMed]
- Magee, R.; Rigoutsos, I. On the expanding roles of tRNA fragments in modulating cell behavior. Nucleic Acids Res. 2020, 48, 9433–9448. [Google Scholar] [CrossRef]
- Hentze, M.W.; Castello, A.; Schwarzl, T.; Preiss, T. A emerging complexity of the tRNA world. Nat. Rev. Mol. Cell Biol. 2018, 19, 327. [Google Scholar] [CrossRef]
- Schimmel, P. The emerging complexity of the tRNA world: Mammalian tRNAs beyond protein synthesis. Nat. Rev. Mol. Cell Biol. 2018, 19, 45–58. [Google Scholar] [CrossRef]
- Nawrot, B.; Sochacka, E.; Düchler, M. tRNA structural and functional changes induced by oxidative stress. Cell. Mol. Life Sci. 2011, 68, 4023–4032. [Google Scholar] [CrossRef] [PubMed]
- Fu, H.; Feng, J.; Liu, Q.; Sun, F.; Tie, Y.; Zhu, J.; Xing, R.; Sun, Z.; Zheng, X. Stress induces tRNA cleavage by angiogenin in mammalian cells. FEBS Lett. 2009, 583, 437–442. [Google Scholar] [CrossRef]
- Oberbauer, V.; Schaefer, M.R. tRNA-Derived Small RNAs: Biogenesis, Modification, Function and Potential Impact on Human Disease Development. Genes 2018, 9, 607. [Google Scholar] [CrossRef]
- Liu, B.; Cao, J.; Wang, X.; Guo, C.; Liu, Y.; Wang, T. Deciphering the tRNA-derived small RNAs: Origin, development, and future. Cell Death Dis. 2021, 13, 24. [Google Scholar] [CrossRef]
- Wilson, B.; Dutta, A. Function and Therapeutic Implications of tRNA Derived Small RNAs. Front. Mol. Biosci. 2022, 9, 888424. [Google Scholar] [CrossRef] [PubMed]
- Tosar, J.P.; Cayota, A. Extracellular tRNAs and tRNA-derived fragments. RNA Biol. 2020, 17, 1149–1167. [Google Scholar] [CrossRef]
- Grewal, S.S. Why should cancer biologists care about tRNAs? tRNA synthesis, mRNA translation and the control of growth. Biochim. Biophys. Acta 2015, 1849, 898–907. [Google Scholar] [CrossRef] [PubMed]
- Huang, J.; Chen, W.; Zhou, F.; Pang, Z.; Wang, L.; Pan, T.; Wang, X. Tissue-specific reprogramming of host tRNA transcriptome by the microbiome. Genome Res. 2021, 31, 947–957. [Google Scholar] [CrossRef] [PubMed]
- Muluhngwi, P.; Alizadeh-Rad, N.; Vittitow, S.L.; Kalbfleisch, T.S.; Klinge, C.M. The miR-29 transcriptome in endocrine-sensitive and resistant breast cancer cells. Sci. Rep. 2017, 7, 5205. [Google Scholar] [CrossRef] [PubMed]
- Li, S.; Liu, J.; Zhao, M.; Su, Y.; Cong, B.; Wang, Z. RNA quality score evaluation: A preliminary study of RNA integrity number (RIN) and RNA integrity and quality number (RNA IQ). Forensic Sci. Int. 2024, 357, 111976. [Google Scholar] [CrossRef]
- Hardesty, J.E.; Wahlang, B.; Falkner, K.C.; Shi, H.; Jin, J.; Zhou, Y.; Wilkey, D.W.; Merchant, M.L.; Watson, C.T.; Feng, W.; et al. Proteomic Analysis Reveals Novel Mechanisms by Which Polychlorinated Biphenyls Compromise the Liver Promoting Diet-Induced Steatohepatitis. J. Proteome Res. 2019, 18, 1582–1594. [Google Scholar] [CrossRef]
- Andrews, S. FastQC: A Quality Control Tool for High Throughput Sequence Data. 2014. Available online: https://www.bioinformatics.babraham.ac.uk/projects/fastqc/ (accessed on 3 April 2025).
| tRNA | Log2FC | Adj p Value | Properties of Carried aa | Correspondence with AS-tRNA (Table S1) | Correspondence with tRFs (Table 4) | Other Reports |
|---|---|---|---|---|---|---|
| tRNA-Gly-GCC-2-7 | 0.51 | 0.016 | Non-polar, hydrophobic | no | no | |
| tRNA-Thr-AGT-6-1 | 0.41 | 0.039 | Polar, uncharged, hydrophilic | no | Yes: tRF-1 Increased | |
| tRNA-Cys-GCA-3-1 | 0.29 | 0.035 | Polar, hydrophobic | no | no | |
| tRNA-Val-AAC-5 | 0.27 | 0.024 | Non-polar, hydrophobic | no | Yes: tRF-5 and undefined; Both were increased. | tRNA-Val-AAC-5-tRF-5 was increased in the livers of DIO C57Bl/6J mice [32]. |
| tRNA-Glu-TTC-1 | −0.28 | 0.039 | Polar, acidic, hydrophilic | no | Yes: undefined Decreased | Increased nuclear tRNA-Glu-TTC-1 in triple-negative breast cancer cell lines MDA-MB-231 and MDA-MB-268 after stable human XPOT (exportin for tRNA) expression [42]. |
| tRNA-Thr-AGT-1-2 | −0.31 | 0.046 | Polar, hydrophilic, uncharged | no | Yes, tRF-1 Decreased | |
| tRNA-Thr-CGT-2-1 | −0.34 | 0.043 | Polar, hydrophilic, uncharged | no | Yes, tRF-1 Decreased | |
| tRNA-Gly-GCC-2-8 | −0.44 | 0.041 | Non-polar hydrophobic | no | Yes, tRF-1 Decreased | |
| tRNA-Ser-GCT-3-1 | −0.46 | 0.027 | Polar, hydrophilic | no | Yes: undefined Decreased |
| tRNA | Log2FC | Adj p Value | Properties of aa | Correspondence with AS-tRNA (Table S2) | Correspondence with tRFs (Table 5) | Other Reports |
|---|---|---|---|---|---|---|
| tRNA-Leu-CAG-2-2 | 0.62 | 0.003 | Non-polar, hydrophobic | no | Yes: undefined, Increased | |
| tRNA-Lys-CTT-9 | 0.38 | 0.021 | Polar, charged, basic | no | Yes: undefined, Increased | |
| tRNA-Glu-CTC-1 | −0.31 | 0.049 | Polar, charged, acidic | no | ||
| tRNA-Glu-TTC-1 | −0.32 | 0.018 | Polar, charged, acidic | Yes: opposite direction: AS- tRNA-Glu-TTC-1 abundance was increased | Yes, undefined, Increased | Increased nuclear tRNA-Glu-TTC-1 was reported in triple-negative breast cancer cell lines MDA-MB-231 and MDA-MB-268 after stable knockdown of human XPOT (exportin for tRNA) [42]. |
| tRNA-Glu-CTC-1-4 | −0.35 | 0.048 | Polar, acidic, hydrophilic | no | no | |
| tRNA-Thr-CGT-2-1 | −0.45 | 0.006 | Polar, hydrophilic, uncharged | no | Yes, tRF-1 Decreased | Upregulated in HEK-293 cells when RPB1 is down regulated and cells are treated with DRB to block RNA Pol II pause-release, thus blocking RNA pol II activity [43]. |
| tRNA-Glu-CTC-1-3 | −0.55 | 0.017 | Polar, charged, acidic | no | Yes, undefined Decreased | |
| tRNA-Glu-CTC-1-1 | −0.55 | 0.017 | Polar, charged, acidic | no | Yes, undefined Decreased | |
| tRNA-Glu-CTC-1-2 | −0.55 | 0.017 | Polar, charged, acidic | no | Yes, undefined Decreased |
| tRNA | Log2FC | Adj p Value | Properties of aa | Correspondence with AS-tRNA (Table S3) | Correspondence with tRFs (Table 6) | Comments and Published Reports |
|---|---|---|---|---|---|---|
| tRNA-Lys-CTT-9 | 0.46 | 0.004 | Polar, charged, basic | no | Yes, undefined Increased | |
| tRNA-iMet-CAT-2 | 0.31 | 0.016 | Non-polar, hydrophobic | Yes, but opposite direction: decreased tRNA-iMet-CAT-2_antisense abundance | Yes, tRF-3 Increased | Methylated G at position 9 [44]. Not regulated by SOX4 [45]. |
| tRNA-Phe-GAA-2 | 0.26 | 0.036 | Non-polar, aromatic side chain, hydrophobic | no | Yes, undefined Increased | |
| tRNA-Glu-TTC-1 | −0.39 | 0.004 | Polar, charged, acidic | Yes but opposite direction: increased tRNA-Glu-TTC-1_antisense | Yes, undefined Decreased | Increased nuclear tRNA-Glu-TTC-1 was reported in triple-negative breast cancer cell lines MDA-MB-231 and MDA-MB-268 after stable knockdown of human XPOT (exportin for tRNA) [42]. |
| tRNA-Gly-CCC-2 | −0.47 | 0.017 | Non-polar, hydrophobic | no | tRF-5 Decreased | |
| tRNA-Glu-CTC-1 | −0.57 | 0.0002 | Polar, charged, acidic | no | Yes, undefined Decreased | |
| tRNA-Glu-CTC-1-3 | −0.63 | 0.006 | Polar, charged, acidic | no | Yes, undefined Decreased | |
| tRNA-Glu-CTC-1-1 | −0.63 | 0.006 | Polar, charged, acidic | no | Yes, undefined Decreased |
Disclaimer/Publisher’s Note: The statements, opinions and data contained in all publications are solely those of the individual author(s) and contributor(s) and not of MDPI and/or the editor(s). MDPI and/or the editor(s) disclaim responsibility for any injury to people or property resulting from any ideas, methods, instructions or products referred to in the content. |
© 2025 by the authors. Licensee MDPI, Basel, Switzerland. This article is an open access article distributed under the terms and conditions of the Creative Commons Attribution (CC BY) license (https://creativecommons.org/licenses/by/4.0/).
Share and Cite
Klinge, C.M.; Chariker, J.H.; Piell, K.M.; Petri, B.J.; Rouchka, E.C.; Cave, M.C. Polychlorinated Biphenyl Exposure Alters tRNA Transcriptome in High-Fat Diet-Fed Mouse Liver. Non-Coding RNA 2025, 11, 41. https://doi.org/10.3390/ncrna11030041
Klinge CM, Chariker JH, Piell KM, Petri BJ, Rouchka EC, Cave MC. Polychlorinated Biphenyl Exposure Alters tRNA Transcriptome in High-Fat Diet-Fed Mouse Liver. Non-Coding RNA. 2025; 11(3):41. https://doi.org/10.3390/ncrna11030041
Chicago/Turabian StyleKlinge, Carolyn M., Julia H. Chariker, Kellianne M. Piell, Belinda J. Petri, Eric C. Rouchka, and Matthew C. Cave. 2025. "Polychlorinated Biphenyl Exposure Alters tRNA Transcriptome in High-Fat Diet-Fed Mouse Liver" Non-Coding RNA 11, no. 3: 41. https://doi.org/10.3390/ncrna11030041
APA StyleKlinge, C. M., Chariker, J. H., Piell, K. M., Petri, B. J., Rouchka, E. C., & Cave, M. C. (2025). Polychlorinated Biphenyl Exposure Alters tRNA Transcriptome in High-Fat Diet-Fed Mouse Liver. Non-Coding RNA, 11(3), 41. https://doi.org/10.3390/ncrna11030041