2.1. Deleting Individual, Internal Structural Regions from Full-Length B2 RNA Reveals Only One Region That Is Important for Transcriptional Repression
We previously found that structural regions 2, 3, and 4 were each important for transcriptional repression and/or Pol II binding when perturbed in the context of the minimal, functional B2 RNA construct (B2 RNA(81–130) [
9]. We first determined how each of these three domains functioned in the context of the full length B2 RNA. To do so we generated B2 RNA constructs each lacking one of the three regions, and assayed the mutant RNAs for their ability to repress transcription
in vitro. The transcription assays contained highly purified human Pol II, the general transcription factors TBP, TFIIB, and TFIIF, and a strong core promoter contained on a negatively supercoiled plasmid. The promoter was upstream of a G-less cassette that allowed an RNA product of defined length (390 nt) to be transcribed in the presence of ATP, CTP, and UTP. This product was resolved on a gel and quantified.
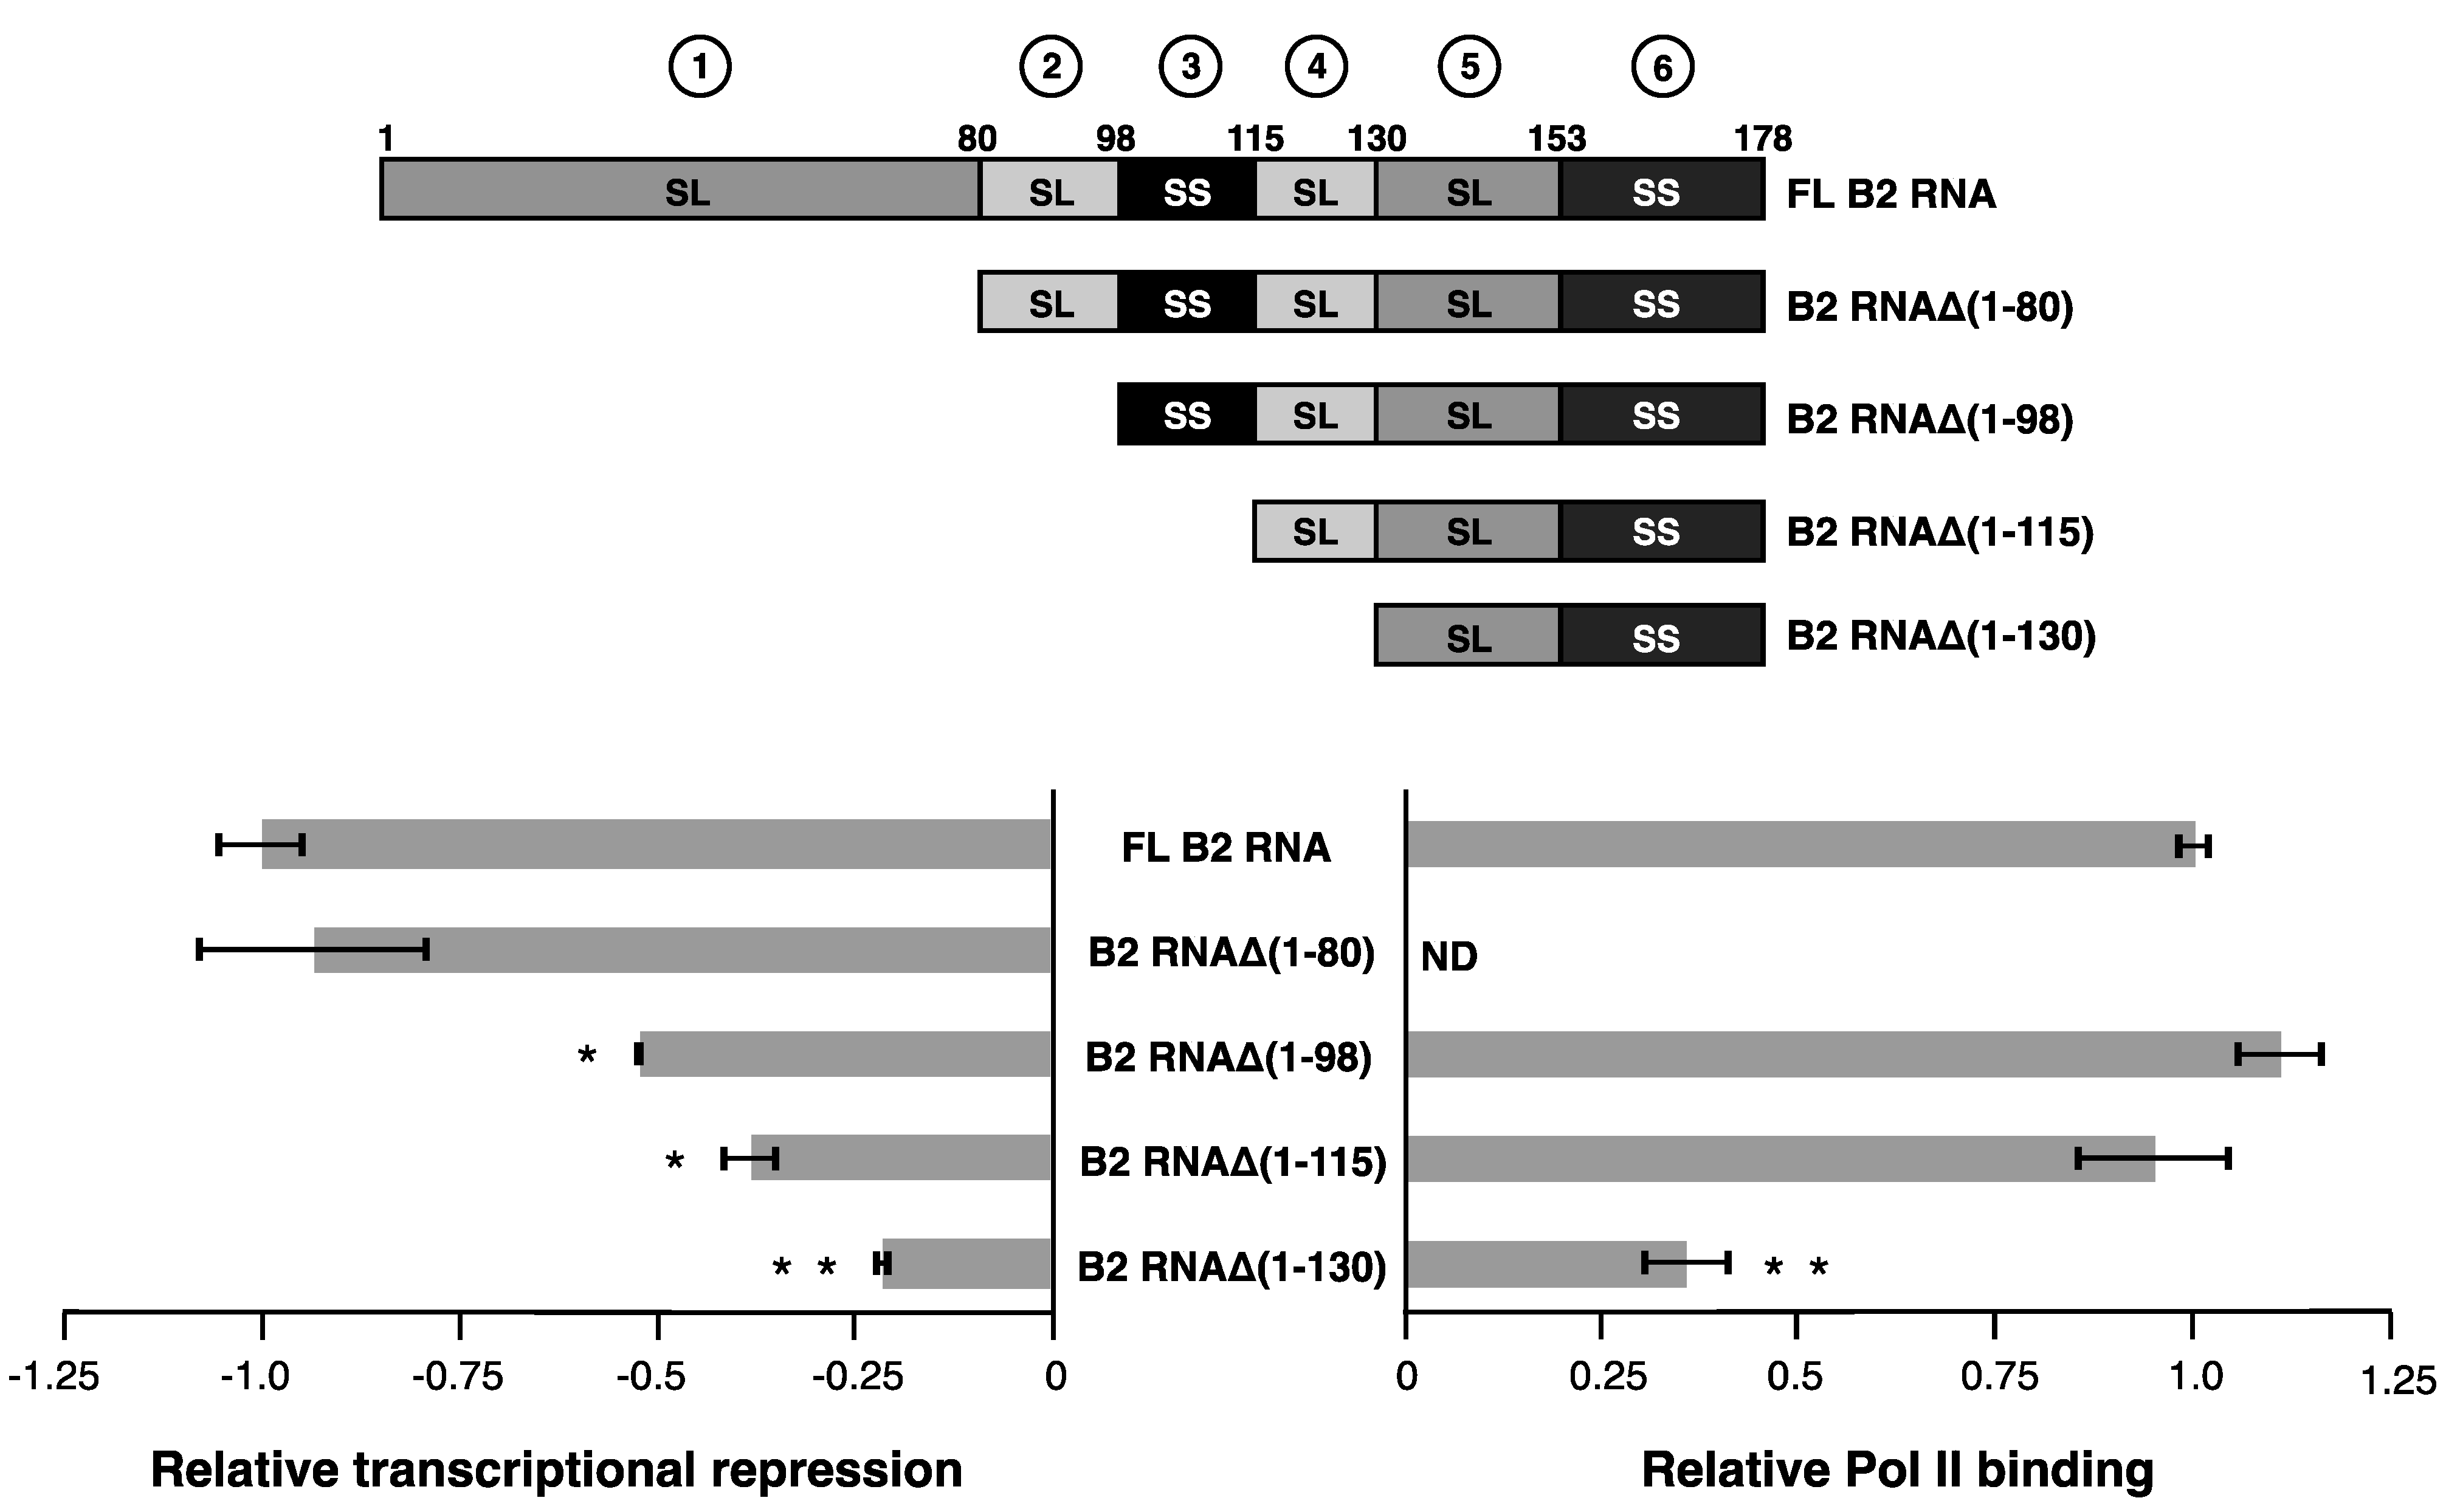
Figure 1B shows the quantitation of transcription data obtained in the absence and presence of five different B2 RNA constructs: full length B2 RNA, the minimal B2 RNA(81–130) that is functional for repression, and three internal deletions, including B2 RNAΔ(81-98), B2 RNAΔ(99–113), and B2 RNAΔ(116–130). In the case of B2 RNAΔ(99–113), the entire single stranded region (99–115) was not deleted; instead, two nucleotides in the unstructured region remained to serve as a linker between the flanking stem-loops. The data were normalized such that repression by full-length B2 RNA was set to −1.0. Hence, in the plot on the left, zero represents the un-repressed state. The data shown for full-length B2 RNA is the average from all experiments and is shown in all figures hereafter; full length B2 RNA repressed transcription 7.8-fold on average. Representative raw transcription data for the constructs tested in
Figure 1B are shown in
Figure S1A. As we had previously observed, B2 RNA(81–130) repressed transcription as well as full-length B2 RNA. Surprisingly, of the three internal deletion mutants, only B2 RNAΔ(99–113), which lacked the extended single-stranded region 3, showed a significant reduction in transcriptional repression (indicated by the asterisk). B2 RNAΔ(81–98), which lacked the stem-loop region 2, was slightly weaker than full-length B2 RNA in its ability to repress transcription, but the difference was not statistically significant. B2 RNAΔ(116–130), which lacked the stem-loop region 4, was as potent a transcriptional repressor as full-length B2 RNA.
Prior to concluding that the 99-113 region of B2 RNA is important in mediating transcriptional repression, we asked whether the impaired ability of B2 RNAΔ(99–113) to repress transcription was due to impaired ability to bind to Pol II. The other B2 RNA deletions, which maintained full ability to repress transcription were not tested in binding assays (indicated by ND, in the plot on the right), since all previous experiments that we have done with ncRNA repressors have conclusively shown that full repression requires high affinity binding to Pol II [
5,
9,
11]. To evaluate binding,
32P‑labeled full length B2 RNA and B2 RNAΔ(99–113) were incubated with Pol II, and the mixtures were run on native gels to resolve bound RNA from unbound RNA. These electrophoretic mobility shift assays were quantitated to determine the amount of RNA bound to Pol II, and the data were normalized to binding by full-length B2 RNA, which was set to a value of 1.0. Representative raw binding data for the constructs tested in
Figure 1B are shown in
Figure S1B. As shown in the plot on the right side of
Figure 1B, there was a small but statistically significant reduction in the capacity of B2 RNAΔ(99–113) to bind to Pol II compared to full length B2 RNA. Importantly, however, the reduction was not large enough to account for the impact that deleting 99–113 had on transcriptional repression. Hence, we conclude that single-stranded region 3 is important for mediating transcriptional repression in the context of full length B2 RNA.
The observations in
Figure 1B were surprising given our earlier studies, and suggest that the structure-function relationships in full length B2 RNA are more complex than in a minimal functional piece of the RNA. Specifically, deletion of the stem-loop in region 2 from full length B2 RNA did not cause a significant reduction in transcriptional repression, whereas deleting it from B2 RNA(81–130) abolished transcriptional repression [
9]. Moreover, deletion of the stem-loop in region 4 from full length B2 RNA did not cause a reduction in transcriptional repression, whereas deleting it from B2 RNA(81–130) abolished transcriptional repression and Pol II binding [
9]. Together these observations suggest it is possible that other regions of B2 RNA could function in mediating the repression of Pol II transcription, and moreover, these regions could function redundantly with regions 2 and 4 of B2 RNA. For example, deletion of the region 2 stem-loop effectively replaced it with the region 1 stem-loop, and deletion of the region 4 stem-loop effectively replaced it with the region 5 stem-loop. Perhaps transcriptional repression requires that stem-loop structures flank single-stranded region 3, but the nature of those structures is modular. In this model, the stem-loops in regions 1 and 2 act redundantly, and the stem-loops in regions 4 and 5 act redundantly.
2.2. Serially Deleting Structural Regions from the 5’ End or 3’ End of B2 RNA Reveals a Structural Pattern That is Required for Transcriptional Repression
As a strategy to test the model proposed above we systematically truncated B2 RNA by serially removing structural regions from the 5’ end or the 3’ end, and then determined the effect on transcriptional repression. A schematic of the deletion mutants that removed structural regions from the 5’ end is shown at the top of
Figure 2. The impact of the deletions on transcriptional repression is shown in the plot on the bottom left of
Figure 2. Removing structural region 1 to generate B2 RNAΔ(1–80), minimally impacted the ability of B2 RNA to repress transcription. Further removal of the stem-loop region 2, generating B2 RNAΔ(1–98), significantly decreased the ability to repress transcription. B2 RNAΔ(1–98) remained fully functional in Pol II binding (
Figure 2, right plot), allowing us to conclude that region 2 indeed contributes to transcriptional repression. Taken together with the data in
Figure 1B, we conclude that the region 1 stem-loop and the region 2 stem-loop can act redundantly in mediating transcriptional repression—one, or both, of these regions needs to be present for B2 RNA to repress Pol II transcription. Moreover, when both regions were deleted, the resulting B2 RNAΔ(1–98) binds Pol II as well as full-length B2 RNA, which shows that transcriptional repression can be separated from Pol II binding, and implying that regions 1 and 2 can act as transcriptional repression domains.
We continued deletions from the 5’ end to determine if other regions were important for transcriptional repression, or Pol II binding. The two remaining B2 RNA constructs that serially deleted regions 3 then 4, B2 RNA (B2 RNAΔ(1–115) and B2 RNAΔ(1–130)), were each significantly impaired in their ability to repress transcription when compared to full-length B2 RNA, as expected. To specifically ask if regions 3 and 4 contribute to repression, we compared each deletion to its next longest neighbor in the deletion series. Only the difference in repression between B2 RNAΔ(1–130) and B2 RNAΔ(1–115), its next longest neighbor, was significant (indicated by two asterisks), suggesting region 4 was important for repression. However, as shown in the plot on the right side of
Figure 2, B2 RNAΔ(1–130)) was significantly impaired for binding to Pol II. Therefore, we conclude that region 4 contributes to binding to Pol II, which is consistent with our earlier observations in the context of B2 RNA(81–130) [
9].
Figure 2.
Serially deleting structural regions from the 5' end of B2 RNA shows that the stem-loop in region 2 functions in transcriptional repression. Relative transcriptional repression is shown in the plot on the left; zero represents no repression. The plot on the right shows binding to Pol II, where a value of 1.0 on the X-axis represents complete binding and ND indicates not tested in binding assays. A single asterisk indicates a statistically significant difference in transcriptional repression between the deletion construct and full-length B2 RNA (i.e., a p value < 0.05). Two asterisks (* *) indicate that the deletion construct is significantly different from both full-length B2 RNA and its next longest neighbor. For example, B2 RNAΔ(1–130) is significantly different from both full-length B2 RNA, and B2 RNAΔ(1-115). The deletion constructs are illustrated in the schematic above the plot.
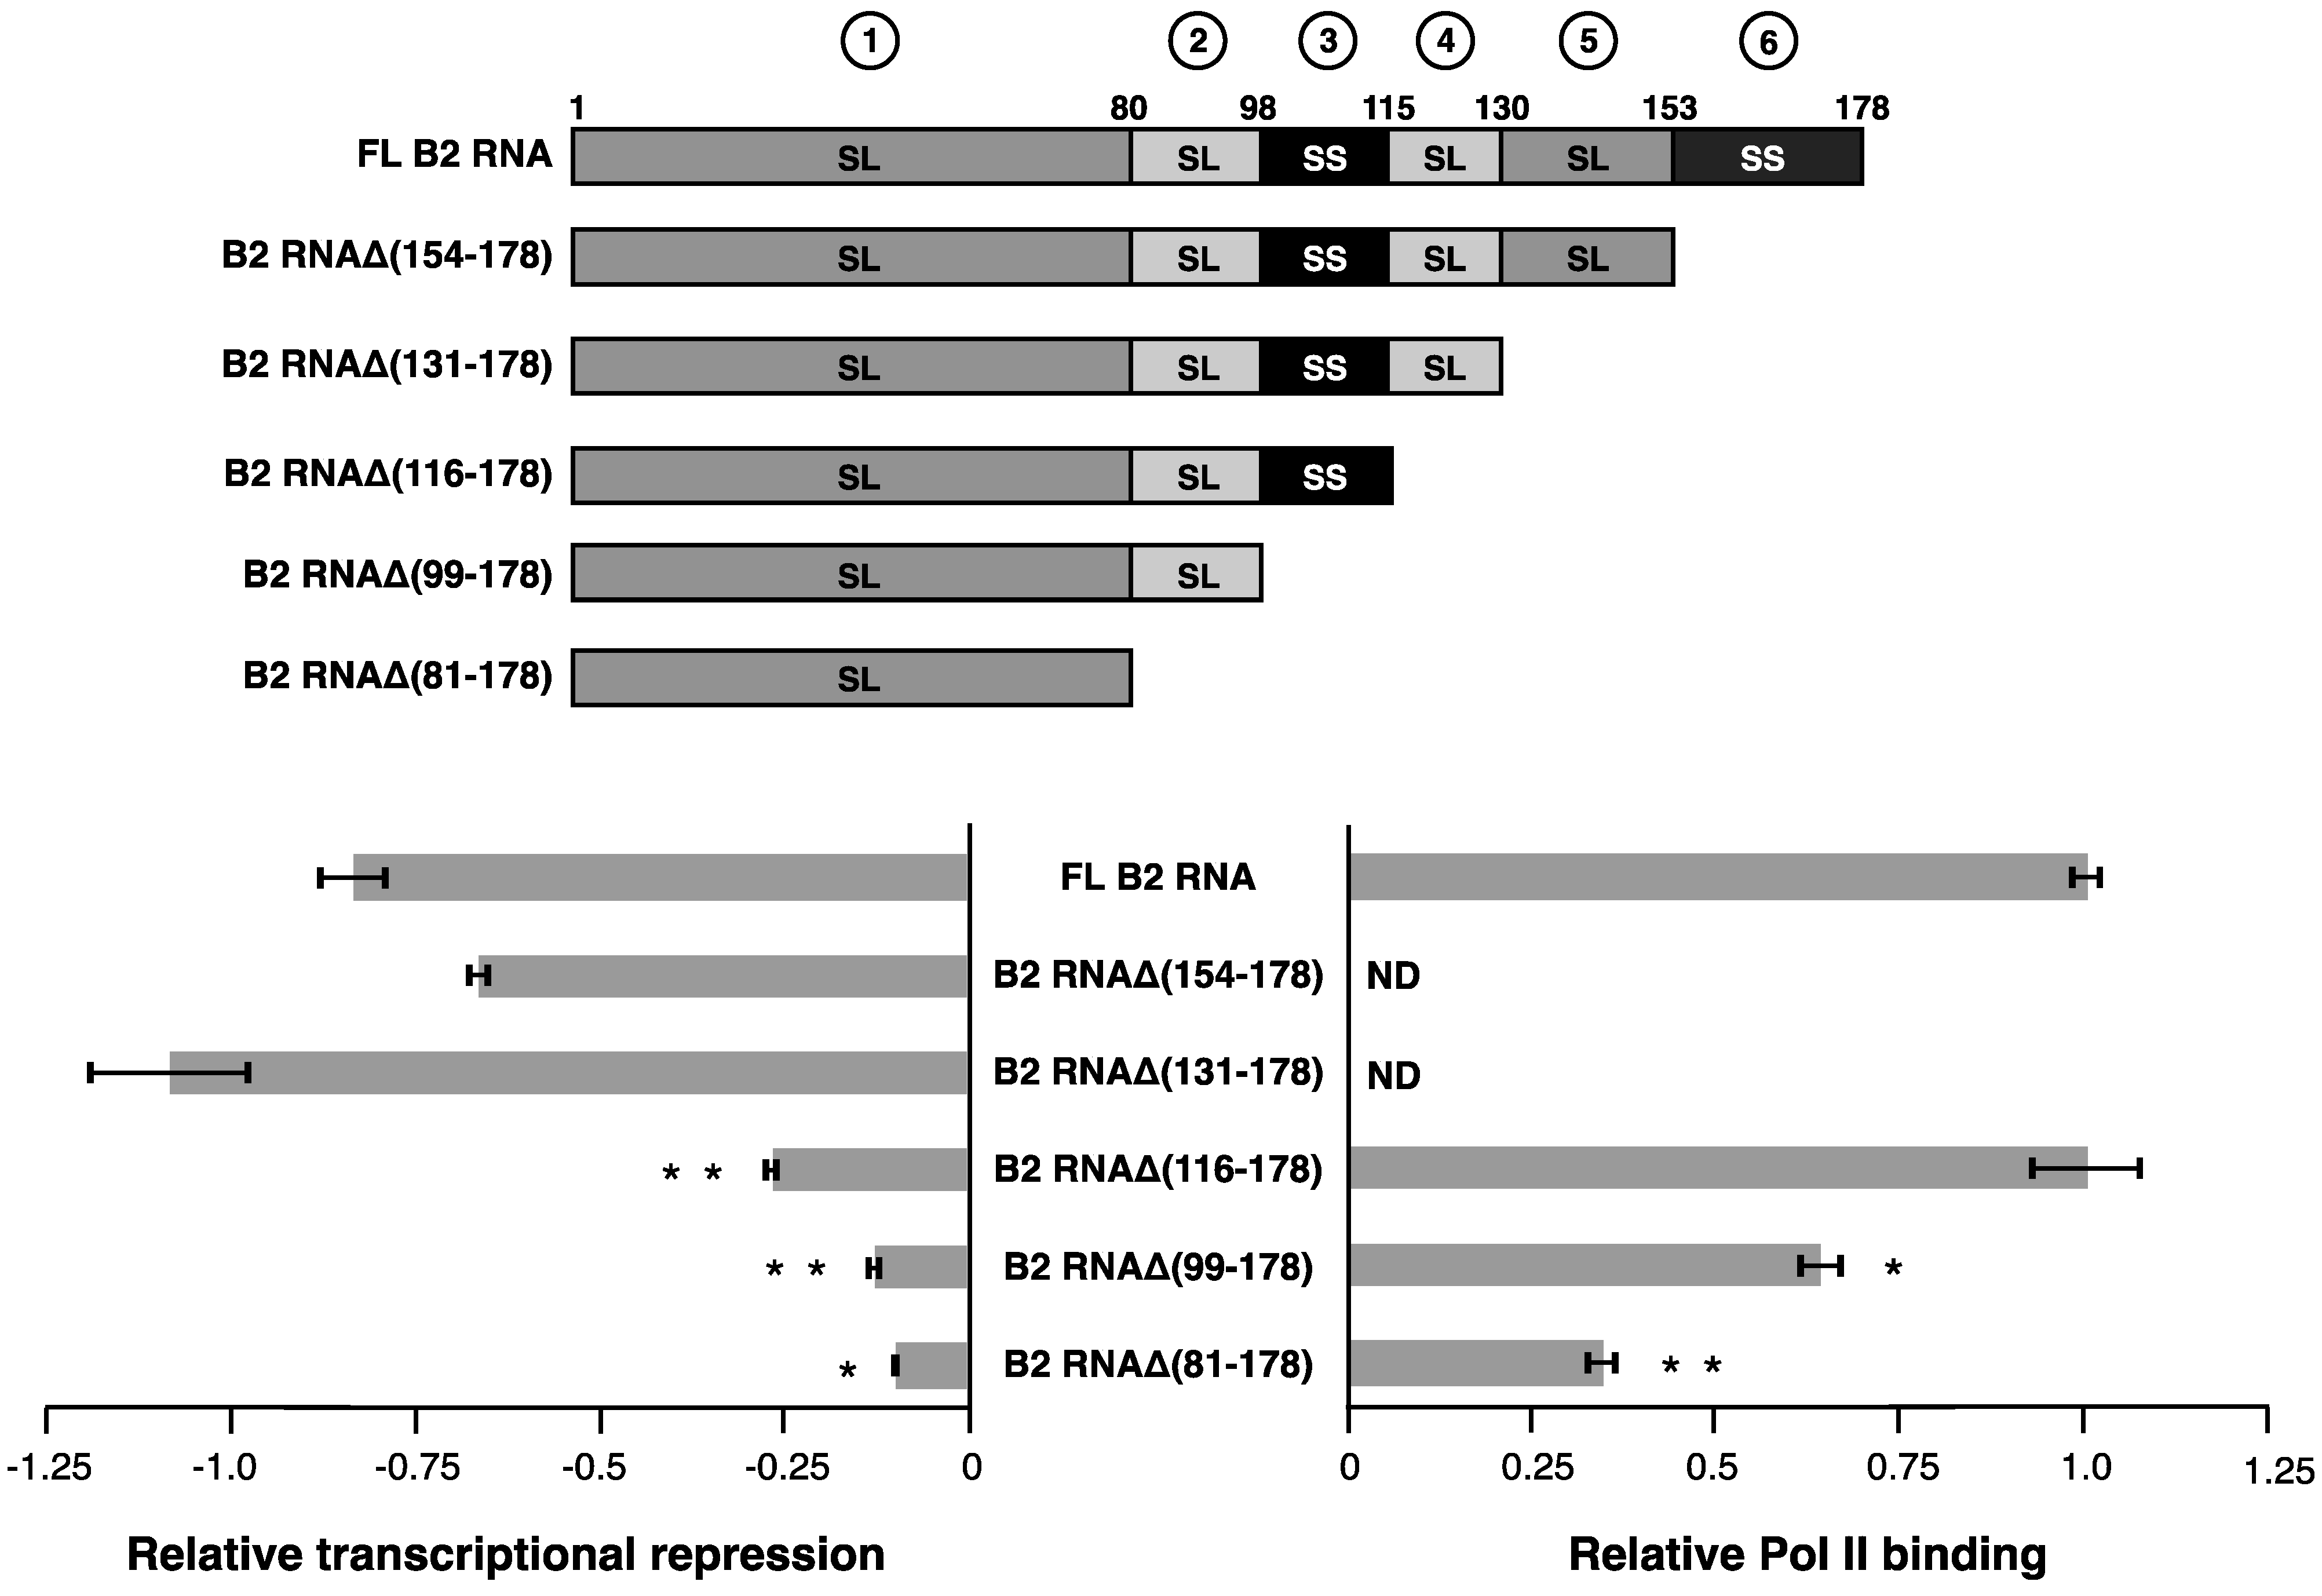
We performed an analogous set of experiments, deleting structural regions from the 3’ end of B2 RNA (diagrammed at the top of
Figure 3) and testing their ability to repress Pol II transcription. Removing the unstructured A/U rich tail in region 6 (nucleotides 154–178) and the stem-loop in region 5 (nucleotides 131–153) did not decrease transcriptional repression (bottom left plot of
Figure 3). The first statistically significant decrease in the capacity to repress transcription occurred as the stem-loop encompassing nucleotides 116–130 (region 4) was additionally deleted to form B2 RNAΔ(116–178). This decrease in the ability to repress transcription was significant both compared to the full-length RNA and to its next longest neighbor, B2 RNAΔ(131–178). Moreover, B2 RNAΔ(116–178) was fully functional in Pol II binding (
Figure 3, right plot). Taken together with the data in
Figure 1B, we conclude that the region 4 stem-loop and the region 5 stem-loop can act redundantly in mediating transcriptional repression – one, or both, of these regions need to be present for B2 RNA to repress Pol II transcription. Importantly, neither region is required for Pol II binding, showing that transcriptional repression can be separated from Pol II binding, and implying that regions 4 and 5 can act as transcriptional repression domains.
Continuing with the 3’ end deletion series, an additional impact on repression was observed as the single-stranded region from 99 to 115 (region 3) was removed, generating B2 RNAΔ(99–178). B2 RNAΔ(99–178) showed a slight but statistically significant reduction in Pol II binding; however this reduction was not enough to explain the entire effect of the deletion on transcriptional repression. This is consistent with the earlier observations that single-stranded region 3 is important for transcriptional repression in the context of both full length B2 RNA (
Figure 1B) and B2 RNA(81–130) [
9]. Lastly, the additional truncation of region 2 to generate B2 RNAΔ(81–178) had little impact compared to its next longest neighbor, but this RNA remained impaired for repression compared to full-length RNA as expected. B2 RNAΔ(81–178) was reduced in its ability to bind to Pol II to a similar extent as the reduction in its ability to repress transcription.
Figure 3.
Serially deleting structural regions from the 3’ end of B2 RNA shows that two regions (3 and 4) contribute to transcriptional repression. See the legend in
Figure 2 for a description of the plots and labeling.
Figure 3.
Serially deleting structural regions from the 3’ end of B2 RNA shows that two regions (3 and 4) contribute to transcriptional repression. See the legend in
Figure 2 for a description of the plots and labeling.
2.3. The Ability to Repress Transcription Does not Correlate with RNA Length
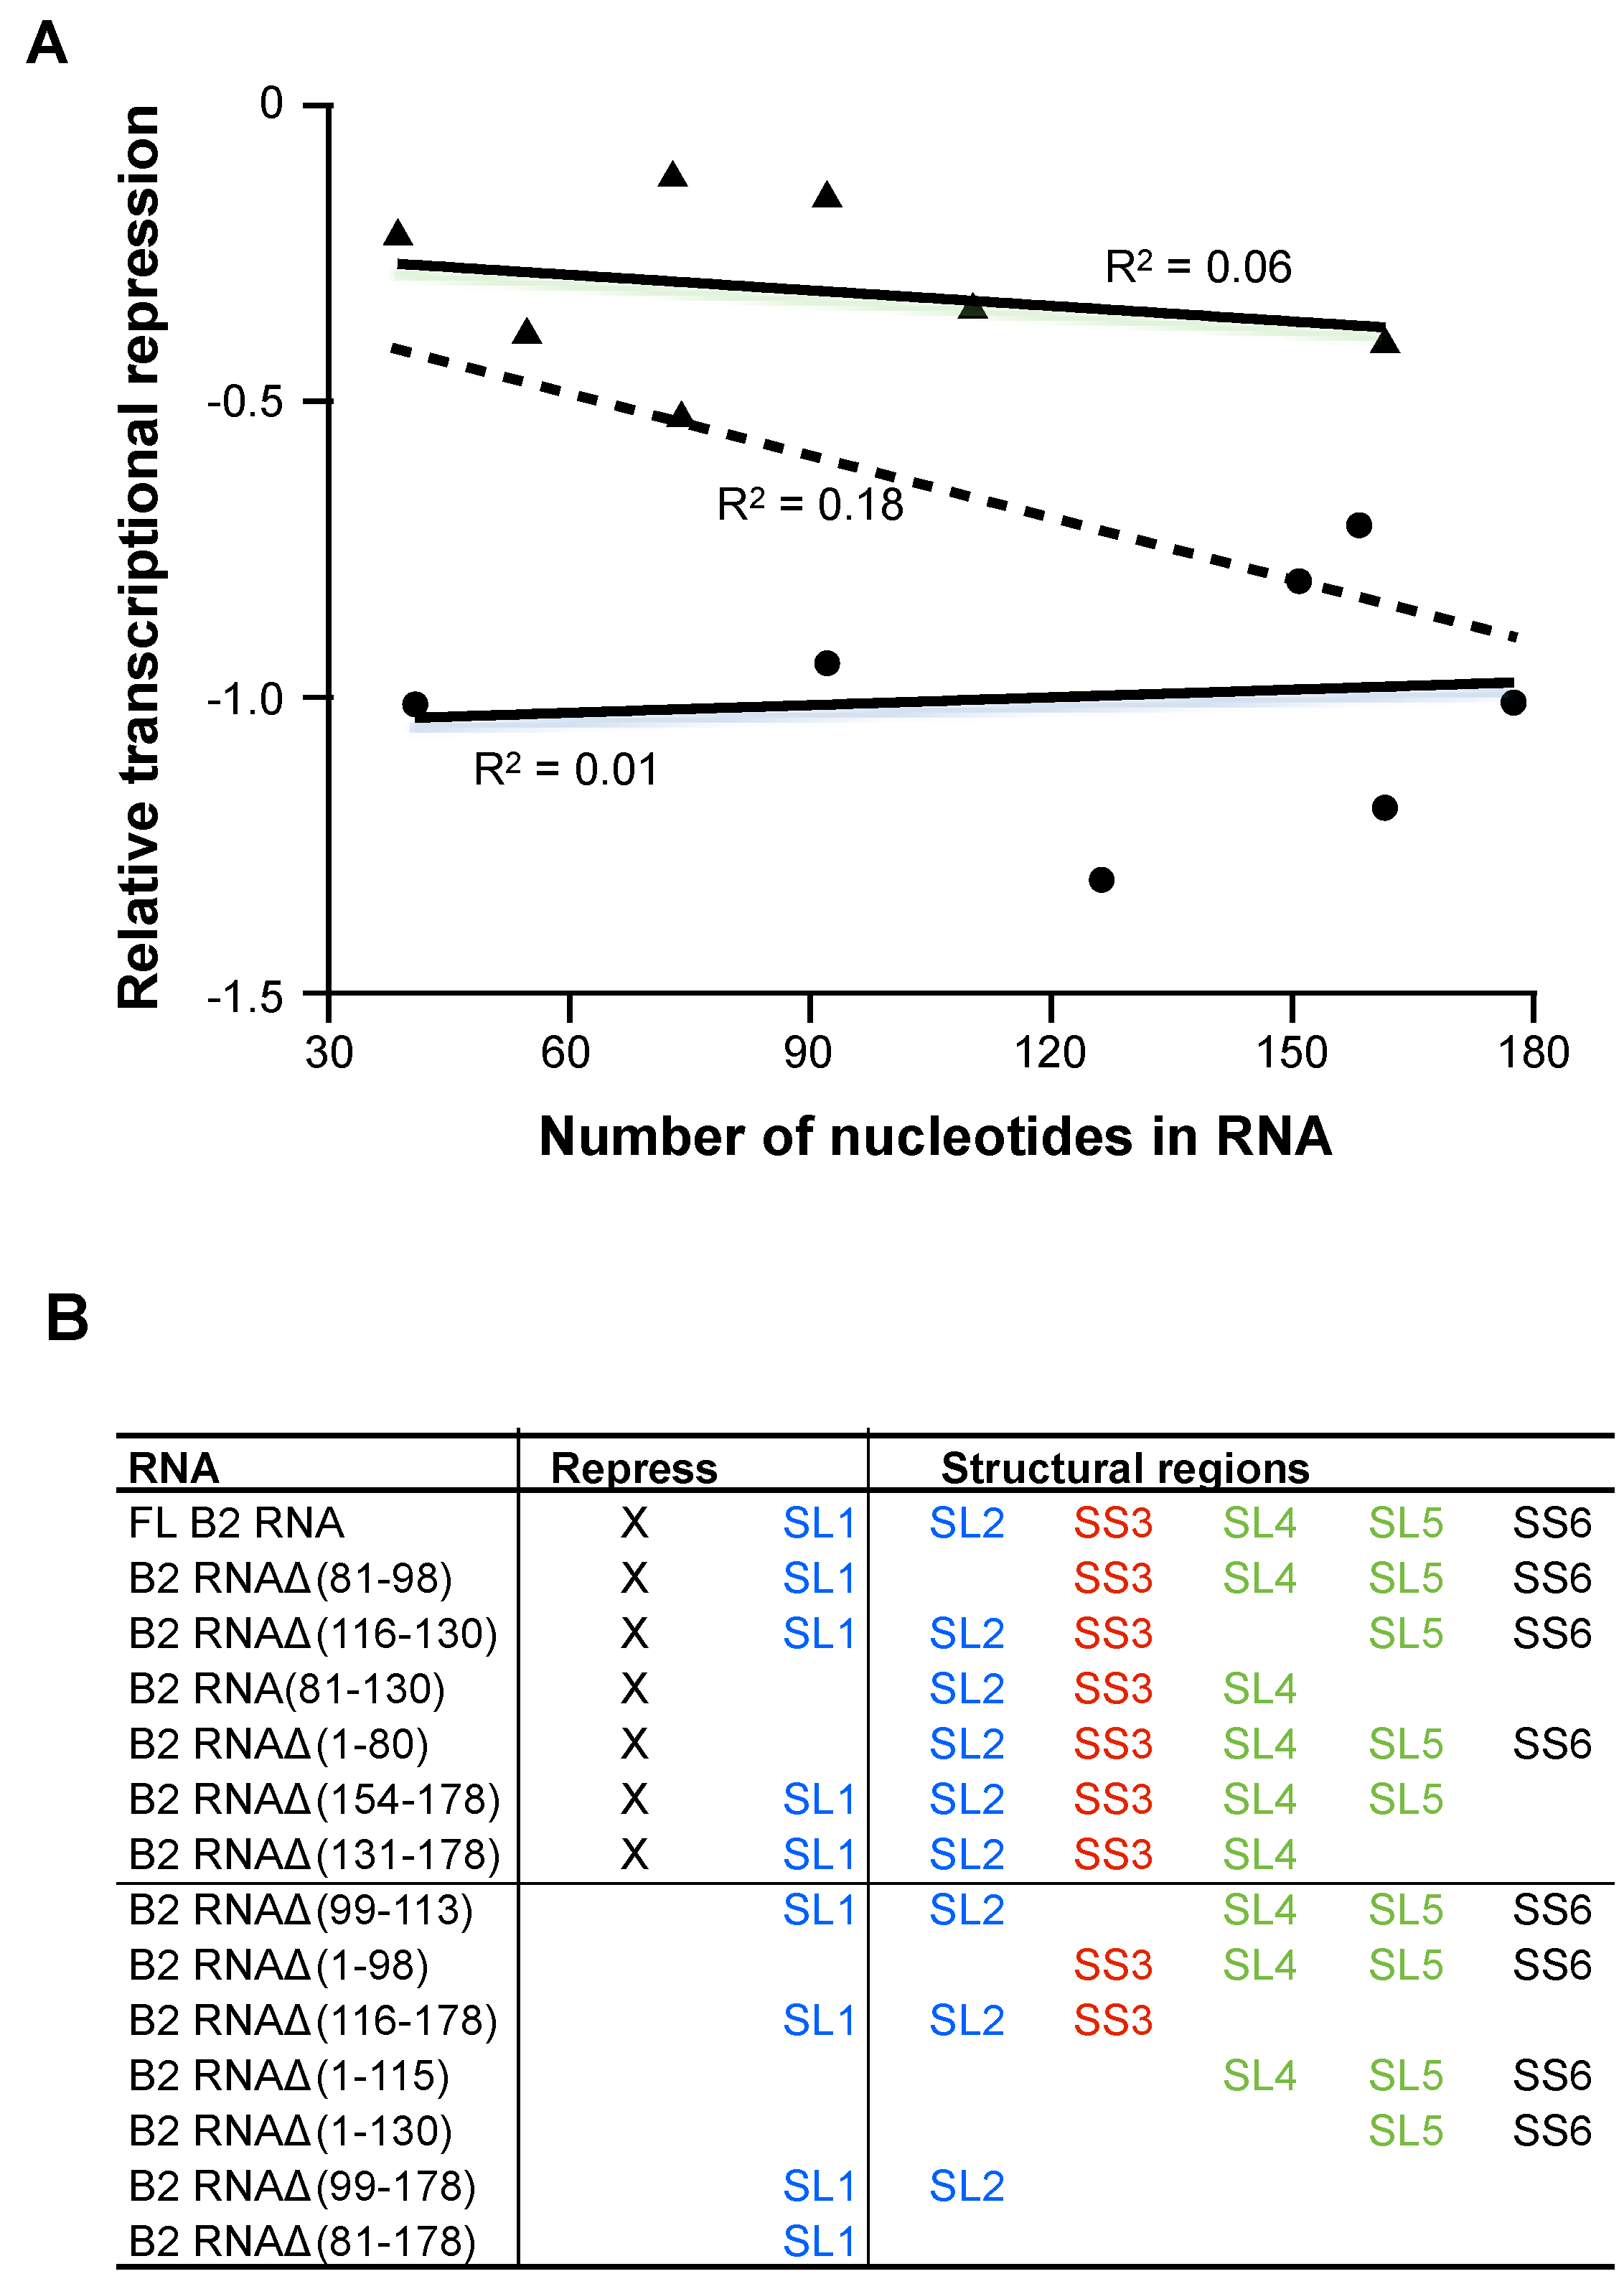
In analyzing the B2 RNA deletions for transcriptional repression, we noticed a trend that the least potent transcriptional repressor RNAs were in general shorter RNAs. Hence, we questioned whether the repressive ability of an RNA would simply correlate with its size. To evaluate this for full-length B2 RNA and each of the 13 deletion RNAs shown in
Figure 1,
Figure 2 and
Figure 3, the length of the RNA in nucleotides was plotted
versus the potency of transcriptional repression. As shown by the dashed line in
Figure 4A (fit through all 14 points), the level of transcriptional repression does not correlate with RNA size (
R2 = 0.18). We further tested this by separately considering the RNAs that potently repressed transcription (plotted as circles) and the RNAs that were impaired for transcriptional repression (plotted as triangles). In both cases there was no correlation between the level of transcriptional repression and RNA size, as shown by the two solid lines and corresponding
R2 values.
Figure 4.
Transcriptional repression does not correlate with RNA length. A) The number of nucleotides in each B2 RNA construct (full length and each of 13 deletions) was plotted against its level of transcriptional repression (relative to full length, which was set to −1). The circles represent full-length B2 RNA and deletions that showed a level of transcriptional repression that was not significantly reduced from the level of repression observed with the full-length RNA. The triangles represent RNA deletions that were significantly impaired for transcriptional repression. Fitting all of the data using linear regression resulted in an R2 value of 0.18. Fitting just the data represented by circles and triangles yielded R2 values of 0.01 and 0.06, respectively; (B) Summary of the transcriptional repression activity, the Pol II binding activity, and the patterns of structural regions in B2 RNA constructs. The stem loops in blue are interchangeable for transcriptional repression, as are the stem loops in green. The red single-stranded region is required for repression, and the black single stranded region is dispensable.
![]()

