1. Introduction
Rainbow schlieren represents an innovative visualization methodology within the domains of fluid dynamics and optical diagnostics, offering a multifaceted perspective into the underlying dynamics of gases and liquids. Originating from classical schlieren techniques, this approach integrates segmented filters comprising transparent strips of distinct hues, hence its colloquial designation. Through meticulous calibration, these filters unveil a chromatic spectrum indicative of localized density gradients within the examined medium. Dating back to Rheinberg’s [
1] seminal work in 1892, the genesis of rainbow schlieren lies in microscopy, where the differentiation of chemical elements was achieved through colored filters. Evolving from its historical roots, rainbow schlieren now stands as a formidable tool for the quantitative assessment of diverse physical parameters, including but not limited to thermodynamic properties, species concentration, and velocity profiles within aerodynamic or chemical flows. Its interdisciplinary applicability spans biomedical research, combustion dynamics, and aerospace engineering, facilitating nuanced insights into fluid dynamics through the prism of chromatic variation.
A full work on the various qualitative and quantitative techniques is presented by Settles in [
2]. The book represents the most detailed state-of-the-art on the technique to this day, although it only presents the evolution of the technique until the early 2000s, when it was published and revised. Several important papers include the creation of a shock tube [
3] for shock wave analysis, a highly appreciated comparison of three quantitative schlieren techniques belonging to Elsinga [
4] and the highly sensitive system employed by Greenberg [
5], who obtained a sensitivity comparable with that of an interferometer.
Temperatures and velocity fields were measured with other schlieren methods. A very evocative study can be found in [
6], where it is demonstrated that a classical schlieren system can simultaneously measure temperature and velocity in convective air flow. The schlieren technique used here captures average fluid temperature and velocity integrated along the test beam’s direction, making it suitable for surfaces with isothermal conditions. Temperature measurements are obtained by correlating pixel intensity in schlieren images to knife-edge positions at the system’s exit focal plane. Velocity measurements are derived from the same schlieren images using optical flow techniques that analyze motion between consecutive frames.
Another quantitative study aiming at providing simultaneous schlieren-shadowgraph visualization and temperature measurement fields of pencil soldering iron flame is found in [
7], where the authors describe the visualization of two variables in fluid flow using a complex optical system. The optical system includes an RGB LED, two knife edges with short-pass and long-pass ultra-thin filters, and a color digital camera. The study finds that shadowgraph images suffer from crosstalk effects, which are corrected. The system achieves a temperature measurement resolution of approximately one degree.
It is very common for the schlieren method to be applied in more than one of its possible configurations (background oriented, using a knife-edge or multiple color filters with different color distribution) in order to obtain information regarding the accuracy of the method and compare the results, concluding which one of the configurations better fits the described phenomena. This principle is used in the study provided by Hargather and Settles, found in [
8], where the Schardin method [
9] is compared to the results obtained through the “rainbow method” (thoroughly described by [
10]) and background-oriented schlieren [
11]. The phenomenon analyzed by [
8] is a laminar free-convection flat plate boundary layer. The study found that the Schardin method provides reliable data, as well as the BOS method, while the rainbow cutoff filter presents multiple drawbacks, including the production of the filter, while presenting little significant benefit over the calibrated schlieren technique. Other studies apply the rainbow schlieren method to perfume measurements on nanofluid-based heat transfer under a natural convection regime [
12], study the under-expanded sonic jets with Mach disks [
13], or address post-processing algorithms, such as in [
14], where a post-processing algorithm is developed starting from the deconvolution algorithm for axisymmetric refractive index fields, using the inverse Abel transformation. This algorithm can be used for experimental rainbow schlieren deflectometry (RSD) data.
The study case presented in this paper uses the graded color filter created on the col-or-distribution equations introduced by Elsinga in [
4], found in [
1,
2,
3]. An important observation has to be considered in the case of a calibrated graded filter: Theoretically, the sensitivity of the schlieren system increases with the size of the filter used. This paper aims to provide data regarding the practical aspect of the aforementioned assumption and underlines the limitations of a physically implemented system. A comparison is made between two filters with the same color distribution but of different dimensions.
There are many papers hypothesizing the influence and trade-offs of the color filter’s dimensions on the schlieren system’s general sensitivity; yet, to the authors’ knowledge, none present a comparison between filters with identical structure and obtained through the same manufacturing method, but of different sizes, implemented into the same experimental configuration, rendering quantitative data related to the same studied phenomenon.
The filters are used in taking schlieren images of the same phenomenon, a turbulent round jet, formed out of water vapors, resulting from a
combustion reaction. This jet is generated by a 1 N micro-thruster used on micro satellites for altitude control. More information about the jet analyzed here can be found in [
15]. The quantitative results obtained with the narrower filter model were first discussed in [
16]. The present paper adds data for a filter having a larger size and presents both data sets in comparison to each other.
The article’s originality stems from comparing data series across both filter dimensions. It explores the balance between spatial resolution and calibration times, along with the qualitative aspects of the images. In contrast to the reference paper [
16], which aimed at evaluating the accuracy of the color filter against a CFD simulation, this study is more focused on identifying optimal filter characteristics, offering valuable insights into filter design.
2. Experimental Considerations
The color filters compared here have the following dimensions: The narrower filter can be found in [
17] and its dimensions are 5 mm × 5 mm, while the new larger filter’s dimensions are 12 mm × 12 mm. Both filters use the same equations for the propagation of colors as the ones dictated by Elsinga in [
4]. These equations include the x and y variables, which are chosen as the rows and, respectively, columns of a matrix. The color distribution equations describe the RGB space (red-green-blue) and are found in [
4,
17].
The general sensitivities depend on the characteristics of the schlieren system and the dimensions of the filter, resulting in 0.35% and 0.80%, with the higher percentage belonging to the larger filter.
As specified by numerous papers, including the ones mentioned earlier, which are considered here as reference papers, a larger filter can lead to an increased sensitivity but, at the same time, drastically increases the calibration times. The reference paper [
16] presents the application of the concept established by Elsinga in [
4], applied to a 3D flow. As anticipated, the analysis concludes that the data are relevant only on a small portion of the studied 3D jet, while in the original study [
4] presents significant data on the entire visualization area of the 2D phenomenon.
The calibration process is achieved through a pixel-by-pixel manner, meaning that for each position of the filter on the light source, a new pixel value is registered. The filter is translated to the fixed light source image position until the full filter image is recorded in the calibration images. Calibration curves are extracted for each pixel. The calculation methodology is detailed in [
4] and implemented in [
16], where the experimental setup involved a small square light source (1
). Due to the calibration process, a significantly larger filter, which the literature suggests would yield more precise interpretations, would prove challenging to calibrate. The pixel calibration curves would encompass as many points as the grid formed by physically moving the filter against the fixed image of the source, created at the focal point of the second mirror, in a z-type configuration schlieren system [
16], can yield. For instance, for a 30 mm × 30 mm filter, a single pixel calibration curve would entail 900 calibration points, relative to a 1
light source.
The equations describing the propagation of the color gradient on both filters are found in (1)–(3).
In order to compare the results of the experimental campaigns using different sized filters, identical experimental conditions and phenomenon had to be provided. The phenomena analyzed in both cases is embodied by a hot, round turbulent jet (RTJ), formed by water vapors resulting from a
reaction. It is used for altitude control in small satellites. It is enclosed in a cylindrical vacuum chamber with three transparent windows, two of which are placed in a parallel manner, allowing Z-type schlieren analysis. The experimental facility also includes physical sensors, such as a force transducer and a thermocouple introduced into the RTJ. A more detailed description of the studied jet and its testing facility is presented in [
17].
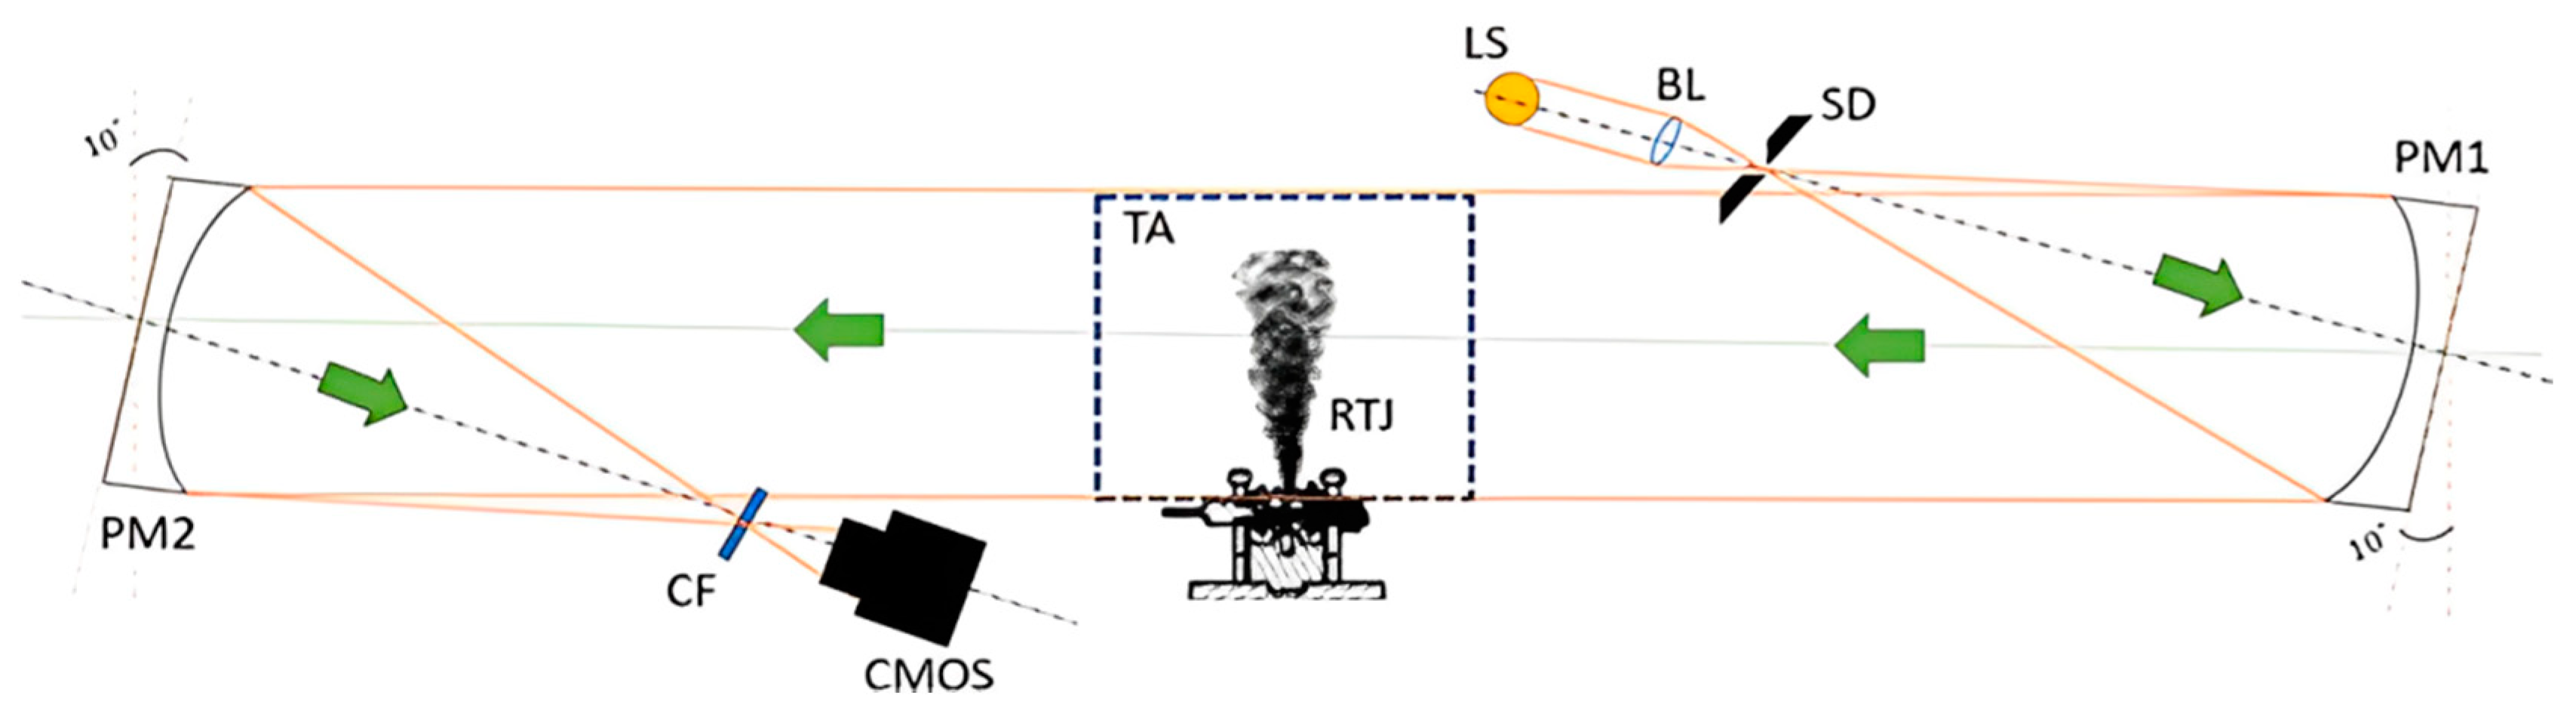
An important factor has been shown to be the image of the light source. As previously mentioned, the image of the light source needs to be square in order to provide data from the entire surface of the filter in the calibration process. It is important to note that the size of the source’s image plays an important role in the determination of overall system sensitivity. A brief diagram of the experimental setup is presented below in
Figure 1. The present configuration includes two twin parabolic mirrors with a diameter of 25.4 mm from Edmund Optics, a light source (LS-W1), the custom color filter, and a CMOS camera (Phantom Veo 710L, Company Ametek, Carrollton, TX, USA).
During the experimentation phase, identical schlieren system properties are applied to both filters. The images captured under these conditions are subsequently compared, as illustrated in
Figure 2. The calibrated filter follows a gradual propagation law, facilitating calibration and simplifying the extraction of quantitative data. However, from a qualitative perspective, the resulting images are inferior to those produced by segmented or step filters, where color transitions between adjacent pixels are more pronounced.
After calibration, the linearity of the color propagation law is analyzed. Calibration usually fixes any material errors arising from the filter manufacturing method, such as certain differences in shade, etc. However, in this case, the coefficients of the calibration function are calculated with the same equation, applying the least squares method.
3. Results and Discussion
The results for both filters are evaluated along the A line, which is positioned perpendicular to the jet’s centerline. Graphical representations of the positions of the measurement lines for both filters are shown in
Figure 3.
Figure 4 shows the density profiles along the A lines depicted in
Figure 3 for both filters, as well as a CFD simulation. However, the CFD simulation is not directly relevant to the conclusions of this paper since it employs the RANS model, whereas the schlieren method is path-integrated. The CFD simulation is included only to compare the expected density evolution trend with the experimentally obtained results. The density variation curve has a smoother profile in the case of the larger filter and presents a different value for the point found on the jet’s central axis due to the increased sensitivity of the larger color filter, when compared to the initial one of smaller dimensions.
Figure 5 presents both density profiles found along the jet’s center line. The larger filter presents more measuring points due to its dimensions, which allow the measurement of slightly larger deflection angles, causing the light to fall within the filter’s perimeter and avoiding ray blockage by the filter’s frame. This is why the larger filter images contain only a color distribution, while the images for the smaller filter contain dark pixels, as exemplified in
Figure 3, which need to be removed from the analysis as they represent a source of error. The graph depicting the larger filter in
Figure 4 exhibits a reduced mid-ordinate in its curve, displaying a smoother bell-shaped distribution more closely resembling that of the CFD simulation. Notably, it appears akin to a translated rendition of the CFD curve along the x-axis of the graphical representation. As anticipated, the increased quantity of data points comprising the curve results in an enhanced resolution, consequently refining the profile of the density curve.
The variations in the density distribution along the central axis of the jet arise from differences attributable to the number of measurement points. However, it is noteworthy that a similar pattern of translation is observed when juxtaposed with the CFD case.
In conclusion, the present article discusses the size of the color-calibrated filter imZplemented into a schlieren system and discusses its influence on the qualitative and quantitative characteristics of the resulting images.
4. Conclusions and Future Work
From the present study, one can conclude that the size of the schlieren filter is crucial to the end result and should be calculated beforehand. The sensitivity required for color-calibrated schlieren methods depends on various system variables, making it challenging to measure turbulent jets due to unpredictable density profiles and deflection angles. High or low deflection angles can result in bright or dark pixels, complicating quantitative analysis.
Few studies use color-calibrated schlieren for 3D turbulent flows, and none thoroughly analyze the filter size’s influence. This study finds significant differences between 5 mm × 5 mm and 12 mm × 12 mm filters. Smaller filters offer better contrast but may create dark areas, while larger filters require longer calibration times but generate more significant measuring points. An optimized and automated calibration system could significantly reduce the calibration times.
Regarding the qualitative findings, this study reveals that the smaller filter has a greater visual impact, allowing deflection angles exceeding the filter size to be visible.
Future work envisions the development of a calibration system that can provide an automated displacement of the filter on the light source image linked to a high-speed camera trigger for recording on-the-spot images and eliminate manual recording and human errors, which can lead to longer calibration times. This automated calibration process would also improve the filter positioning accuracy. DNS or LES, and physical sensors for system validation, enhance the analysis of turbulent flows.


